Demand destruction because prices are too high after the 50% price explosion during the pandemic.
By Wolf Richter for WOLF STREET.
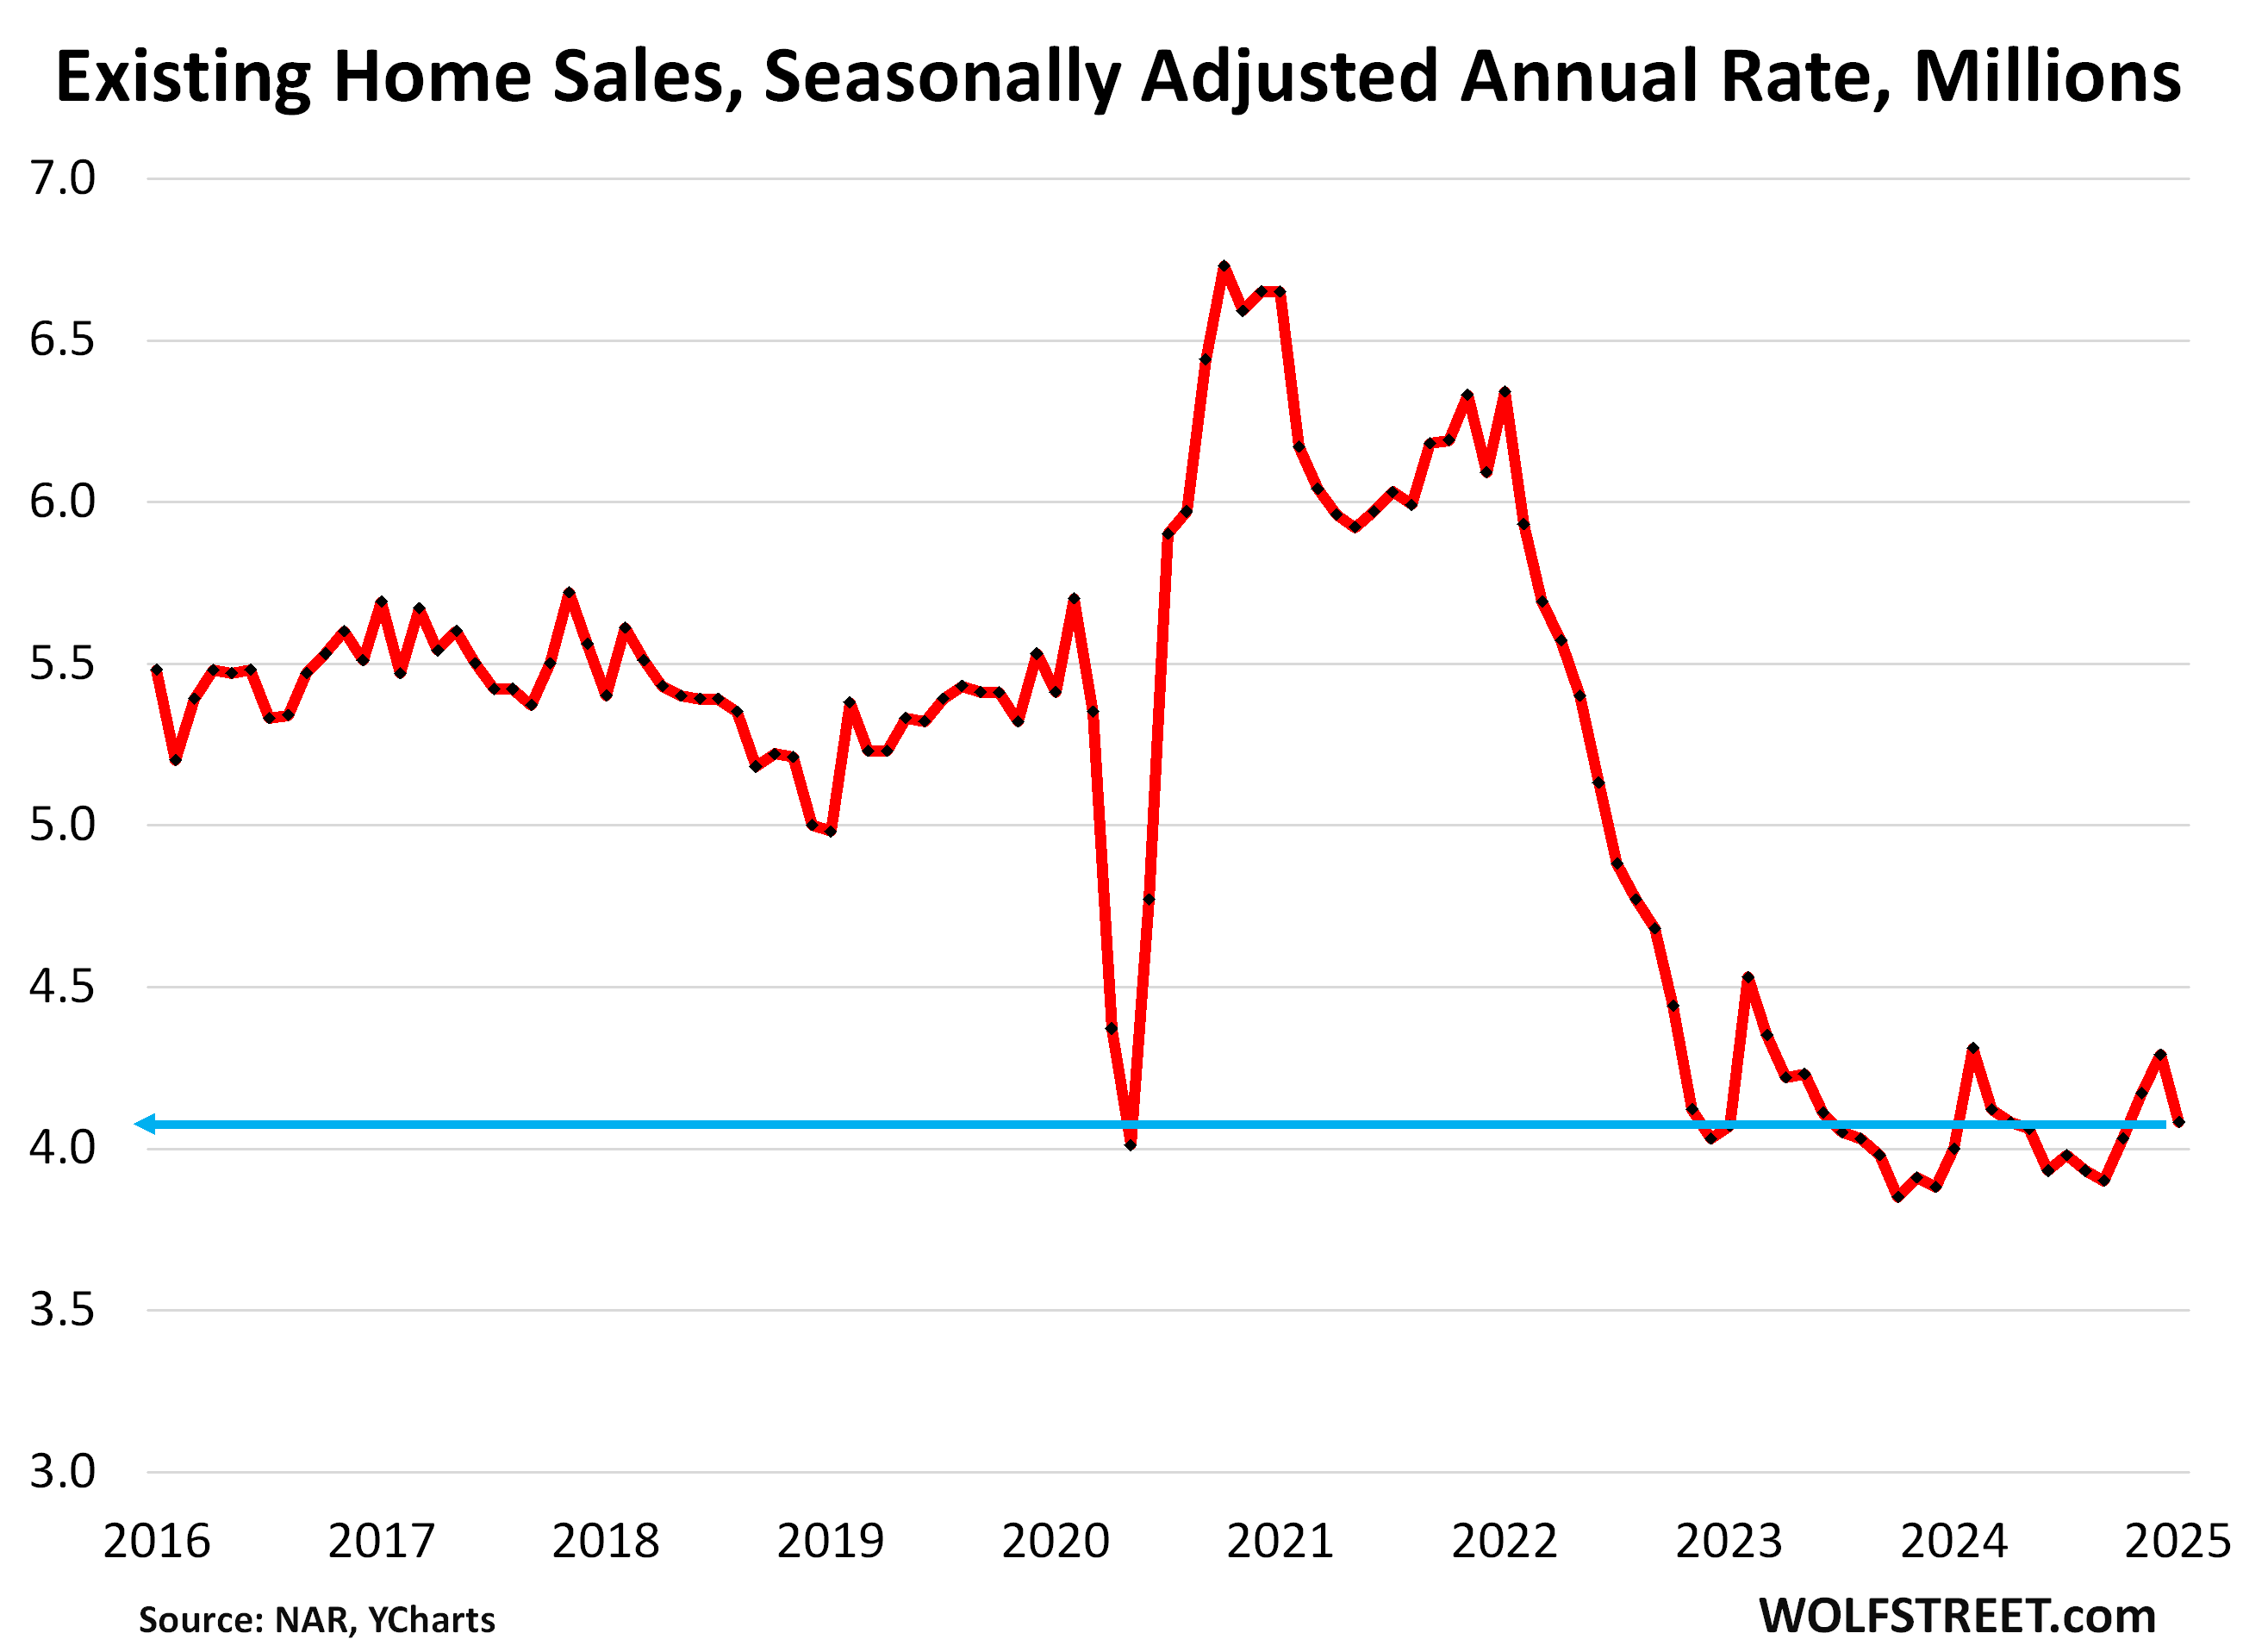
Demand in the resale market just keeps getting crushed after every little sign of green shoots. Sales of existing single-family houses, townhouses, condos, and co-ops that closed in January dropped by 4.9% from December, seasonally adjusted, to an annual rate of 4.08 million sales, according to the National Association of Realtors today.
This rate of sales was up just 2.0% from the abysmally low levels a year ago – 2024 as a whole had been the worst sales year since 1995 – and flat with the abysmally low levels two years ago.
Compared to January 2021, the sales rate was down by 36%, compared to January 2019, the sales rate was down by 25% (historical data from YCharts):
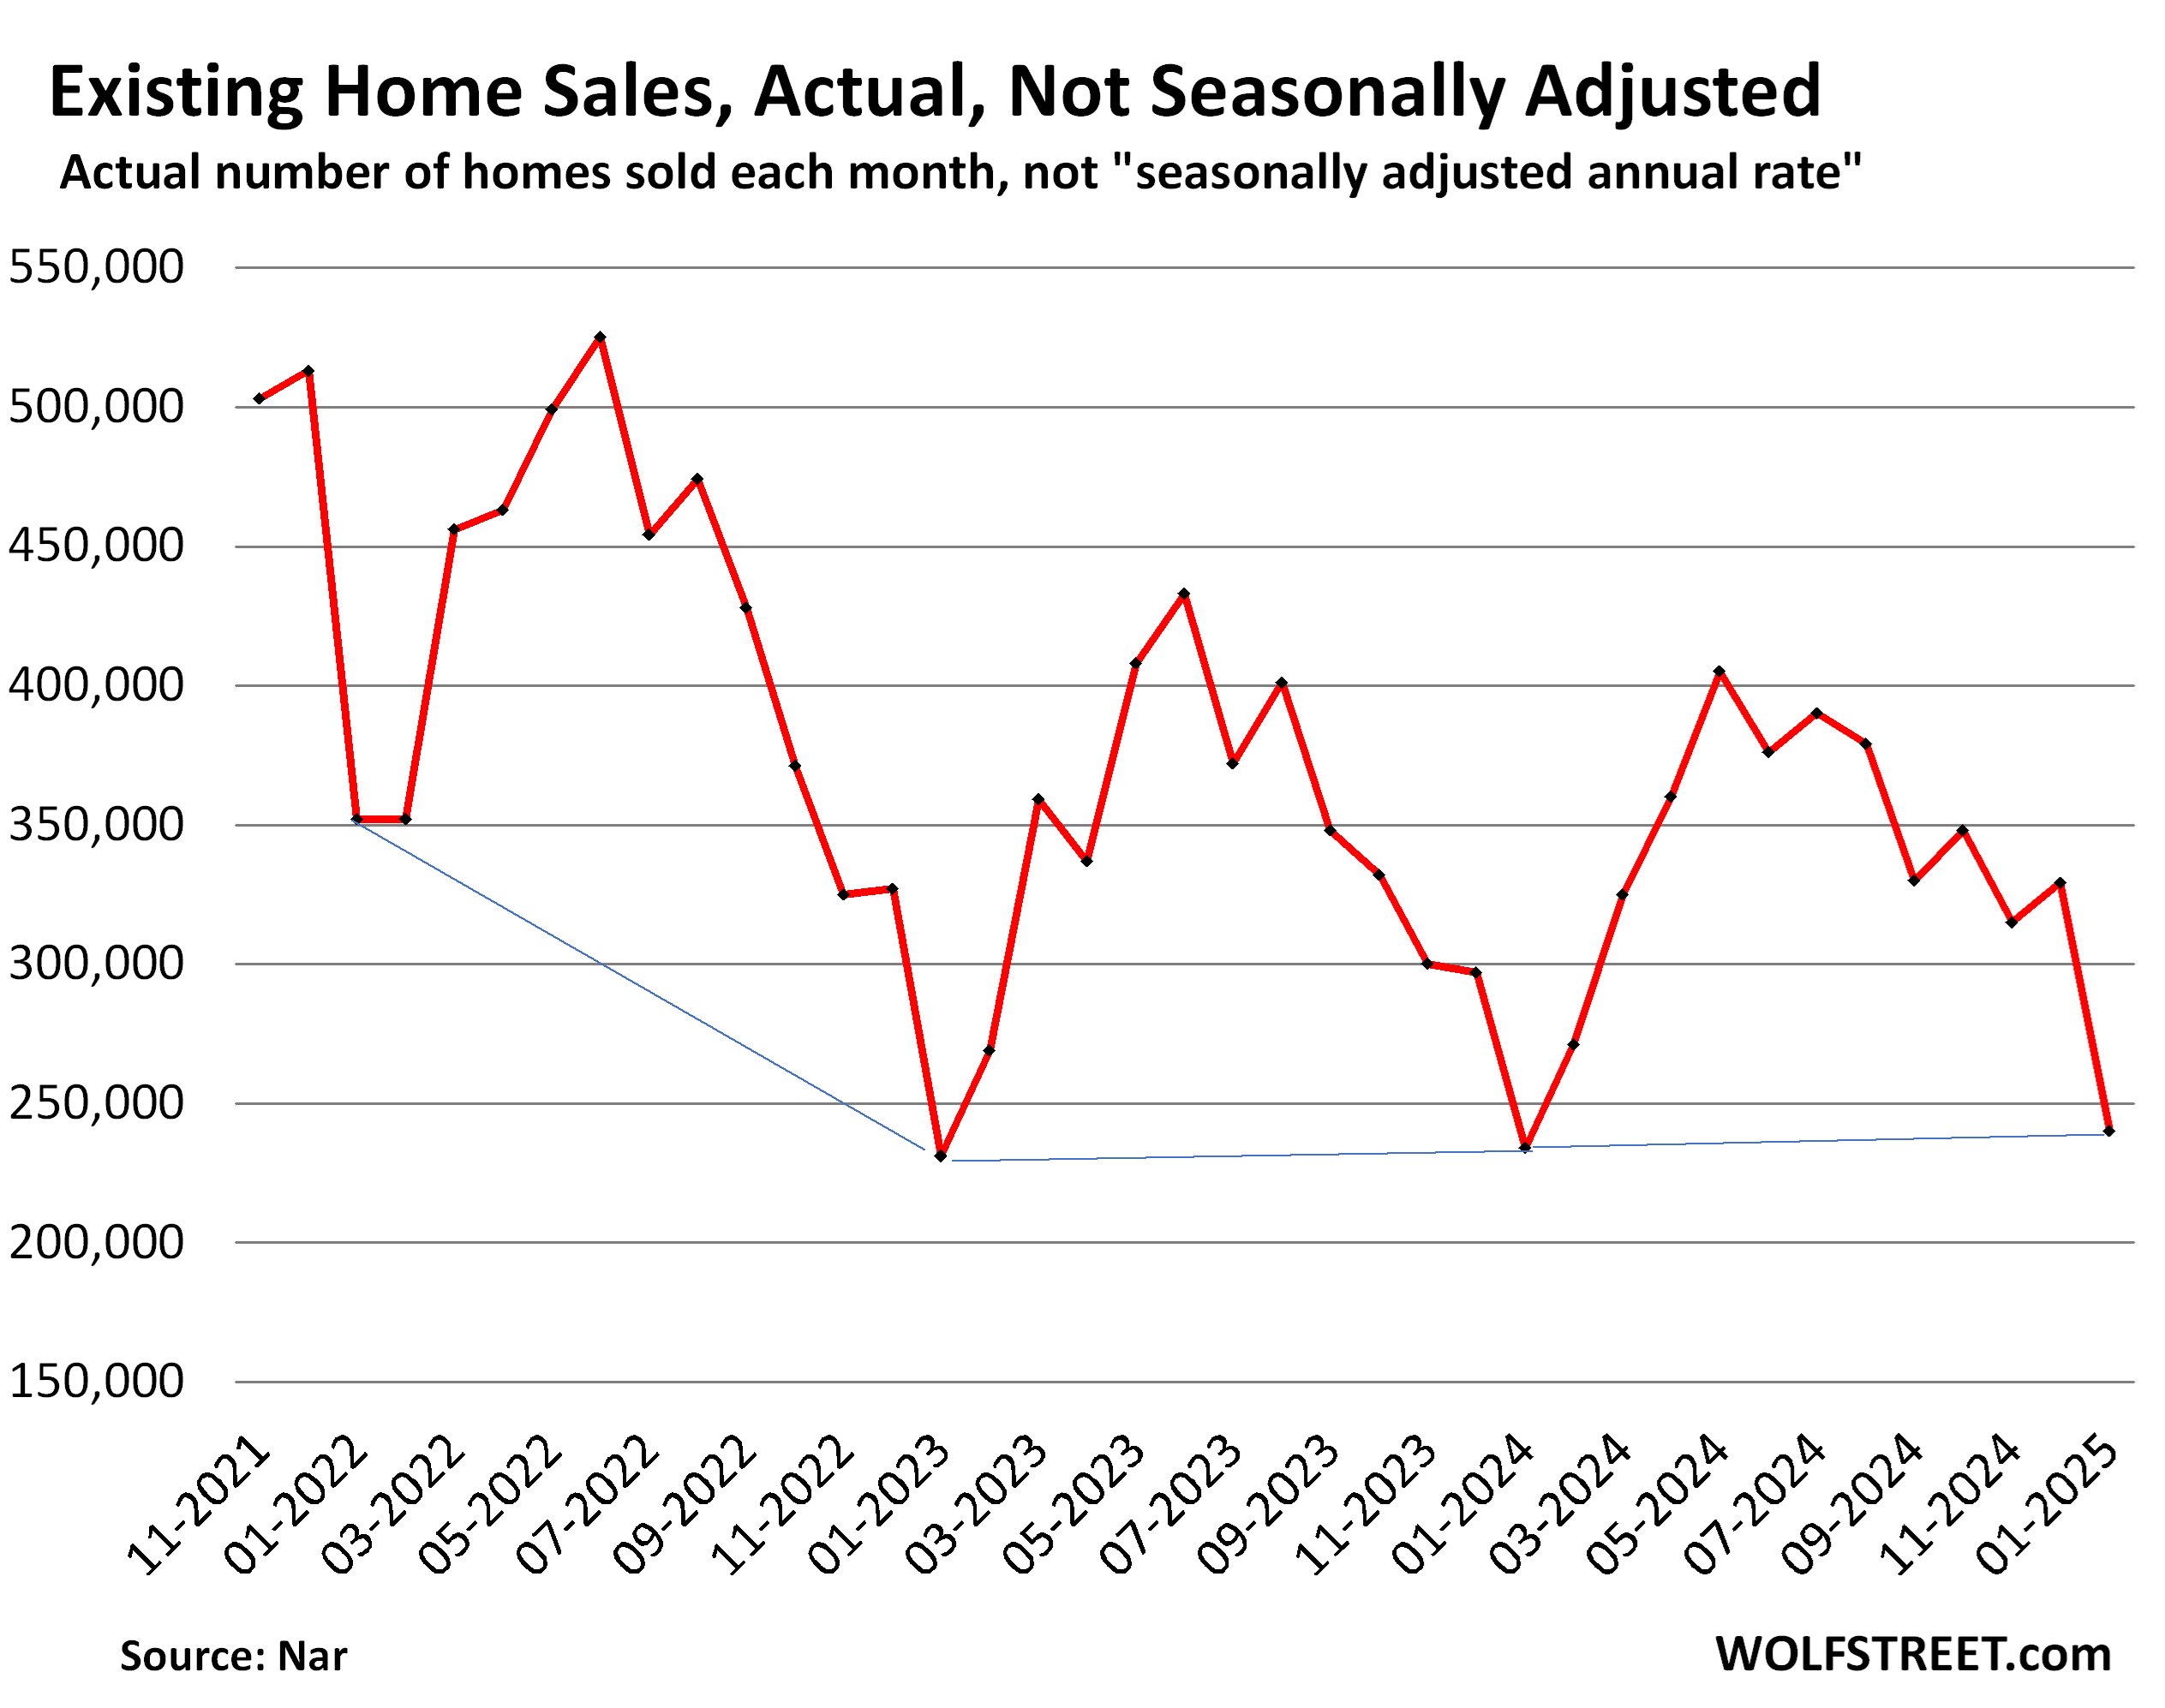
Actual sales, not seasonally adjusted and not annual rate, at 240,000 in January, were up by 2.6% from the abysmally low levels a year ago, and down by 31% from January 2022. The blue lines connect the Januarys.
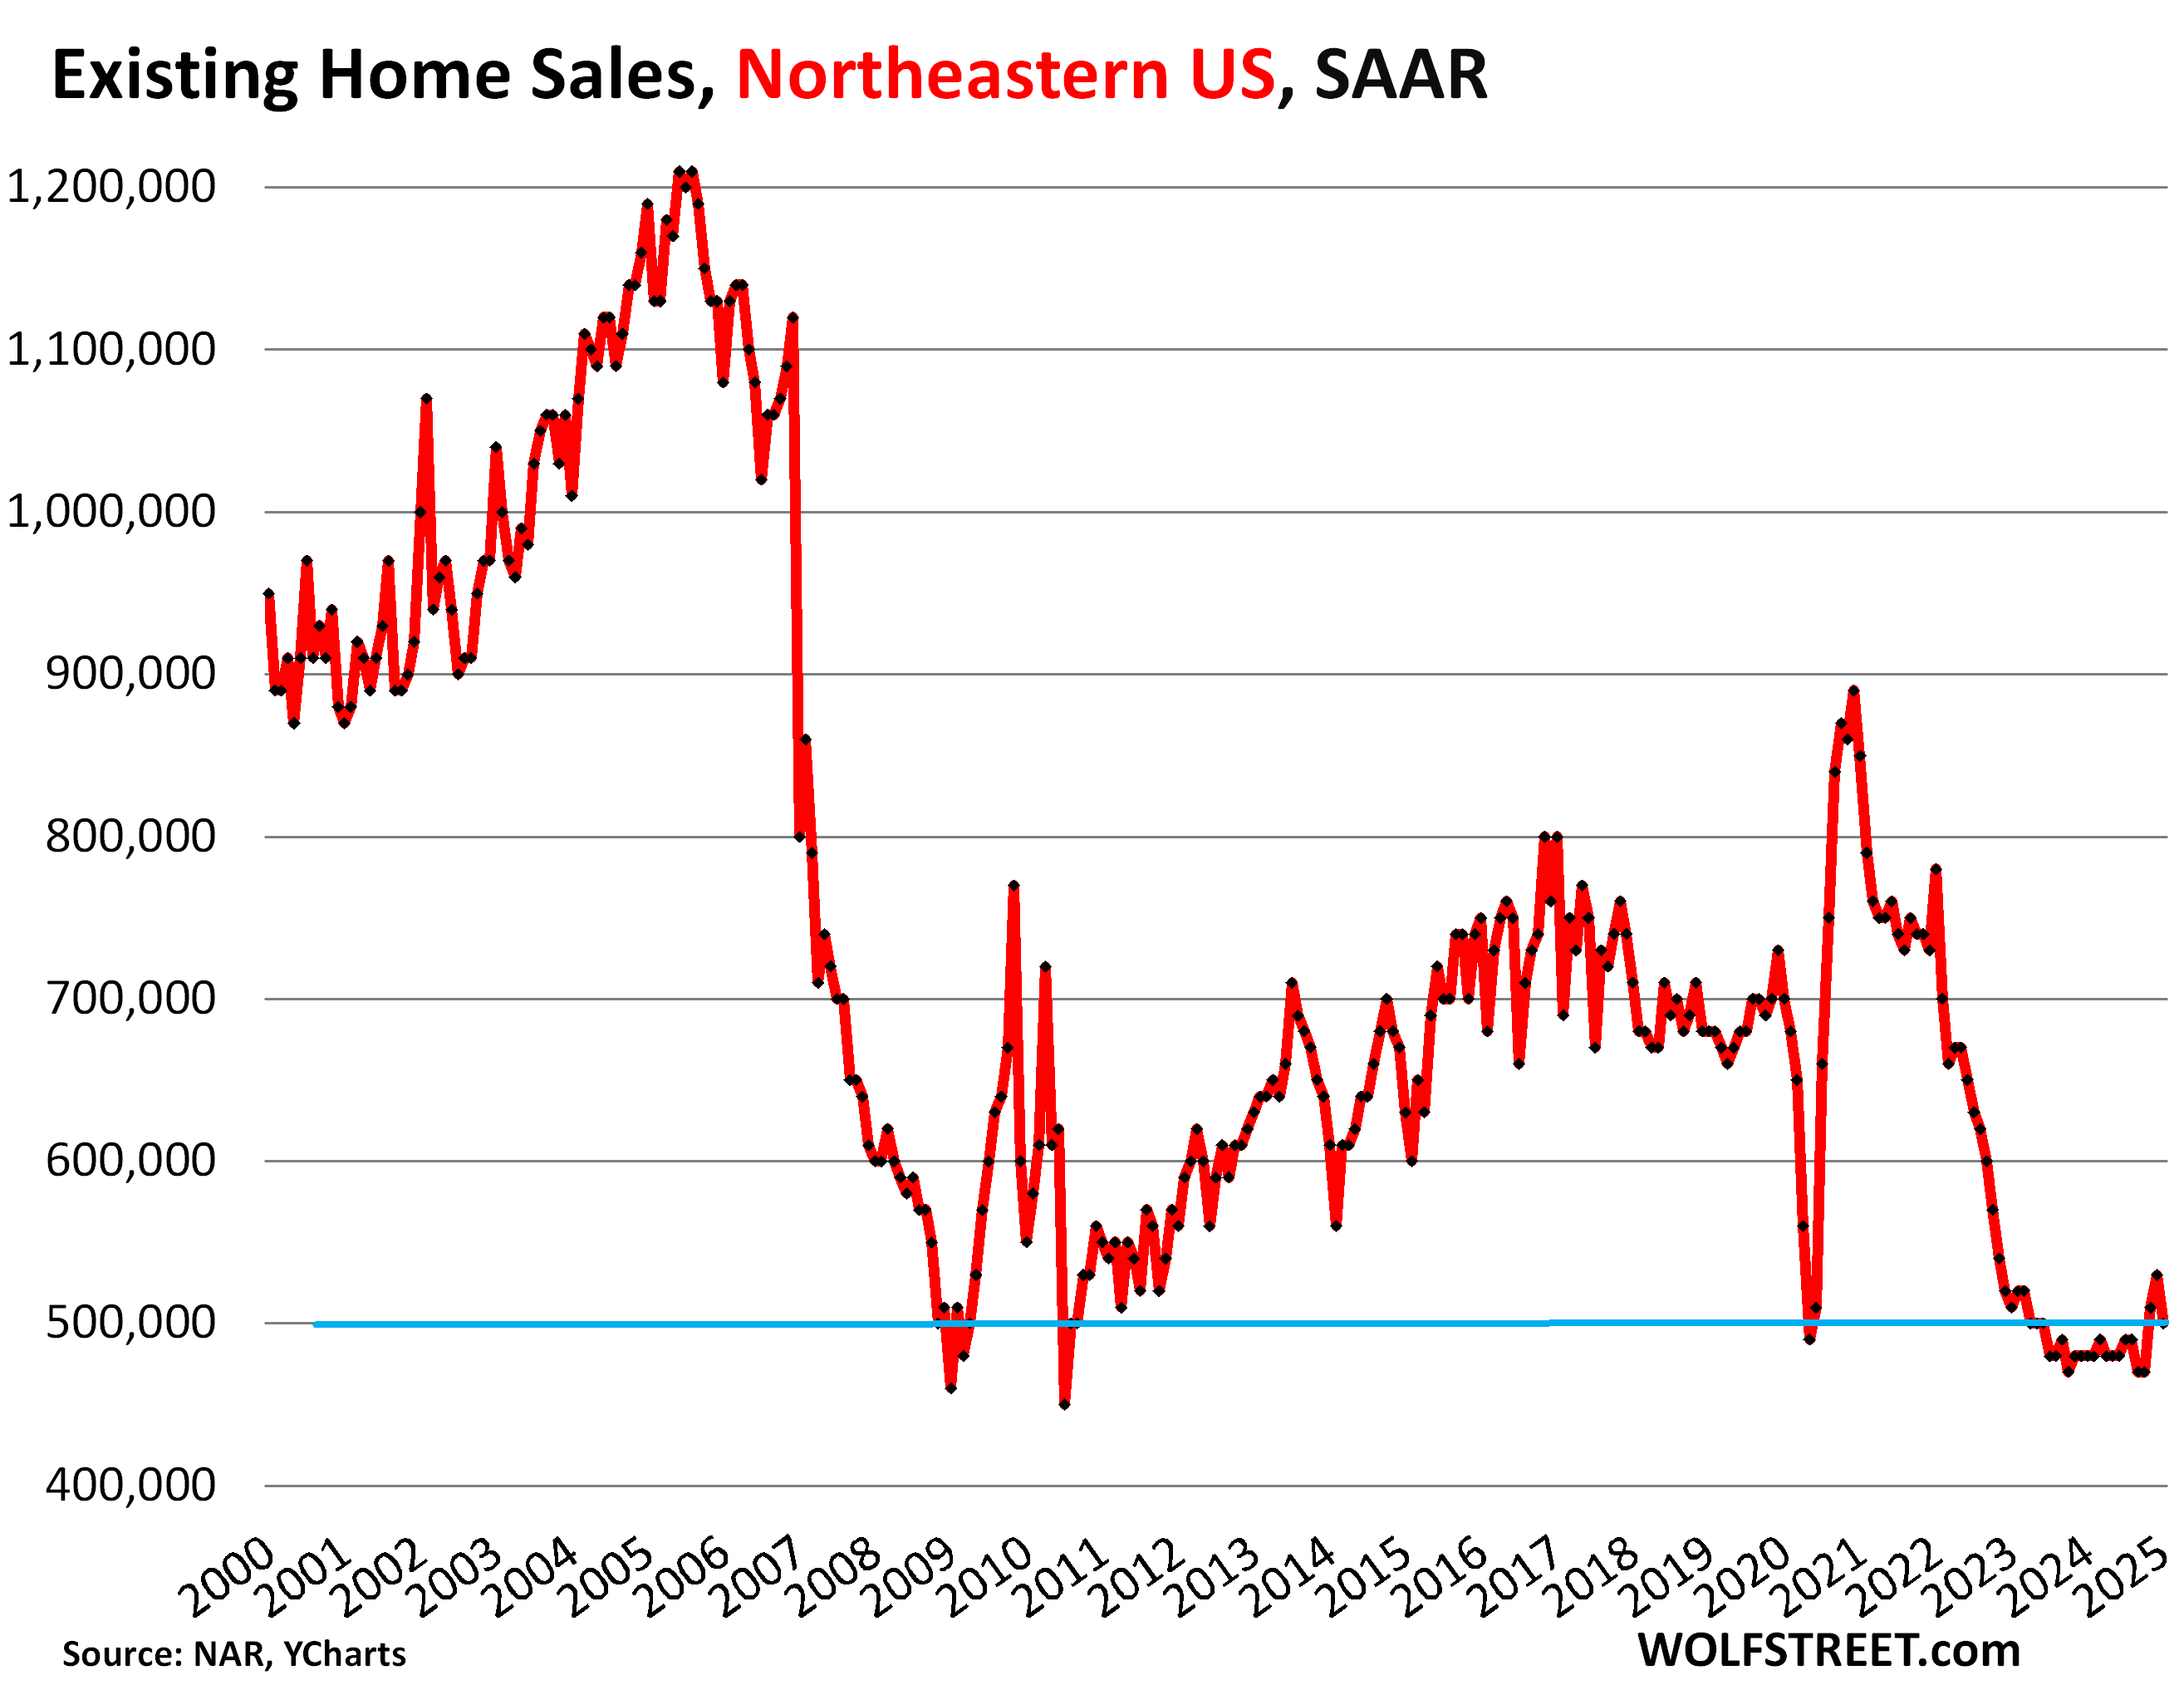
Demand destruction by region.
The charts below show the seasonally adjusted annual rate of sales (SAAR) in the four Census Regions of the US. A map of the four regions is in the comments below the article.
Northeastern US: The seasonally adjusted annual rate of sales fell to 500,000 homes:
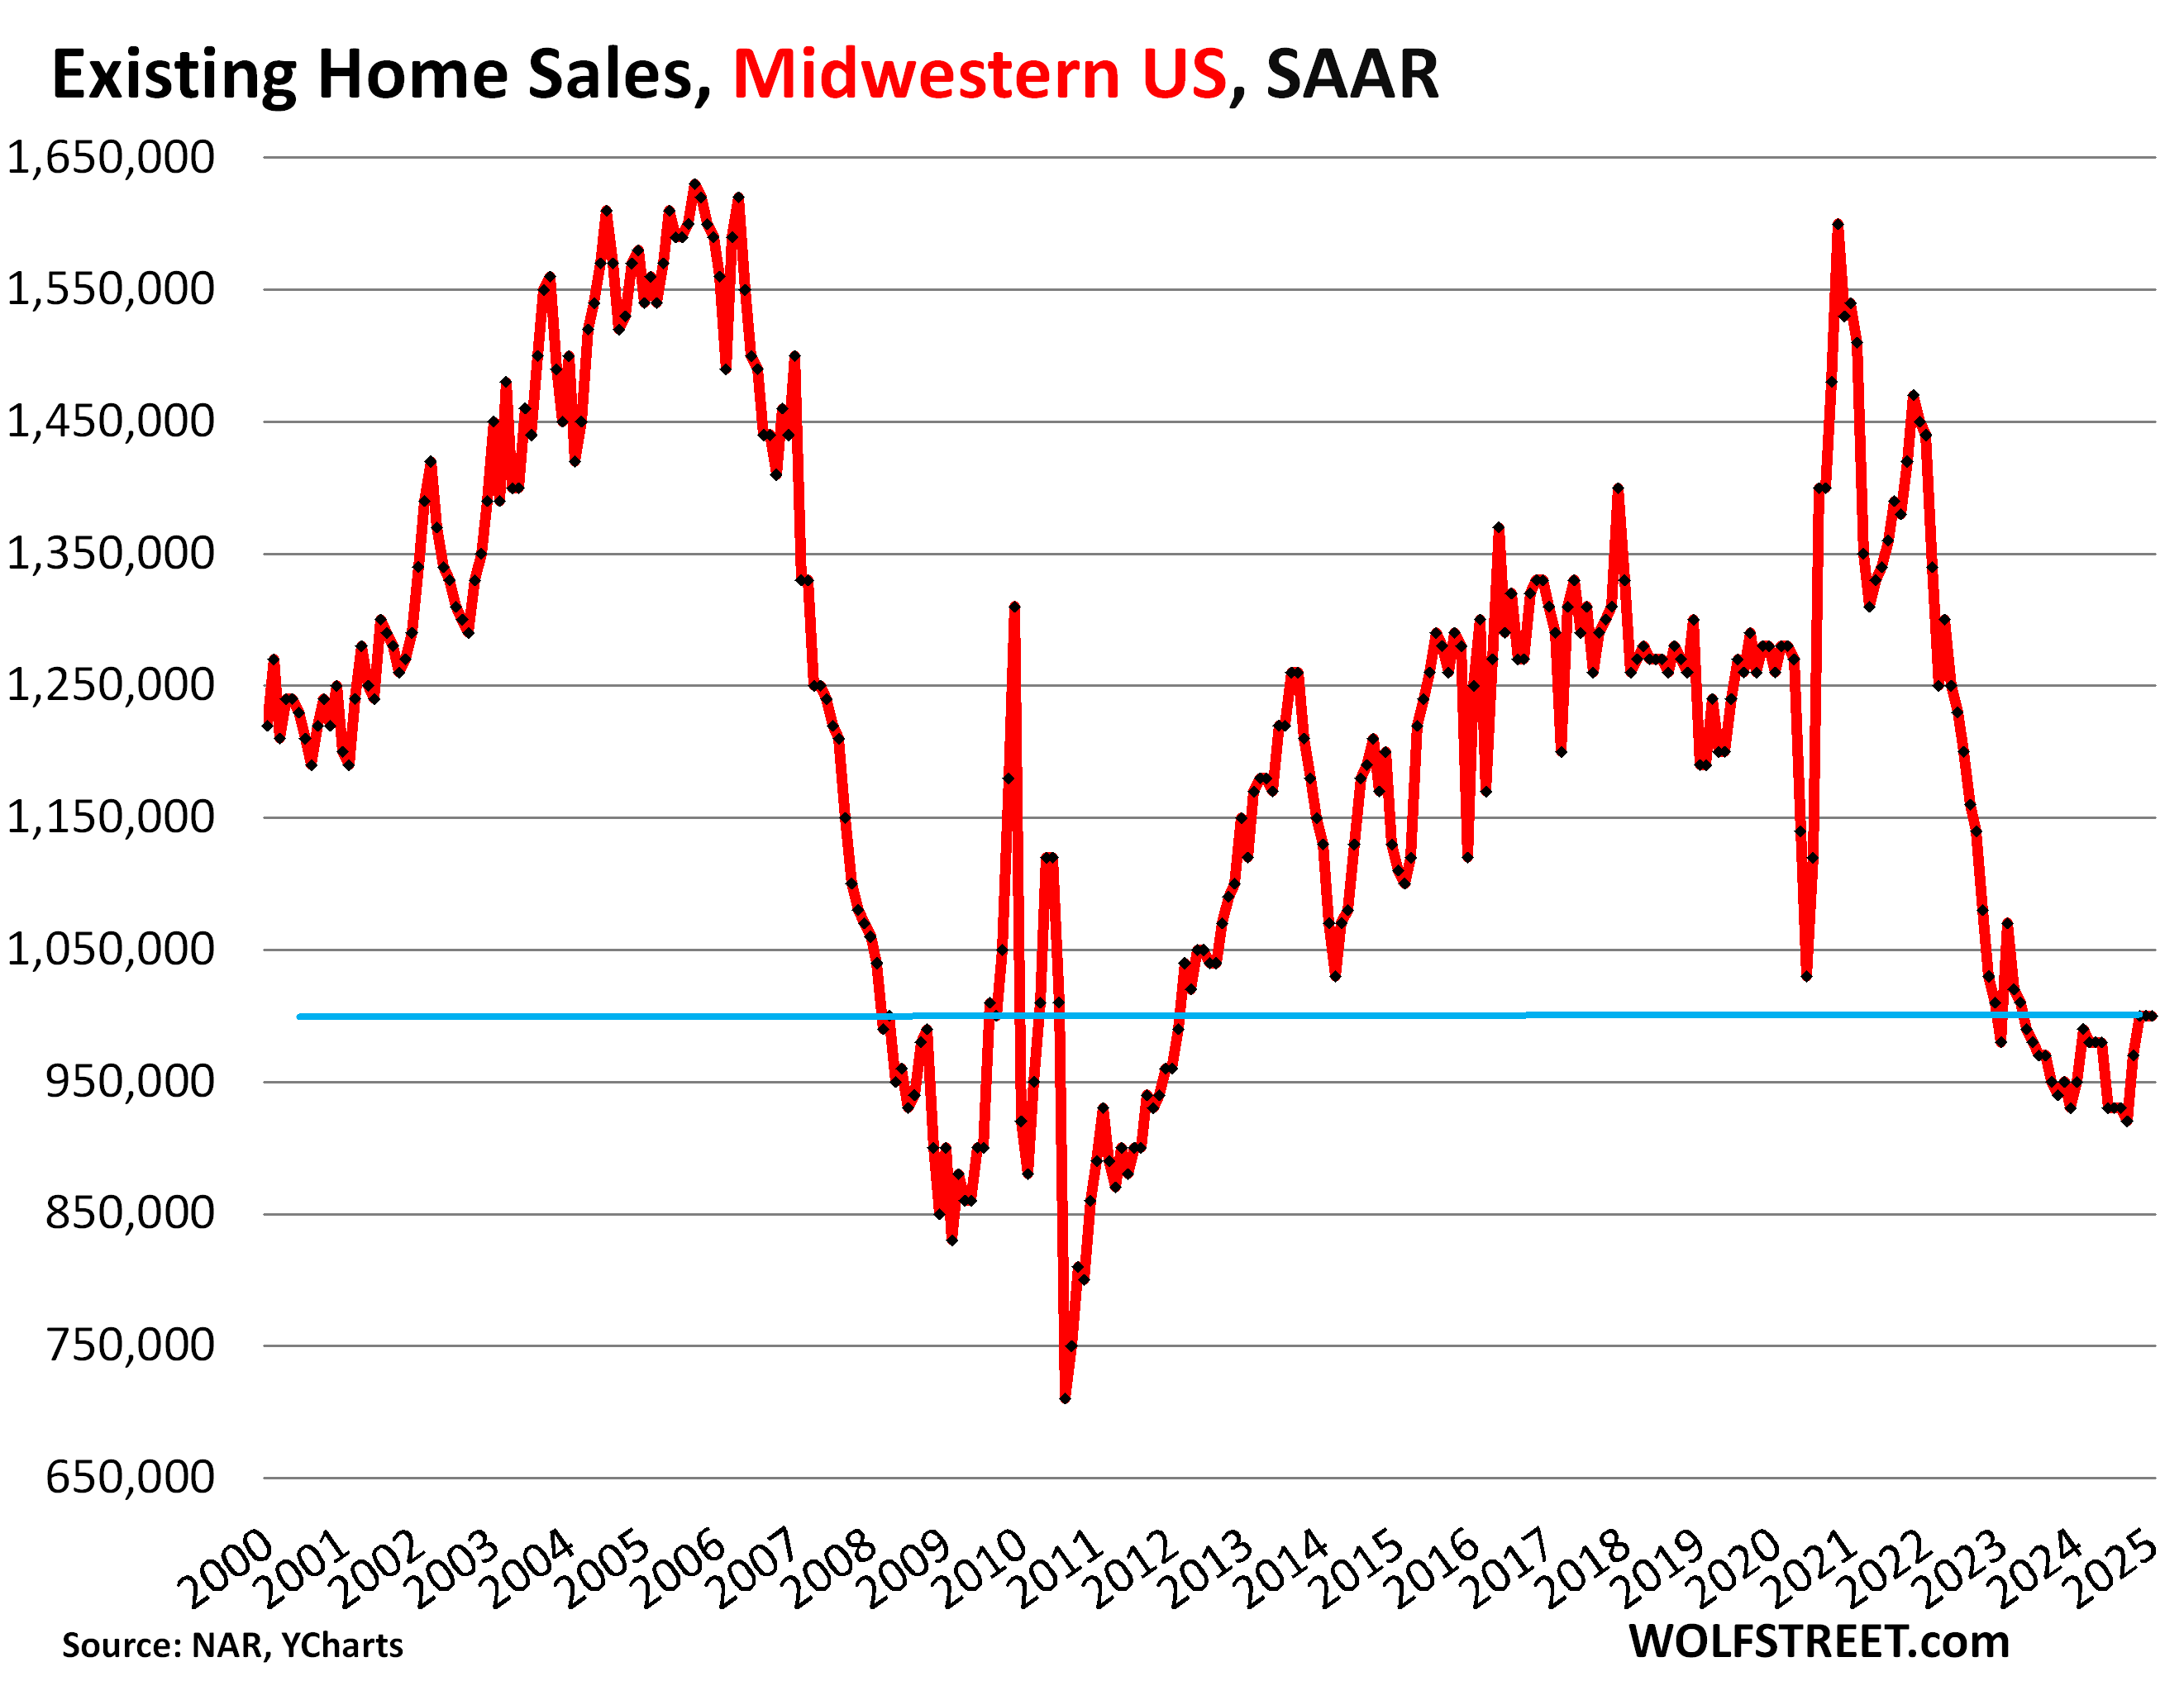
Midwestern US: The seasonally adjusted annual rate of sales remained at 1,000,000 homes.
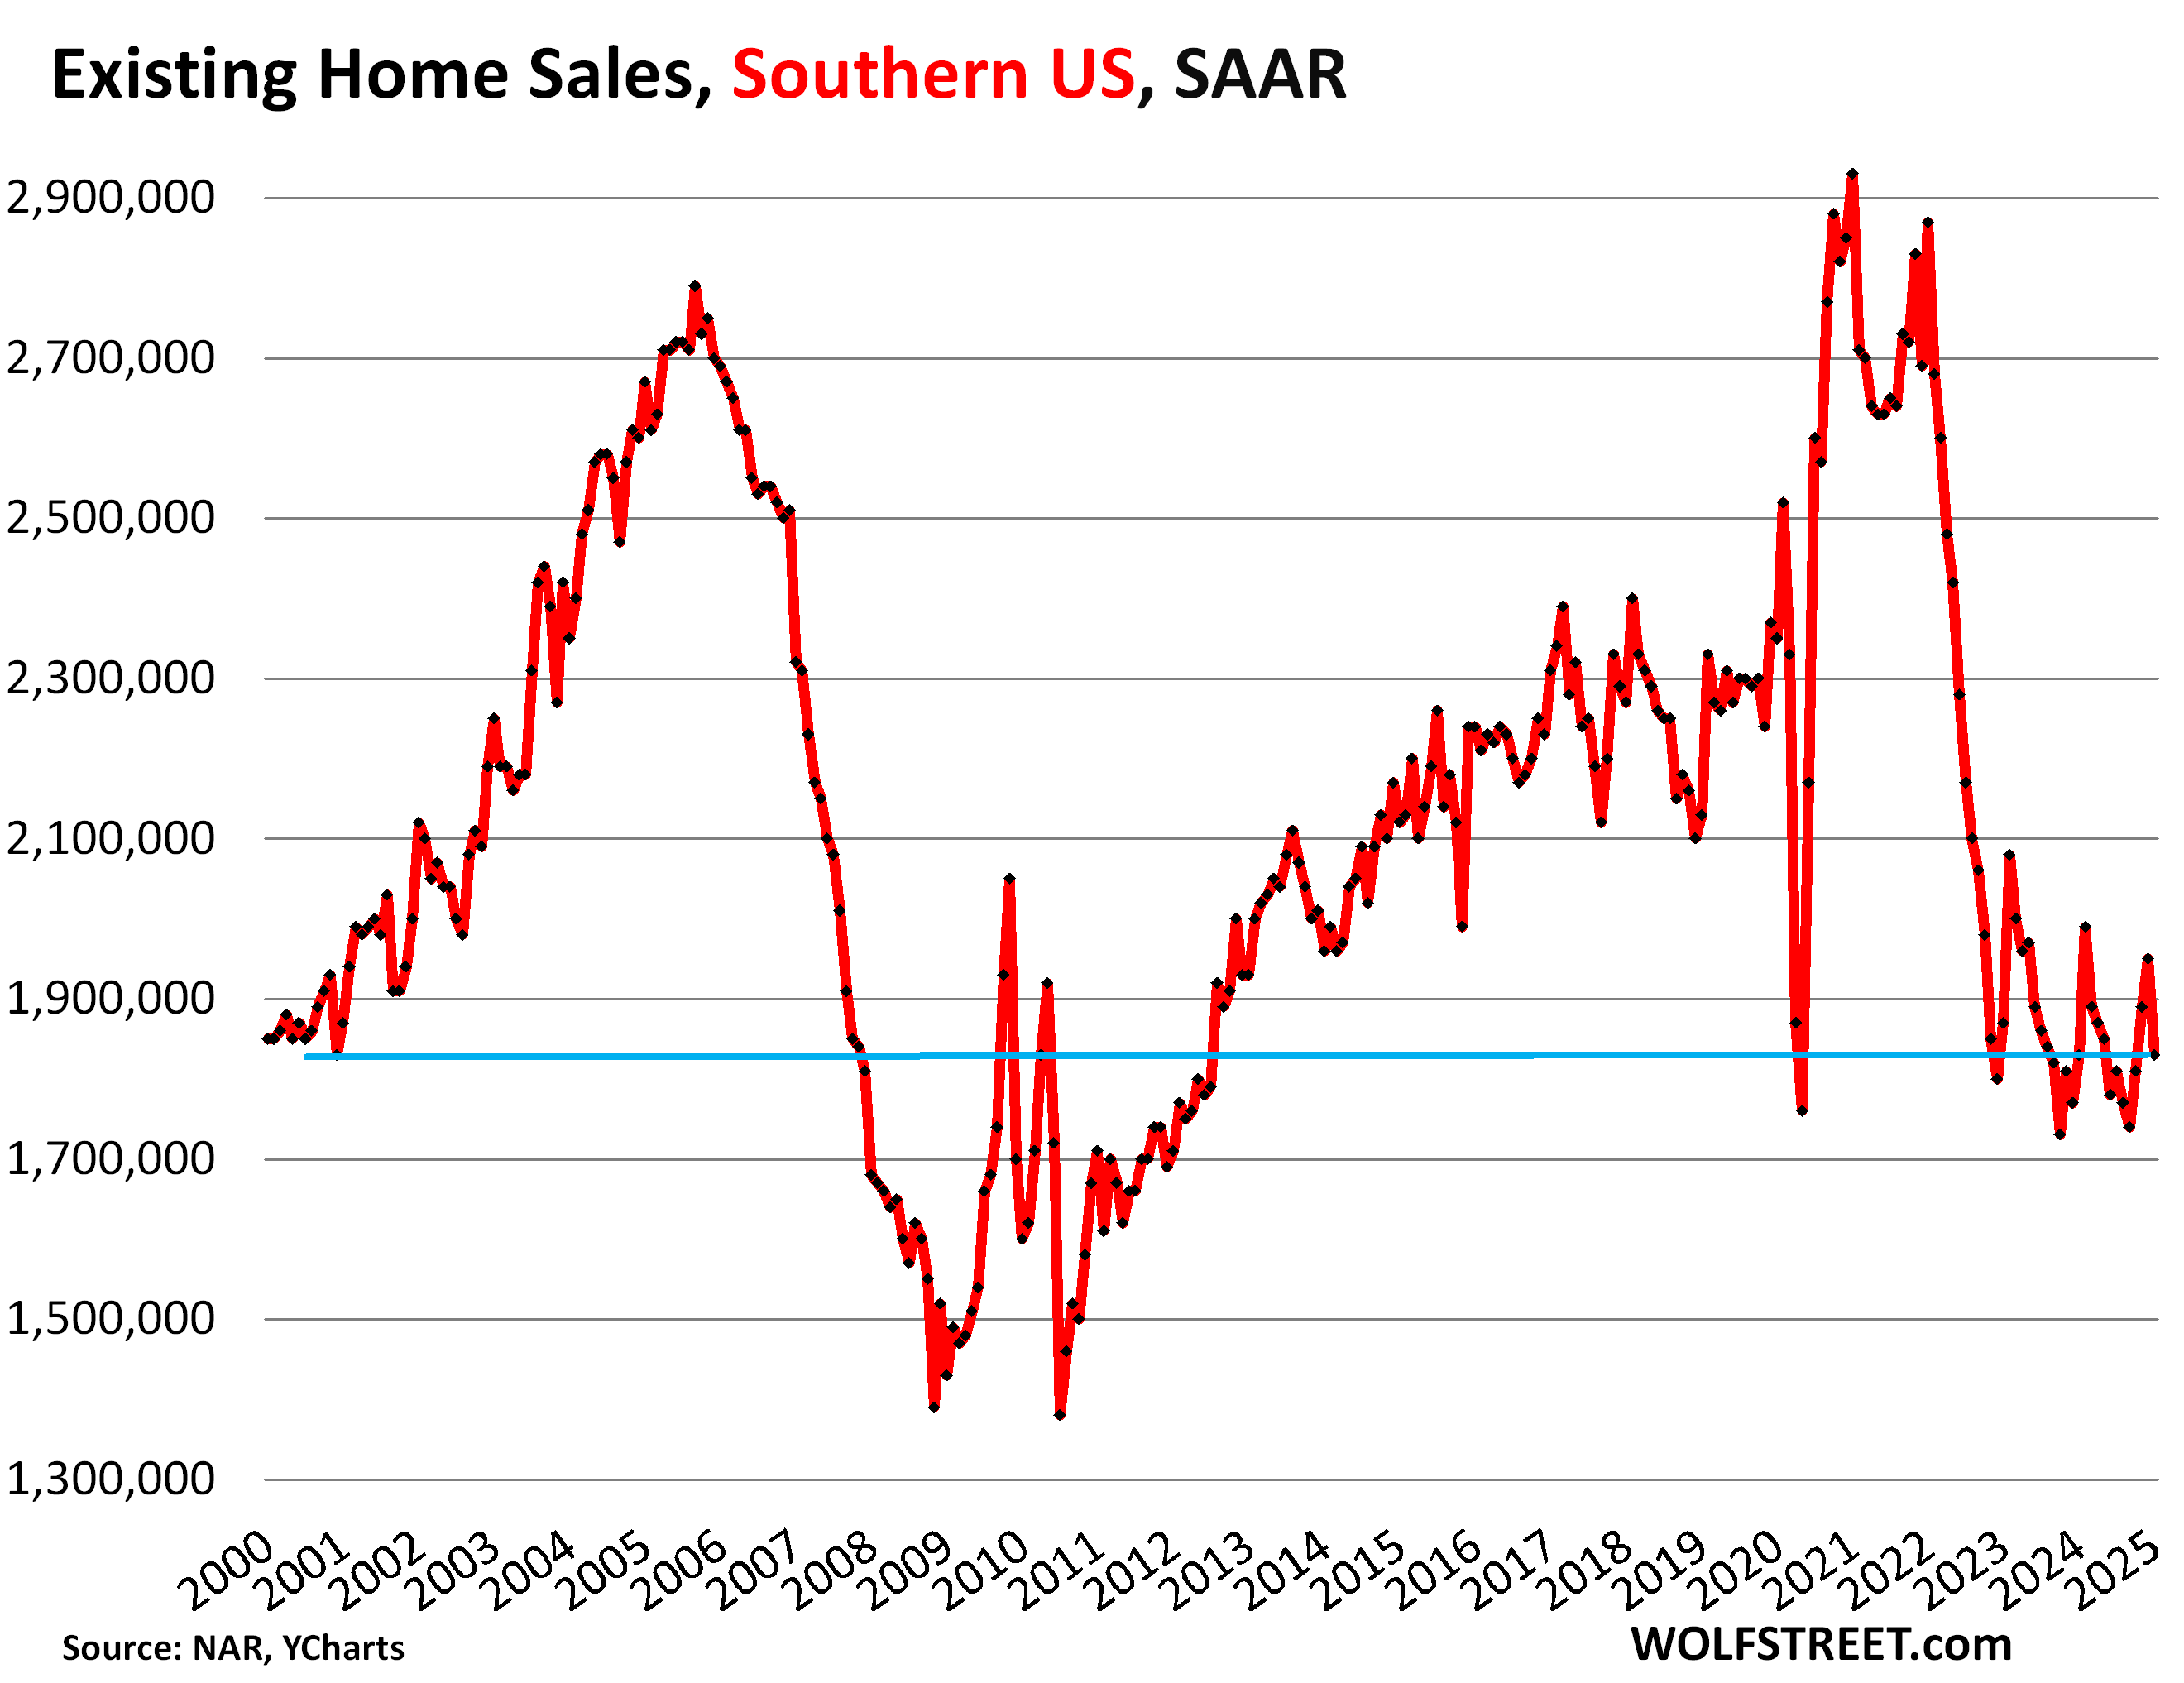
Southern US: The seasonally adjusted annual rate of sales fell to 1,830,000 homes.
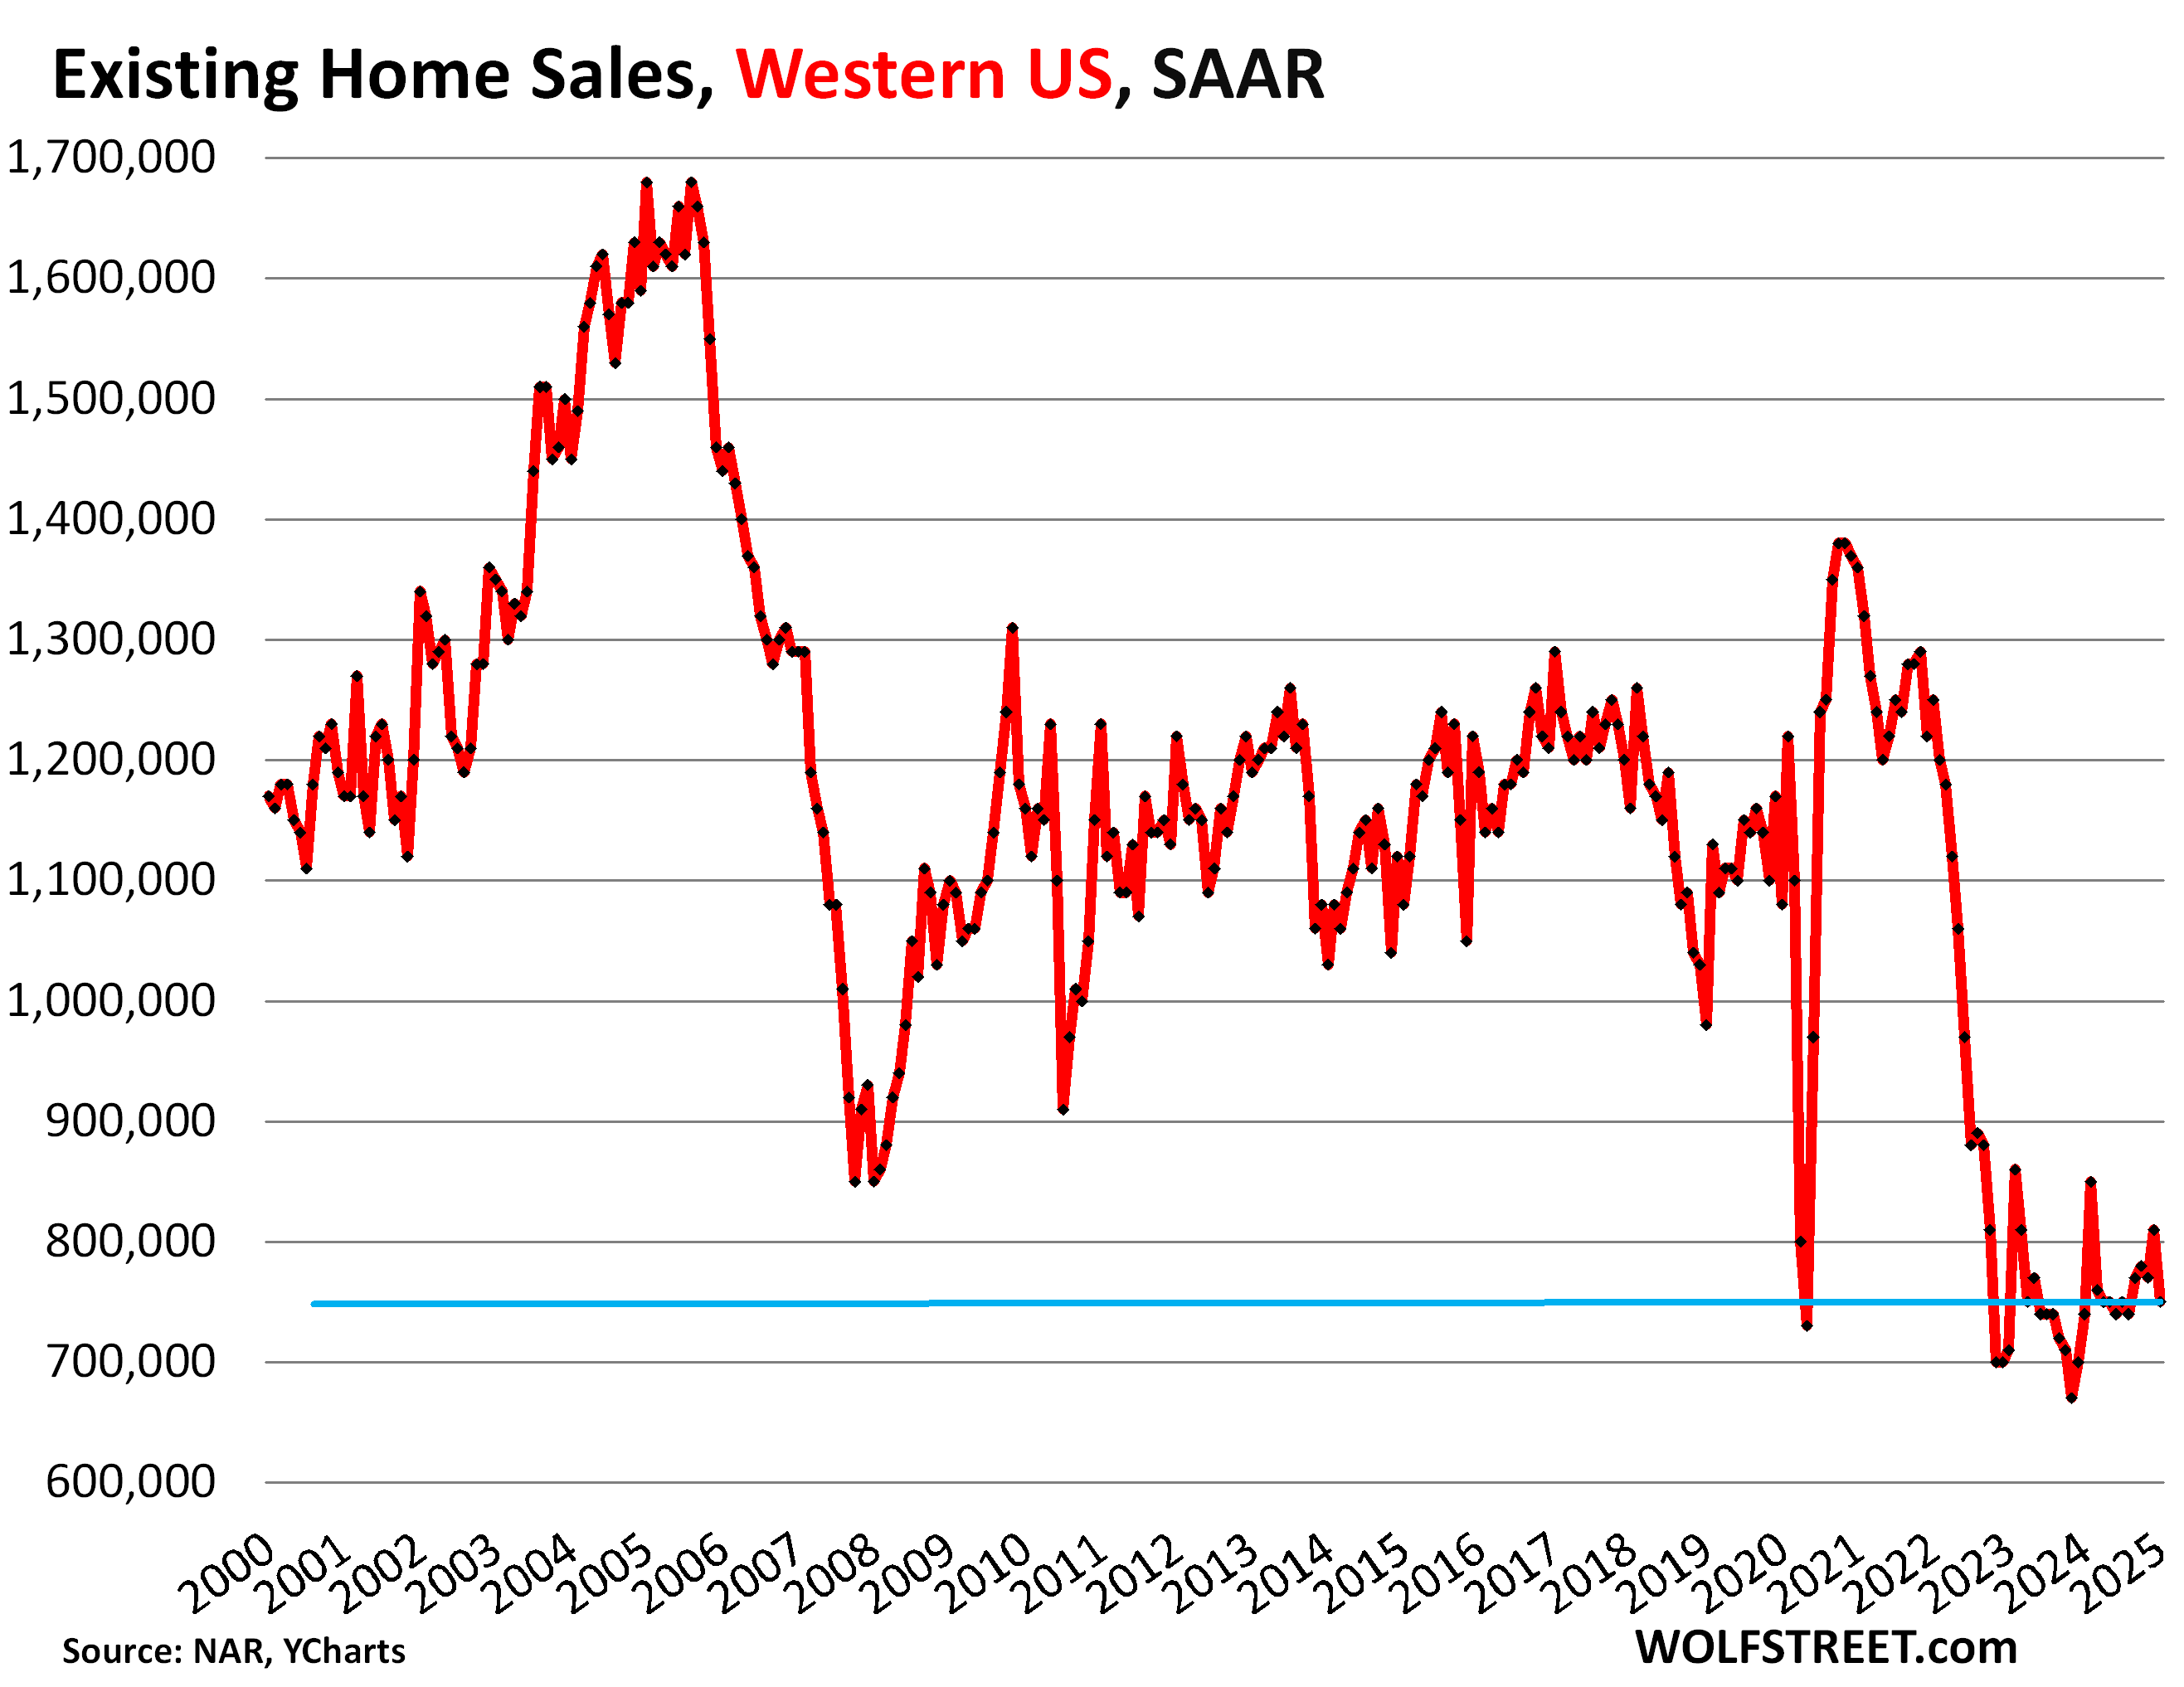
Western US: The seasonally adjusted annual rate of sales rose 750,000:
Highest supply since January 2019.
Supply of unsold existing homes on the market jumped to 3.5 months in January, the highest since January 2019 (3.8 months), higher than January 2018 (3.4 months), and same as January 2017. January 2025 is shown as the red square.

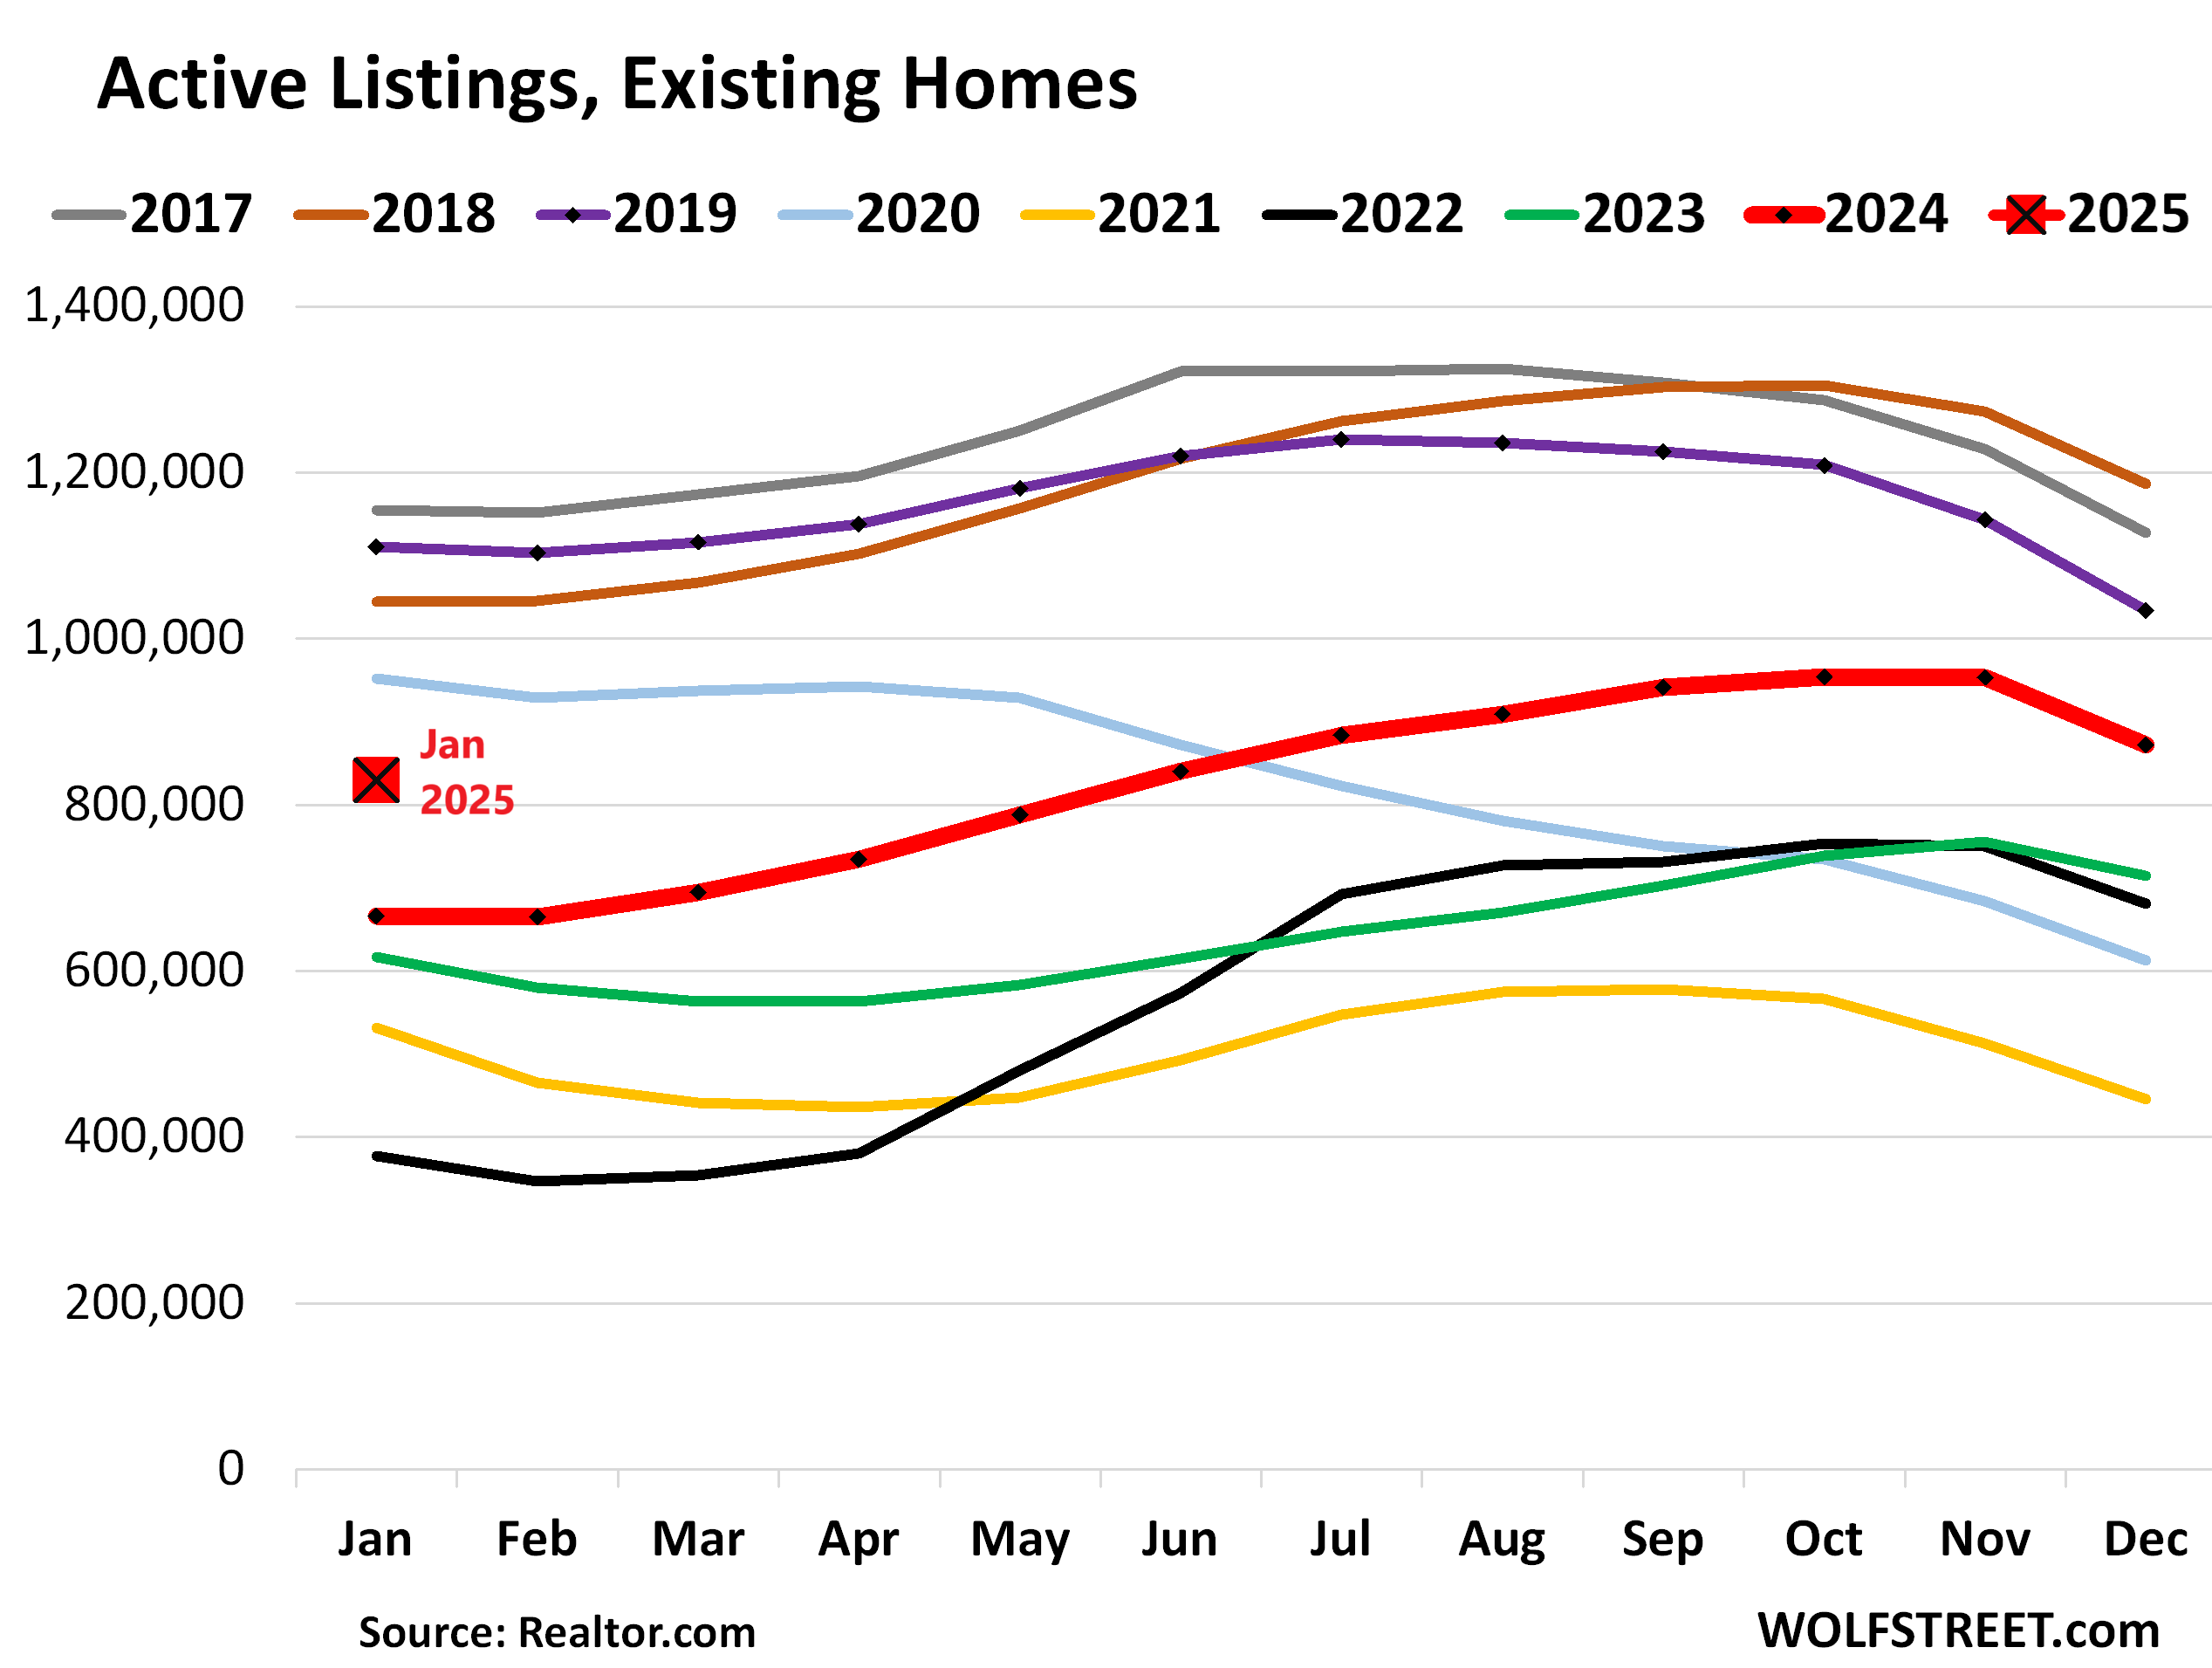
Active Listings doubled since 2021.
Active listings – total inventory for sale minus homes whose sales are pending – rose to 829,400 (red square in the chart below), the highest for any January since 2020, according to data from Realtor.com.
Active listings have more than doubled since January 2022, while actual sales in January have plunged by 31% from January 2022.
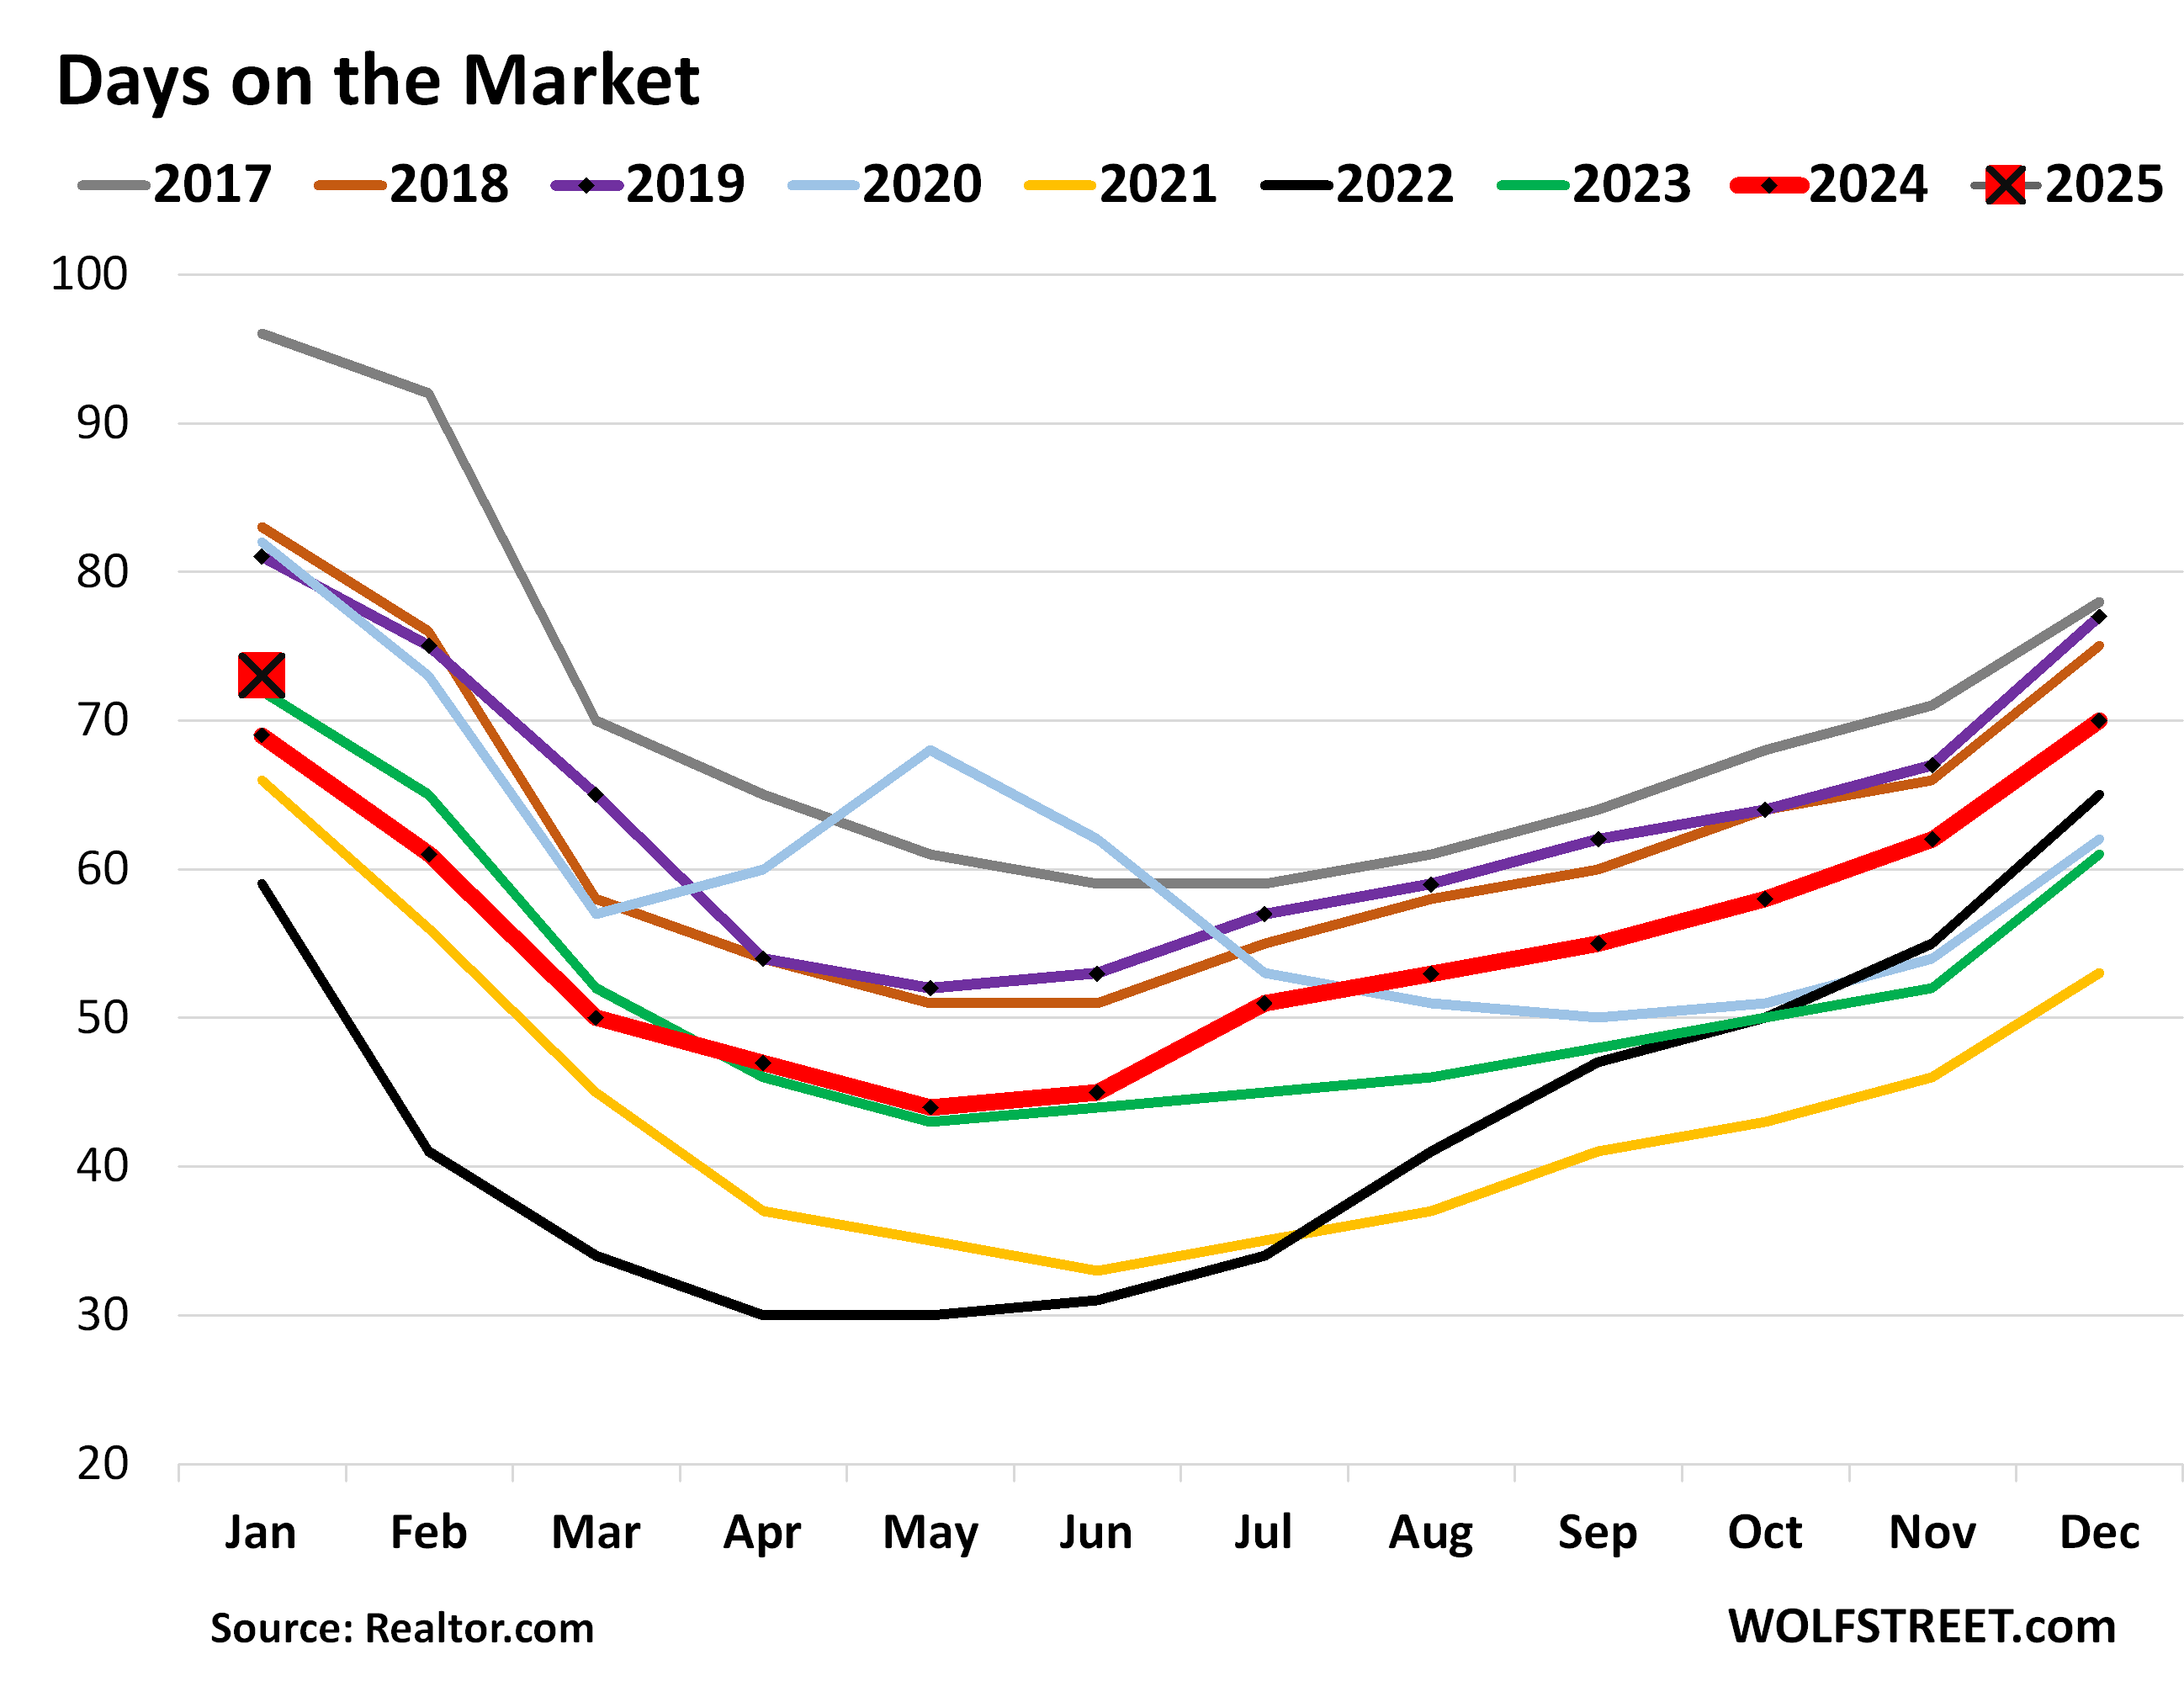
Days on the market lengthen to 73 days.
The median number of days before the home is either sold or pulled off the market because it failed to sell rose to 73 days in January, the highest for any January since 2020, and up from 69 days a year ago, according to Realtor.com.
Days on the market track the mix of two factors: How motivated sellers are by letting their home sit on the market when it doesn’t sell right away, before they pull it, and how quickly homes sell that do sell.
I’ll just vent here about the metric, “median price.”
To get the national median price, the NAR essentially puts all homes that sold in the US on a list sorted by price and takes the price of the one home that is in the middle of that list (=median price).
The median price is heavily skewed by changes in the mix of homes that sold. In the spring, nationally, more higher-end homes come on the market and sell, which changes the mix of what sold and skews the median price higher. It then does the reverse in the fall and winter and skews the median price lower. These seasonal ups and downs in prices are at least in part due to this shift in the mix. In individual markets, median prices jump up and down wildly on a monthly basis, based largely on the mix of what sold.
The median home price is the second worst measure for home prices, after “average home prices” (sum of all home prices divided by number of homes). Today, there are far better methods available, based on huge amounts of data from all sources, including public records, with sales-pairs relationships.
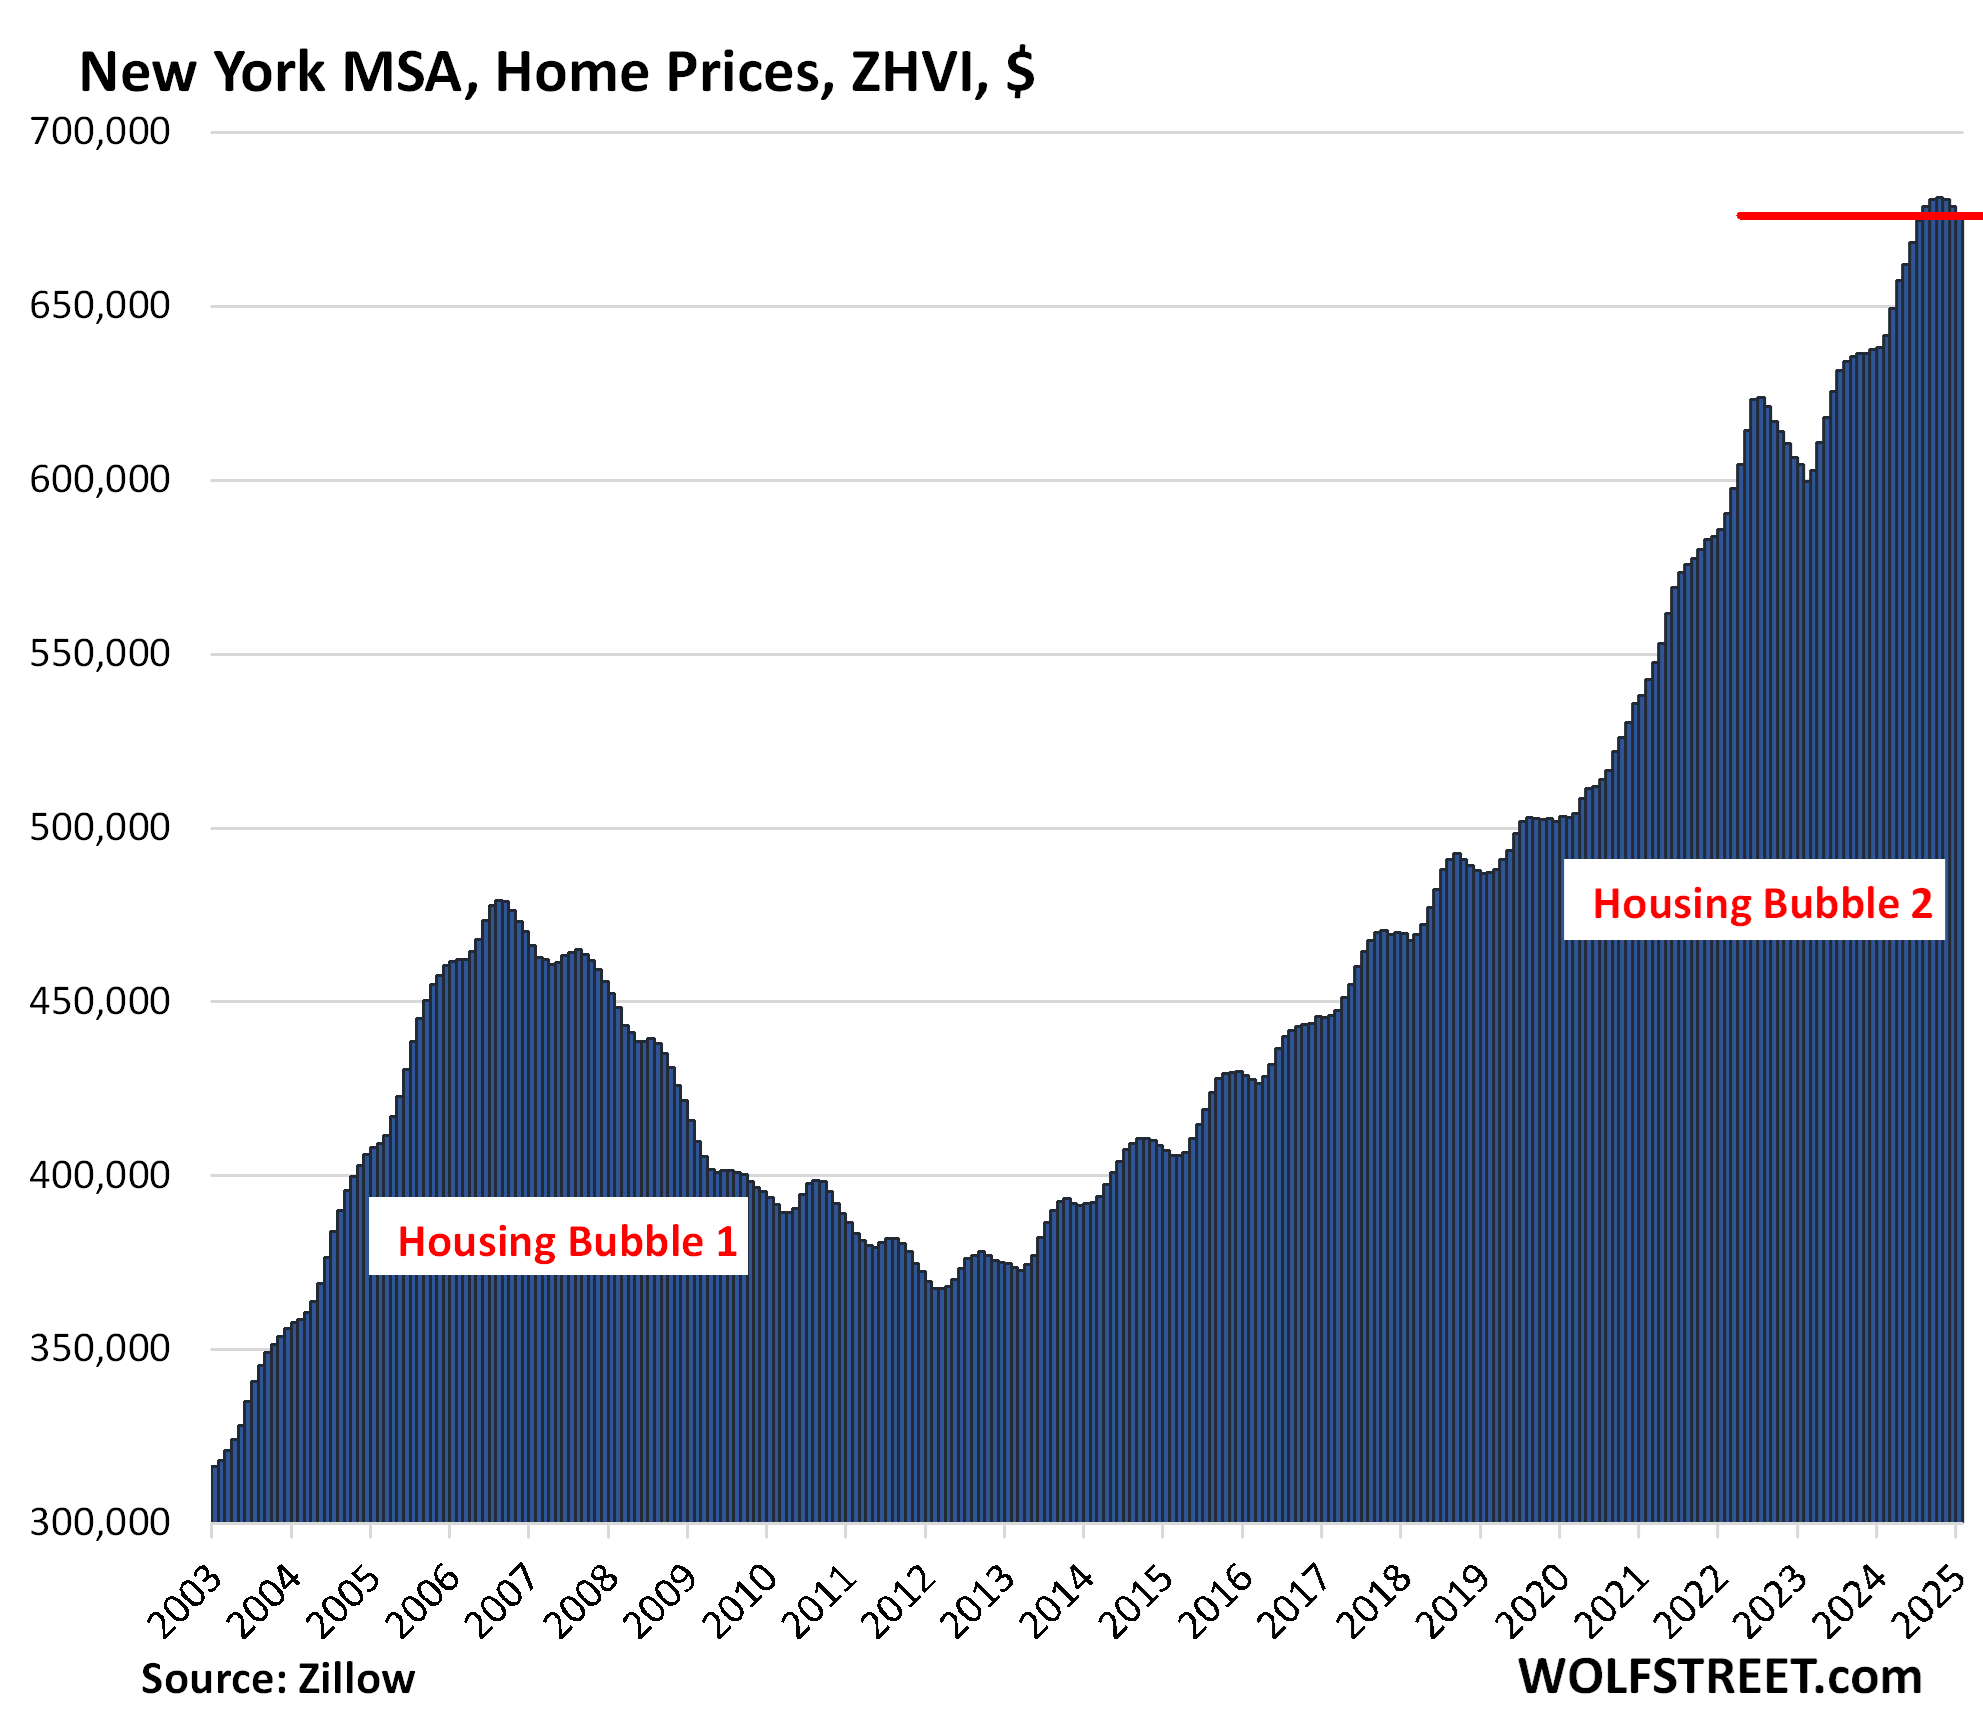
I use one of those massive data sets that is not based on a median price to depict visually the largest most expensive 33 markets – those where prices have dropped sharply since their peak in 2022 and those where prices have continued to rise, for my series, The Most Splendid Housing Bubbles in America, Jan 2025: The Price Drops & Gains in 33 of the Largest Housing Markets.
These 33 large metros are bookended by the Austin metro with the biggest drop from peak (-23% from June 2022), and by the New York metro with the biggest year-over-year gain (+6.0% yoy):

But the NAR still puts out its national median price as it has for decades.
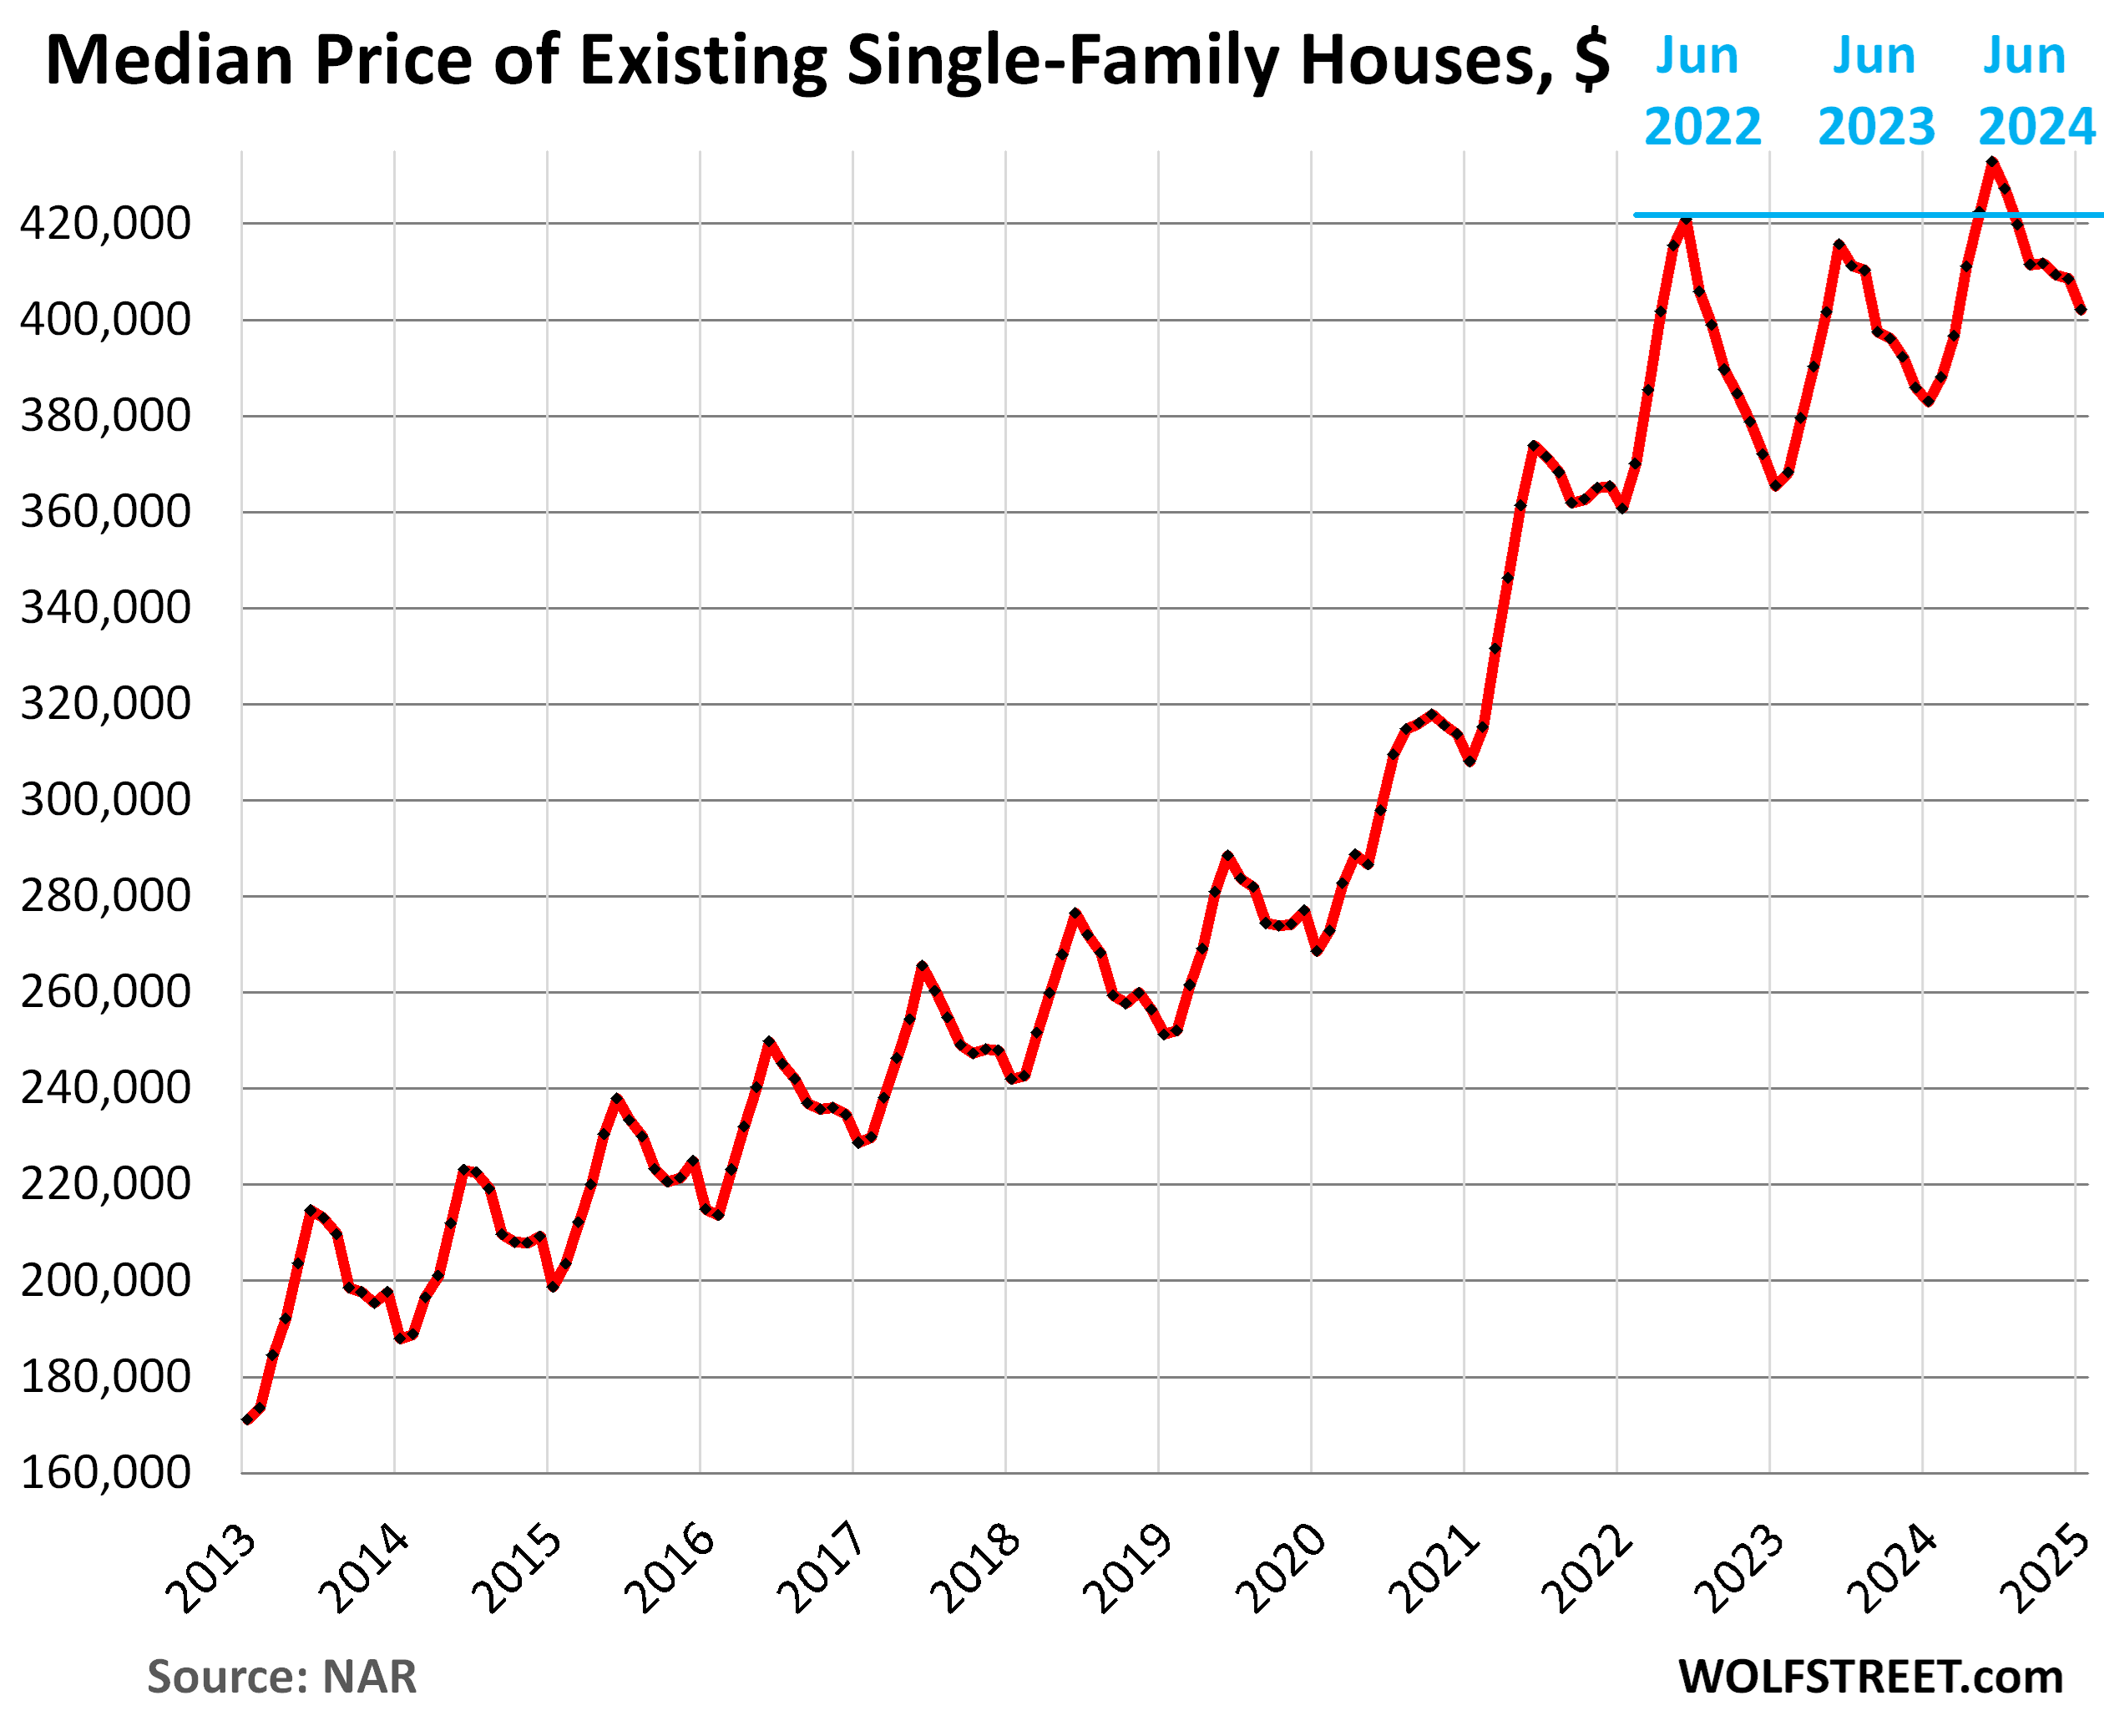
Single-family houses: In January, the national median price declined along seasonal lines to $402,000 from the downwardly revised December median price. This trimmed down the year-over-year increase to +5.0% in January, from +5.9% in December (originally reported as +6.1%).
Based on the pre-pandemic seasonality, the median price drops sharply in January, and January or February marks the seasonal low point. The high points are in June.
The 50% price explosion between June 2019 and June 2022, on top of the large price gains in the prior 10 years, was driven by the Fed’s interest-rate repression and money-printing schemes which have created the #1 problem in the housing market today, which is why demand has plunged: Prices are way too high.
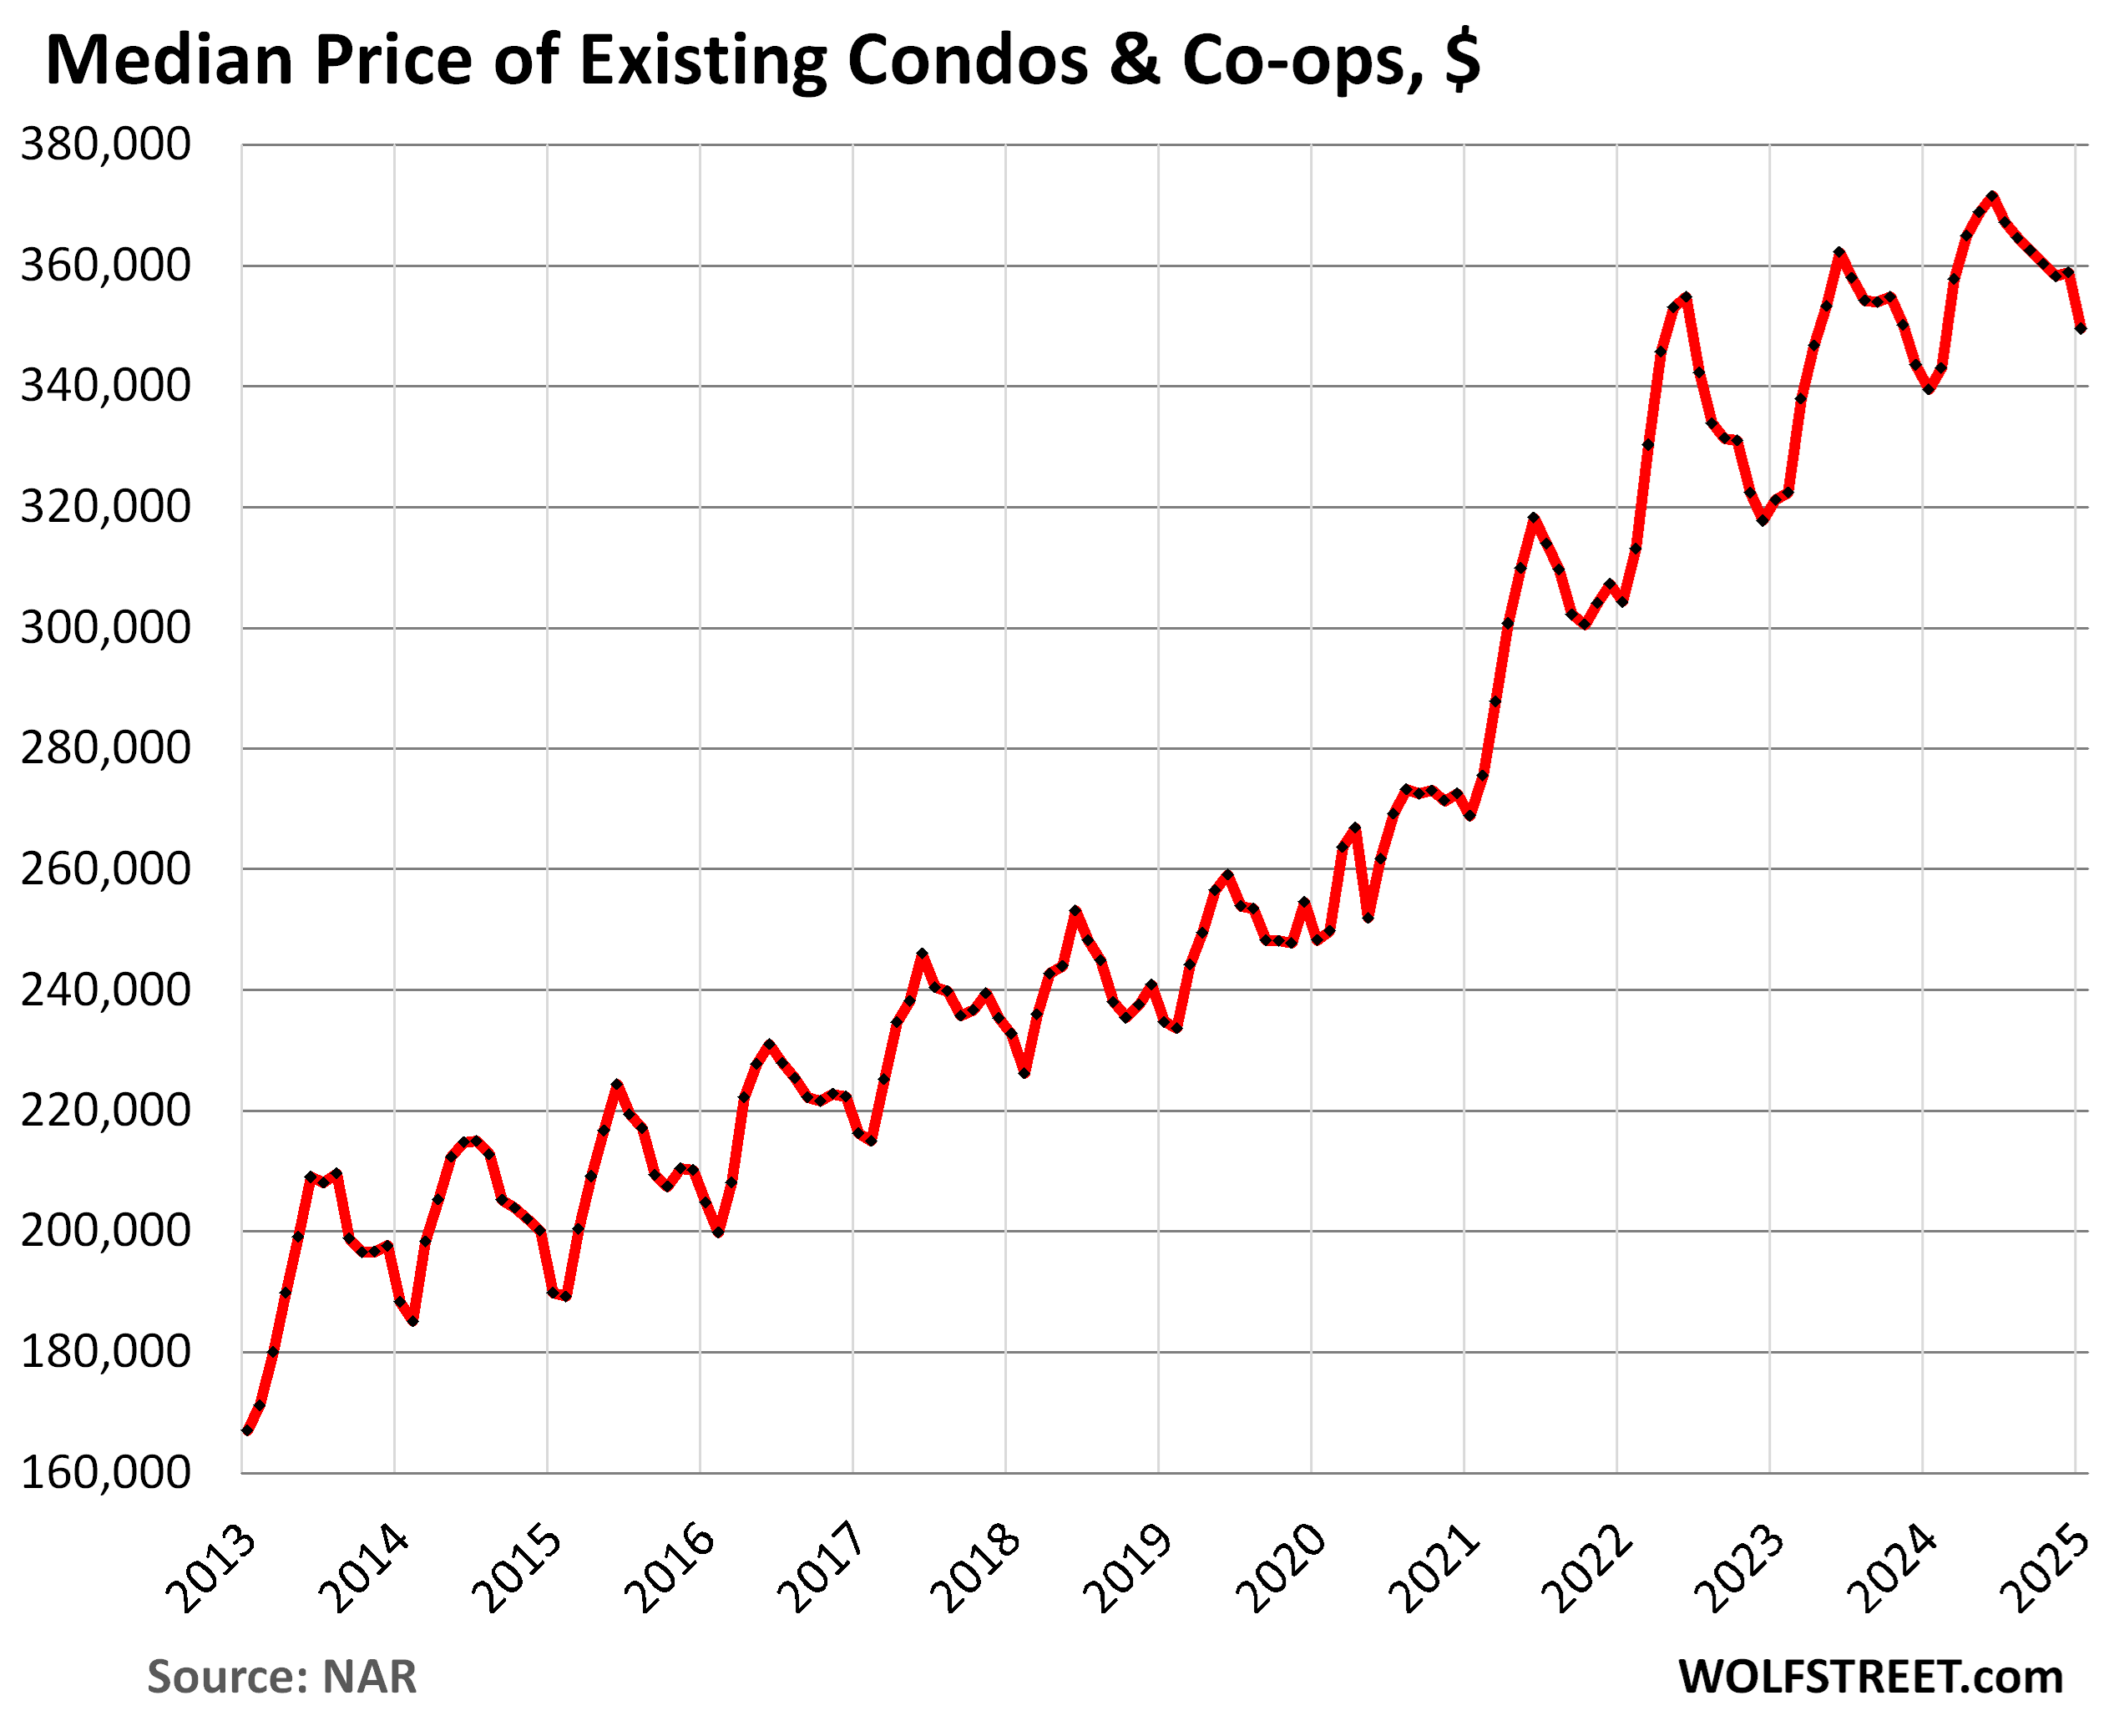
Condos and co-ops. Prices dropped by 2.9% in January from December, the biggest December-January drop since 2015, to $349,500. This drop, which was far more than the typical seasonal drop in January, cut the year-over-year gain to 2.9% in January, from 4.5% in December.
Enjoy reading WOLF STREET and want to support it? You can donate. I appreciate it immensely. Click on the mug to find out how:

![]()
So a good time to sell and rent if you live in California?
It’s always a good time to buy according to SoCal RE agents. Price sky high, interest rates high, no problem, still a great time to buy because price can only go up so it’s a cannot lose investment.
With that in mind, that’s also why you hear people ask on Reddit, is it wrong or should I worry about my $10k – $15K monthly mortgage when my HHI is at $200K…oh the price the pay to live that American dream
I can tell you that here in Tucson, activity exploded(pent up demand)
and while listings went up(many pulled for 30 days then re-listed)
activity/contracts in works
Feb. closings likely big ++
still had 984 closings with 2,500 new listings in Jan
lots of heavy down payments to limit mortgage size
Trying to time the market is difficult unless you have reliable(non-Walmart) crystal ball.
I knew a half a dozen who tried during the last housing bubble. They all sold too soon(2004) and jumped back in too late (2014). They were conservative after great gains by 2004 so they cashed in. They were too conservative and bought back in in 2014.
They waited too long and with closing costs, moving costs, and 10 years of rising rents, they might have just broken even.
I’d sell now and rent if you are planning on selling in the next few years. The next 10 years may be a roller coaster or just flat. I doubt the bubble will continue unless we have massive inflation. The bubble will pop if we have a recession. Neither is likely.
Magic 8 Ball is as good as any.
While I know I differ from some others here that think this level of sales is a problem, even the WSJ had an article saying the tide is turning, that it is becoming a buyer’s market. Patience, people.
I just sold and rented in SoCal, but it was not a financial decision, but my move into retirement. It does look that I was lucky in my timing, however, as the interest on my equity will pay over 100% of the rent in my downsized home.
I will note that my old house sold for $100K over asking in 24 hours, so my one data point does not reflect Wolf’s aggregate data, but I do think there are hot pockets here and there based on local situations. In my case the “fire refugees” looking within an hour of LA are putting high demand on the upper end of the market, and realtors in Orange County are barely sleeping selling high end homes and rentals.
To illustrate the four Census Regions of the US of A:
Wolf, I follow you regularly and find you informative. I would like to point out that we certainly do have a bifurcated housing market. We are a PE firm specializing in providing capital for real estate development and construction. Our markets are coastal Florida, South Carolina. The high-end luxury is selling quickly ( $ 3.MM-$20MM) spec housing. Very brisk market. You may want to do your research especially in areas like Walton County Florida and developments such as Alys Beach , WaterColor, Rose Mary Beach just to name a few.
The luxury market isn’t what I’m interested in from an economic point of view. Volume is relatively small, and it does what it does. I’m interested in the big-fat middle where most of the volume is.
In terms of the big-fat middle in Florida:
Homebuilders, during their earnings calls, are now crying about their unsold spec houses in Florida and Texas.
And there are lots of active listings of existing homes too:
It looks like active listings are at historical norms, days on market is average. All costs to build are increasing. Interest rates decreasing…I’m guessing house prices are going up
Keep guessing.
Inventory for sale of new single-family houses in the South (so not just Florida):
I was referencing the active listings in FL chart you posted above. Not new single family houses in the south.
It’s an easy bet house prices are going up. Look at prices since 2000. Almost all are up 200%
Biggin,
Are incomes and employment levels up over 200% from 2000 to date in those same places?
If not, then quite likely the price boom you cite (ignoring vast interim volatility) is quite probably mainly the function of ZIRP distortions from the Fed.
No ZIRP – air goes out of bubble.
Cas127
It’s household incomes (increased) AND mortgage rates (ultralow) that drove this. Not either or.
Having been through crashes of the real estate market in FL since the 1950s with ancestors also in the biz, I agree that NOW seems to be getting close to another one.
However, I see the ”bifurcation” in the increasing delta between properties subject to storm surge and properties involved in condo rehabilitations that are now mandated, (as they should of been from the beginning,) and properties that did not flood, etc.
Both condos and surge location properties are facing HUGE costs increases, with many of the latter still not livable since fall ‘canes, and many condo owners facing maintenance costs more than initial purchase prices.
Agreed, VVN. The attraction of FL is unchanged, and big money is pouring in and planned to keep pouring in (see that Uber-rich guy’s plan for W Palm Beach). The “seal has been broken” so to speak. That bifurcation will continue to grow.
Luxury market is so small that it does not really matter
Luxury market would be hit harder with stock market decline
Green Shoots??? Where have I heard that before? Oh yeah, under O-man. With the economy crumbling, ‘they’ repeated ‘green shoots’ ad nauseam. What a moronic expression.
You mean back when we all were sane and not crazy af?
I’d take those days rn
Instead of living in some make “ America Russia in the 90’s again” time period
Tell this administration where they can stick it
The Michigan consumer sentiment just did
apparently you weren’t one of the 7,00,000 homeowners that became “houseless” back then
thecon dot tv
– I see another reason why home prices are so high in e.g. the US. In the past say 20, 30 or 40 years a growing amount of women (in %) have entered the workforce in several countries in the world and e.g. the US.
– Let’s assume that a bank is willing to lend 4 times household income. Then it matters when a household has 1 or 2 incomes of say $ 30,000. With one income the bank is willing to lend 4 x $ 30,000 = $ 120,000 and then this household can make a bid of $ 120,000 on a house.
– With 2 incomes the bank is willing to lend 4 x $ 60,000 = $ 240,000 to that household. Then this household is able to make a bid of $ 240,000 on a house.
– As a result of this an average house will go up in price from $ 120,000 to $ 240,000.
Women don’t make as much as men, 84 cents on the dollar at last count, and less in the past 40 years. Elizabeth Warren’s “two-income trap” referred to people with kids competing for housing in good school districts, who are not the majority of homebuyers.
More single women buy homes as a conservative way of building wealth, at about 20% of the market.
So many people love to blame women in the workforce for the problems of our nation. Other people will call you out on it, every single time.
Women make 84 cents on the dollar for the exact same job output? What idiot would hire a man for anything then?
Anyway, housing is up 50% or more since eth pandemic…but that was five years ago. Absent that craziness housing would be up…25%. The graphs are starting to show a return to trend – another year or two.
Yes the world might end and housing prices drop by 50% – or it might not.
That 84 cents on the dollar thing is BS, it doesn’t account for people working at less than full time capacity, or people working at more than full time capacity. It’s a really dishonest measure and just doesn’t reflect reality in any job situation I have seen in my 30 year career in Medicine.
Anyone that thinks equally qualified women make the same amount as men for the same job are ignorant AF. It’s taken decades to claw that percent into the 80s from much lower. So easy to bury your head in the sand and tell yourself what makes you more comfortable when you’re the one benefiting from other’s suffering.
Sorry, Ben, they do. Anecdotally, I can *assure* you they do, and in fact often earn more because the competition to hire them is higher than for men. Maybe that will change with this administration’s attempt to crush DEI. Who knows.
Gattopardo, as much weight as your (checks notes) anecdotal assurance (lol) carries, I’ll trust the BLS statistics, thanks.
Unless you think that women are only 84% as intelligent or capable as men, you’re wrong. And a lot of people with hiring authority DO think that- as Ol’B points out, hiring managers MUST be that sexist and ignorant otherwise they’d hire equally qualified and capable women for 84% the cost of men.
This is why DEI practices (read: equality in hiring) aren’t just good for equality and fairness. It’s also good for companies when executed efficiently. Companies benefit from diversity of thought because they’re managed by disproportionately too many of the same demographic folks, which isn’t proportional to their customer base demographics, which leads to less effective business decisions, marketing, etc. It’s been studied to death, Google it if you’re interested in learning instead of your anecdotal misconceptions.
“And a lot of people with hiring authority DO think that- as Ol’B points out, hiring managers MUST be that sexist and ignorant otherwise they’d hire equally qualified and capable women for 84% the cost of men.”
To me, this is counter-intuitive. The impulse of capitalism to find the cheapest possible labor should override personal hiring preferences.
In other words, maximizing profit takes priority.
Yeah, Ben is just wrong here. Normalizing for hours worked, jobs preferred, the wage gap disappears. But he has an ideological axe to grind.
Jobs preferred, or hiring preferences? Anyway, it’s ironic you point out hours worked. Women work longer hours than men for the same roles, on average. They have to because they aren’t taken as seriously as men, by default. Men can coast more without getting called out for it.
“In other words, maximizing profit takes priority.” I agree Short, it does. It’s called subconscious bias. If folks were aware of it they’d make the optimal business decisions, but the human mind is imperfect.
The other ironic thing is that in cases where equally qualified women aren’t as effective in their roles as men are, a large part of it is that they aren’t trusted as much or taken seriously to do their jobs. As evidenced here by all of you implying that women are dumb and poor workers (compared to men)
What does women making less than men statistically matter here? It’s a separate topic. You just blatantly proved the guys point, that a workforce inclusive of more women (or just people, in general) raises a households ability to pay more for a house, and changes supply and demand. A household now has $1.84x income instead of $1x income….therefore they can buy more house. Demand changes. End of discussion. Yes it’s a thing. If you can’t understand that, I feel bad for you. Does this mean women working is a bad thing….well no, not really. But it means 2 income households competing for homes to buy will drive up prices. It’s so simple lol
You’re blaming women for the price of housing? Lol
Suzanne researched this
Lisa,
I don’t think that’s what J.M.Keynes said. I think he said that higher household incomes (from two earners, rather than just one earner) made it possible for home prices to run up. Household income is a big factor in home prices, just like mortgage rates are.
That’s not what was said at all. It’s very factual that a household with more earners will afford more home. Imagine if a house had 6 people living in it…they would have 6x income. Imagine if they wanted to buy a new home, they could afford a lot. This isn’t about men vs women or women working. It’s about the change of total household income.
**working people.
See below: household size did not meaningfully increase since 1990, nor did number of workers per household. The only thing that increased purchasing power was higher personal incomes.
Try living with five other people and getting thru a 1-year apartment lease without fights and someone moving out… nevermind committing to own property together.
As someone who spent almost a decade living with a minimum of three roommates and sometimes up to seven… trust me, getting such an arrangement to work is a pipe dream.
It is easy to find when women started entering the workforce, my dude. In the US this convergence between men and women working started in the 1950s and was pretty much finished by the mid-90s (i.e. 30 years ago, so you’re a little behind the times).
It is also easy to find median family income. It is a surprisingly smooth graph, so no sharp increase from women working. But, the rate of increase was much greater during the early years that women started working: after adjusting for inflation, median family income nearly doubled from 1954-1974, almost didn’t change at all from 1974-1994, and increased about 40% from 1994-2024.
But that’s all ancient history, man. It clearly can’t have anything to do with the rapid increase in housing prices post-2000.
Smooth graph perhaps, but a lot of variables go into that. In addition to more women workers, there’s been a huge decrease in family/married couple households. Lots more single parents and single people living on their own over the past 50-70 years, which could offset more women making $. On the other hand, an increase in roommate situations, and more recently an apparent uptick in generational family households. I agree with your points just think it’s pretty complex with all the variables.
Totally agree it’s complex.
Though interestingly, average household size stopped dropping around 1990 as well and has held already at 2.6 ever since. So again this seems unlikely to be an explanation for the sudden increase in housing costs starting in 2000.
JM Keynes, exactly. Women entering the workforce increased household purchasing power. Of course that translated to higher housing prices. Rough to be single!
See above: if this were an effect, it would have happened in the 70s and 80s, not the 2000s. The share of women working now is not meaningfully different than it was in 2000. The increase in household income didn’t come from more people working at all (which also hasn’t meaningfully changed since 2000).
To be clearer still, working age employment to population ratio overall, and for women only have both changed very little since 1990.
The increases in household income since then have come because individual salaries have gone up quite a bit since 1990. This happened mostly in two main bursts: from 1994-2000, and from 2013-2019.
Are you suggesting that home prices haven’t gone up since the 80s?
Of course they have, and one of the drivers would be more household income.
If more people working in a household didn’t equal more income and buying power, people wouldn’t do it.
I’m sure the buyers will end their sunny vacation when homes come down 50% or more. Their leader, Joe CommonSense, will call an end to the strike at that time.
I see the national median price charts and they are still trending higher, with higher highs and higher lows. Since January of this year the 30 year mortgage is trending down, so it looks like we will get a higher high in June. Good luck to all of those waiting for the big crash.
This is a nonsense comment because no one, and I mean NO ONE, can ever buy the national median house. People buy houses in specific markets. In some specific markets prices have already dropped by over 15% since mid-2022, including Austin (chart posted in the article), Oakland, San Francisco, New Orleans, etc. In other markets, prices are up.
I see your point, but if you add up all those specific markets you get the national trend, so if the national trend has higher highs and higher lows, then that means that specific markets that have higher highs and lower lows are having more of an impact to the national trend than those that don’t. So although I agree that you cannot buy a national median house, there is a greater chance that you are seeing this trend in your specific local market than not. At least that is my take on what the national median price charts are showing and I do believe it is more likely they will show a higher peak in June than not.
My mistake, typo in my response, I meant “…specific markets that have higher highs and higher lows…”.
What do Long Island and Oahu have in common??
To da MOON!!
Yes, it’s oddly coincidental that all these idiosyncratic housing markets shot straight up right around the time the fed went absolutely nuts during the pandemic. I wonder what could explain that sudden rise? I guess we’ll never know 😂
Western US: The seasonally adjusted annual rate of sales rose 750,000
I can already hear that imaginary voice screaming…”Told you, SoCal like OC, LA and SD demand are still crazy hot” I mean it did go up after all…
Btw, think I saw something about a big inventory spike in DC area…hmm, I wonder what on earth would cause people to list there now…
Looking at the four SAAR graphs of existing home sales, it is pretty clear something has to give as far as prices go. I seem to recall Wolf does not like to do inflation-adjusted home prices. But even with that supposedly dubious statistic, home prices have to be headed for the big crash. It is something of a mystery why they haven’t crashed yet. Next recession will do it, or maybe a moderate increase in the unemployment rate.
The current DC housing market might be a good model, but maybe not. As an aside, I do not understand why anyone would want to be a government worker, other than they can’t find any other kind of job and they want job security. And now Trump is firing thousands and they complain and file lawsuits wanting their cushy jobs back. I guess they don’t realize that in the private sector, thousands get fired every week. Nobody who is fired likes it, but they generally do not file lawsuits against their employer to try to keep their jobs. It is a normal process in a capitalist economy.
Yeah those cushy jobs like tending to our nukes and airplanes in the sky. Do what you want. But I’m not flying anywhere for the next 4 years.
Right. These people gotta be crazy. There is something going on with aircrafts in the sky. Whether its a plasmoid knocking down a drone which we saw on tiktok or some other error with a pilot of a commercial jet… in the air is not currently where you want to be nowadays. Just gotta plan ahead and take the ground route if travel must be made. If something happens to you due to flying the friendly skies in 2025 you deserve what you get. No one to blame but yourself when the warning signs are everywhere that this isn’t a safe expedition you’re embarking on.
In the USA, 41,000 people got killed in car accidents in 2023 (2024 numbers not released yet). Not sure if that’s safer than flying…
Is it just me, or did the crazies and political soapboxers find Wolf’s site in the last 3-6 months?
Things just seemed to be more financially-oriented in the comments before. Now the loonies are out on both sides of the aisle grandstanding about one thing or the other.
Fan-#*$+@?!-tastic.
In the recent airplane accident here in DC, it took about 5 things to go wrong simultaneously to cause the fatal accident. The odds of this being an accident are 1 in 100,000,000,000. The pilot of the military Hilo must have gone wack-o.
Statistically, you are more likely to die driving to the airport than you are while on the plane.
Tina, thank you for refraining from flying. Lower demand helps keep prices a tad lower for me. Win win for us and not the airlines.
Home priced are not crashing hard because the people that own them are under no pressure to sell.
Case in point, my local New England market – up to 2020 we were able to buy small investment multi-family properties, typically no more than $300k, 20% down, commercial loans%, needing rents (accounting for 10% vacancy) to cover all costs of ownership and produce a 10-12 ROI on cash invested. This could be done without raising existing rents.
Now those $300k buildings are $600k, and you can’t make the numbers work with a loan, so these are all-cash sales to non-locals, even if the ROI is much lower without the leverage. People bringing this type of investment money to the table (I’m in the trades and end up doing work for a lot of them) are doing it because their passive investments have grown so much that they’re being told to diversify with real estate. Most of them are recent retirees who have settled in the area, or they are long-time second-home owners in the area. Most are very green to rental property ownership.
People with $600k extra money to throw down for rental properties in a business they have never participated in before versus locals that could scrape up $60k and run their rentals as a viable business are of completely different classes.
We’re frozen out of the existing rentals market until those people are out of the market (and it seems doubtful that they will be at this point). These people won’t be out of the market unless their investment portfolio crashes hard AND jobs are lost. Only a major recession is going to cause this. I’m not rooting for one, but that’s what it would take. Be careful what you wish for.
The RE market is too financialized and tied into the national economy at this point. I’m not sure I want to see what would happen in a major crash. It could get ugly.
In the private sector, about 1% of the workforce is fired each month. In the government sector, it’s about 0.5%.
In the last month, almost 5% of the government workforce was fired, or about 5 times the rate of the private sector. So, no, this is not normal.
The reduced rate of firing in government is part of civil protections to ensure smooth running of government and minimize political retaliation or corruption. In exchange for greater job security and benefits, government employees are often paid much less than comparable private sector employees.
Federal work is pretty comparable to any other work, just a different employer. I think you need to lay off the media.
“Nobody who is fired likes it, but they generally do not file lawsuits against their employer to try to keep their jobs.”
People who are illegally fired tend to sue. Private companies are usually savvy enough not to fire people illegally (ex. discrimination, political beliefs, targeting probationary employees who have positive performance reviews and saying they’re fired due to poor performance).
Can you imagine an office where the boss has to fire a white male and the white male files a successful lawsuit to get his job back? I imagine productivity in that office will go down the crapper.
The employee and employer usually both want that relationship to end. The result is settling. Back pay for the employee and usually some additional amount based on how egregious the illegal firing was. That’s why it’s dumb to fire people illegally.
There are more protections for federal and state employee, that’s why there’s less lawsuits in the private sector. Most of the US is at-will employment leaving very few ways someone can be fired illegally in the private sector (usually discrimination). But it happens.
White males sue for discrimination all the time.
People want to work for the government for a variety of good reasons: sometimes they feel like those jobs are helping other people or serving the public in a way that they can’t find in private industry. Sometimes they are attracted to the greater job security and better benefits (despite lower pay). Sometimes they work in areas where it is hard to find other options (for example, if you care about and like to work in nature, jobs in the National Park and National Forest system are appealing and there are very few other similar options.
In Chicago, Illinois the housing market is strong.
We have very few listings and once listed, the houses sell very fast.
Definitely true in my Northside neighborhood. The only stuff on the market is either priced 10-20% too high, or is a condo in some building with exorbitant HOA fees. Every reasonable property for an attainable price is scooped up immediately.
I’d happily buy a place in this neighborhood, but renting is still the more economical option.
Covid and it’s ensuing mass infusion of liquidity created a bubble spanning many asset groups which will take years to unwind.
A buyers strike sounds so “banana republic”. It’s simply the fact interest rates, property taxes and residential homeowners’ insurance are too high while my family income is too low. Therefore, an apartment is the roof over my head.
IIRC one of your comments was that sales were at the level of 1995.
Population has grown 27.7% since 1995.
It would be good to have some graphs/comments adjusted for population.
So, the median price of single family homes has never been lower than the previous year since 2013. When was the last time that did happen? Was it 2009?
That’s wrong. It was down year-over-year in 2023, look at the chart.
When you talk about existing supply of used houses is there any impact on the numbers when RE agents pull them from the listings for a month so they can re-list them as “newly listed”? If so, is there any way, or any need, to pierce the veil of such shenanigans?
When houses for sale are pulled off the market, they disappear from the inventory for sale, from active listings, etc. When those houses get relisted, the reappear in the numbers. Yes, oldest game in town.
Wolf’s graphs in the comment section of active listings in Florida and active listings of new homes in the South say one thing:
🚨🚨🚨🚨🚨🚨🚨🚨🚨🚨🚨🚨🚨🚨🚨🚨.
Any questions?
Took a walk tonight, Sat 22nd, from Wall St to UWS.
Manhattan is ____roaring___ as it was pre-pandemic and with much more new construction, new businesses than in all my time here, about 15 years.
New York is the show of what is possible and where things are going.
Outside of Manhattan folks are in the remote areas where depresso and doom and glooms is easy to get trapped in.
Brickell, Maimi is tasty as well.
Washington D.C. has a lot of new construction going on. We just appraised a new townhouse development in a good location. The builder of these $1 million townhouses had to reduce his prices by 10% to get rid of the inventory. When that happened, everything sold even before the construction was completed. So that would confirm what Wolf has been saying over and over. When the prices are reasonable then the properties will sell, and the builders will follow the market, because they have to.
“$1 million townhouses”
Imagine spending that much and not even getting your own plot of land.
Wolf,
I’d be interested in seeing data for condos in Florida. I’m curious how big of an impact the laws enacted following the Champlain Towers building collapse have affected the condo market in the State of FL.
I’ve been considering buying a condo in CA recently… Prices are at 2018 levels or before even. It’s that or rent forever and possibly even pay more out of pocket than if I bought. Seems like a buyers market and good prices. Only concern is if there’s a bigger crash coming
Try and time the market, and you’re likely to get burned. The price of houses ought to have an overlay of M1 money. When money is created, it has to go somewhere. Rates are at about historical average, not high, not low. Wage growth has been outpacing house price growth for 3 years in a row. If you plan to live there 5+ years, the noise and chatter is unlikely to be worth your time.
But there are a lot more houses being created too. Where did you get this dumb notion that housing supply is fixed and only money supply grows??? so more money chasing a lot more houses?
if anything, you need overlay total housing units and money supply. There are 147 million housing units now, up by 25 million from 20 years ago, which is why your simplistic M1 stuff is just propaganda.
These are the new single-family houses that are on the market for sale now, that’s newly built unsold supply to the housing market overall, right now:
https://wolfstreet.com/2025/02/26/inventory-of-new-houses-for-sale-highest-since-2007-builders-push-mortgage-rate-buydowns-price-cuts-and-incentives/
These are the overall additions PER YEAR to the housing market – single-family, condos, and multifamily rentals. In 2024, housing starts were 1.36 million, more money chasing a LOT more homes:
https://wolfstreet.com/2025/01/17/bring-on-the-supply-single-family-housing-starts-in-2024-rose-to-2nd-highest-in-17-years-amid-budding-glut-multifamily-starts-plunge-from-multidecade-boom-amid-oversupply-cre-depression/