Retail sales in January were actually up by 4.8% year-over-year.
By Wolf Richter for WOLF STREET.
You read the headlines today: Retail sales, seasonally adjusted, fell by 0.9% in January from December. Winter storms, fires, the consumer collapsed, whatever. But what we’re actually looking at here are… massive seasonal adjustments.
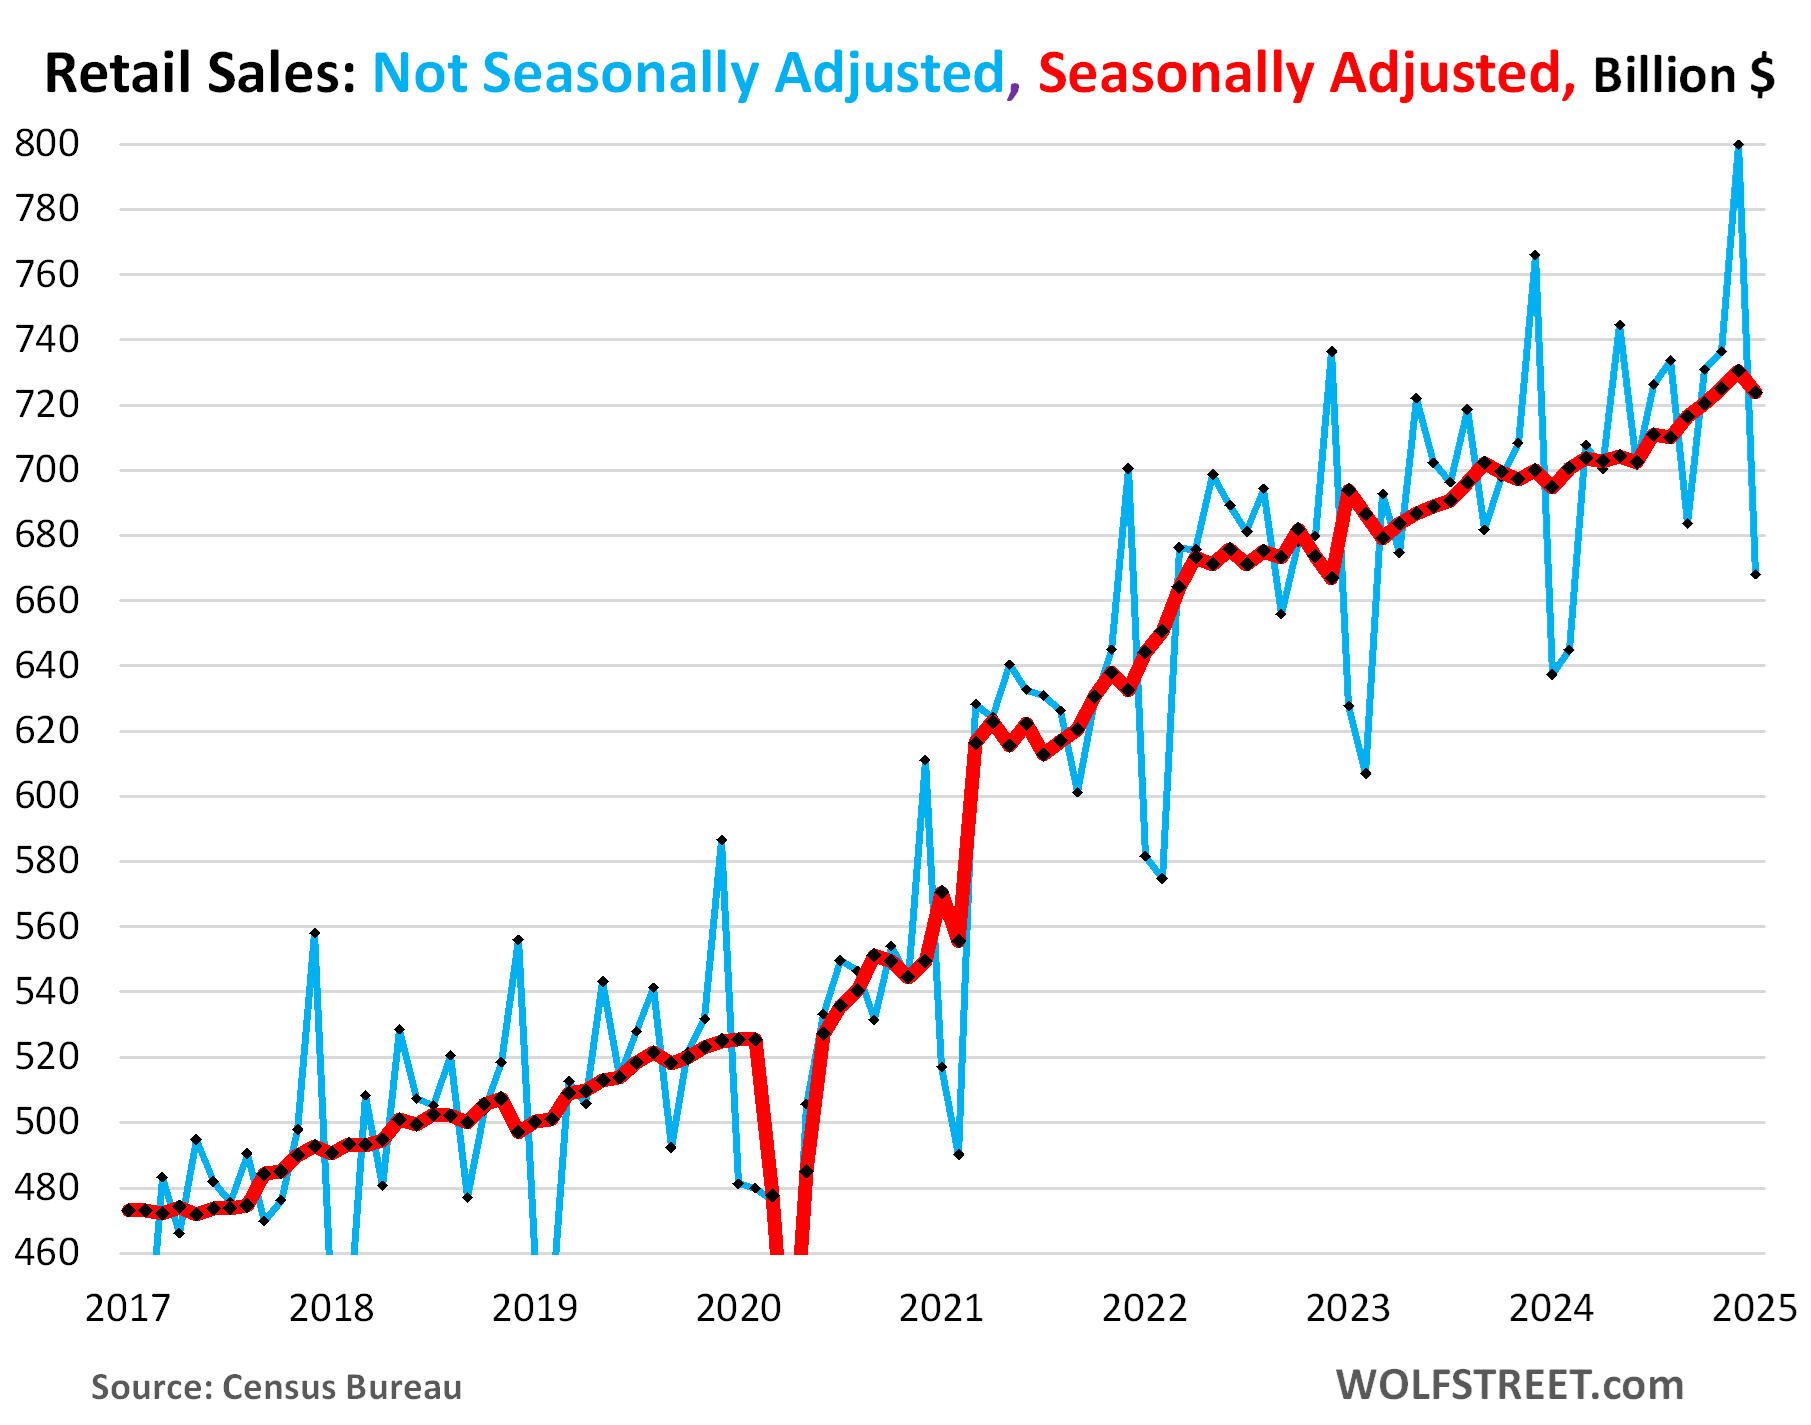
Not seasonally adjusted, retail sales were up 4.8% year-over-year, but month-to-month plunged by 16.5%, or by $132 billion, to $668 billion in January, from December’s record and upwardly revised $800 billion. Confused yet about whether retail sales in January were good or bad? Yup, it’s the time of the year again to do a romp through seasonal adjustments.
Not seasonally adjusted, retail sales always plunge from December, the best month of the year, to January and February, the worst months of the year – this time by 16.5% in January from December, according to the Census Bureau today. Over the past 20 Januarys, retail sales plunged by 15% to 22% from December. This January was less bad than most: There were only two Januarys with smaller plunges: in 2023 (-14.8%) and in 2021 (-15.4%). The rest of the Januarys experienced bigger plunges.
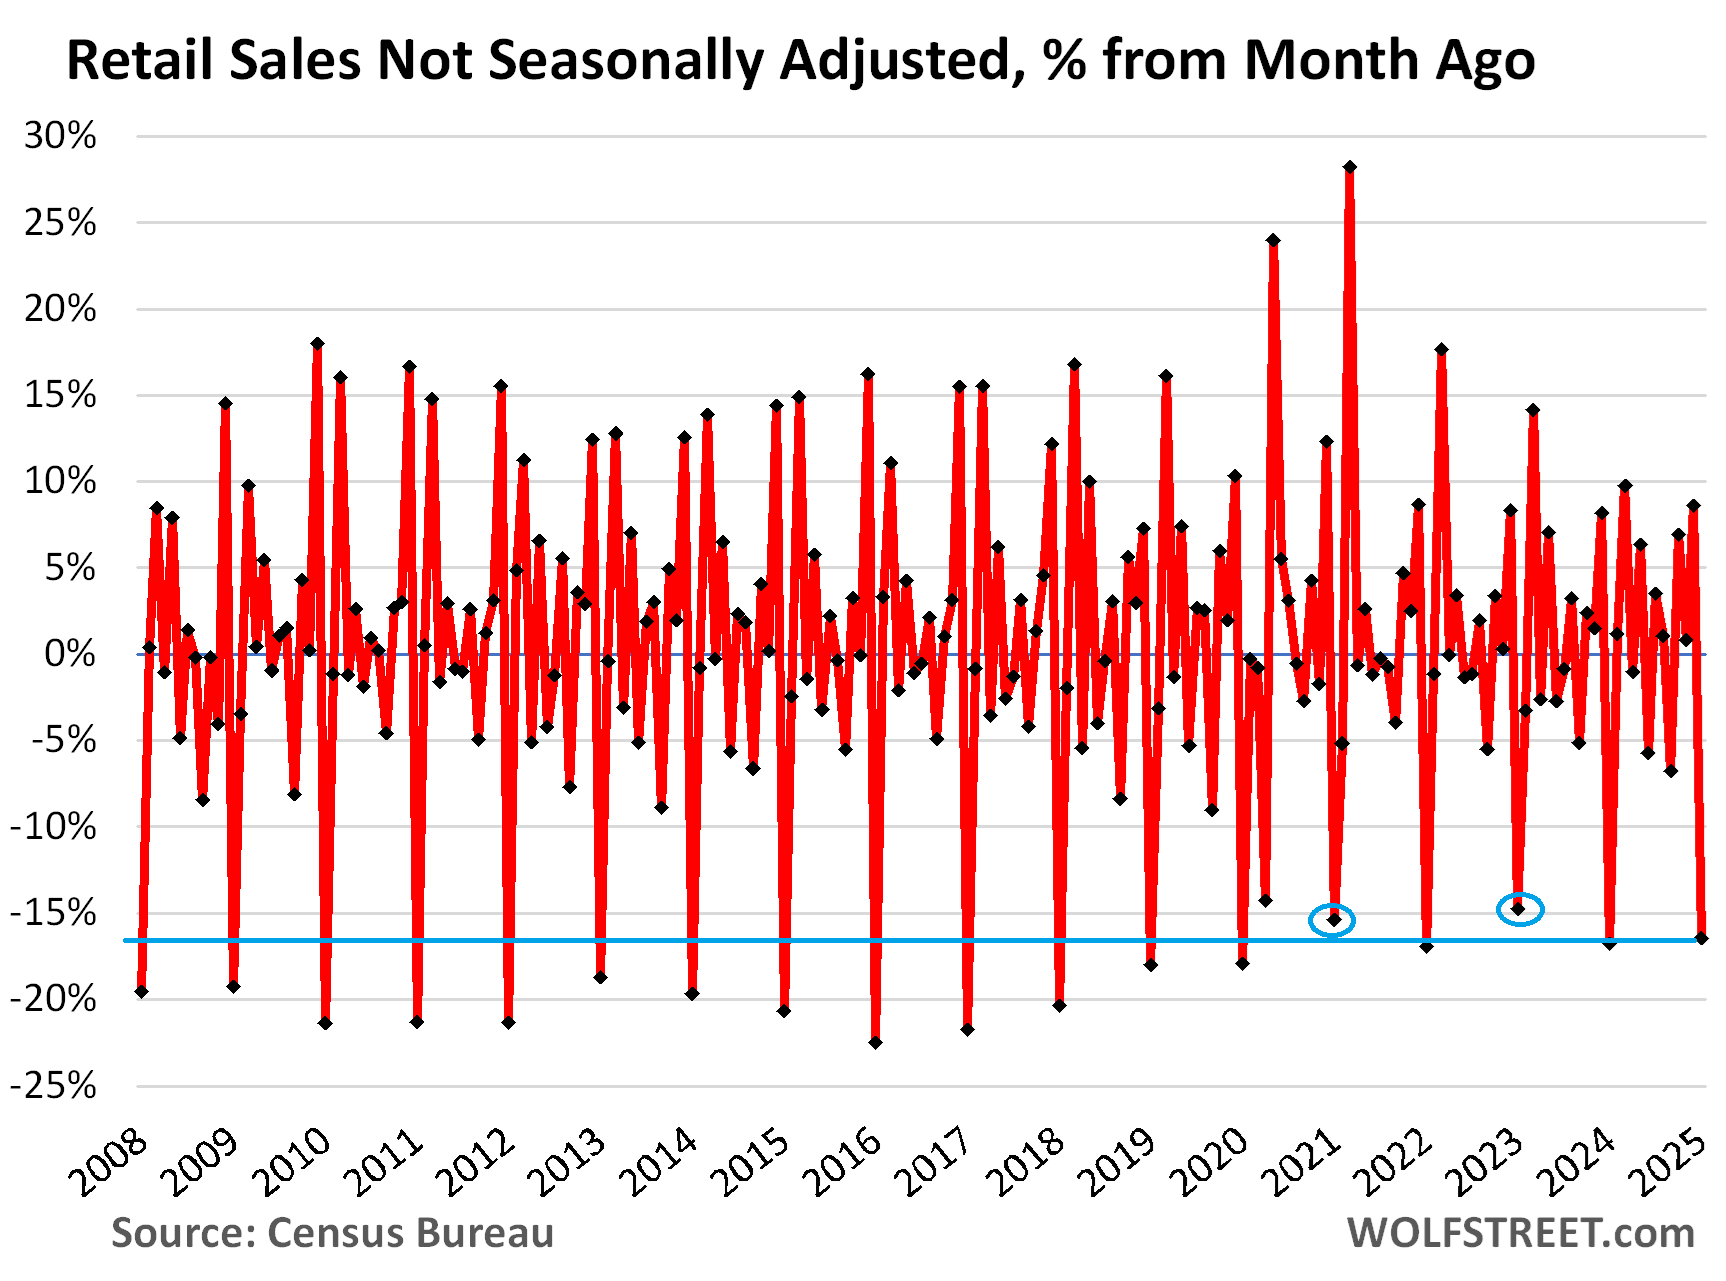
Retail sales are hyper-seasonal. In December, retail sales explode. In January, retail sales implode, and retailers deal with the hangover. Gift-buying and holiday-spending is over, and here come the returns (negative sales).
For department stores, sales in January collapse by 40% to 50% from December. This January, they collapsed by 44.4%, but that was less than last year’s 46.0% collapse and less than the 48.4% collapse two years ago. Other retailers see less of a drop.
Huge seasonal adjustment factors are used to reduce December sales and to increase January and February sales, with the purpose of leveling them out (NSA = not seasonally adjusted; SA = seasonally adjusted).
December:
- NSA sales: $800 billion
- SA sales: $730 billion
- Seasonal adjustment: -$70 billion.
January:
- NSA sales: $668 billion
- SA sales: $724 billion
- Seasonal adjustment: +$56 billion.
The seasonal adjustment factor attempts to account for seasonal variations and differences in “trading days” and how holidays fall. For example, Christmas Day, when most stores are closed, fell on a Wednesday. In years when it falls on a Sunday, there’s an extra trading day in December that needs to be adjusted out. The Census Bureau’s X-13 ARIMA-SEATS software program calculates these seasonal adjustment factors, based on numerous historical data points.
- NSA: -16.5% month-to-month, to $668 billion, +4.8% year-over-year
- SA: -0.9% month-to-month, to $723 billion, +4.2% year-over-year:
Seasonal adjustments at the Big Three.
Sales at auto & parts dealers, at nonstore retailers (mostly ecommerce), and at food services and drinking places (restaurants, bars, cafes, cafeterias, etc.) combined account for over half of total retail sales. And they have different seasonal patterns. But Januarys stink at all of them.
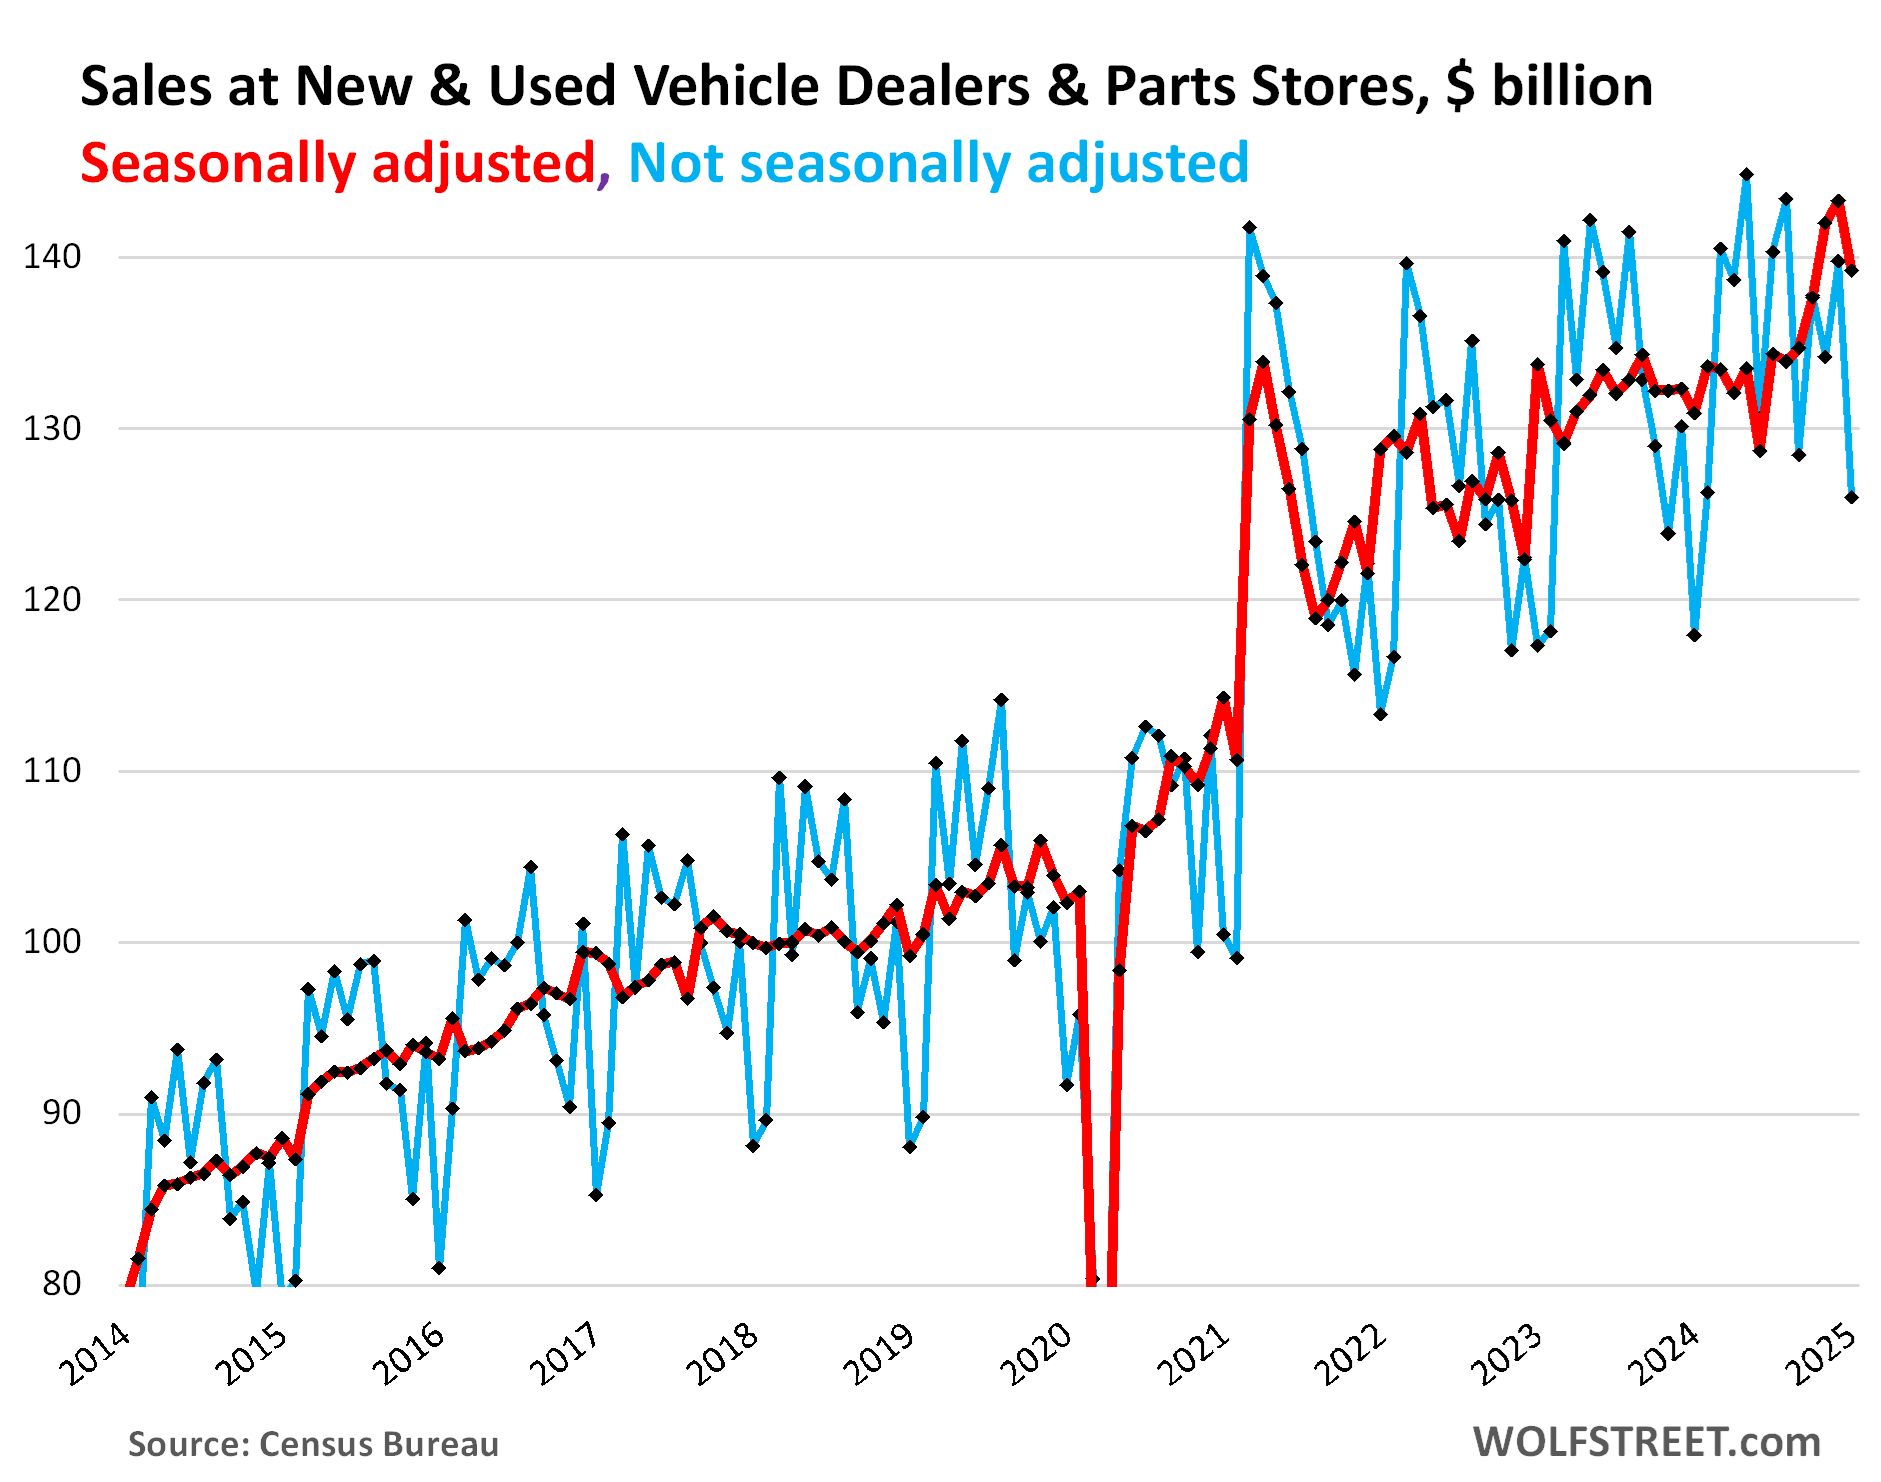
For auto dealers, the best month of the year is in the spring or summer. One of the months from March through August is typically the peak of the year. Decembers are middle-of-the-road. And Januarys are the worst, they just suck. And February is not much better. But in March, the floodgates open. That’s the rhythm with auto sales, they did that in my time, and they still do.
This January:
- NSA sales: -9.9% month-to-month, +6.8% year-over-year.
- SA sales: -2.8% month-to-month, +6.4% year-over-year.
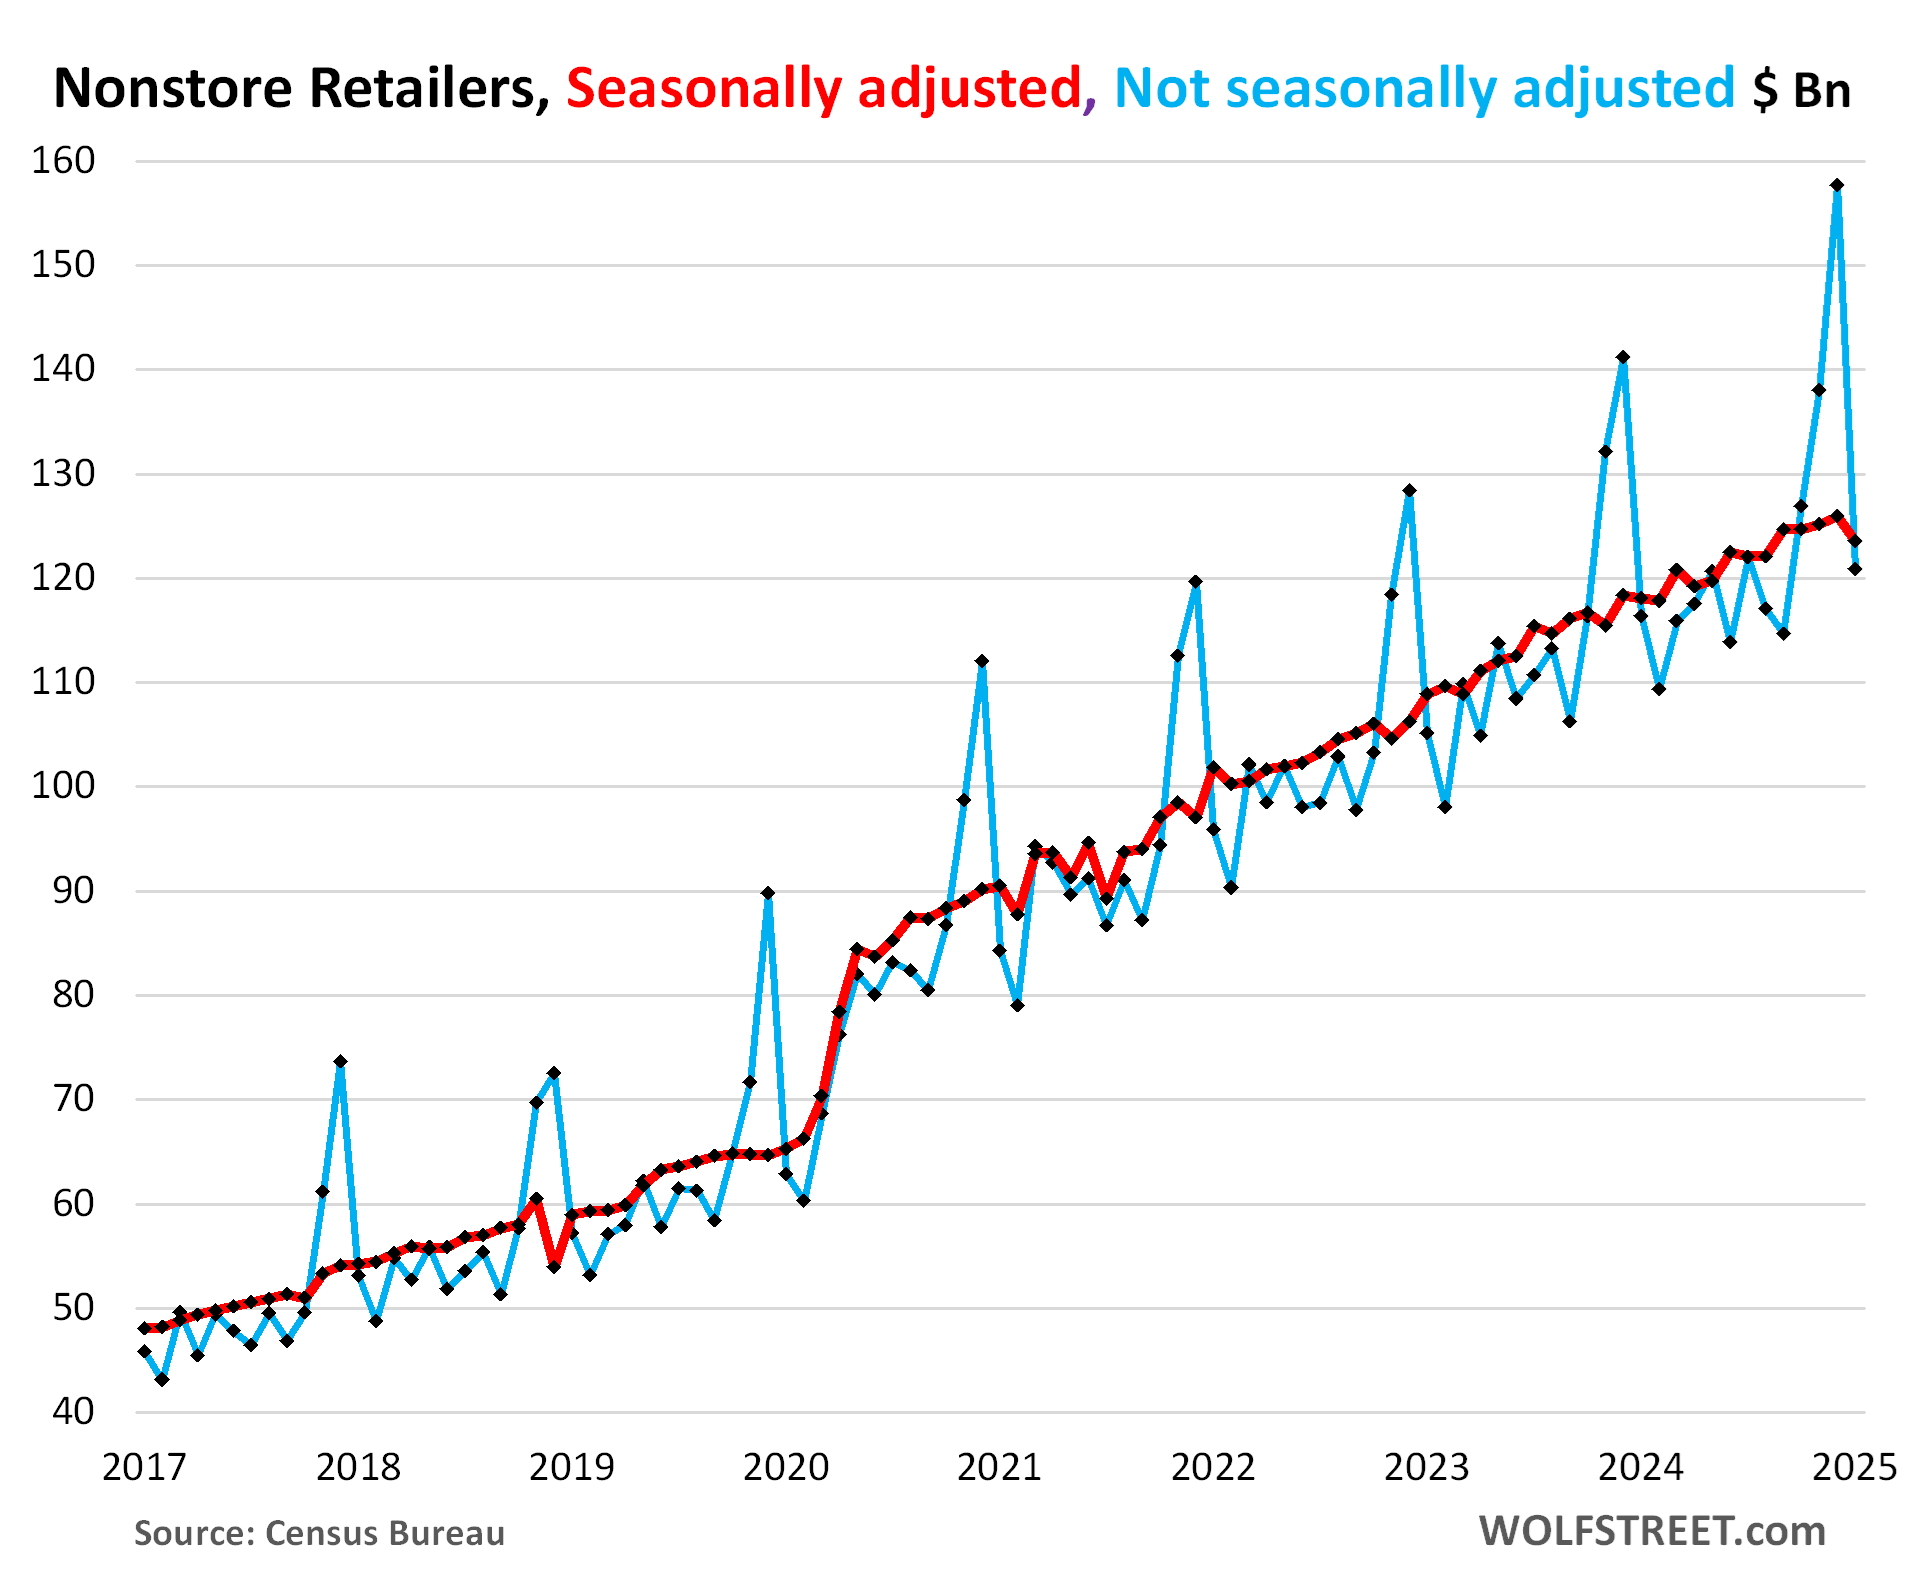
For nonstore retailers (mostly ecommerce), the best month by far is December, while January or February is the worst month of the year.
This January:
- NSA sales: -23.3% month-to-month, +3.8% year-over-year.
- SA: -1.9% month-to-month, +4.7% year-over-year.
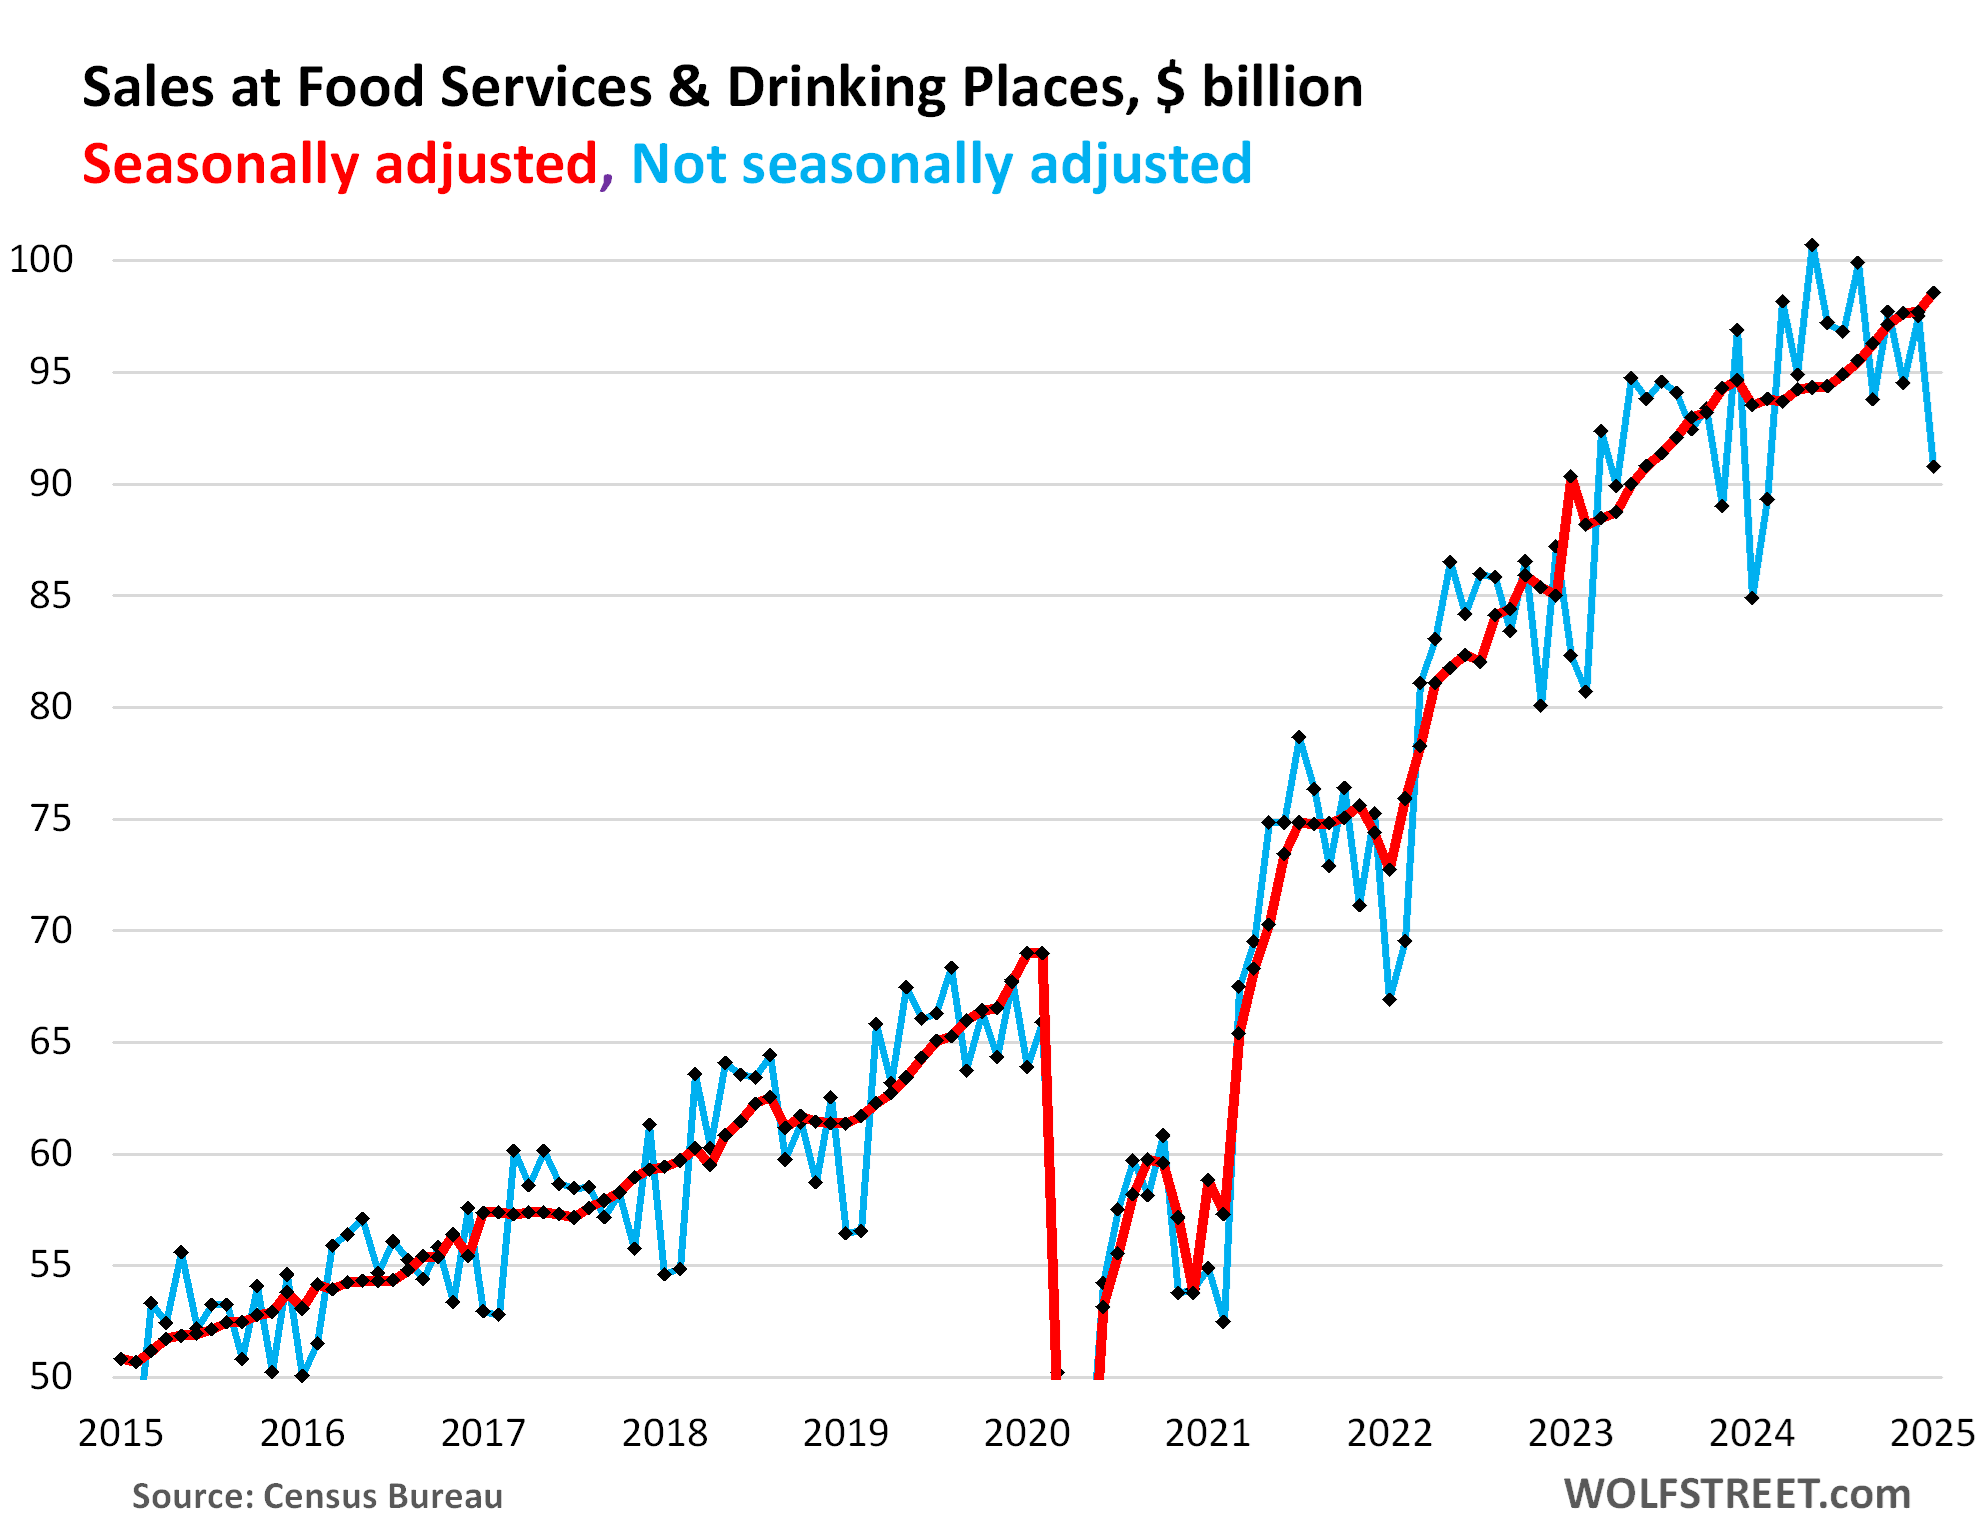
For food services & drinking places, late spring and summer are the best months, January and February are the worst.
This January:
- NSA: -6.9% month-to-month, but +6.9% year-over-year.
- SA: +0.9% month-to-month, and +5.4% year-over-year.
So what does this mean?
For most retailers, January always sucks. That’s kind of what this means. But this January, actual retail sales (NSA) sucked less than January a year ago, they were up 4.8% from a year ago, despite winter storms and whatnot. January and February retail sales data are never conclusive about the direction of consumer spending because the huge and erratic seasonality in those months makes it impossible to draw broader conclusions about the consumer. What I can say is that the retail sales data today doesn’t tell me to start worrying about the consumer, suddenly, after the huge record December.
Enjoy reading WOLF STREET and want to support it? You can donate. I appreciate it immensely. Click on the mug to find out how:

![]()
Mortgage News Daily: Best Levels of The Week After Downbeat Data
Lots of Hopeium in the real estate space right now.
if i were dictator of the united states at this point, i’d nationalize the housing market.
The existential question, is sales growth the correct metric to measure the quality of life ?
My interpretation of sales growth in nominal dollars has a certain swag which could mean at least three different scenarios for the future of the world. The plus, the minus, or the plus-minus.
c’est la vie.
Good point that YoY change is probably the best gauge. Seasonal adjustments are often helpful, but looks poor here.
Year over year, yes, but to know how a typical person is doing, one must adjust for both inflation and population growth (“real per person retail sales”).
Real per person retail sales are down year over year. The reported growth is all due to inflation and population change, not to improvements in standards of living.
The long-term trend is also interesting. The St. Louis Fed’s database goes back 33 years, and the story goes like this:
Real per person retail sales rose 25% from 1992-2000, then went nearly flat for 8 years from 2000-2007, before plunging 15% in 2008 in the Great Recession. Growth resumed after the Great Recession, but adjusted for inflation and population, retail sales did not return to the 2005-2007 peak for 12 years, until the COVID stims in 2020-2021. Those drove retail sales wild since much of the service economy was frozen. That COVID high has been wearing off ever since.
Real per person retail sales, as of this latest report, are back to just slightly above the 2005-2007 peak. Average “progress” from 2005 to 2025 was just 0.1 to 0.2% per year (2-4% TOTAL over 20 years). This 20-year stagnation in living standards is part of why many are unhappy about the economy.
Ignorant braindead math-challenged BS
1. You linked a chart that some dufus made and saved on FRED that adjusted retail sales to overall CPI. That is braindead ignorant BS. CPI is dominated by services, core services account for 64% of CPI, and inflation is in services. But retailers don’t sell services, they sell goods. Inflation, even before the pandemic, has been in services, not in goods. And you idiots are adjusting retail sales of goods to inflation in services (rent, healthcare, insurance, subscriptions, etc.). You gottta adjust retail sales to the inflation of goods. But wait…
2. Durable goods prices — the biggest category of goods that retailers sell – have dropped YOY = DEFLATION in durable goods. We have discussed this here endlessly. See link below from two days ago. In January, durable goods CPI was down 1.2% yoy. So that has the opposite effect, retail sales adjusted for deflation in durable goods were HIGHER than not adjusted. Inflation is in services, but retailers don’t sell services. Don’t you ever read anything here???
https://wolfstreet.com/2025/02/12/beneath-the-skin-of-cpi-inflation-worst-month-to-month-acceleration-of-cpi-since-aug-2023-on-spikes-in-used-vehicles-non-housing-services-food-energy/
3. Population growth in 2024 was 0.9%.
So do the math if you can:
— retail sales: +4.8% YOY
— durable goods inflation: -1.2% yoy,
— so “real” retail sales, adjusted for this deflation: ca +5.5% yoy
— population growth: +0.9%
— real per capita growth in retail sales: ca. 4.5%
4. I’m so sick and tired of people abusing my site to spread this stupid ignorant BS day after day after day. Go somewhere else to spread ignorant crap.
Real personal consumption expenditures per person shows remarkably steady growth. After adjusting the amount people spend for inflation and population growth, every year every person (on average) spends about $600 more each year. This has been true for over 50 years, with only a very few minor variations: the Great Recession paused this trend for 7 years, and the pandemic stimulus reaccelerated it to return to the previous trend.
As a result, people spend 4 times more (after inflation) than they did in 1960, and twice as much as in 1987
The same, BTW, applied to real disposable personal income per person (income after taxes). It too has increased by an amazingly constant $600/year for over 60 years, with very similar looking blips.
Both of these numbers increased by about $1000 in 2024
Of course one has to recognize whether it was a bad or a good year.
God knows that everyone has them.
Drunken sailors maybe had 1 less day at port and spent the day drinking instead of retail shopping
Those sailors can still shop online while the vessel is underway – you have cell service if you’re not too far from shore.
Thanks to Skynet… err Starlink Tmobile has authority to track, err “provide service” to everyone everywhere now!
NO excuse not to order a Garmin, while you’re lost in the wilderness!
Then they can drive an armored cybertruck to the rescue! I assume those will soon be replaced by a SpaceX drone.
E-commerce has a hold of MY bank account (I like the Amazon’s subscribe/ save), since it’s tough to get a reasonable priced store near me.
Otherwise it’s a Walmart pickup (I assume the click list is recorded as a brick/ mortar sale) for most of the groceries.
Like many commenters here: I have never liked shopping in stores. HOWEVER I don’t believe brick-n-mortar will disappear.
I see a possibility of a more “showroom” style experience for many things (especially durable goods). That allows me to “test drive” the various models/ brands, all while spending more dollars on a tasty snack or beverage, and surrounded by other entertainment options (amusement rides, night clubs, casinos or a play place for the kiddos).
Of course, the extra space will be used for residential development, to keep the people close to the money pits!
Speaking of sailors how about Musk at the behest of a president that thinks that Benito Mussolini had the right ideas.
Musk needs to be publicly audited.
Aren’t Tesla and all publicly traded firms ALL audited annually. Its what protects investor from what our government has apparently been doing for decades.
SA = seasonally mal-adjusted
Wolf – So you covered most of the year for auto sales. Where do September to November fall? I assume they are average months? I had heard previously that October was a good month to buy.
Thanks.
On a scale of 1 to 10, with 10 being best, I would say about:
Sept 5
Oct 4
Nov 3
Dec 5
Jan 1
Feb 2
Mar to Aug: 8-10
Thanks.
But the worst month for retail sales in countries in the Southern Hemisphere is July, so it can’t be due to weather.
Winter in the Southern Hemisphere is June, July and August.
I didn’t realize I didn’t need to go north to escape the Southwestern summer heat, I can also go south. Imagine that
I purchased quite a few car parts mail-order last month. Doing my part to push up those NSA January sales!
“Decembers are middle-of-the-road.”
I always wondered how many people actually purchased cars as X-mas gifts. All the holiday car commercials seem to imply it’s a very common thing to give for a gift.
ShortTLT – Oversized bow sales track December auto sales.
It’s not as gifts normally, though there is some of that. But it’s the end of the year, and a lot of loose ends get tide up, some people have tax reasons, some people spend their bonuses, etc. There is also a lot of advertisement and specials to pull out the year, etc.
I found that mid-January was a good time too sweat the scoundrels that were dedicated to forcing me to pay more than I originally agreed too.
On the other hand, if those salesmen were not there, then I would not have undercut their price by 3000 in 2000 dollars.
What are the salesmen going to do now that most every market is saturated with drivel.
It feels like markets are always looking for reasons to send yields lower (and stock prices higher), consistent with the Federal Reserve’s still-dovish bias for the longer term.
They overreact especially strongly to downside misses on retail sales, manufacturing, housing starts, and other notoriously noisy data sets that are secondary to the Federal Reserve’s 2 mandates.
The hot CPI report yield spike lasted for all of a day. 10Y+ yields have declined for the past 5 weeks, with the Jan 10th top aligned perfectly with the S&P 500’s year-to-date bottom.
It just goes to show that some indicators might be better left at year to year (like retail sales), and some like cpi are probably okay month-to-month, realizing of course these are all estimates. Seasonal adjustment is always risky, because it is based on models made using historical data. There is this thing called structural change, that occasionally can make a mockery of seasonal adjustment models.
It might be informative if a data expert like Wolf (I am not being facetious, I think Wolf is excellent) would rank the most reliable indicators, based on how they actually reflect reality, in his opinion. And then also rank changes in such indicators based on how they actually reflect changes in reality. Perhaps a useful measure would be the size of revisions over time, in percent if possible. One might have to look at monthly, three month moving average, six month moving average, and annual time frames.
Of course, now we are talking about reality, which can vary from person to person, but I do know if I drop a 100 pound barbell directly onto my toe, there is a near 100 percent probability that my toe will hurt and it will be the same probability for almost everyone, except perhaps for those strung out on some drugs. That is an example of reality.
So Wolf,
Do you think retail sales would explode again just like in 2021 and 2023 (from looking at your graphs). We have a first ‘blip’ down from the usual convexity up. High probability is just a Fake up and we go higher in retail sales in the next few months? Based on your analysis so far, consumers are doing pretty well. Inflation has been going up consistently for the last 3 months.
Your thoughts? Thanks.
I’d say let’s wait until March maybe April to declare a decline in consumer spending.
Especially with the up revisions this was a nothing burger.
One possible driver for the January sales is the very cold weather we have been having in the South and the East. In Tennessee, we had a lot of days barely above freezing and several snow/ice events. Less people going out shopping plus everyone is broke from Christmas. Supposedly it was the coldest January in 11 years.
I think February sales could also be lower due to the impact of much higher utility bills from the January freeze. I just got my electric bill for January, and it was 40% above the previous 3 year January average.
I blame it on that damn groundhog.
Some of these charts clearly reflect the feds asset purchases during COVID. The jump in the chart where after the jump it keeps rising at the same pace as better. They’re clearly telling me that the Fed has a lot of room to wind down the MBS balance sheet at a much higher rate without tanking the economy.
Wolf: how does the government obtain retail sales figures? BEA? Sales tax receipts by state (so don’t have sales tax, so estimate.)?
The Census Bureau obtains this data from the retail locations themselves where these products were sold. These figures are the revenues reported by these retail locations and extrapolated to the total industry. They’re not consumer surveys.
From the Census Bureau:
What kinds of businesses are included in the Advance Monthly Sales for Retail and Food Services (MARTS)?
MARTS covers firms classified in the Retail Trade and Food Services sectors as defined by the North American Industry Classification System (NAICS). Retail Trade, as defined by NAICS sectors 44-45, includes establishments engaged in selling merchandise in small quantities to the general public, without transformation, and rendering services incidental to the sale of merchandise. Two principal types of establishments classified in retail trade can be distinguished-
1. Store retailers operate fixed point-of-sale locations, located and designed to attract a high volume of walk-in customers. They have extensive displays of merchandise, use mass-media advertising to attract customers and typically sell merchandise to the general public for personal or household use. Some store retailers also provide after-sales services, such as repair and installation; for example, new automobile dealers.
2. Nonstore retailers also serve the general public, but their retailing methods differ. Such methods include paper and electronic catalogs, door-to-door solicitation, in-home demonstration, “infomercials,” selling from portable stalls or through vending machines.
Food services, as defined by NAICS subsector 722, include establishments that prepare meals, snacks, and beverages to customer order for immediate on-premises and off-premises consumption.
Thank you!
This may not be 100% accurate, but it is the truth for some businesses….
the term “Black Friday”, the day after Thanksgiving,, and what was the traditional start of the Christmas shopping season, refers to the pivotal point where retailers purportedly shifted from loss (“in the red”) to profit (“in the black”).
Now it seems they are announcing Black Friday sales before Hallowed. 😁
One home builder near me announced “year end blowout” which is similar to Black Friday sales but he never pulled the signs down.
Great article Wolf, thank you. I noticed reading Reuters this morning, they mentioned that weather, fires, and even panic buying as potential underlying reasons for the January dip. Seems strange to mention factors like that after learning about seasonality in your article. But, it got me curious, might you comment on panic buying and how it may shape future data? I noticed through January and early February that many folks in my community (at Costco and WinCo) have referenced “stocking up to stay ahead of those tariffs” – type comments. A few parts of the shelves have been a little more empty than I have typically seen. Full disclosure, I could be picking up on their anxiety :) Thank you!
We had panic-buying during the pandemic, and we saw what it did. But now, there is no “panic-buying.” Some people might have tried to move their purchases forward, such as EVs in Nov-Dec, before the incentives might go off, and we’ll see if that actually was big enough to make a visible dent into the numbers in Q1. These are huge numbers, $668 billion in retail sales in just one month. So if a few thousand people changed their behavior, it’s not even a rounding error in the $668 billion.
We did see some COMPANIES try to front-run any tariffs, so imports surged at the end of the year. But that’s not retail sales, that’s just imports that went into a warehouse.
Copy that Wolf, makes sense. Appreciate you!