Energy spike is still to come. And today’s GDP inflation measure was revised up to 3.8%, worst since Q4 2022. The Fed needs to pay attention.
By Wolf Richter for WOLF STREET.
The Fed is going to talk a lot about inflation – as are households – given the spike in oil prices that started in March and that has already driven up prices of gasoline, and that is going to drive up overall inflation indices starting for March. But oil-price spikes tend to reverse, and to see longer-term underlying inflation trends, the Fed is also going to talk about “core” inflation measures that exclude the volatile energy components (such as gasoline) and food.
The Fed’s favored inflation measures are the all-items PCE price index, which includes food and energy, and the core PCE price index, which does not include them. The Fed uses them as yardstick for its 2% inflation target. But since May last year, PCE inflation has moved further away from the target, well before the energy price spike that is now coming at it.
The all-items PCE price index rose by 2.8% in January compared to a year ago, and the core PCE price index accelerated to 3.1%, according to the Bureau of Economic Analysis today.
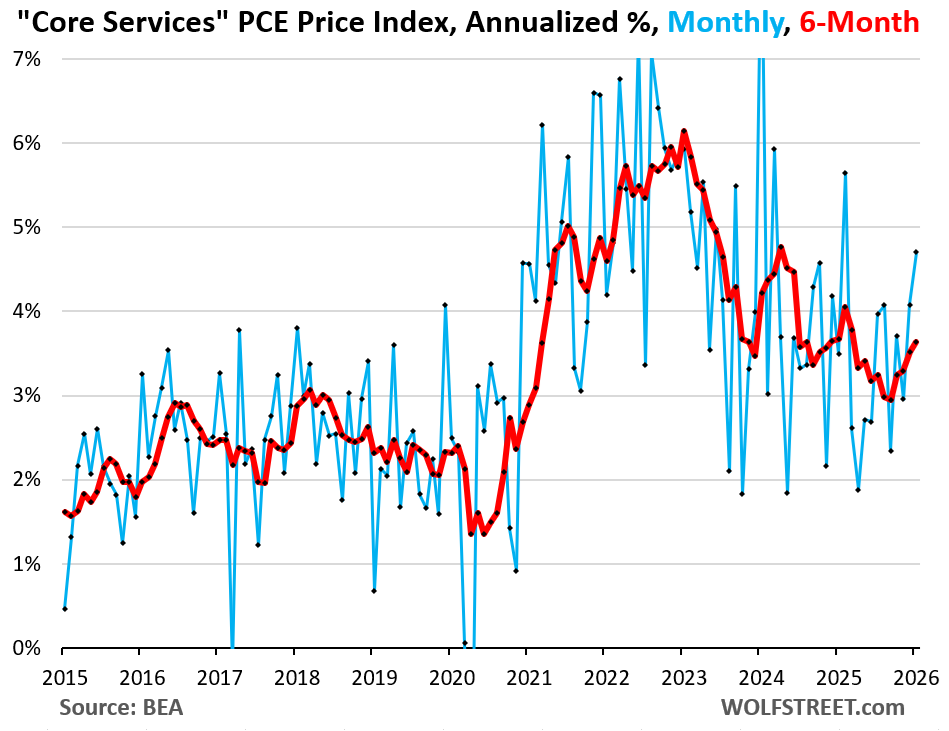
It was driven by the disturbing acceleration of underlying inflation, which is dominated by core services. Core services account for roughly 60% of the overall PCE price index.
The core services PCE price index accelerated sharply both, on a month-to-month basis (+0.38% or +4.7% annualized, blue line in the chart), and a 6-month basis (+3.6% annualized, red line). This acceleration in January came on top of the acceleration in December.
Year-over-year, the core services PCE price index accelerated to 3.4%. And it did so despite the deceleration of its housing components.
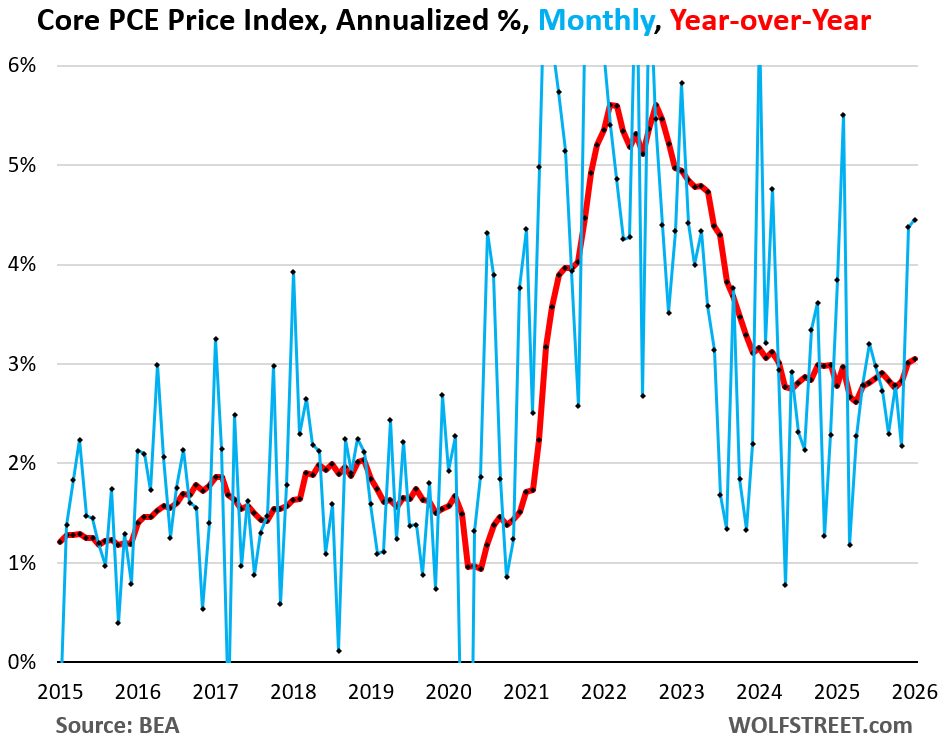
The core PCE price index, driven by core services, jumped by 0.36% (+4.5% annualized, blue line) in January, after the big jump in December.
Year-over-year (red line), it accelerated to 3.1%, the worst in nearly two years. It has been zigzagging higher and ever further away from the Fed’s 2% target since May 2025.
But wait… CPI has been cooling for months.
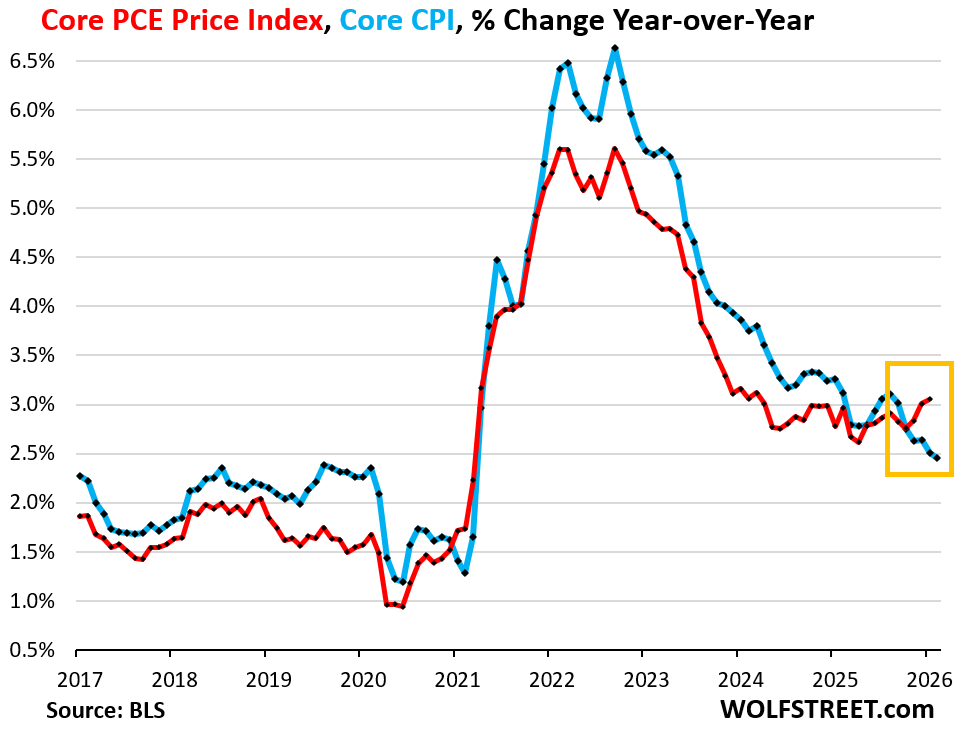
Normally, the core PCE price index shows lower inflation readings than the core Consumer Price Index. But now they have gone in opposite directions: the core PCE price index has been accelerating for months and hit 3.1% in January, worst in nearly two years, while the core CPI has been decelerating for months to 2.5% in January.
That they shoot off in two different directions by that much is a unique twist. And there is a reason for that, and it has to do with a problem in CPI.
The chart shows the year-over-year change of the core PCE price index through January (red, data released today by the BEA) and of core CPI through February (blue, data released earlier this week by the BLS).
This is a very disturbing trend:
So what gives? CPI is getting pushed down by the housing components, especially Owners Equivalent of Rent (OER), that were doctored for the three months September, October, November, and that weigh 35% in the overall CPI (my detailed analysis for data geeks is here).
The PCE price index uses the same housing components, but they weigh only half as much in the index, only about 17%, and they also pushed down on the PCE Price index, but with half as much force as in CPI. The PCE price index also includes other components that the CPI does not include.
The all-items PCE price index was pushed down in January by its energy components that plunged month-to-month by 1.7% (-18.9% annualized). But that was for January. Energy costs, especially gasoline and utility natural gas piped to the home, already jumped in February. And in March, there will be the spike in gasoline prices that is now underway. So the month-to-month plunge of the PCE price index for energy in January was the final leg of the long decline since mid-2022.
But energy is a big component, and its huge plunge in January was enough to push down the overall year-over-year PCE inflation rate by a hair, to 2.8%, despite the surge of core PCE and core services PCE.
The chart below shows all three, on a year-over-year basis: the all-items PCE price index (red), the core PCE price index (blue), and the core services PCE price index (yellow):
The Fed’s target is 2% for PCE inflation. And PCE inflation has been going the wrong way and moving further away from the target since May 2025.
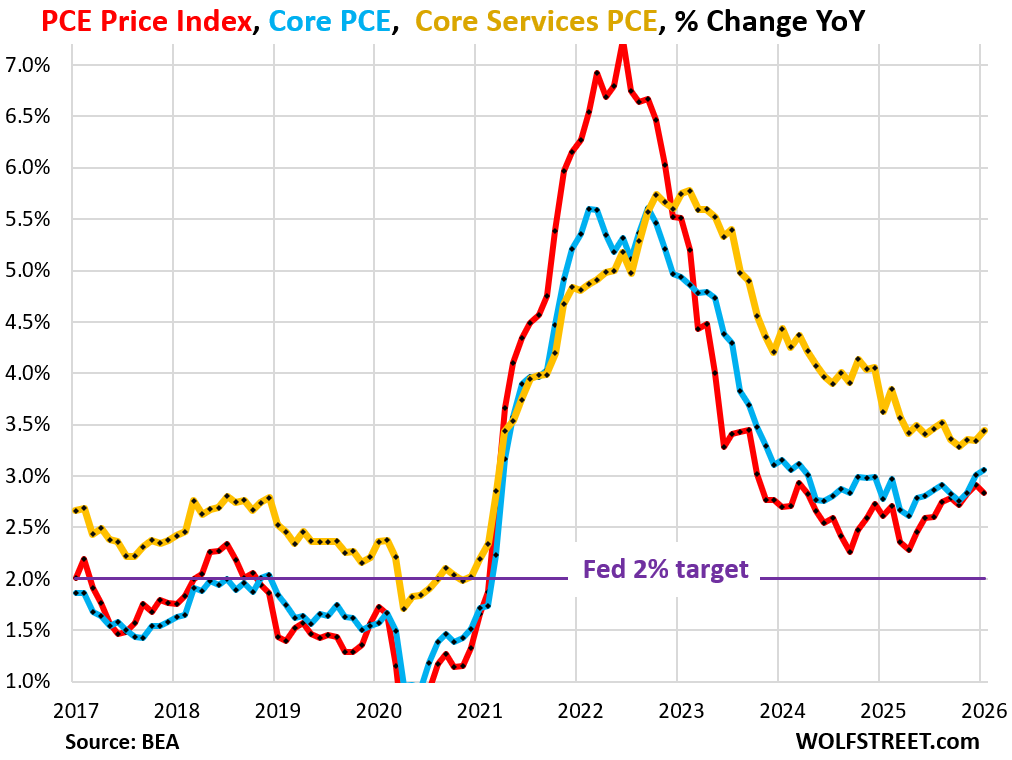
The energy price spike in March will come on top of it.
The Fed needs to pay attention to inflation. As we can see in the core PCE price index at 3.1%, inflation is already percolating through the economy, aside from energy. The gasoline price spike will come on top of all this starting in March.
There is a lot of stimulus in the economy: Government deficit spending, tax cuts for companies and individuals, bigger tax refunds to consumers now during tax-refund season, massive corporate investments in anything related to AI, too-low interest rates, and too narrow spreads. Inflation feeds on these combined conditions.
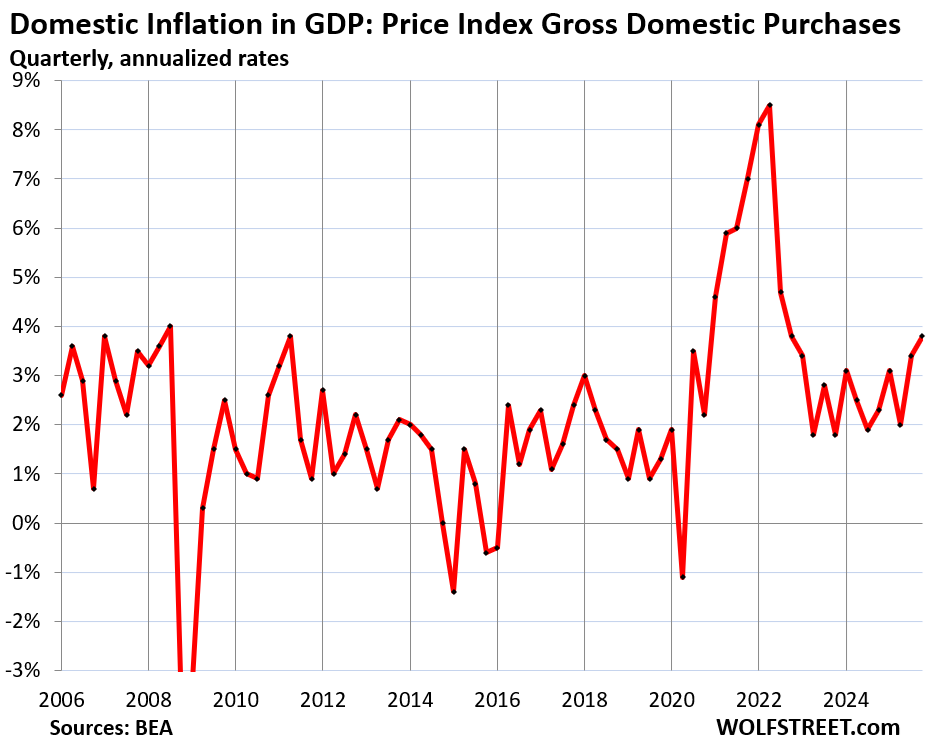
And domestic GDP inflation surges to 3.8%.
The BEA also released its revised GDP data for Q4, including the Price Index Gross Domestic Purchases, the broadest inflation index for domestic inflation, which excludes import prices. It was revised up to 3.8% for Q4 annualized, the worst since Q4 2022:
In case you missed it:
Energy Inflation for Americans
Enjoy reading WOLF STREET and want to support it? You can donate. I appreciate it immensely. Click on the mug to find out how:

![]()
Call me crazy but charts can be great predictors of the future. It seems traders are aware of the fundamentals and enter times of decision/indecision that are reflected i the charts? Who knows? Your analysis here today who conclude bond traders to sell and drive up yields. Then there is this i came across which is a casual confirmation of the fundamentals you have laid out. IMO own “I see entrails” opinion.
I found this on yahoo which for once I actually agree with(confirmation bias!)
So about to pass six continuous years of PCE above target. Is there a point where we just stop believing that’s the target? 7 years? 10 years?
After a certain amount of time passes I think we have a different word in our language for a promise not kept: a lie.
Sorry, five years. I mathed the axis of that graph wrong. I guess we have another year or two to hit the snooze button.
Trump’s campaign against Fed chair Jerome Powell dealt crushing blow in court
A federal judge has quashed two subpoenas the Justice Department issued to the Federal Reserve.
Thanks for this. Any idea why the Bureau of Economic Analysis uses OER from the BLS CPI report at all. It’s a dumb measure of the cost of homeownership for existing homeowners. Then maybe add some other measure to account for the cost of purchasing a house? Between the health insurance and homeownership indexes, it seems like CPI is vastly underestimating effective consumer prices right now, and it’s a bit distressing that BEA is carrying over that error into the GDP accounts. But I don’t know all the details.
It’s actually the Census Bureau that sends out the housing surveys and obtains the raw data, including for OER and for Rent. Both the BLS and the BEA use that data. The Census Bureau does most of the actual data collection, and the other agencies use it in various ways.
I just updated the article with this:
The BEA also released its revised GDP data for Q4, including the Price Index Gross Domestic Purchases, the broadest inflation index for domestic inflation, which excludes import prices. It was revised up to 3.8% for Q4 annualized, the worst since Q4 2022: