The bond market flipped from haven trade to inflation trade.
By Wolf Richter for WOLF STREET.
The Treasury market is caught between three dynamics: The haven trade, where worries about stocks and the geopolitical situation sent investors scurrying into safe assets; renewed fears of inflation, with oil prices taking off, on top of six months of already accelerating inflation; and fears of an onslaught of new supply as deficit spending and borrowing are likely to get a lot worse.
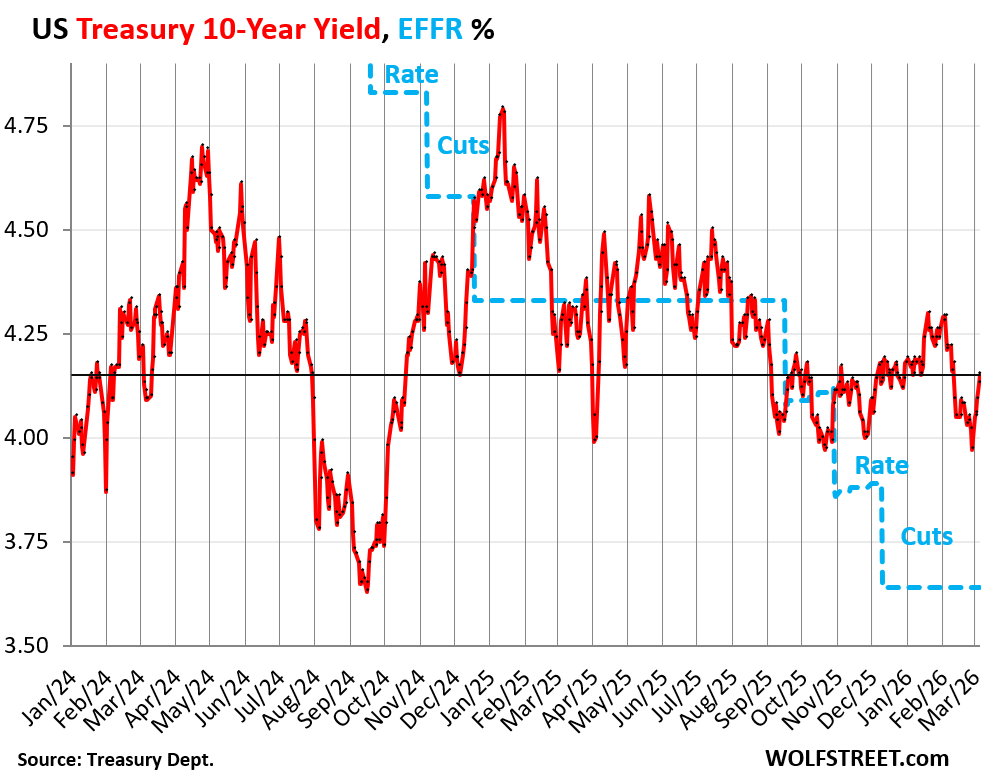
The haven trade pushes up bond prices and thereby pushes down yields. This was happening into last weekend. The 10-year Treasury yield had been dropping for days, and on Friday February 27 dropped to 3.95% despite the hot PPI reading, and fell below 3.93% in overnight trading on Sunday. But then as the US began bombing Iran, it flipped into fears about inflation and supply.
Monday morning (March 2), the 10-year Treasury yield shot up by 14 basis point on from the Sunday low, to 4.07%. And it rose further throughout the week, and on Friday March 6 closed at 4.15%, up by 22 basis points from the Sunday overnight low. The Effective Federal Funds Rate (EFFR, blue line), which the Fed targets with its policy rates, shows the rate cuts that the 10-year yield has been blowing off.
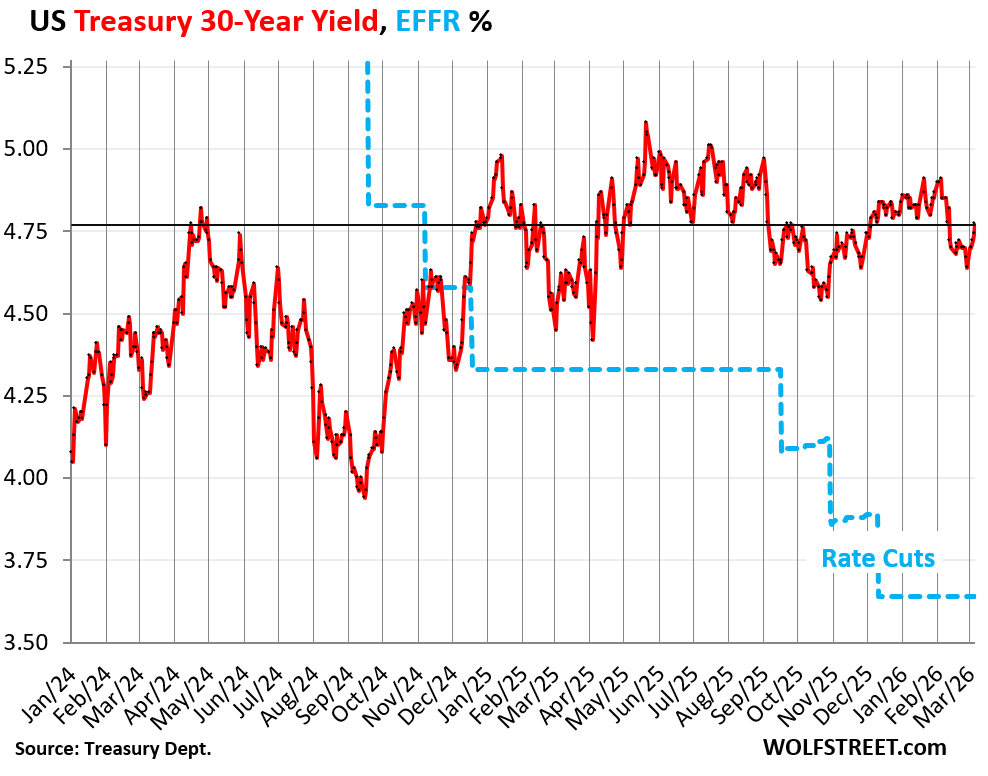
The 30-year Treasury yield rose to 4.77% on Friday, back where it had been in April 2024, before any of the Fed’s rate cuts, which started in September 2024.
The 30-year yield reacts to bond-market issues, such as expectations of future inflation and expectations of supply of new bonds that have to be absorbed; and it is not particularly influenced by the Fed’s short-term policy rates. But 30 years is a long time for inflation to go off the rails and for an onslaught of new supply.
These are big risks – and investors in 30-year paper seem too sanguine about them, or else they would ask for higher yields.
Inflation saps the purchasing power of long-term bonds; and the yield has to be high enough to compensate investors for this loss of purchasing power, and for the other risks investors are taking.
Cutting interest rates tends to spook the bond market in this inflationary environment and with so much government debt hanging out there, and more coming down the pipeline that the market has to absorb.
The bond market wants to be confident the Fed will take inflation seriously over the life of the bond. But that confidence is under pressure by Trump’s marching orders – what confidence is left over after the Fed let inflation get totally out of hand by blowing it off for a year, starting in early 2021.
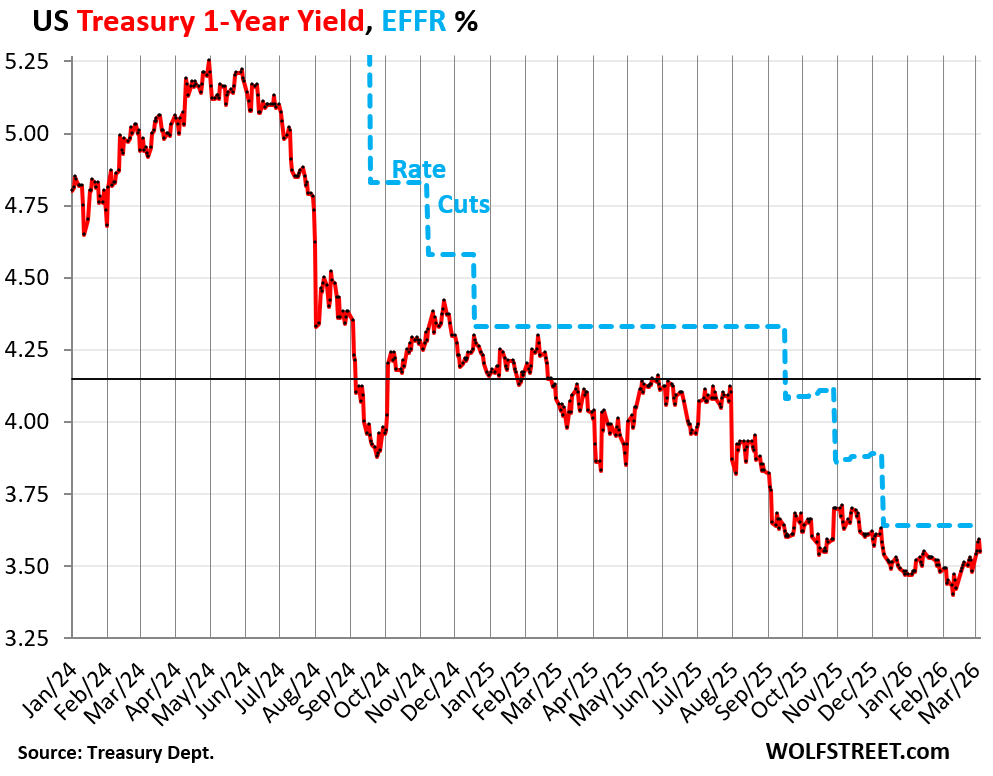
Short-term Treasury yields (1 month to 1 year) react to the Fed’s current policy rates and to expected future policy rates within the window before they mature.
And those short-term yields up to six months have edged higher this year and are now right around the EFFR, indicating that the market no longer sees rate cuts within their maturity window.
The one-year Treasury yield made the biggest move amid the short-term yields. By February 10, it had dropped to 3.40%, the lowest since August 2022, pricing in at least one rate cut this year. On Thursday, it hit 3.61%, taking that rate cut off the table. On Friday, after the weak jobs report, it backed off and closed at 3.54%.
This upward move of the 1-year yield from the low in February caused the dimple in the middle of the yield curve to flatten out, as we’ll see in a moment.
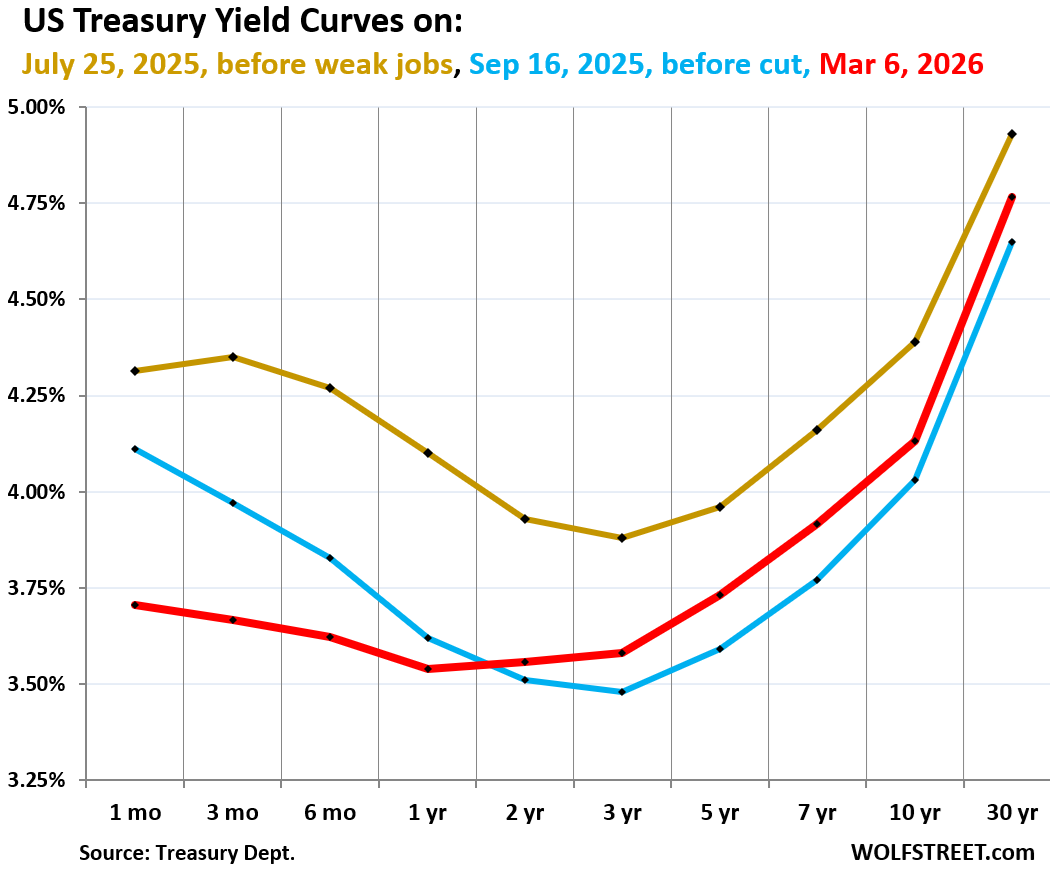
The yield curve has steepened since September 16, 2025, just before the Fed’s latest series of three rate cuts last year, with short-term yields falling due to the rate cuts, and long-term yields rising due to market conditions and fears.
And the sag in the middle is almost gone, with the 1-year yield now forming the lowest point on the yield curve, but barely, as the 2-year and 3-year yields, which had been the low points, have risen.
The chart below shows the yield curve of Treasury yields across the maturity spectrum, from 1 month to 30 years, on three key dates in 2025 and 2026:
- Red: Friday, March 6, 2026.
- Blue: September 16, 2025, just before the Fed’s first rate cut in 2025.
- Gold: July 25, 2025, before the labor market data turned sour.
Every yield from the 2-year yield and longer has risen since that September rate cut, despite hopes and predictions that long-term rates would decline when the Fed cuts its policy rates:
But the 1-month yield (3.71% on Friday) is bracketed by the Fed’s policy rates (3.50%-3.75 % since the December rate cut) and closely tracks the EFFR (3.64%). It was pushed down by the three rate cuts totaling 75 basis points since mid-September.
The 3-month through 1-year yields were also pushed down by the rate cuts, but less so.
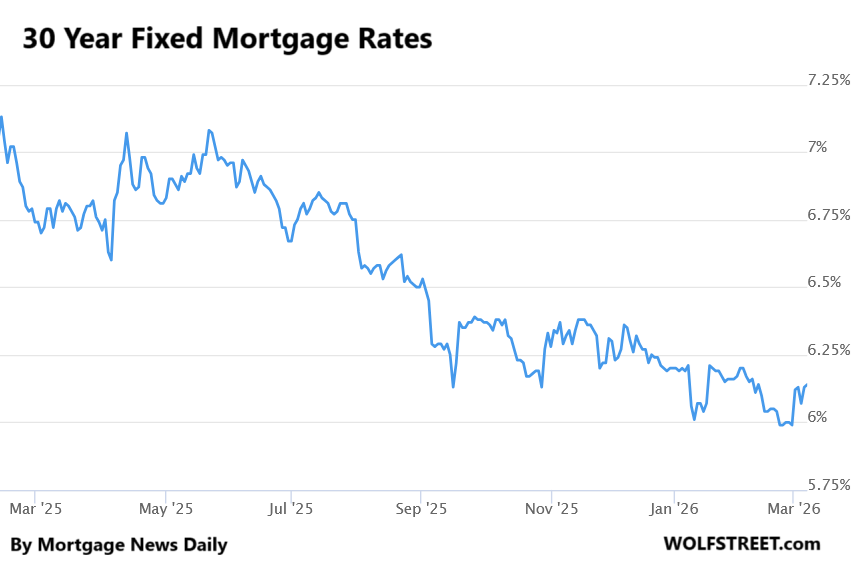
And mortgage rates jumped. The daily measure of the average 30-year fixed mortgage rate by Mortgage News Daily jumped by 14 basis points this week, from 5.99% on Friday February 27, to 6.14% on Friday, March 6. The stay below the 6% line was brief and shallow
A 6%-plus average 30-year mortgage is not high compared to pre-QE decades; it’s at the low end.
Enjoy reading WOLF STREET and want to support it? You can donate. I appreciate it immensely. Click on the mug to find out how:

![]()
Finally cancelled my wsj subscription. Bunch of fucking slop.