The annual adjustments of the labor force to the new population estimates are in, and they’re revealing.
By Wolf Richter for WOLF STREET.
We’ve been watching a big structural change happening in the labor market. And it’s starting to show up in the data.
Once a year, the Bureau of Labor Statistics adjusts its Household Survey data – total employment, labor force, unemployment, unemployment rate, etc. – to the new population estimates from the Census Bureau. The entire adjustments for that year are taken to the data for the month of January, and not carried back to the prior 12 months. And today was that day when it adjusted its January data (belatedly due to the government shutdown), and the new February data were layered on top of it.
The Census Bureau latest population estimates, released in January, showed a dramatic drop in “net migration” (immigration minus emigration) in 2025 as a result of the crackdown on illegal immigration, and the Census Bureau indicated that net migration could turn negative next year at current trends.
The supply of labor fell in 2025.
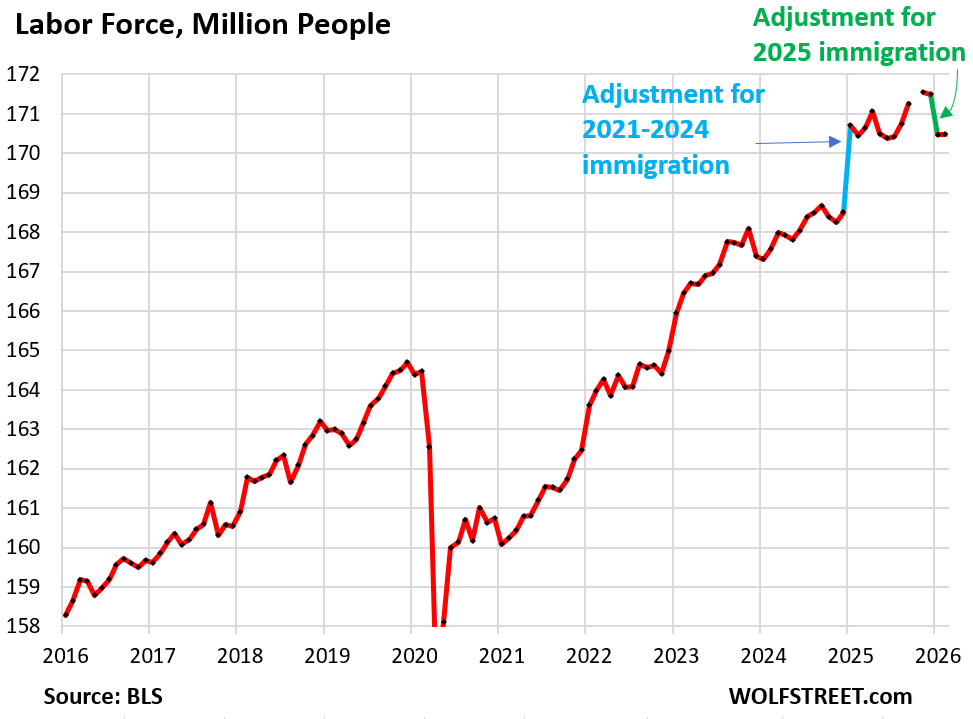
The labor force was adjusted down by 1.03 million people today for January (green segment in the chart below). And for February, the labor force grew by 18,000 people, to 170.48 million.
Last year at this time, the upward adjustment was gigantic because that was after the Census Bureau had finally figured out how to get a better handle on the huge influx of immigrants in the 2022-2024 period, and it caused the Census Bureau to dramatically raise its population data for that 2022-2024 period all in one data release. The BLS then made the massive upward adjustments to the January 2025 data (blue segment).
The labor force consists of people who are either working or are unemployed and are actively looking for a job. People who are retired and not looking for a job are no longer in the labor force. Newly arrived immigrants, regardless of status, who are either working or looking for a job, are in the labor force.
The labor force in January was 231,000 people below where it had been in January a year ago, indicating that the supply of labor declined, after soaring in prior years. This is a huge structural change for the US labor market.
At the same time, in 2025 and continuing, there was weak growth in nonfarm payrolls amid pressures from AI, automation, and in the tech world from “overhiring” in 2021-2023, as tech CEOs have been calling it, where they’re now cleaning house.
Unemployment in February, at 7.57 million, was roughly stable over the past six months, below September and November (no data for October) and above January and December.
The three-month average in February dipped a hair to 7.48 million.
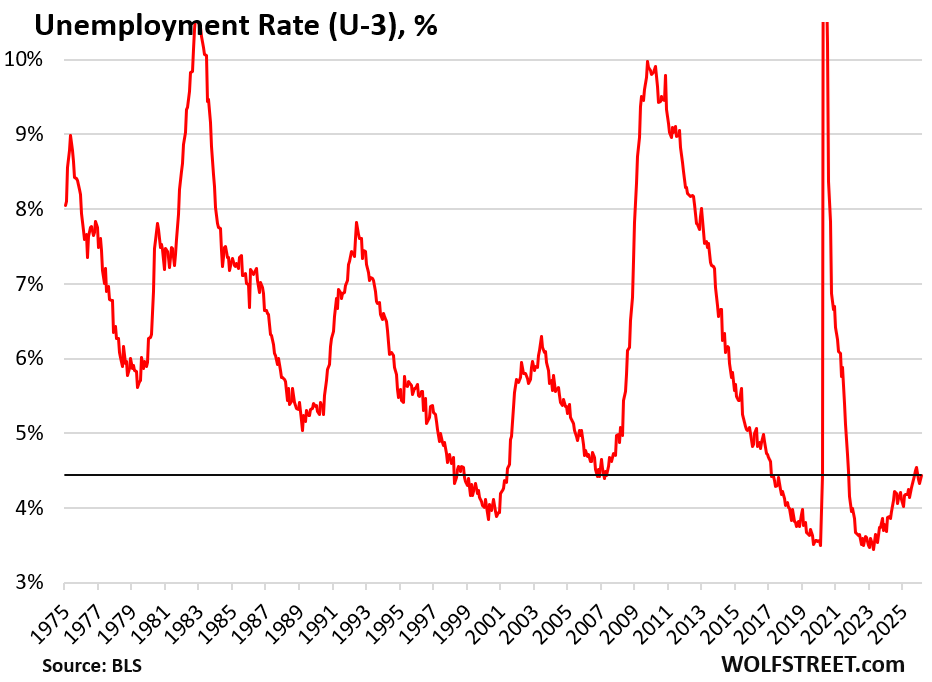
The unemployment rate inched up to 4.4% in February from 4.3% in January, but was lower than in November (4.5%) and same as in September.
The unemployment rate reflects the number of unemployed people who are actively looking for a job (7.57 million) divided by the labor force (170.48 million):
This kind of unemployment rate is at the low end of the historical scale.
Immigration crackdown: Low unemployment rate despite stalled job creation.
Job creation has slowed to a trickle over the past six months. If the labor force would have continued to grow as in prior years, that kind of stalled employment growth would have fueled a much higher unemployment rate.
Job growth over the past six months by industry:
- Construction: +70,000
- Healthcare & social assistances: +287,000
- Leisure and hospitality: +52,000
- Professional and business services: +10,000
- Other services: +51,000
- Utilities: +5,000
- Wholesale trade: +8,000.
Job declines over the past six months by industry:
- Government: -256,000
- Information: -48,000
- Financial activities: -19,000
- Transportation & warehousing: -126,000
- Retail trade: -14,000
- Manufacturing: -42,000 automation being pushed to the next level
- Mining & logging, which includes oil & gas extraction: -7,000.
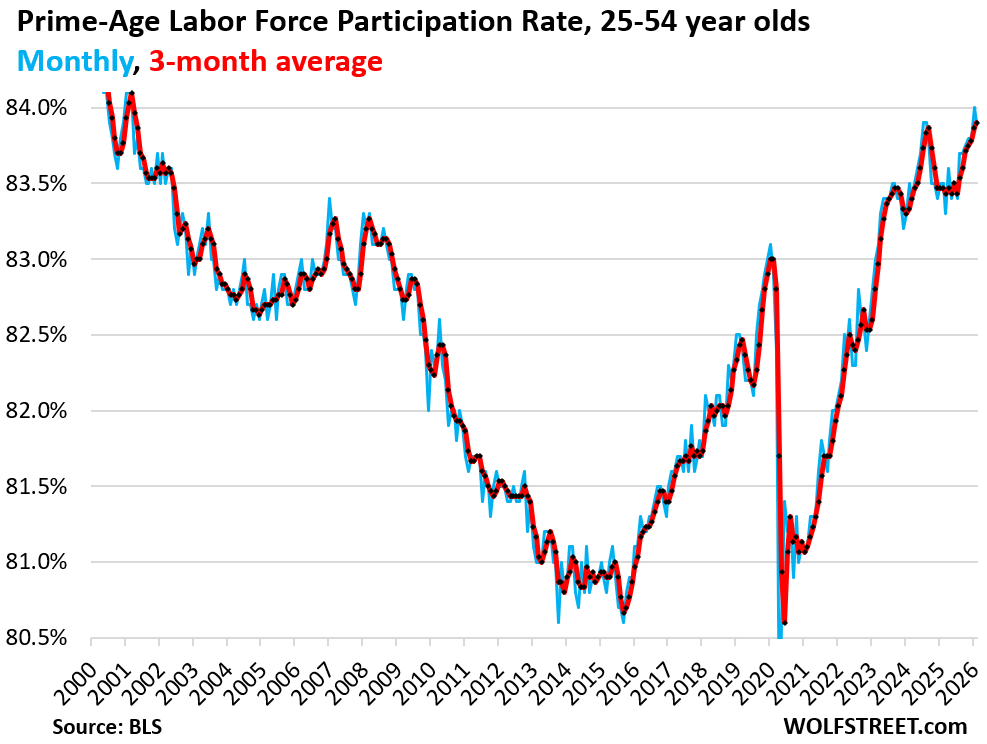
We can see this in the prime-age labor force participation rate (25-to-54-year-olds), which has been running at 25-year highs, lower only than during the extraordinary period of the Dotcom Bubble. In February, it dipped to 83.9%, from the 25-year record in January (blue in the chart below).
The three-month average rose to 83.9%, a 25-year record (red).
The prime-age labor force participation rate eliminates the issue of the retiring boomers. The overall labor force participation rate shows the percentage of the population that either has a job or is looking for a job. When people retire and stop looking for a job, they’re no longer “participating” in the labor force but remain in the population until they die. The surge of boomer retirements, which started about 15 years ago, has pushed down the overall labor force participation rate, as these retired boomers are still in the population but no longer “participating” in the labor force.
The high prime-age labor force participation rate speaks of the lower supply of labor in 2025 due to the crackdown on illegal immigration and its impact on overall population size, and of some strength in the labor market.
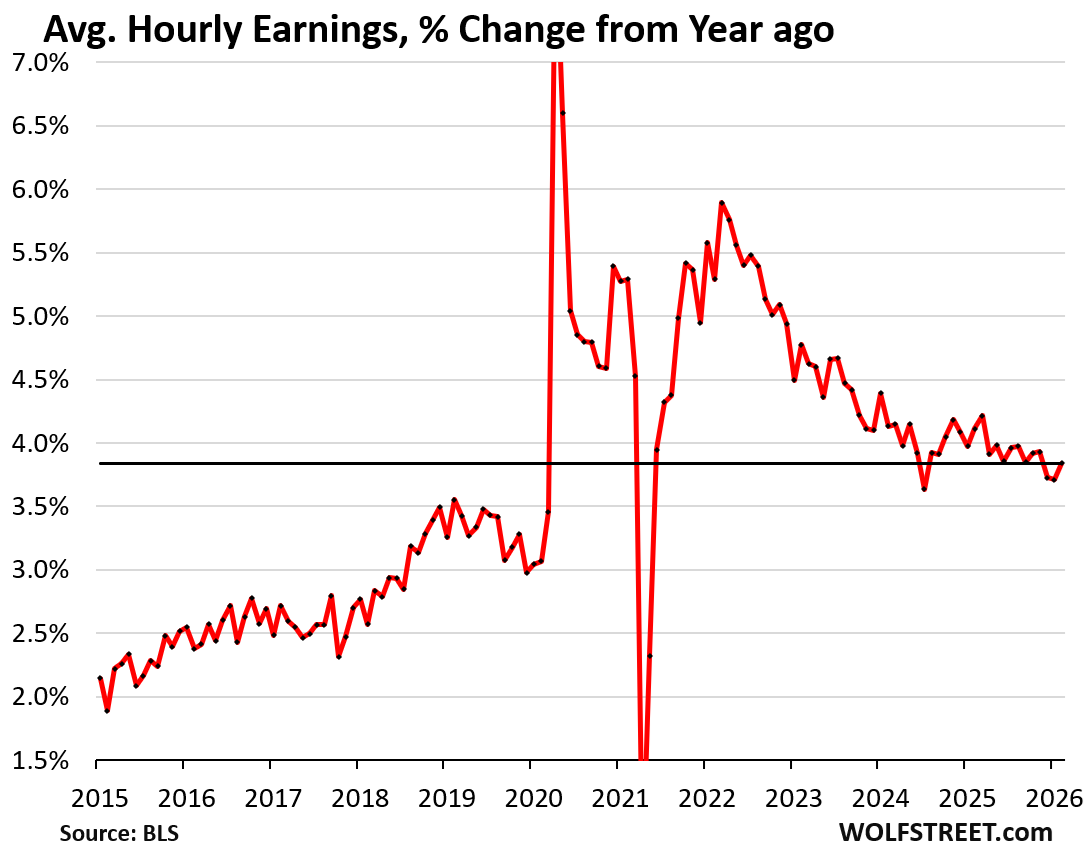
We can also see this in the solid growth of average hourly earnings. In the past, when job growth stalled, it did so as the labor force (supply of labor) continued to increase, thereby pushing up the unemployment rate, and pressuring down wage growth.
Now the growth in the supply of labor has stalled. And growth in demand for labor (job growth) is slow, so the unemployment rate remains low, and wages continue to grow at a solid rate.
Average hourly earnings in February rose by 0.40% from January (5.0% annualized) and have been in this 5.0%-annualized range for five of the past seven months.
Year-over-year, wage growth accelerated to 3.8%.
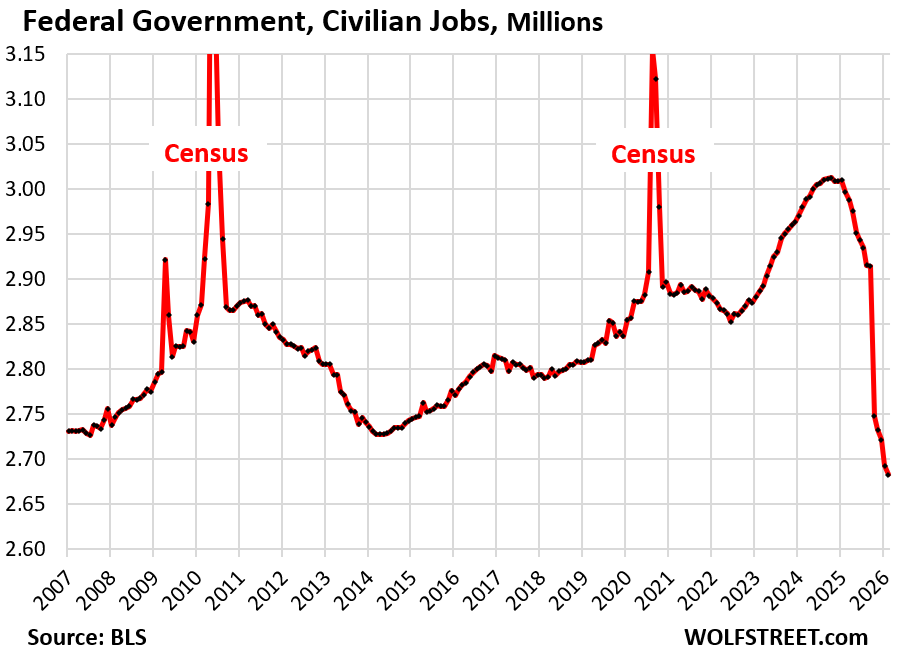
Despite weak job creation in the private sector and job cuts at the federal government.
The federal government shed another 10,000 civilian jobs in February. Since the beginning of 2025, the federal government has shed 327,000 civilian employees, seasonally adjusted, or 10.9% of its staff.
Companies and private research institutions that lost government contracts, or whose contracts were reduced or paused, also laid off people. But those were private-sector jobs; they’re not included here; they’re included in private-sector employment below.
State governments added 5,000 employees in February, after having shed 50,000 jobs last year. Local governments shed 1,000 jobs in February but had added 123,000 over the past 12 months.
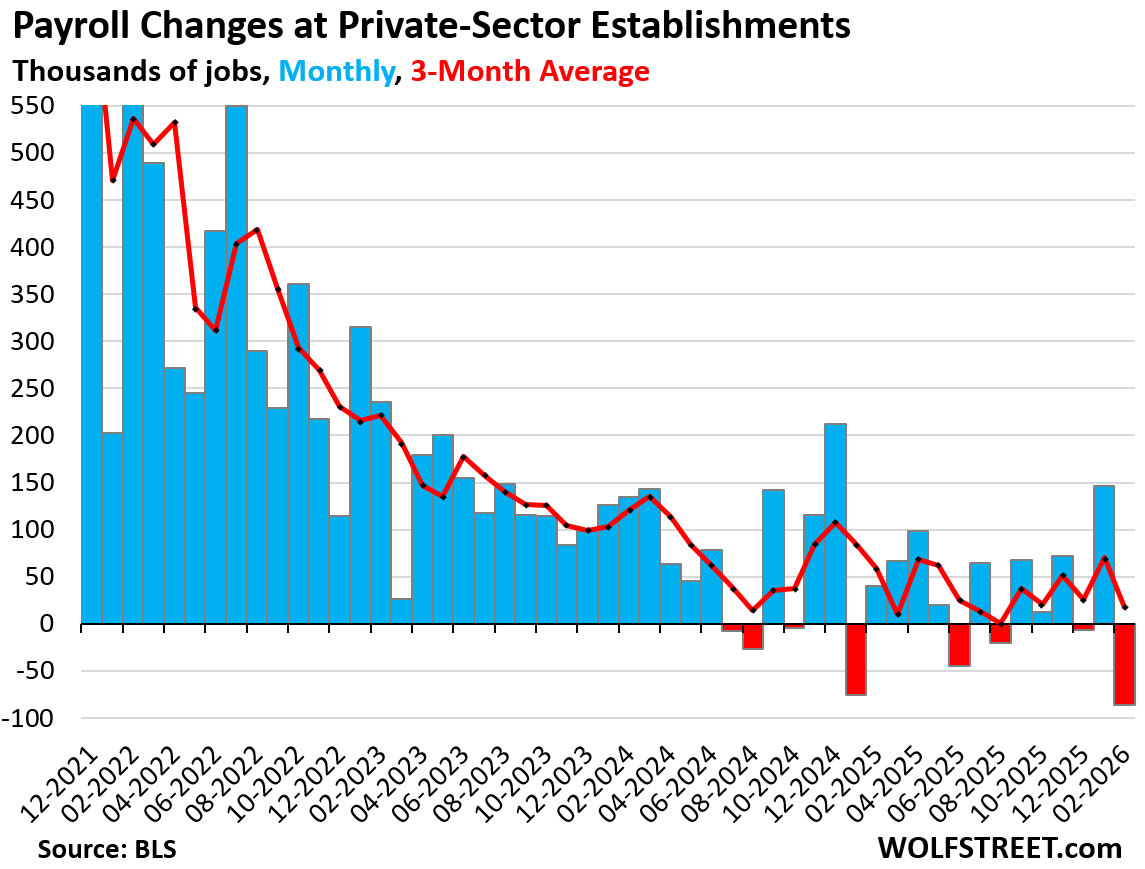
The private sector shed 86,000 jobs in February, undoing part of January’s gain of 146,000 (red and blue columns in the chart below).
The three-month average job growth, which irons out the month-to-month squiggles, declined to 18,000 jobs created on average per month over the December-February period. The low point of the three-month average was in August at zero jobs added (red line).
Over the past 12 months, private-sector employers added 392,000 jobs.
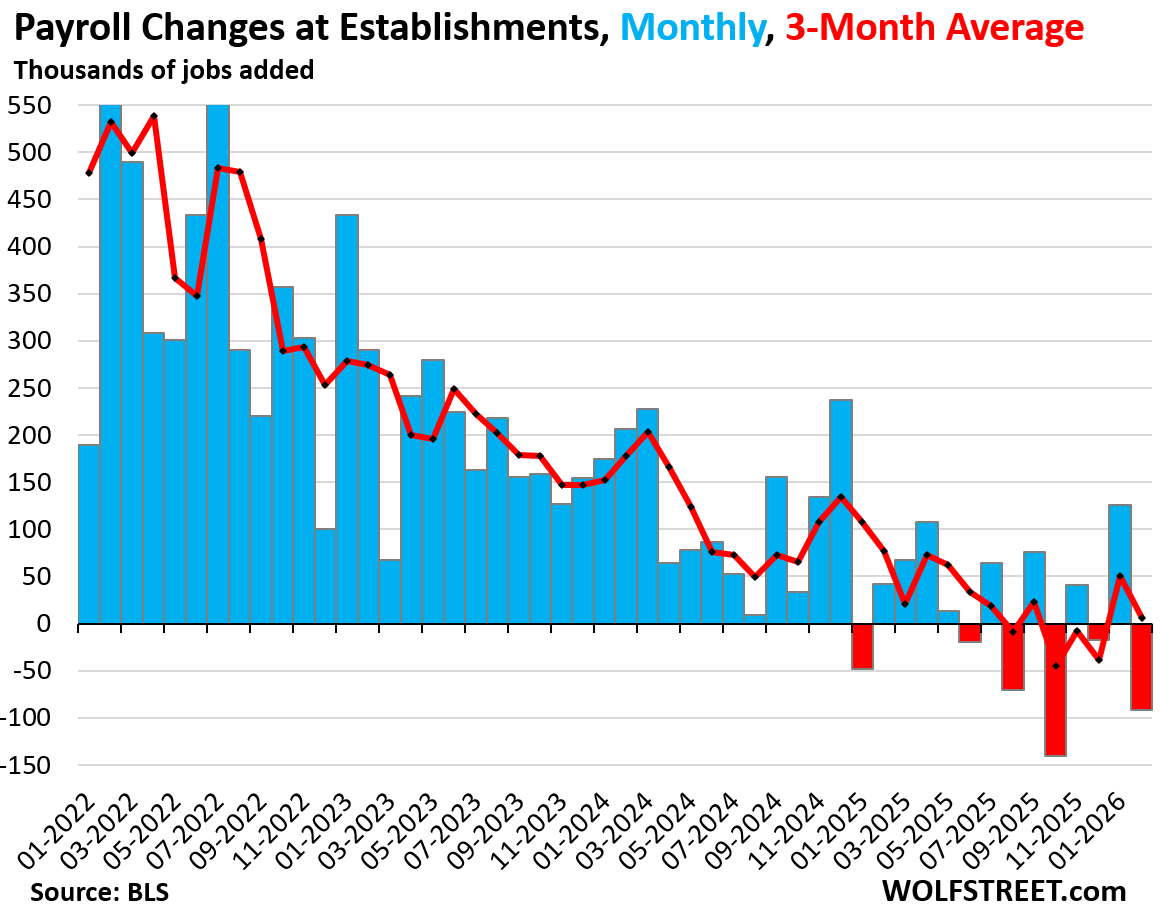
Total nonfarm payrolls, including governments, fell by 92,000 in February, after the 126,000 gain in January, seasonally adjusted.
The three-month average job growth declined to 6,000 jobs created on average in the December-February period.
Over the past 12 months, private-sector and government employers added only 156,000 jobs.
Enjoy reading WOLF STREET and want to support it? You can donate. I appreciate it immensely. Click on the mug to find out how:

![]()
We need to fine employers who hire illegals. Also, require E-Verify for all new hires. That would eliminate all this BLS data being distorted by the deportation of illegal workers.
Amen!
Yes, in accordance with U.S. law. Sick and tired of Americans being passed over for everything in favor of foreigners.
Did you see the article where the middle-easterner who is head of the Texas medical Board announced that foreigners are being fast-tracked for licensing ahead of Americans ?
Try as you might to attribute this to a “middle-easterner”, it’s a program that’s been implemented in 17 states so far to address doctor shortages.
From the Texas Tribune: “Texas joins 17 other states that are making it easier for foreign medical graduates to work as doctors here. About a quarter of the state’s licensed doctors were trained outside the U.S. “
There are doctor shortages because the medical boards will fully hold back the number of doctors
Regarding E-Verify only around 22 states that require it; and it’s a mix of Republican and Democratic leaning states that don’t require it. A program launched in 1996 and it’s still not being used correctly.
Hey Congress!! Make it a national law
But most mid to large Companies use e verify in every State regardless.
I have always wondered about the methods of enforcement.
The strategy is to go after individuals, except in select cases of “egregious” violations (the occasional factory headline).
If labor laws were actually enforced, it would probably put upward pressure on wages and even create jobs (since we all want more regulators in our industries?).
1:04 PM 3/6/2026
Dow 47,501.55 -453.19 -0.95%
S&P 500 6,740.02 -90.69 -1.33%
Nasdaq 22,387.68 -361.31 -1.59%
VIX 28.71 +4.96 20.88%
Gold 5,162.50 +83.80 1.65%
Oil 90.43 +9.42 11.63%
Just imagine how bad it really is since the data reports flowing out of Washington are now all suspect.