“Improving affordability conditions have yet to induce more buying activity”: National Association of Realtors.
By Wolf Richter for WOLF STREET.
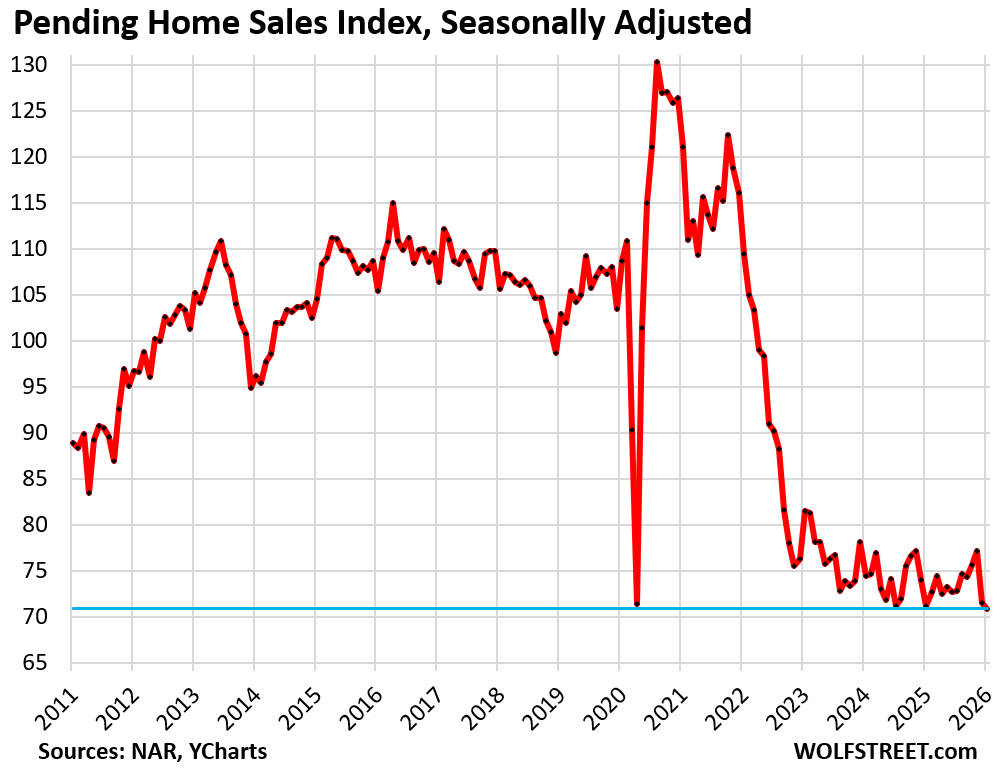
January was bad, following the plunge in December. And prior months were revised lower. Pending home sales, tracking the number of contracts signed in January, declined by 0.8% seasonally adjusted from the downwardly revised December, to the lowest level on record in the data by the National Association of Realtors, which goes back to mid-2010. Compared to January 2011, during the Housing Bust and the first January in the data series, pending sales were down by 20%.
“Improving affordability conditions have yet to induce more buying activity,” the NAR stated.
Pending home sales compared to the Januarys in prior years (historic data via YCharts):
- 2025: -0.8% (year-over-year)
- 2024: -4.8%
- 2023: -13.0%
- 2022: -35.2%
- 2021: -41.4%
- 2020: -34.8%
- 2019: -31.1%
- 2018: -32.9%.
Pending sales dropped sharply in the South and in the Northeast but rose in the West and Midwest on a month-to-month basis, seasonally adjusted, see charts further below. This comes after the drop in December in all four regions.
The metric of pending sales tracks contracts that were signed in January but that haven’t closed yet and could still get canceled because buyers cannot afford homeowner’s insurance, or cannot sell their own home, or for other reasons. The rate of cancellations has been running high.
Pending home sales by region.
A map of the four Census Regions is posted in the comments below.
In the South, pending sales fell by 4.5% in January from December, seasonally adjusted, following the drop in December.
Compared to the Januarys of prior years:
- 2025: +4.0% (year-over-year)
- 2024: -3.9%
- 2023: -12.2%
- 2022: -35.9%
- 2021: -42.1%
- 2019: -29.4%.

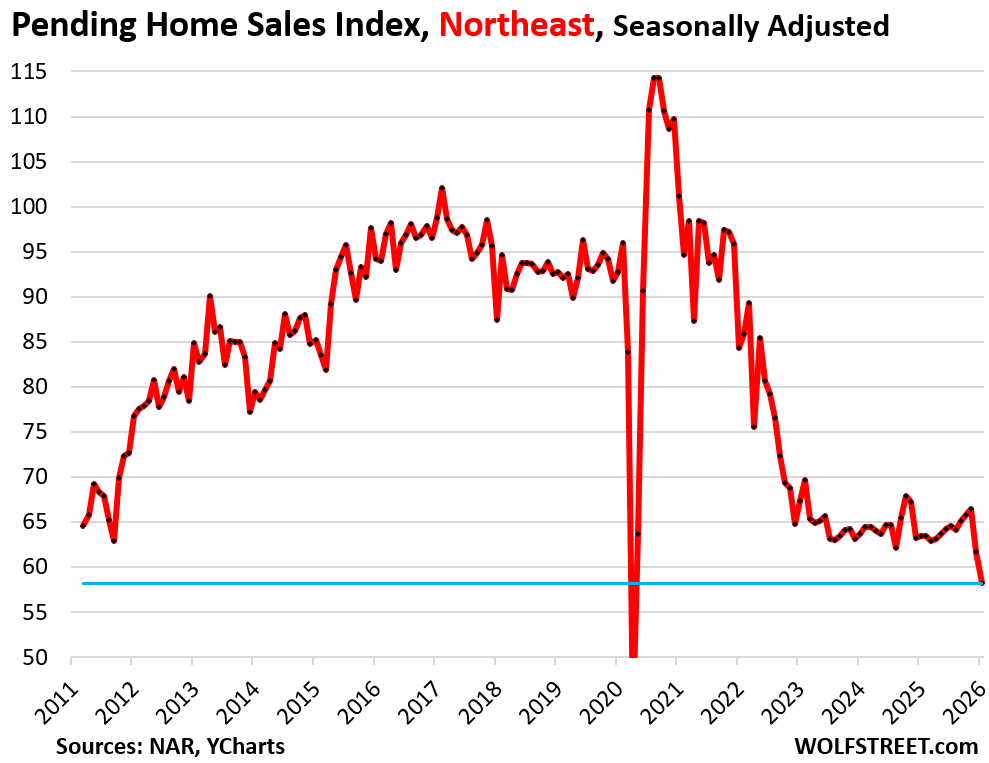
In the Northeast, pending sales dropped by 5.7% month-to-month, to the second-worst level of sales on record.
Compared to the Januarys of prior years:
- 2025: -8.3% (year-over-year)
- 2024: -8.6%
- 2023: -13.5%
- 2022: -31.0%
- 2021: -42.5%
- 2019: -37.3%.
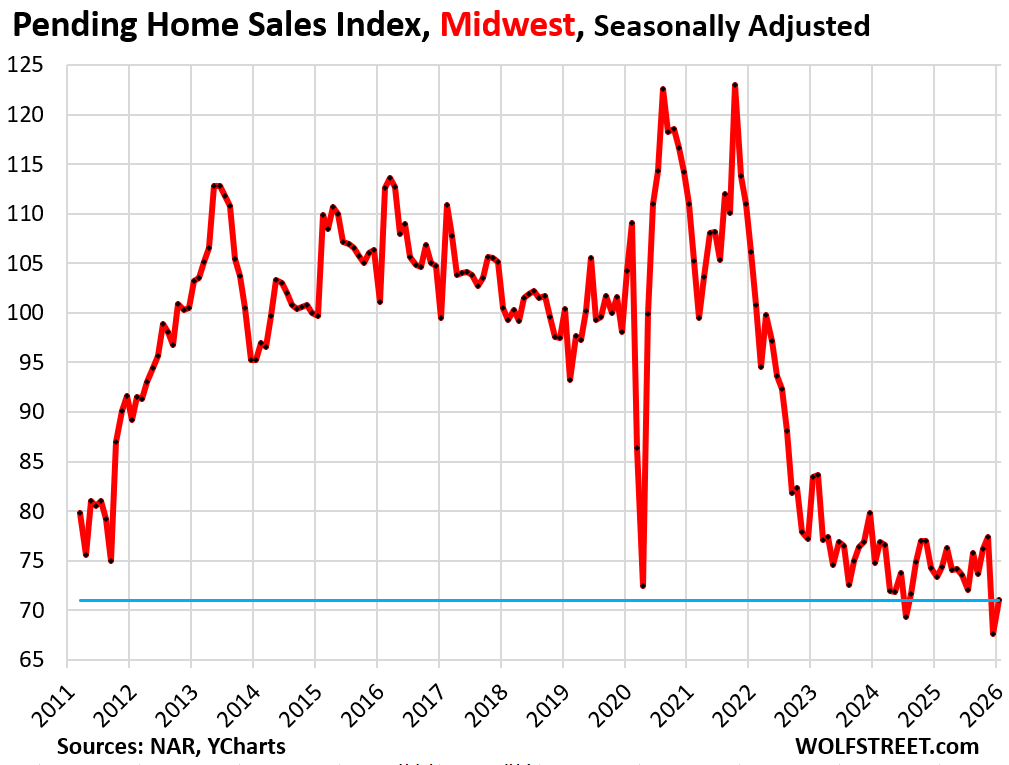
In the Midwest, pending sales rose by 5.0% in January from December, seasonally adjusted, to the third-lowest level on record, after the 12.7% plunge in December to a record low in the data going back to mid-2010.
Compared to the Januarys of prior years:
- 2025: -3.3% (year-over-year)
- 2024: -5.1%
- 2023: -14.9%
- 2022: -33.1%
- 2021: -36.0%
- 2019: -29.3%.
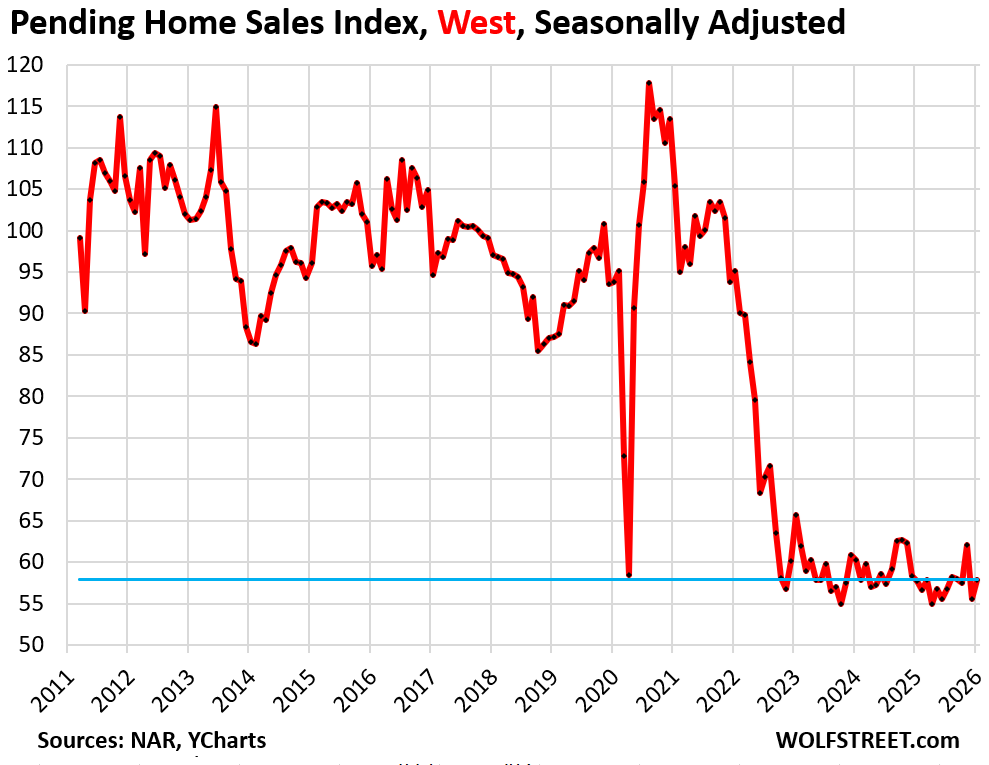
In the West, pending sales rose by 4.3% in January from December after the 10.6% plunge in December, seasonally adjusted.
Compared to the Januarys of prior years:
- 2025: +0.3% (year-over-year)
- 2024: -4.0%
- 2023: -11.9%
- 2022: -39.1%
- 2021: -45.1%
- 2019: -33.5%.
The cause of the housing market being this frozen and refusing to thaw is related to the ultra-low mortgage rates of 2020-2022 that ended up exploding home prices to where they’re too high now; and then when those ultra-low mortgage rates went away, they “locked in” homeowners that had those ultra-low mortgage rates who now cannot afford to move or don’t want to move because it’s not worth the extra monthly expense.
A substantial segment of the housing market – people moving and putting their home on the market and buying another home – has been frozen in this way for a fourth year now. Part of the plunge in sales compared to the years before the pandemic is related to this effect, with these people, as buyers and sellers, having vanished from the market.
The unwinding of the ultra-low mortgage rates is occurring, but very slowly, and the lock-in effect is gradually loosening: “Locked-in” Homeowners Nevertheless Pay Off Below-4% Mortgages: their Share Drops to Lowest since Q4 2020].
In case you missed it: Single-Family & Multifamily Construction: Bring on the Supply just as Population Growth Slows to a Crawl
Enjoy reading WOLF STREET and want to support it? You can donate. I appreciate it immensely. Click on the mug to find out how:

![]()
The four Census Regions of the US:
This spring season will be interesting, wonder how many will pin their hopes of a spring turnaround and we’re back baby momentum come spring.
This continue decline continues to remind us all the Mexican standoff is well and alive especially if you overlay the price change chart for market such as SoCal. Sales tanking and yet hubris sky high asking price still rampant across OC and LA…as they say, housing move slow but one has to wonder if and when this dam will ever break….
Unless and until sellers are forced to sell, they wont sell.
Renting is much smarter in SD. it takes $10k per month total to purchase after 20% down vs $5k per month to rent a example home in my neighborhood.
Every month over half of my payment does to pay down principal. 2.5% loan 3rd year in. Even at 3.69% on a 4 wk T Bill the government is paying off my house. I’m thinking there are a lot of folks out there smart enough to see that dropping principal happening every month on their statement. What is the motivation to get out of a situation like that? Job churn is down so really no pressing need to move for many.
Try NYC or Cal. Best move before you get the new tax bill!
“Improving affordability conditions have yet to induce more buying activity,” the NAR stated.
Hmmmmm…..,prices still too high/rising insurance/property taxes/home repair costs ect.
I KNOW the nar would not lie but they really do seem to be very dumb.
After jumping like 40% last year, my homeowner’s insurance jumped another 10% this year. I’ve shopped around and it is the same price.
Not sure what I’m doing wrong. It is getting ridiculous at this point.
I doubt it’s you. I believe it’s the insurance companies. They liked the increases they levied during covid, and until we rebel they’ll continue. Perhaps Trump should bash them and open interstate competition. its time!
I experienced the same issue. I did have mine raise the deductible to the highest amount they would allow which did lower my annual payment a bit. Of course, that may be dependent on state, location, property value, etc. When checking around I generally found $5000 to be the max that many would quote but if someone know of other carriers that may allow higher, I would love to know.
NAR needs to keep a dialogue going that it’s still glass half full or it’ll ruin the industry even more.
Paging Lawrence Yun….your propaganda is needed in aisle 2…
Real wages are up, but the boomers are retired. When they need
money the use c/c or HELOC at 12%, if their FICO is good. If not: 30%. The boomers are the wealthiest group in history. The gov spend on them $30K/Y, but only $5K/Y on zoomers, according to WSJ chief economist. He suggest to transfer wealth from the rich to the zoomers. The boomers
vote. The zoomers voted for Mamdani.
What they always leave out. When the government taxes us they transfer money to the poorer population. Great, but they grab a big chunk for themselves. Not so great.
OK, Wolfman, I’m gonna call it like I see it. You seem to sugarcoat things much more than I would. Above you state – “Compared to January 2011, during the Housing Bust and the first January in the data series, pending sales were down by 20%.” The alarm is blaring aloud – ‘The ship is sinking.” I personally am calling this a Housing Depression – it’s just not obvious yet.
However, for some reason, ‘he’ said he wants to maintain home prices high. Huh? Maybe he realizes that if housing prices equilibrate or normalize, it’s party over.
The way I see things, a continuation of these insane price levels will bring on the housing depression. You showed the numbers above. It’s just a matter of time. There is no fixing this mess.
Another stock Klarna (KLAR) qualified for the Imploded Stock list today, this one was incredibly hyped before the IPO and has totally collapsed.
Frozen markets because wages froze the time prices went up. Lock-in effect of existing homeowners feels more of an excuse for people not to get in and kick their other habits. There’s some sarcasm to that last sentence.
Thank you to the Fed for the golden handcuffs of the 3% 30-year mortgage!
Situation not changing anytime soon
NorthEast and South just came out of an extremely rough winter.
It was warm in the West, and in December pending sales in the West plunged to within a hair of the all-time low, and in January barely ticked up from that.
All of them are down by 30-45% from the same month in 2019.
The free money and low interest rates and inflation pop of the covid Crisis caused by our all knowing Federal Government Have terminated the housing market for a long time to come except for the wealthy and high earners
First, thank you for the comprehensive update.
Notwithstanding the gradual reduction in interest rates, the key factor in slow home sales is PRICE. Now perhaps where I live is an exception, but virtually every listing is 10% to 40% above the 2021-2025 selling price or 40% to 100% above the 2016 to 2020 selling price. Couple that with increased taxes and dramatically increased insurance (my insurance is triple what it was 7 years ago) and it’s a recipe for un-affordability.
Anyone else seeing this?
The hilarious thing is people thinking 0.25% will drastically change things. 1%+ isn’t possible with current deficit without risking inflation and tanking the dollar (which as an import country only makes the former accelerate).
With 30-year fixed terms in the US (plus programs like Prop13 , things are going to stay locked for a long time. Decreased mobility will absolutely impact real GDP growth.
If we sideways growth in the overall housing market for the next 15 years, I really don’t give a s$#@. The industry and Fed did this to themselves. Now with negative migration patterns in the US, its going to create even less demand.
re – How little additional sales volume it takes to ignite a bubble…
Maybe I am mis-interpreting things (don’t yell, Wolf, please) since using the annual year by year numbers to get a sense of the size of the 2020-2022 (especially *2021*) transaction spike sort of takes a bit of inverted interpretation…but if I am interpreting things right, the transaction surge in 2020-2022 (vs. say 2019) really wasn’t all *that* huge.
But it was enough to cause a huge run-up in median sales prices (in absolute dollar terms) and to “anchor” inflated expectations for 2023, 2024, 2025,…
Maybe that really isn’t news…but it is disturbing (if accurate) that a relatively small increase (decrease too?) in transactional volumes can have an outsized (read huge) impact on prices…that lasts years and years.
Again, maybe not news…but troubling to eyeball the actual historical data.
On a related note, I recently read that current transactional volumes have gone from 25% investor-based to 33% investor-based.
I know that Wolf has pointed out that the vast majority of SFH investors are mom-and-pop shops (1-10 SFH owned) vs. institutional behemoths (although I do wonder if behemoths would be above using straw mom-and-pops…) but regardless, I think that any SFH investor really has an intrinsically more “speculative” mindset and is much more comfortable than a pure owner-occupant with aggressive use of leverage…and all the evils that can follow from that.
“I recently read that current transactional volumes have gone from 25% investor-based to 33% investor-based.”
What that means, if anything, is SHARE. If overall sales volume plunges by 40%, and sales to homebuyers plunge by 45%, and sales to investors plunge by 35%, then the SHARE of investor sales rises, though sales volume to investors has plunged by 35%.
the biggest SFR landlords have become net sellers of scattered homes and are now exclusively focused on building their own build-to-rent developments. Sales to smaller investors have also collapsed, just not as much as sales to homebuyers.
Lived through the migration of farm workers looking for work to the city. So now I wonder what will happen to all the McMansions along the highways in the Midwest. Should be some fun times for the youngsters when they become empty.