Americans and their Debts. Long-defaulted federal student loans, after coming out of the woodwork, whack delinquency rates.
By Wolf Richter for WOLF STREET.
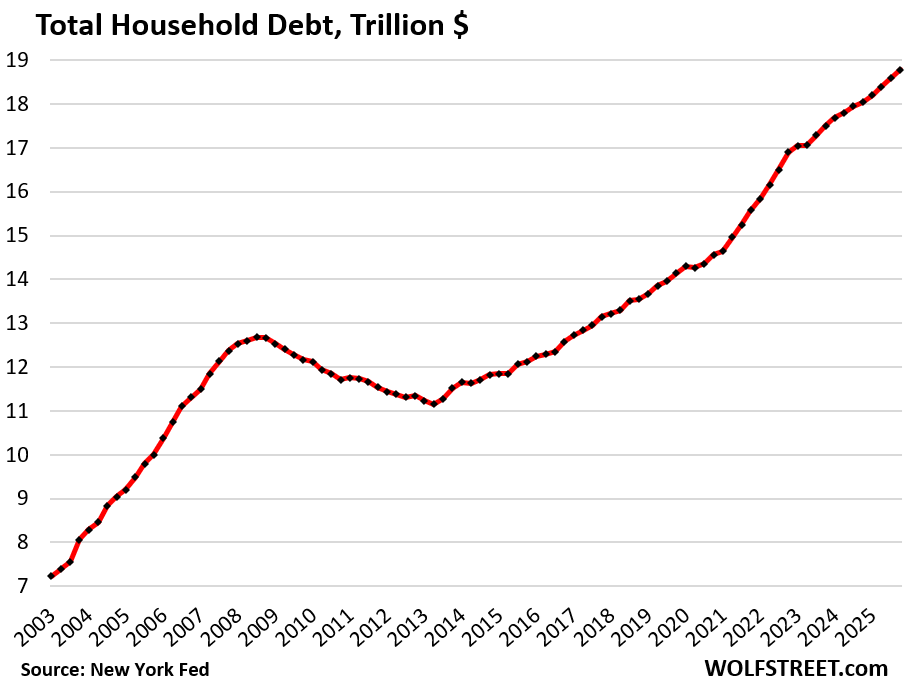
Total household debt outstanding in Q4 – mortgages, HELOCs, student loans, auto loans, credit card balances, and other consumer loans such as personal loans and BNPL loans – rose by 1.05%, or by $195 billion, from Q3, to $18.8 trillion, according to the Household Debt and Credit Report from the New York Fed today, which obtained this data via its partnership with Equifax.
Year-over-year, household debt rose by 4.1%, or by $744 billion.
Over the years, the number of households has grown, and the income per household has grown on average over the years, and combined they have grown faster than household debt, and the burden of this debt in terms of their combined income has declined over the years, as we’ll see in a moment.
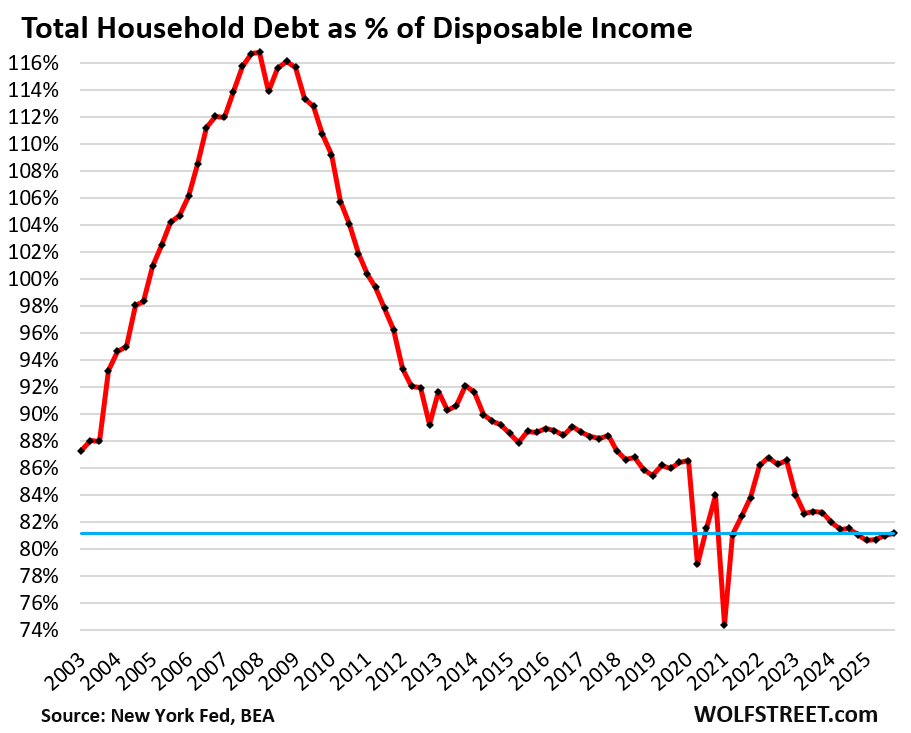
The burden of household debt: Debt-to-income ratio.
The debt-to-income ratio is one of the classic ways of evaluating the burden of a debt. With households, we can use the debt-to-disposable-income ratio.
Disposable income, released by the Bureau of Economic Analysis, is essentially the monthly after-tax income consumers have available to spend on a monthly basis for their daily costs of living, and to service their debts, and then to save and invest the rest.
It excludes income from capital gains, which is where the super-wealthy make most of their money, and this upper echelon of income is excluded here.
So income from after-tax wages, plus income from interest, dividends, rentals, farm income, small business income, transfer payments from the government, etc.
The debt-to-disposable income ratio in Q4 edged up to 81.2%, a tad higher than in the prior three quarters, which, except for two stimulus-era quarters, had been the lowest in the data going back to 2003.
Consumers are making record amounts of income, and there is a record number of consumers, and their aggregate balance sheet is in good shape: 65% own their own homes, and about 40% of them own their homes free and clear, and another big portion have only small amounts of debt left on their homes. Over 60% of households have at least some equities, and their prices have exploded. Many hold precious metals and cryptos. And households are sitting on a record pile of interest-earning cash. The economic entity of American households is in good shape.
But as the chart below shows, that wasn’t always the case. In the run-up to the financial Crisis, consumers were heavily burdened with debt, and by the time the ratio went over 115%, that debt had already started to blow up.
But, but, but… subprime-rated borrowers. This is a small subset of consumers with a low credit rating because they have a high debt-to-income ratio, missed payments, delinquent loans, and a bad credit history.
“Subprime” means bad credit, not “low income.” The high-income young dentist that got into it over their head is a classic example of high-income subprime. They’ll get it worked out and clean up their credit, but for a while they’re subprime. Credit problems are driven by this small subset of consumers.
Low-income people can rarely borrow a lot, if at all. And if they get in trouble, it’s with relatively small amounts. Consumers have to be higher-income to be big borrowers.
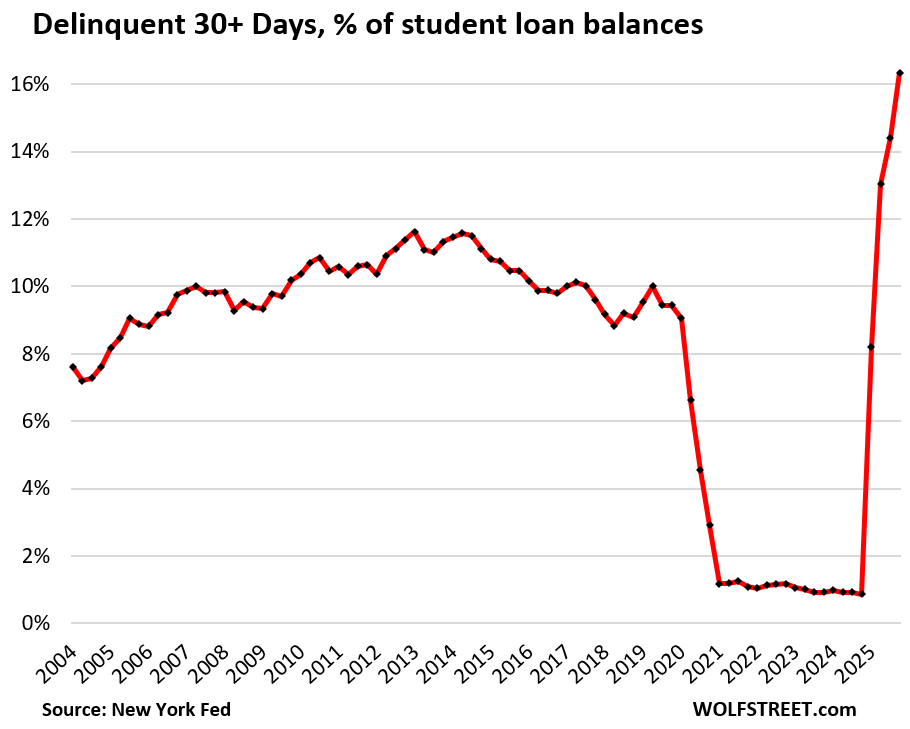
30-day student loan delinquencies continue to spike as defaulted student loans count as defaulted again. In 2025, federal student loans that had been covered by the government’s forbearance policies since 2020 came out of forbearance. During the government’s forbearance program, borrowers didn’t need to make payments, but their loans weren’t counted as delinquent. That’s over. Those federal student loans suddenly showed up on credit reports again, and delinquency rates exploded.
The 30-day delinquency rate spiked to 16.3% in Q4, the worst ever, up from around 1% during the forbearance era, according to the NY Fed’s report today, based on Equifax data.
Of the $1.66 trillion in student loans outstanding, $271 billion, or 16.4%, were 30-plus days delinquent in Q4. The whacky chart below is testimony of bad government policy.
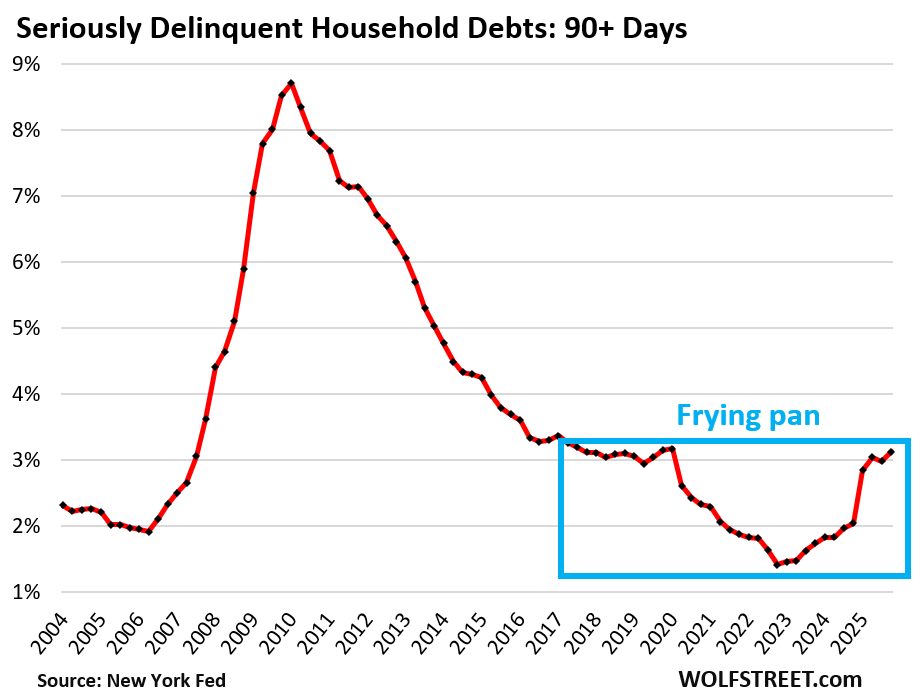
90-day delinquency rate whacked by student loans. The 90-day-plus – or “serious” – delinquency rate rose to 3.1%. This is the amount of debt that was 90 days delinquent at the end of Q4 (delinquency rate = delinquent amount divided by the amount of the debt).
In dollar terms, $586 billion were 90-plus days delinquent, of which $159 billion were student loans, up by about $150 billion from a year ago.
The 90-day delinquency rate for mortgages was 0.9%. For student loans, it was 9.5%. Note how the delinquency rate shot up in Q1 2025, when the first big batch of defaulted federal student loans came out of the woodwork.
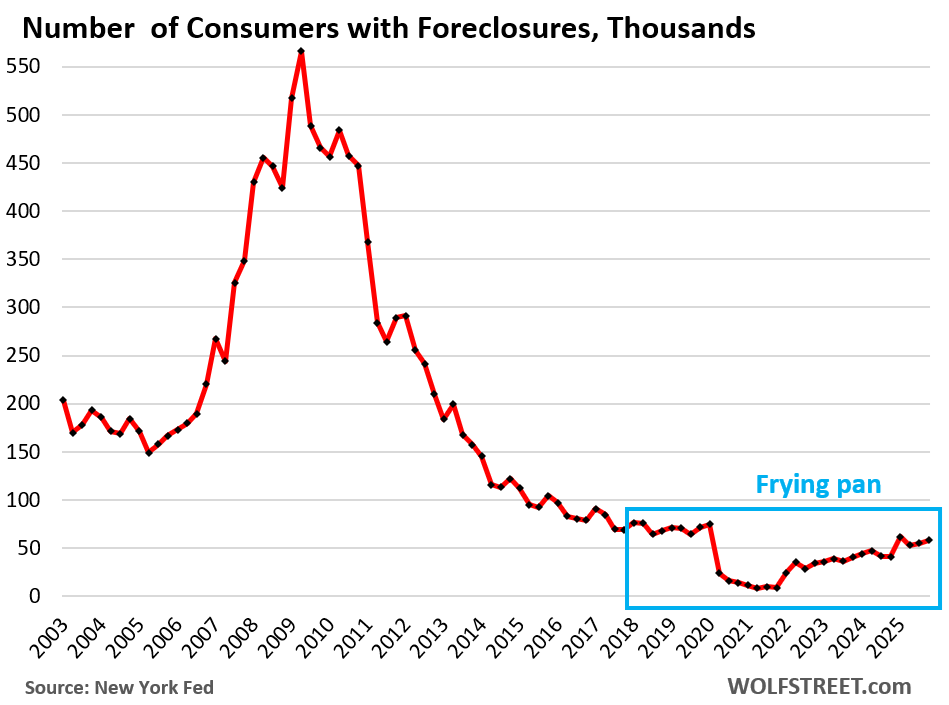
I have called this pattern a “frying pan” because that’s what it looks like. It has cropped up in a lot of metrics and is the result of the stimulus era pushing down the metric, and then it normalizes again.
Foreclosures are historically low. The number of consumers with foreclosures in Q4 edged up a hair to 58,140, well below the low end of the 65,000-to-90,000 range of the Good Times in 2018-2019, and was far below the number of foreclosures in prior years.
The increase comes off the artificially low near-zero level during the era of mortgage-forbearance, when foreclosures were essentially impossible. So it’s an increase off those artificially low levels. The current levels aren’t even back to the Good Times normal yet, though they might eventually get there.
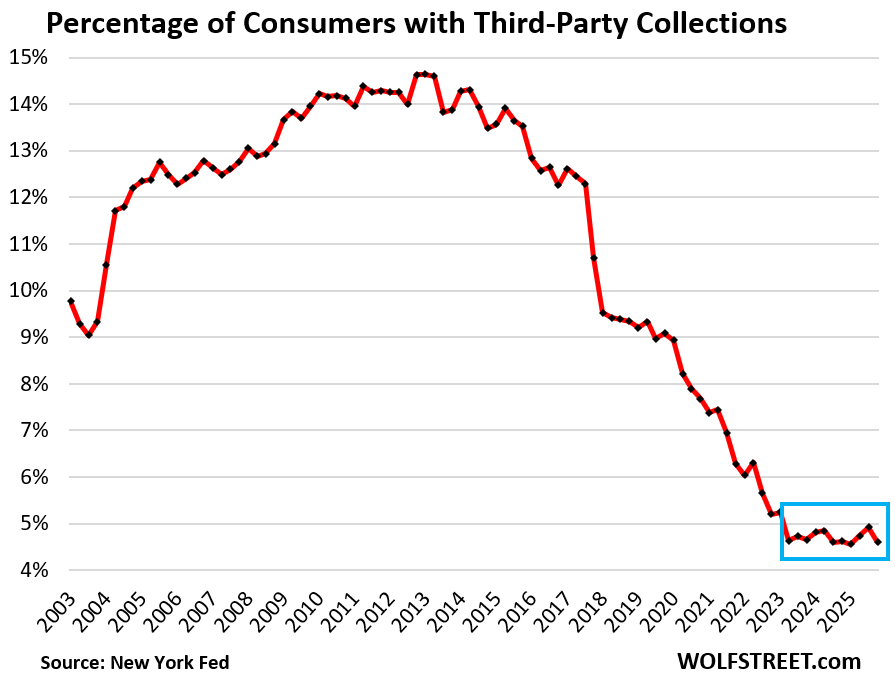
Third-party collections re-hit rock-bottom. The percentage of consumers with third-party collection entries on their credit reports hit rock-bottom again of 4.6% in Q4 – the record low in the data, shared by several prior quarters since Q2 2023, when it hit that level for the first time.
In 2013, coming out of the Great Recession and the unemployment crisis, over 14% of consumers had third-party collection entries on their credit reports.
A third-party collection entry is made into a consumer’s credit history when the lender reports to the credit bureaus, such as Equifax, that it sold the delinquent loan, such as credit card debt, to a collection agency for cents on the dollar. The New York Fed obtained this third-party collections data in anonymized form through its partnership with Equifax.
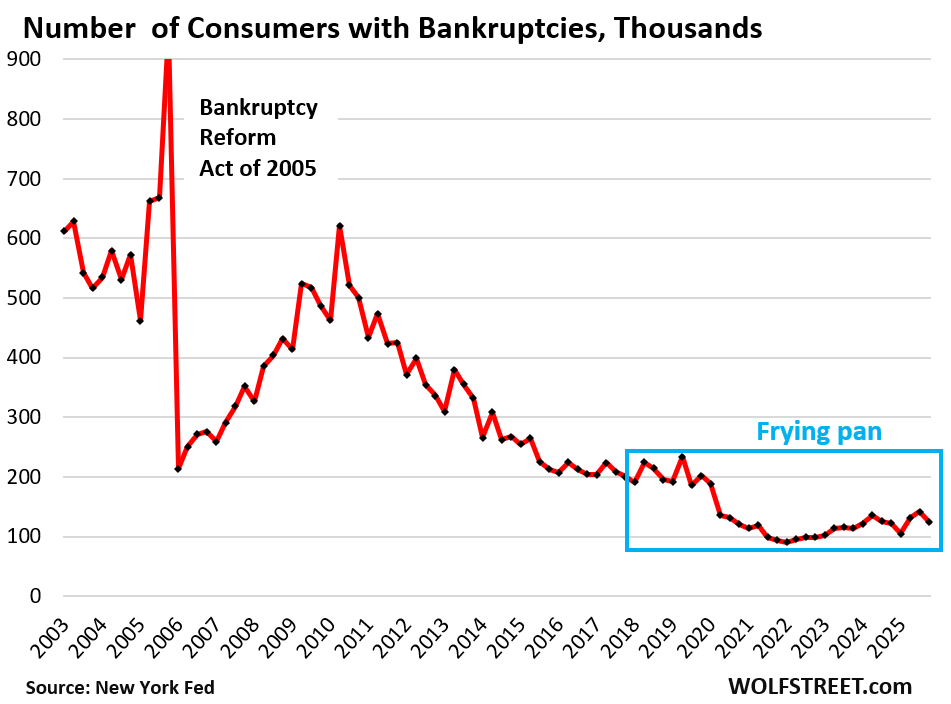
Bankruptcies creep along rock-bottom. The number of consumers with bankruptcy filings fell to 123,820 in Q4.
During the Good Times before the pandemic, that metric ranged from 186,000 to 234,000, which had already been historically low.
I will discuss housing debt, credit card debt, and auto debt in three separate articles over the next few days. Next one up is housing debt.
And in case you missed it: Not Seasonally Adjusted, Retail Sales Spiked by $80 billion, the Most for any December Ever by far, to $817 Billion, the Most Ever
Enjoy reading WOLF STREET and want to support it? You can donate. I appreciate it immensely. Click on the mug to find out how:

![]()
The average household’s balance sheet appears very healthy, the government’s balance sheet appears very unhealthy. Do you know if there is a historical reference where there was a similar divergence between the two and what the economic consequences were?
Corporate balance sheets are also strung out. In some corners, debts are bursting at the seams, especially PE-owned companies and companies borrowing in the private credit markets. There are huge risks here.
So one of the three economic players – households – is in pretty good shape. The other two are over-indebted. The Fed has been warning about this for years in its financial stability reports. But no one pays attention to them, least of all the members of the FOMC that set monetary policy.
Thanks for your work on this. I wonder what the kids are going to do. I read somewhere that starting salaries have dropped. Add in. The threat of AI taking entry level jobs, and the future for the young graduates doesn’t seem good.
“I read somewhere that…”
No, overall starting salaries have not dropped.
But SOME inflated starting salaries for people fresh out of college have dropped from the ridiculously inflated levels in 2021 ($74,000 average with a bunch of graduates pulling $150,000+ lol something wrong with this picture), they’re just coming back to reality. And that one report was on an inflation adjusted basis. Without inflation adjustment, they may not even be lower.