Seasonal Adjustments Gone Awry? They whacked $82 billion off December sales, by far the most ever.
By Wolf Richter for WOLF STREET.
Not seasonally adjusted, retail sales spiked by $80 billion in December from November, by far the biggest-ever November-to-December increase, to $817 billion, the most ever, and for the first time ever exceeding $800 billion (blue line in the chart).
It was driven in part by the $24 billion spike in ecommerce sales, the biggest month-to-month spike ever, to $166 billion, the most ecommerce sales ever by far, accounting for over 20% of total retail sales for the first time ever.
But oh no, the tapped-out consumer! In the headlines today: Retail sales were flat in December on “disappointing holiday season” or whatever. That was due to massive seasonal adjustments. And they seem to have gone awry just a little this December, thereby skewing the seasonally adjusted results (red line):
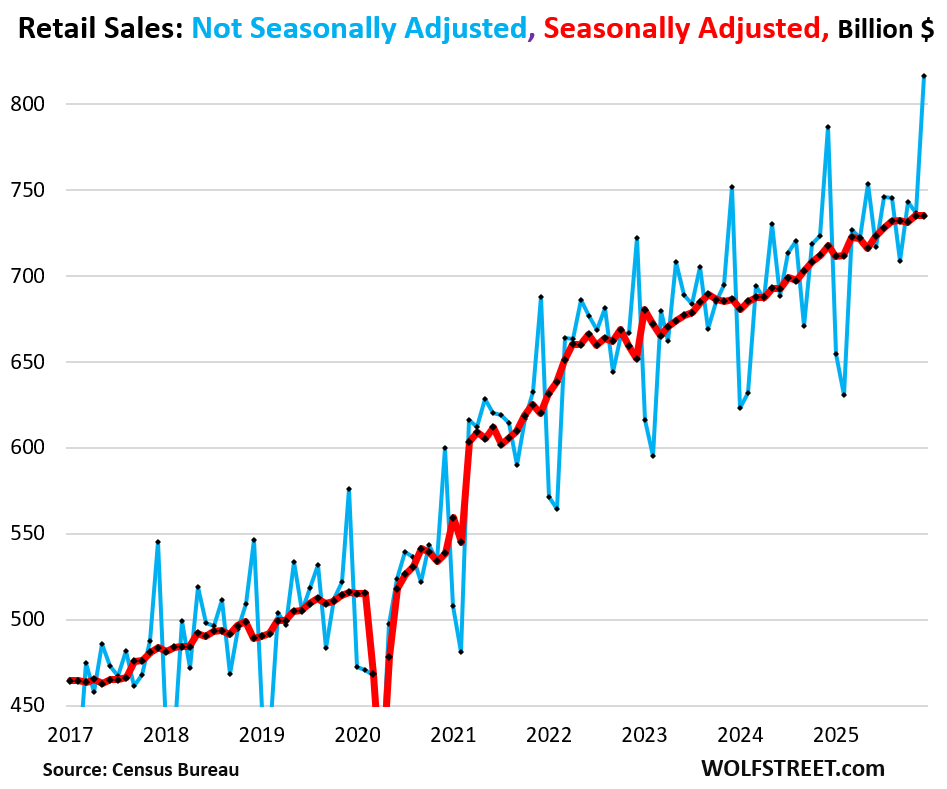
Year-over-year, so compared to the strong December last year, retail sales not seasonally adjusted, increased by 3.8%, the biggest year-over-year increase in three months, and slightly higher than the year-over-year increase of annual retail sales in 2025 (+3.7%).
Huge seasonal adjustment factors are used to reduce December sales and to increase January and February sales, with the purpose of leveling them out. Within a 12-month time frame, seasonal adjustments sum up to zero.
And in December, the seasonal adjustments were huge, whacking $82 billion off the not-seasonally-adjusted sales ($817 billion), by far the biggest whack-down ever, to get the seasonally adjusted sales down to $735 billion.
The December whack-down of not-seasonally adjusted sales to seasonally adjusted sales:
- December 2025: -$82 billion
- December 2024: -$69 billion
- December 2023: -$65 billion
- December 2022: -$71 billion
- December 2021: -$68 billion
- December 2020: -$61 billion
- December 2019: -$60 billion
- December 2018: -$57 billion
- December 2017: -$61 billion
The seasonal adjustment factor is supposed to account for seasonal variations, caused by things such as weather, holiday gift buying, and other factors, and importantly, differences in the number of “trading days,” which exclude weekends and holidays.
But the “trading days” have become less and less meaningful as ecommerce operates 24/7. Ecommerce was the biggest category in December by far, accounting for 20.2% of total retail sales, the most ever. And in many states, even brick-and-mortar retailers are open seven days a week, though in some states or counties, blue laws restrict some retailers on Sundays, such as alcohol retailers or motor vehicle dealers.
The Census Bureau’s X-13 ARIMA-SEATS software program calculates these seasonal adjustment factors, based on numerous historical data points. And in months with huge seasonal adjustment factors, such as December, even small misses skew the seasonally adjusted results enough to move the needle.
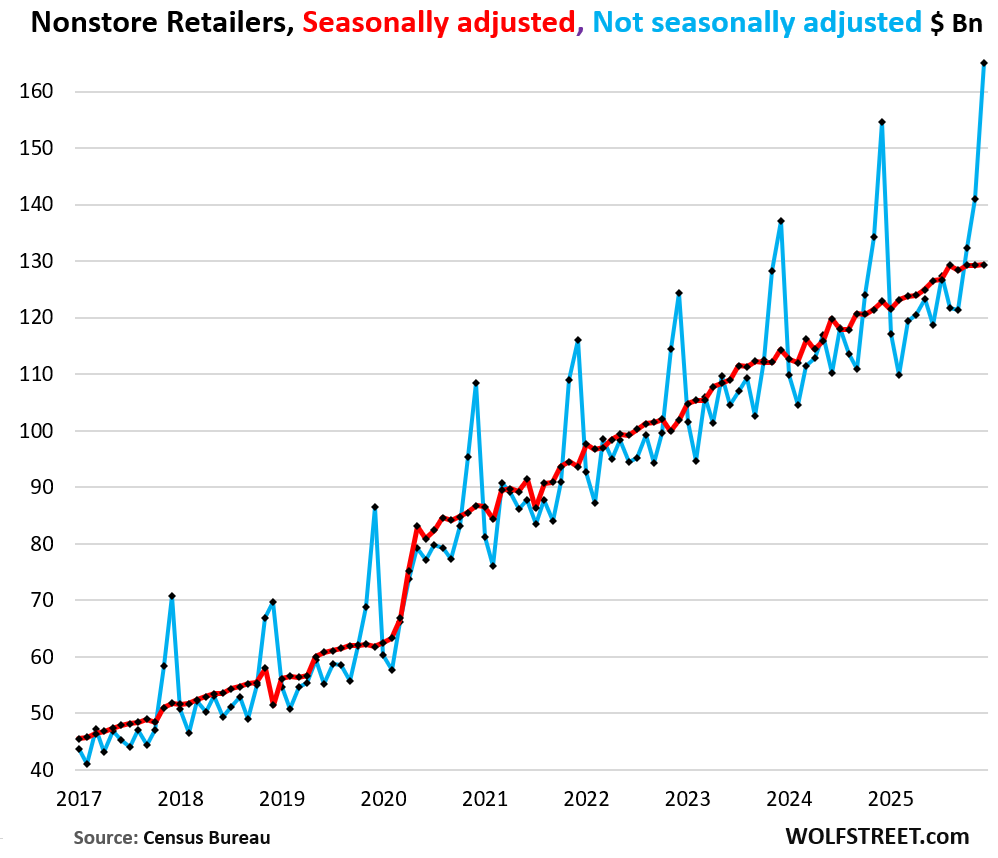
The Big Four categories, 60% of total retail sales.
Nonstore retailers (mostly ecommerce) accounted for 20.2% of total retail sales in December, the biggest share ever.
Not seasonally adjusted, sales spiked by $24 billion, the biggest November-December spike ever, to $166 billion, the most ever (blue line).
Seasonally adjusted, sales barely ticked up (+0.05%) to $129 billion.
The seasonal adjustment factor whacked $35.7 billion off actual sales in December, the most ever. That was 12.6% more than in December 2024, when it had whacked off $31.7 billion. Clearly, something went awry in that seasonal adjustment factor.
Year-over-year, not seasonally adjusted, nonstore retailer sales jumped by 6.7% in December.
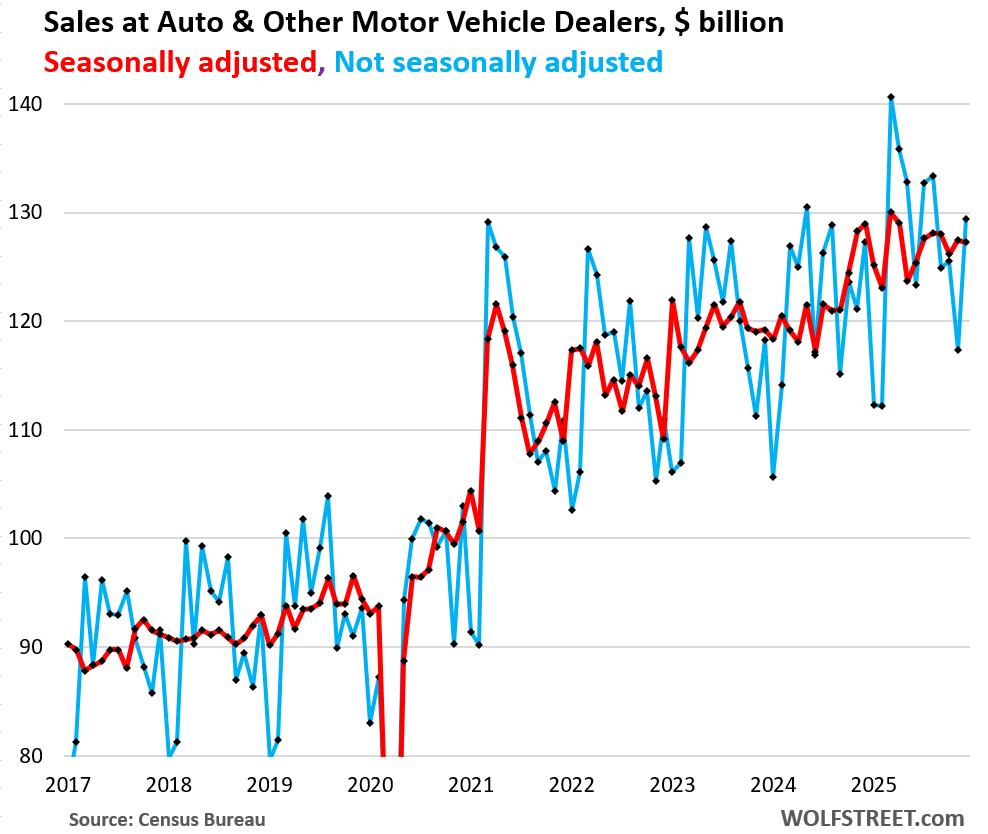
Auto & other motor vehicle dealers accounted for 15.9% of total retail sales, the second-largest category in December.
Not seasonally adjusted, sales jumped by 10.3% from November to $127 billion. But November and October had been weak as EV sales plunged when the federal incentives expired at the end of September, dragging down overall vehicle sales.
Seasonally adjusted, sales dipped by 0.2% in December from November.
We’ve already seen that the number of vehicles sold in Q4 fell, as EV sales dropped sharply, after the strong Q3, which had been pushed higher by frontrunning among EV buyers that had pushed EV sales to a big record in Q3. For the year 2025, unit sales rose 2.4% [see my report: Ugly Charts of US Auto Sales, 2025: Stellantis, Nissan Flirt with Catastrophe. GM, Ford, Honda Sales Rise but far below Peaks. Toyota & Hyundai-Kia Set Records].
Year-over-year, not seasonally adjusted, sales at auto & other motor vehicle dealers rose by 1.7% in December.
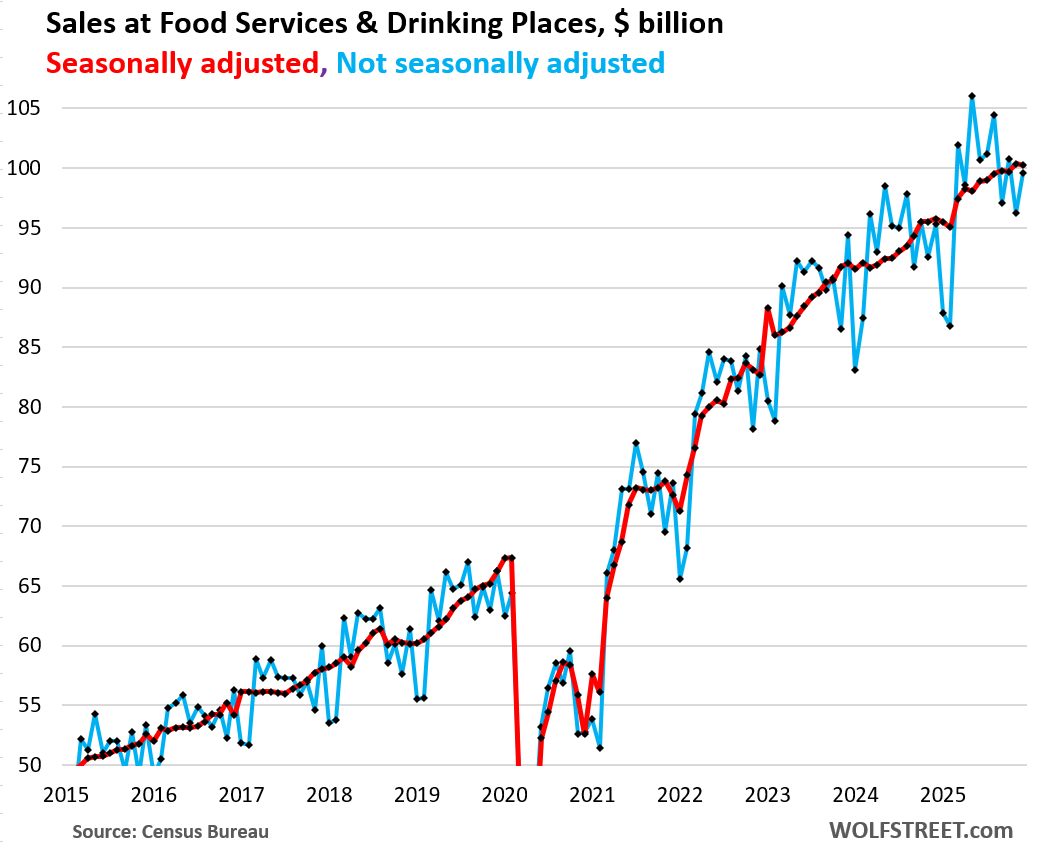
Food services & drinking places, such as restaurants and bars, accounted for 12.2% of total retail sales.
Not seasonally adjusted, sales rose by 3.5% in December from November, and by 4.5% year-over-year, to $100 billion.
Seasonally adjusted, sales dipped by 0.1% in December from November, to $100 billion.
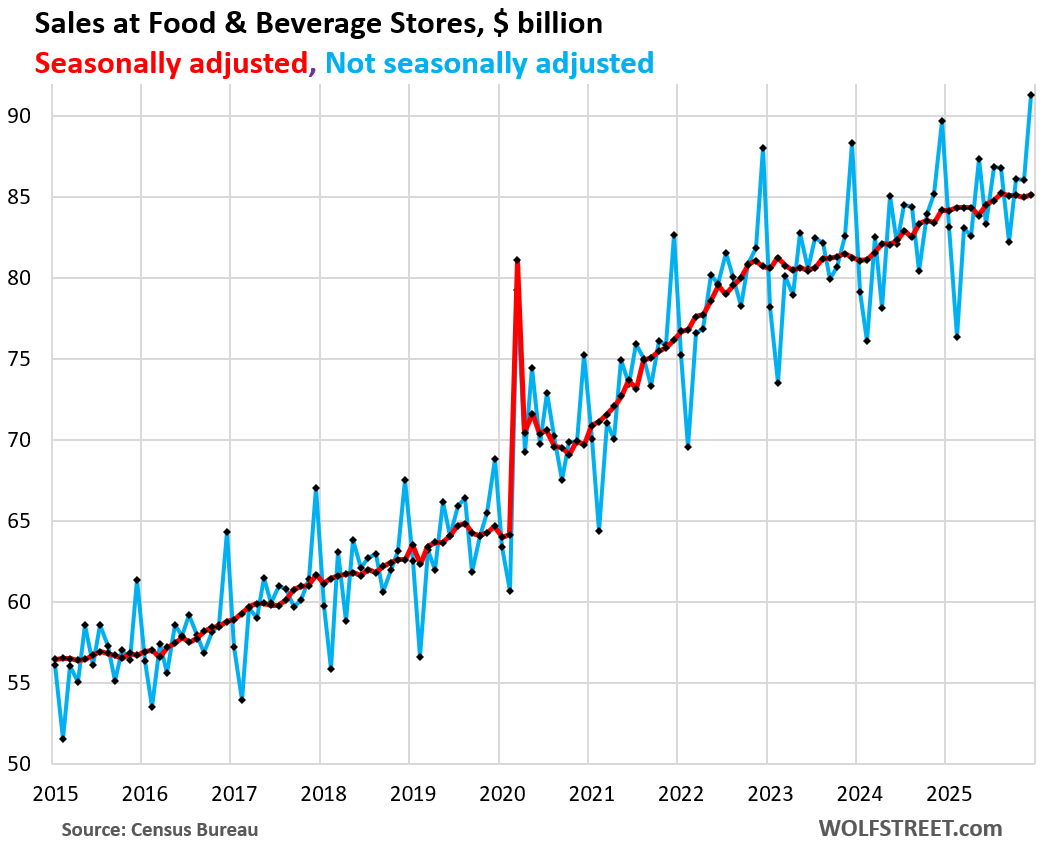
Food & Beverage stores accounted for 11.2% of total retail sales.
Not seasonally adjusted, sales spiked by 6.1% in December from November, to $91 billion. Year-over-year, sales were up by 1.8%.
Seasonally adjusted, sales rose by 0.2% in December from November, to $85 billion.
Enjoy reading WOLF STREET and want to support it? You can donate. I appreciate it immensely. Click on the mug to find out how:

![]()
based on the patterns of the chart, it appears the next monthly retail sales will be way low.
It will plunge by about 20-22% from December, typically. And then the huge seasonal adjustment will make it jump. January is going to look strong seasonally adjusted, and everyone will be surprised 🤣
Why not calculate 12 month moving average as an alternative to the seasonal adjustment? You lose some month to month granularity but avoid any distortions from the seasonal adjustment formula.
I assume the government does not explain the changes in seasonal adjustments and why they made the changes?
Wolf has the link in the article for the “explanation” (X-13 ARIMA-SEATS). It’s an entire software program run by the Census Bureau, which it appears you are able to download and install. It looked like a very deep rabbit hole, so I chose to stay out.
Seasonal adjustments are figured by a software program, as I explained and linked in the article. Verbatim from the article:
“The Census Bureau’s X-13 ARIMA-SEATS software program calculates these seasonal adjustment factors, based on numerous historical data points. And in months with huge seasonal adjustment factors, such as December, even small misses skew the seasonally adjusted results enough to move the needle.”
I definitely shopped a lot given the inclusion of the Miller Amendment in other legislation.
The proper appellation should be seasonally mal-adjusted.
Wow! Looks like the Drunken Sailors are still enjoying life!
I just read an interesting article that said that a big drive in home prices has not been lack of new construction, but the top 20% of earners being able to outbid median income workers for higher quality housing (basically, bigger houses). That matches up with the K-Shaped economy discussion. Shorter: for every place desirable to live, median income workers can’t keep up.
Obligatory George Carlin reference: “Its a big club and you ain’t it.”
The median income worker should get a median income house. Not a top 20% income house. Thats how it works. If you make the median wage, you arent priced out of housing, you just dont get what you want, you get a modest size or you get a commute or you have to fix things. Thats why home ownership rates are higher than in 1990, 1980,1970 and 1960 and over the past twenty years are near historical peaks.
In my city median house hold income is 105k and median home prices is 940k.
I wonder if it is affordable
Home prices increased by 60 percent plus post covid.
1. That: “the top 20% of earners being able to outbid median income workers” is just stupid bullshit. The top 20% earners don’t buy median homes. They buy top 20% homes. Which is why the median is the median. Median means the price in the middle, half of the buyers buy more expensive homes, half of the buyers buy less expensive homes, BY DEFINITION. If no one buys the top 20% homes, then there are no transactions with those prices, and the median price (price in the middle) drops a WHOLE BUNCH, you goofball.
2. There is a huge amount of new inventory
3. Prices of new homes have been falling for several years. See Lennar’s chart below. Don’t you ever read anything here?
Yes, top 20% earners do buy sub median homes, it’s called gentrification. I saw this a lot when I was in real estate. Often they were buying for college age kids but also for themselves.
One thing to consider is that a portion of the upper income buyers aren’t worried about keeping up with the Joneses.
Jesus Christ. The top 20% of SALES have to be bought by SOMEONE by definition, or else there wouldn’t be a SALE. There is always a top 20% of sales. Always. By definition.
The entire scale of home prices has shifted up by 50% or so since the pandemic. And so the median price ALSO has shifted up. So now it takes a higher income to buy a home than before — the affordability problem. So people who could buy a $400,000 home in 2019 had some pay increases and now can buy a $500,000 home, but that $400,000 home in 2019 is now a $600,000 home, and these people can no longer afford it, and so they’re buying what is now a $500,000 home, which was a $300,000 home in 2019. And someone else is buying the $600,000 home.
A combination of declining home prices and rising incomes would reverse that process, thereby easing the affordability crisis. And that is already happening in lots of places.
Thought maybe I was living in a different country but now realize it’s probably just another temporal distortion opening onto an alternate universe. There’s no limit to how many spending chits are available in the Star Trek world. “Beam down another trillion, Scotty. We’re off to warp ten.”
Hot off the press:
From wallstreetbets “2 fed governors including Powell say job numbers are wrong and will be revised.”
Take this how you want.
Over and out. 🫡
The huge annual benchmark adjustment is coming in the next jobs report. It comes every year. But it’s backward looking for the prior period through March 2025.
We already got a foretaste of it when they announced the preliminary revision in September, but it wasn’t transferred to the monthly jobs numbers. The final number, coming up, will be incorporated into the monthly jobs numbers, from 2024 through March 2025. Here is my discussion about the preliminary revision released in September:
https://wolfstreet.com/2025/09/09/annual-benchmark-payroll-revisions-nonfarm-job-creation-for-12-months-to-march-chopped-by-911000-to-1-45-million-jobs-created/
But that hasn’t stopped people from handing over their wallets for their furry friends. Just last year, Americans spent $119 billion on pets, according to federal data. And looking at the Consumer Price Index, officials say there’s clear, non-price determining factors that are influencing our decisions to spend.
$120 billion We spend our Pets in the USA. All the poor mouthing needs to stop, Americans are filthy rich. $300k in home equity alone. Millionaires being created out of thin air everywhere. 6 years of liquidity fueling the fire.
you clearly drank the kool-aid
Pets are cheaper than real children.
That’s the reason.
Also, lots of empty nesters are getting pets as companions. Lots of older people in the current population.
Well it’s good that people are buying stuff. But are the prices elevated? Not so much drunken sailors but stretched consumers. Americans are not going to boycott Christmas.
There is no sign of “stretched” here.
The “consumer is tapped out” narratives have already started since this came out yesterday. “People are spending only on necessities” etc. Tiresome.
Every American has become a farmer. “I’m broke! Farmers make nothing!” But I have new equipment and a new truck every two years.
Not sure of impact (i.e., the numbers) but there was a not insubstantial uptick in savings during the Covid debacle. Those accounts are now being worked down.
Pent up consumption + stimmy funding/temporary tax reductions + deportation impacts on pricing + changes in soc sec min age for RMDs + excessive gov’t deficits + tariff impacts + etc. Lotta things gong on – lotta volatility.
People confuse this all the time. There was an uptick in the “savings rate” during covid. That’s a rate: money not spent divided by money earned. Consumers have continued to add to their pile of savings every single month since then, with a positive savings rate since then, but at a slower rate. Those savings are not going down; they keep going up. What has gone down is the “savings rate.” But it’s still positive.
To see actual cash in bank CDs and money markets, click on the link in the article. Those balances have ballooned in recent years with higher interest rates! People are sitting on an ever-larger piles of interest earning cash.
I like data.
It’s fine when raw: we can all chop it up and cook the books to taste.
The general public has indigestion and can only be spoonfed with blender goop.
This article was on my feed with a handful of “worst ever” “tapped out” and other garbage narratives (economic preservatives) that will ultimately result in brain cancer.
Those articles got a lot more clicks than mine. That kind of stupid clickbait headline works wonderfully, which is why it keeps getting produced. Complex stuff doesn’t work, which is why it’s much rarer.
Thank for your excellent article and for including really good charts.
“…the biggest year-over-year increase in three months…”, perhaps you intended to say the biggest percentage* increase in three years*.
The fact that you neglected to mention that Dec 2025 started on a Monday (meaning it was overrepresented by weekdays) weakens your argument.
When months are overrepresented by Mondays their monthly sales are overrepresented in accounting systems. The reason is that these numbers are estimated based on inventory changes (not actual Sales). Inventory numbers get updated on trading days (weekdays). Every month that starts on Monday gets a big seasonal adjustment. If it’s a December it is sure to have a massive adjustment. Why? Because the biggest shopping weekend of the year (last weekend in Nov) gets lumped into Dec numbers.
Why were online sales so large? Because the first day of December was Cyber Monday. The last time this happened was 2014.
This is one of the many real reasons that seasonally adjusted numbers are used.
“The fact that you neglected to mention that Dec 2025 started on a Monday (meaning it was overrepresented by weekdays) weakens your argument.”
You people!!! RTGFA. Ecommerce runs 24/7. It’s not like merchants such as Amazon or Walmart shut the shop on Friday or Saturday and reopen on Monday and then do the close of business stuff on Monday. Ecommerce is all computerized and 24/7. An executive can look on their screen on Sunday at 2:45 AM and see what their sales are. They don’t have to wait till Monday. Ecommerce was 20% of total retail sales, the largest category. And it spiked by the most ever, to the most ever NSA
Here is what I said in the article about this, verbatim:
“The seasonal adjustment factor is supposed to account for seasonal variations, caused by things such as weather, holiday gift buying, and other factors, and importantly, differences in the number of “trading days,” which exclude weekends and holidays.
But the “trading days” have become less and less meaningful as ecommerce operates 24/7. Ecommerce was the biggest category in December by far, accounting for 20.2% of total retail sales, the most ever. And in many states, even brick-and-mortar retailers are open seven days a week, though in some states or counties, blue laws restrict some retailers on Sundays, such as alcohol retailers or motor vehicle dealers.”
Again no mention of the impact of Cyber Monday or accounting practices or inventories. Just because the sale is “contracted” at 1am on Saturday does not mean that it is accounted for at 1am on Saturday. Accountants close out inventories on trading days. Inventories are updated during the week. Inventories are replenished during the week at the batch level. Inventories are not just-in-time.
Sales don’t close when the customer “hits buy”. Sales are closed when inventory leaves and accounts receivable is reconciled (the charge is complete). Sales and inventories are not backdated to when the customer “hit buy”. They are closed when they are closed, during the week and weekend sales carry over to Monday.
That is a stupid statement. On 2 levels.
1. Cyber Monday MOSTLY falls into December, same as in 2025. So I just wasted my time looking this up. Over the past 15 years, Cyber Monday fell into December 13 times, and into November 2 times. So quit giving me your bullshit about Cyber Monday suddenly and exceptionally being in December and skewing the data.
Cyber Monday in December:
2025 Dec 1
2024 Dec 2
2023 Dec 4
2022 Dec 5
2021 Dec 6
2020 NOV
2019 Dec 2
2018 Dec 3
2017 Dec 4
2016 Dec 5
2015 NOV
2014 Dec 1
2013 Dec 2
2012 Dec 3
2011 Dec 5
2. You obviously have never worked in retail. For sales reporting, which is what the Census Bureau collects (not financial statements), a sale is counted when the transaction is paid for. Nothing to do with inventory or shipping or whatever. In Ecommerce, which is what you’re talking about, the sale is paid for electronically when the customer hits BUY. It’s instant. And it counts as a sale that moment.
BTW: Sales are on the income statement; inventory, receivables (such as from bank cards), payables, etc. are on the balance sheet.