Despite corporate announcements of global layoffs, including of remote workers (while hiring through the other door).
By Wolf Richter for WOLF STREET.
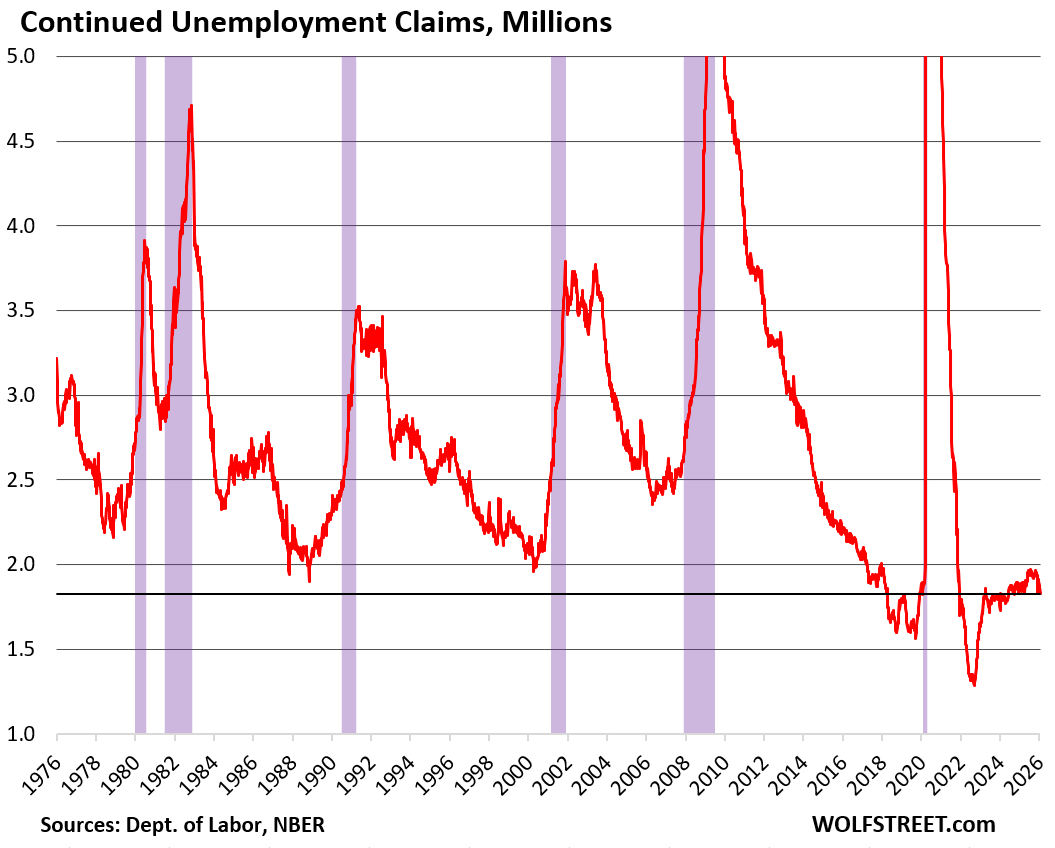
Continued weekly claims for unemployment insurance benefits fell to 1.827 million, the lowest since September 2024, according to the Labor Department today. These continued claims track the total number of people who’d initially applied for unemployment insurance at least a week earlier and are still claiming unemployment insurance because they still haven’t found a job
They have been zigzagging lower since their recent peak in July 2025 (1.968 million) and are down by 141,000 from that peak.
These continued claims are relatively low in a historic context. Over the past five decades, it’s only during the tight labor market in 2018 and 2019 and in the years of the labor shortages in 2021 and 2022, that the level was lower. But back then, nonfarm payrolls were quite a bit smaller. It indicates that people remain on unemployment insurance rolls a little longer than in 2022-2024 during the labor shortages, and in 2018-2019 during the tight labor market, but not as long as they did at any time in the prior decades.
This is administrative data collected from state unemployment agencies. It is not survey-based data. Laid-off people who still haven’t found a job filed these unemployment insurance claims at state unemployment agencies, which then report them to the US Department of Labor by the weekly deadline, which then combines the data and publishes it.
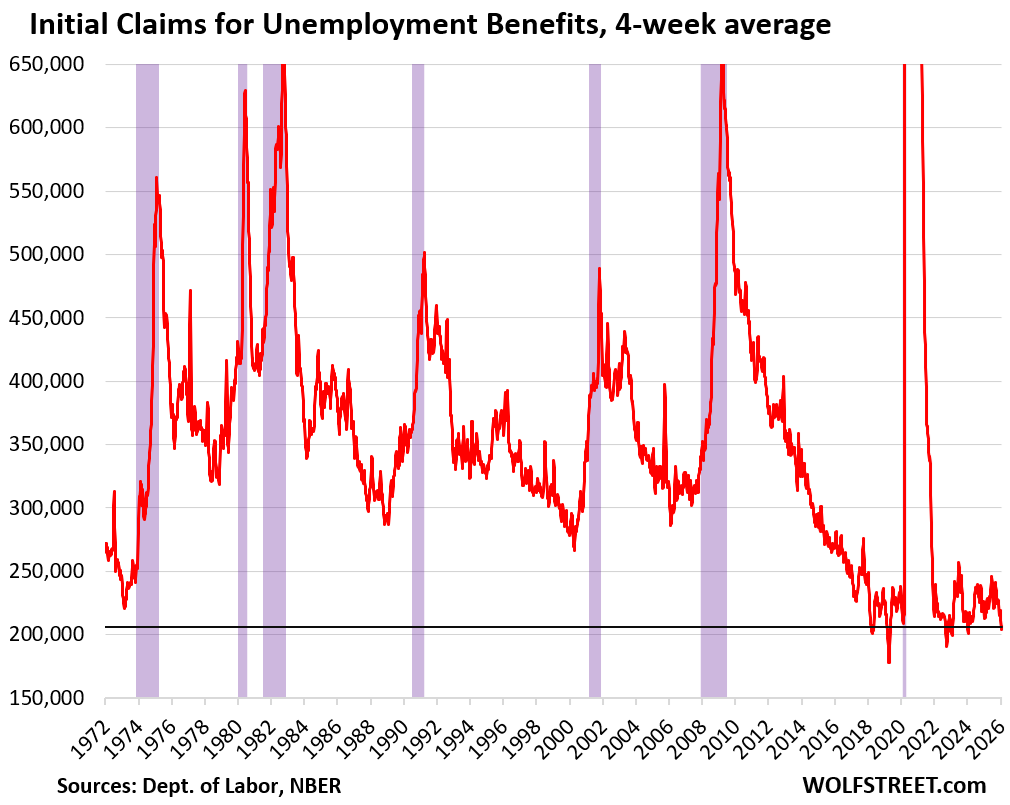
Initial applications for unemployment benefits (“initial claims”) in the week through Saturday declined to 209,000, which is historically low.
This weekly data is notoriously volatile as some states might not get their claims data submitted before the deadline, in which case the data is included in the following week. When a big state does that, it moves the needle, low one week, high the next week.
The four-week average, which the Department of Labor also releases and which largely irons out the week-to-week squiggles, inched up to 206,250 initial claims.
There were only a few weeks in the decades since the 1970s when the four-week average of initial claims was even lower.
This shows that employers overall are clinging to their workers despite some global layoff announcements by some big companies that get the attention in the media, even if these layoffs don’t all happen in the US, and even if these announced layoffs don’t always lead to actual layoffs, but to jobs elsewhere in the company, etc. Amazon is an example of that. And there are ulterior motives.
Home Depot made it explicit today: It announced 800 layoffs, with about 650 of them being remote workers, the remainder being at its corporate headquarters. And it came with the announcement to employees that everyone would have to go to the office five days a week, starting April 6. And for those who refuse, well…
So despite these layoff announcements that percolate through the media, this unemployment insurance data – both continued unemployment claims and initial unemployment claims – show no signs of a weakening labor market in terms of companies shedding employees.
But job creation has slowed – and companies overall are not adding to their staff in large numbers. It’s still an open question how much of that is related to the crackdown on illegal immigrants that then causes labor scarcity in some sectors where employers have a harder time filling those jobs. The Census Bureau just released new data on the falling population of foreign-born people in the US as a result of a surge of emigration (including from deportations and voluntary deportations) and a sharp slowdown of immigration, which I discussed here.
And for people who are looking for a job, there is another issue: That workers are now also clinging to their jobs, after the huge wave of quits during the labor shortages that reshuffled the entire workforce. A person who quits one job to go to another job leaves behind a job opening that the company can choose to fill, which opens opportunities for people looking for a job. There was a huge amount of churn of that type during the labor shortages, but that churn has calmed down. And that makes it harder for people looking for a job to slip into a newly opened slot that a quitter had left behind.
And in case you missed it: Americans’ Incomes from Wages & Salaries, Businesses & Farms, Rentals, Dividends & Interest, and Transfer Receipts
Enjoy reading WOLF STREET and want to support it? You can donate. I appreciate it immensely. Click on the mug to find out how:

![]()
I’ve noticed that those companies that do announce lay-offs often accompany that announcement with statements that they are using A.I. to gain efficiencies. Thereby getting a bump in their stock as the stock jockeys now look favorably on anything A.I. related.
Yes but at least what I hear in Tech is really they’re hiring overseas. They blame it on AI because that sounds better.
Thanks wolf! When I look at continues claims on a chart $$UNEMPCLC
back in September 2024 1825.00 was above its 50 DMA. In Nov 25 Continuous claims crashed to 1830 below its 50 DMA it made 2 attempts to regain its 50 DMA only to fail. Post covid low 1259 (long multi decade low) really pushed it’s 200 DMA down to currently 1744.91. I believe; technically that is where we are heading to the up sloping 200 DMA, they use economist to forecast unemployment but i think charting has been way more accurate.
the $usd popped green for the day when the Willshire 5000 was down over 1 trillion in market cap, as the market recovered the $USD went back into the red. Real problems in confidence will happen when the market is down 1 T and the $USD is down with it. super excited to see core PPI year over year, if it marches higher 3.6 or 3.7 the fed has to get out of denial with zero possibilities of rate hikes in the future.
Not very often you see 52 week high in SPY followed by 1 T down move down the next day. The buy the dip crowd ignores the yen appreciation at their pearl.