Consumers may be in a foul mood, but they’re making money and are spending it, and are still saving some.
By Wolf Richter for WOLF STREET.
Consumers outspent inflation at a solid clip despite their sour mood, despite the wailing and gnashing of teeth in the media, despite the government shutdown, and despite the massive job losses at federal and state governments. Their incomes outgrew inflation as well. The savings rate declined to 3.5%, meaning consumers spent 96.5% of their disposable income and saved 3.5%, lower than before the pandemic but higher than before the Financial Crisis. A positive savings rate shows that spending growth isn’t funded by debt, but with income, and that there was still money left over to save.
Not adjusted for inflation, consumer spending jumped by 0.5% in November from October and by 5.4% from a year ago, according to Bureau of Economic Analysis today.
Adjusted for inflation, consumer spending (a.k.a. “real” consumer spending) rose by 0.3% for the month, and by 2.6% from a year ago, right in the range of the Good Times in the years before the pandemic, solid growth for the US economy.
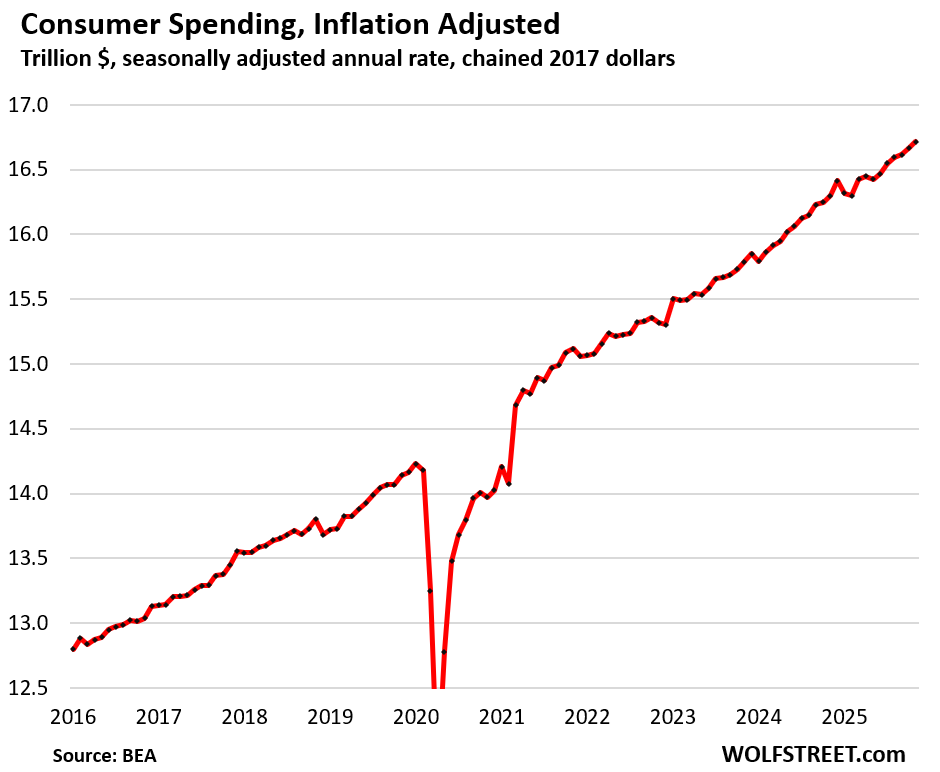
The month-to-month inflation-adjusted increase in November of 0.3% was driven by substantial growth in spending on durable goods (+0.6%) and nondurable goods (+0.5%), with a smaller growth rate for services (+0.2%), adjusted for inflation.
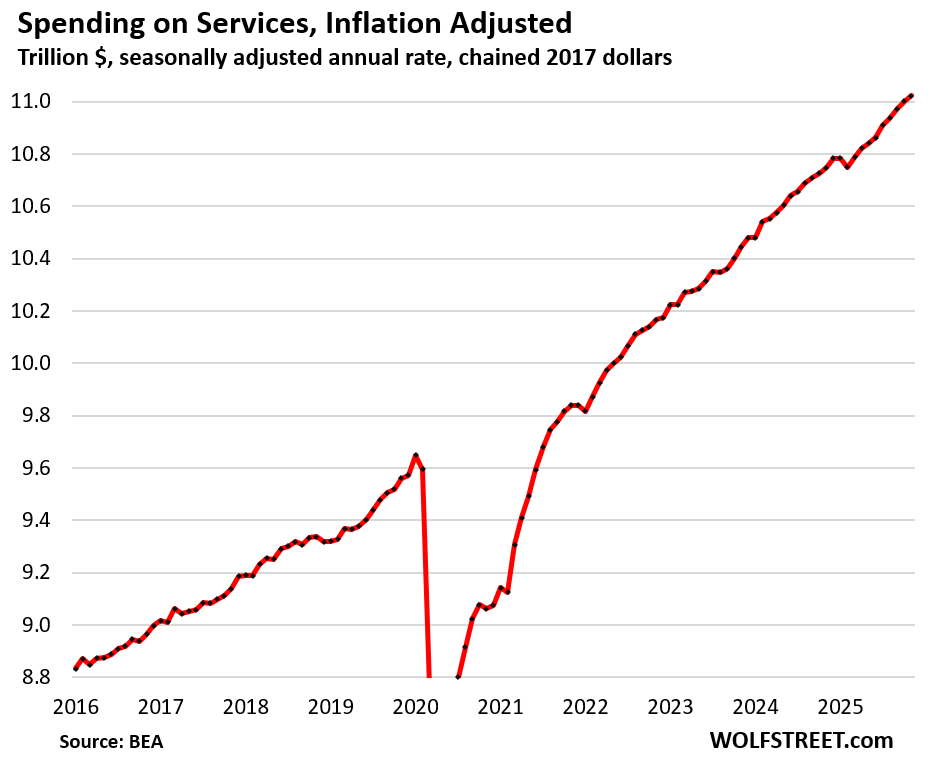
Spending on services, adjusted for inflation, ticked up by 0.2% for the month and by 2.6% year-over-year.
Not adjusted for inflation, consumer spending jumped by 0.4% for the month and by 6.0% year-over-year. Inflation in services is much higher than inflation in goods, and is difficult to dodge because many services are essential and have little or no competition or are difficult to shop around, such as healthcare and utilities.
Spending on services accounted for 66% of total consumer spending. It includes rents, utilities, insurance, streaming, broadband, cellphone services, entertainment, healthcare, airfares, lodging, rental cars, memberships, etc.
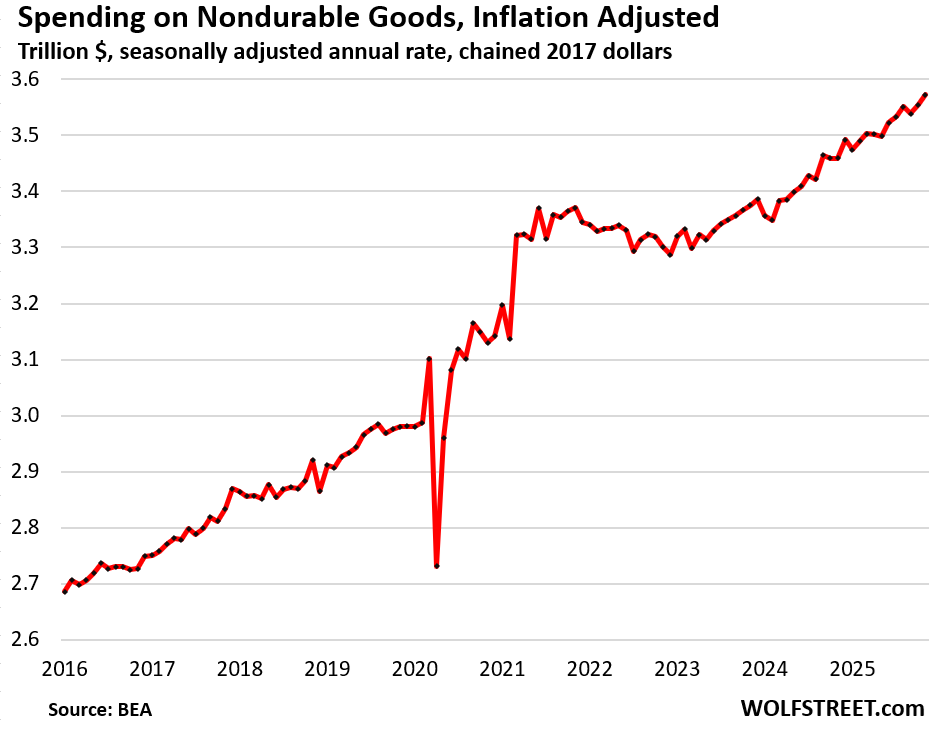
Spending on nondurable goods, adjusted for inflation, jumped by 0.5% in November from October and by 3.3% year-over-year.
Nondurable goods are dominated by food, gasoline, apparel, footwear, and household supplies:
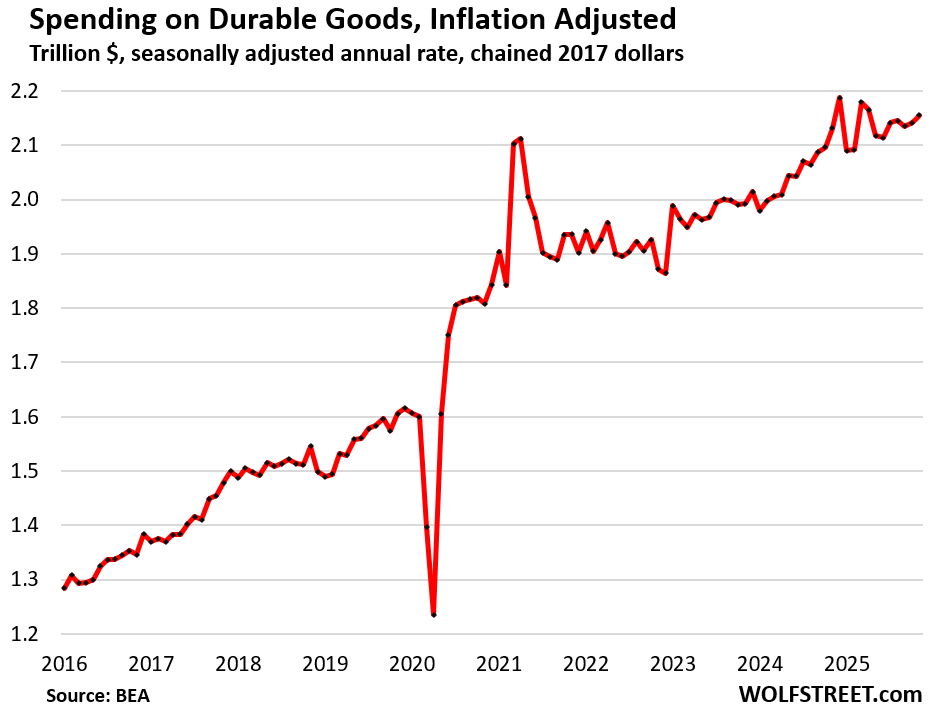
Spending on durable goods, adjusted for inflation, jumped by 0.6% for the month, and was up by 1.1% from a year ago.
In November and December 2024 and in March 2025, frontrunning the tariffs had caused big spikes in spending on durable goods. In November 2024, the month against which today’s year-over-year figures are compared, durable goods spending had spiked by 1.7% from October, which was huge. That November 2024 is the base for today’s year-over-year reading for November 2025, and that spike a year ago is the reason today’s year-over-year reading is only 1.1%; and for December 2025, the base will be the massive spike of December 2024.
Incomes
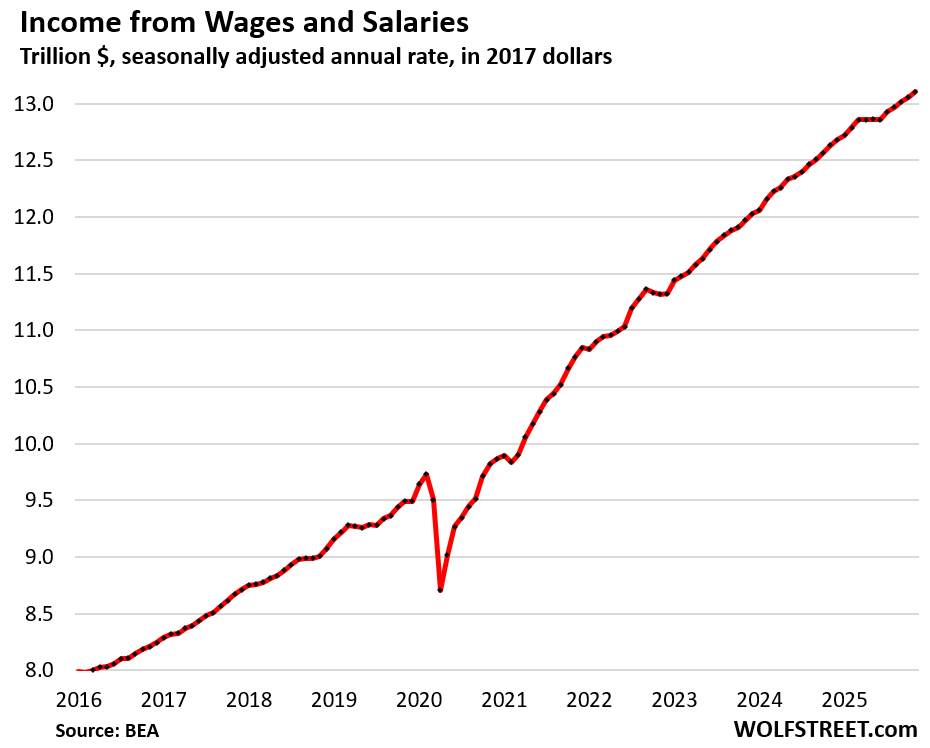
Incomes from wages and salaries, not adjusted for inflation, rose by 0.4% for the month and by 3.8% year-over-year.
This is only one part of consumer income and does not include any other forms of incomes. And it’s not adjusted for inflation.
Personal income without transfer receipts, adjusted for inflation, rose by 0.1% month-to-month and by 1.5% year-over-year.
So this is the above income from wages, salaries, plus interest, dividends, rental properties, farm income, small-business income, etc., and then all adjusted for inflation.
It means consumers continue to out-earn inflation after having taken a beating during the inflation shock in 2021 and 2022 (blue box).
But it excludes income from transfer receipts from the government (mostly Social Security benefits, but also all other government benefits, such as unemployment compensation, Welfare benefits, etc.).
![]()
Transfer receipts from the government, adjusted for inflation, dipped by 0.1% for the month but were up by 5.9% year-over-year.
The year-over-year increase of 5.9% was in part driven by the rapidly growing number of boomers receiving Social Security benefits and by an expansion earlier in 2025 of who receives Social Security benefits, which included a one-time payment of catch-up benefits in April, which caused Social Security benefit payments to surge in 2025.
During the pandemic, transfer payments spiked due to stimulus checks, unemployment benefits, including the extra unemployment benefits, and other pandemic payments made to consumers (blue in the chart below).
The chart below shows transfer receipts in blue and personal income without transfer receipts in red, all inflation adjusted. Transfer receipts account for about 19% of total personal income:
![]()
Income not spent.
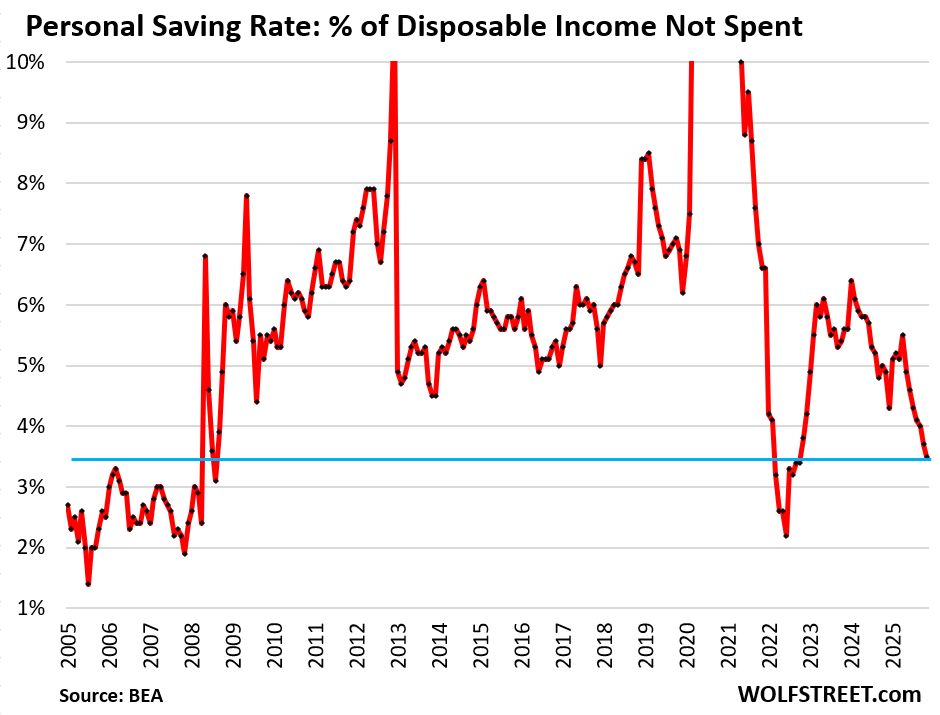
The personal savings rate declined to 3.5%. That’s the portion of disposable income that consumers didn’t spend. It means they spent 96.5% of their income and “saved” 3.5%. It doesn’t mean that they put it into savings accounts. They might have bought stocks with it, or left it in their checking account, or used it to pay down debt, or whatever.
Americans have never been big savers. Money is there to be spent and keep the economy moving. But some income gets saved anyway. The current savings rate of 3.5% is lower than in the decade before the pandemic, but higher than in the years before the Financial Crisis.
Obviously, with stocks having ballooned to such an extent, 401(k) accounts and brokerage accounts have ballooned, and a majority of consumers now have stock holdings, and they look at these ballooning numbers, and they’re looking at the ballooning value of their precious metals, and surely that’s an incentive to save a little less.
Enjoy reading WOLF STREET and want to support it? You can donate. I appreciate it immensely. Click on the mug to find out how:

![]()
There’s the danger in being reasonable…you wake up to be labled Kounter Kultur to the rest of the Joe Blows. Next thing you know they’re pinning some symbol to your hoody and telling you that “Participation will set you free”. Fo-get it. Keep Fetivus in your own way. I ain’t looking to relocate to Chinatown, Canadatown, Greenland or North Korea, no matter how tasty the shaved ice is at any price.
BuySome – Did you forget to put on your tinfoil hat today?
Why? Has tin become a good investment now too? 😜
The substantial drop in savings rate indicates the wealth effect is alive and well.
It’s worth considering what would happen if the current economy wasn’t benefiting from a wealth effect, as well as out-sized deficit spending, both of which are temporary economic drivers that should mean revert.
If the economy seems overly strong, it may be because we are stealing prosperity from the future, which is not responsible stewardship.
“Americans have never been big savers” got me questioning how we stack up against the EU, so naturally I asked my AI overlord:
Using the standard “household/personal saving rate” (saving as a % of disposable income), Europeans are saving a lot more than Americans right now:
United States: the personal saving rate was 3.5% in November 2025.
Euro area (using the Eurostat household saving rate): 15.1% in Q3 2025.
So on this commonly used metric, the euro area is saving ~11–12 percentage points more, which is roughly 4× the U.S. rate at those latest readings.
One important nuance: these series are not perfectly apples-to-apples—Europe’s national-accounts “household saving rate” includes certain pension adjustments in the definition used by OECD/Eurostat-style measures.
I love it! RUN…..IT….. HOT!
As everyone and his dog are buying gold and silver bars, I thought maybe this might be in this data, but it does not appear it is under any of these categories. Perhaps it might be included under “personal savings”?
Perhaps just hidden?
Gold, silver, stocks, etc., are assets and buying assets is NOT consumer spending and has zero to do with this data here.
Also, the total value of all gold on existence is only $32 trillion, it about twice what Americans spend each year. So even if somehow Americans were buying 1% of all gold in the world (which would be physically impossible given where it’s being held), it would be a tiny blip on these charts.
A 3.5% savings rate ain’t much to begin with and that even includes debt payments. So a guy buys a truck with monster tires for 70k and the monthly payment is considered savings even though the truck will be almost worthless in thirty years? Modern day mathematics I guess…
Most industrialized countries have better savings rates I believe. I should have saved more when I was young.
Twisted hypothetical BS. The purchase of the tires is spending, no matter how he pays for it. And after all the spending is done, and he has some income left unspent, that’s savings. The leftover unspent income can be left in a checking account or can be invested or can used to pay down the mortgage or whatever.
Thanks – didn’t think that made sense!
My Irish pub that I go to regularly is still doing great. It’s hard to get a seat when there is live music. The Drunken sailors are alive and well in Swampland.