American hot money piling into some foreign markets produced gigantic gains in 2025 (Spain +49%).
By Wolf Richter for WOLF STREET.
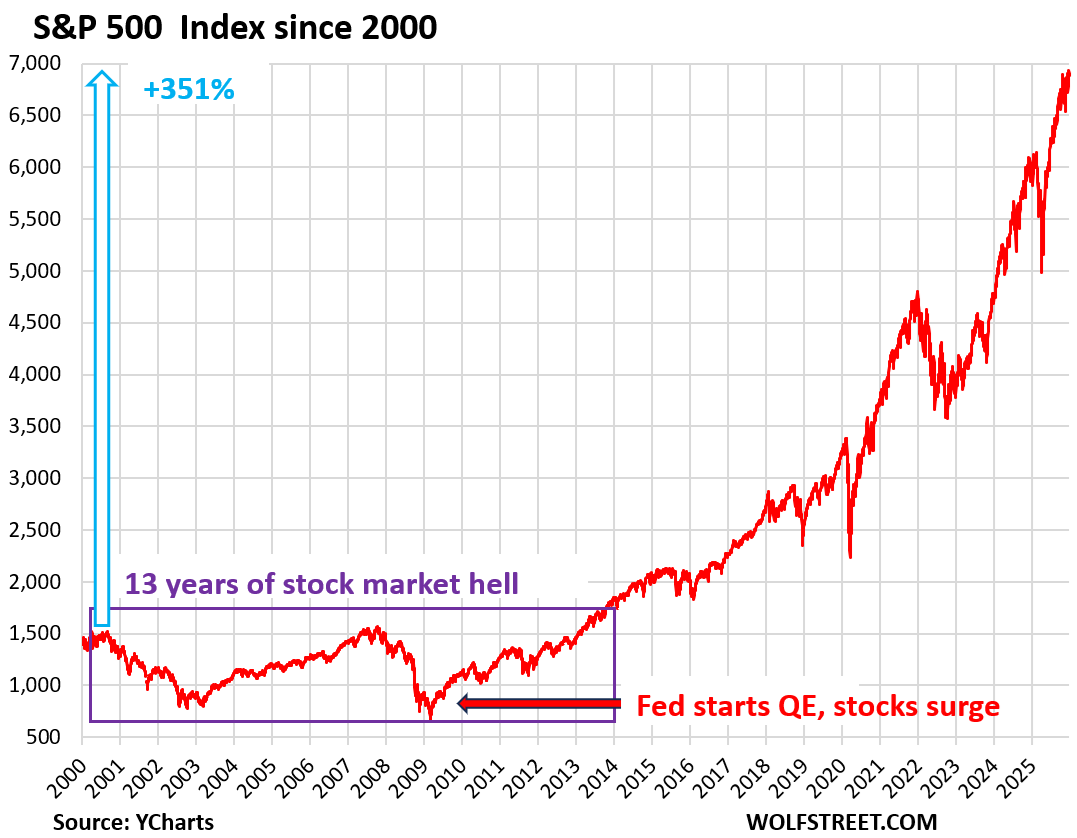
The S&P 500 Index soared by 16.4% in 2025. Since the Liberation Day bloodletting bottom on April 8, it soared by 38%. Over the past three years of 2023-2025, it soared by 79%. Since the March 2020 low, the index soared by 208%, despite two sell-offs in between. These are huge gains.
In March 2020, the Fed unleashed its mega-massive QE program, to outdo all prior QE programs, and cut short-term interest rates to near zero, and kept doing it even as inflation was beginning to rage in 2021 and heading toward 9% before they finally hiked rates and unwound part of the QE assets they’d purchased.
After the Dotcom bubble, which began to implode in March 2000, the S&P 500 spent 13 years in stock-market hell on a rollercoaster to nowhere with two 50%-crashes in between. But money-printing starting in 2009 fixed that. In May 2013, the S&P 500 surpassed its March 2000 high in a sustained manner. Today, it’s up by 351% from the March 2000 high (index data via YCharts).
American hot money gushes into overseas markets.
As big as the gain was for the S&P 500 Index in 2025, it got beaten by a number of major stock markets around the world as American money gushed into them and pushed some to crypto-like gains.
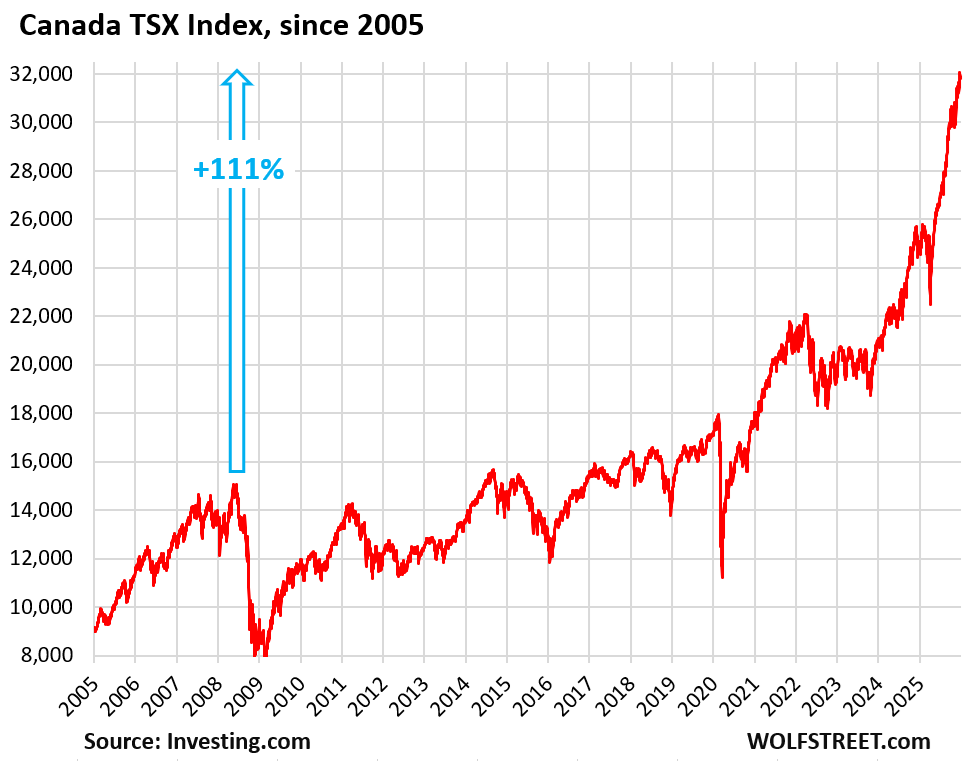
Canada’s TSX Composite Index in CAD and USD:
The TSX soared by 28.2% in 2025, to 31,713, after having already soared by 18% in 2024.
Since the April 8 low, it has exploded by 41%! US tariffs may be bad for Canada but good for Canadian stocks? Whatever. More likely, American hot money.
Since the March 2008 high, it has risen by 111% (all stock-index and currency data below via Investing.com).
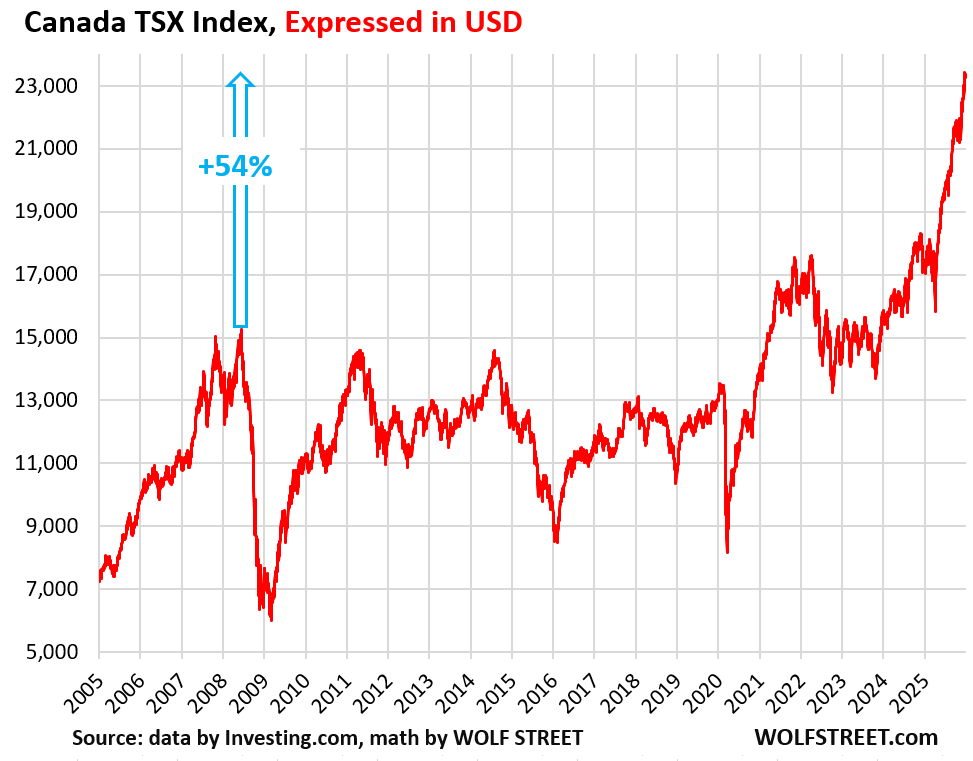
The TSX is denominated in Canadian dollars, which finally rose against the USD in 2025. So expressed in USD, as investors in the US would see it, the TSX did even better in 2025, soaring by 35.5% for the year, and by 47% since the April 8 low. These were huge gains for US-based investors.
But the prior years were tough. Since 2011, the CAD has zigzagged lower from over 1 USD per CAD, to 69 US cents per CAD in early 2025.
So the gain of 111% from the March 2008 high shrivels, when expressed in USD, to a gain of just 54%.
And for US-based investors, there were no gains between 2007 and early 2021, just zig-zagging up and down for 14 years.
The chart shows the TSX index expressed in USD since 2005 (each day’s TSX value is adjusted by the exchange rate at the time):
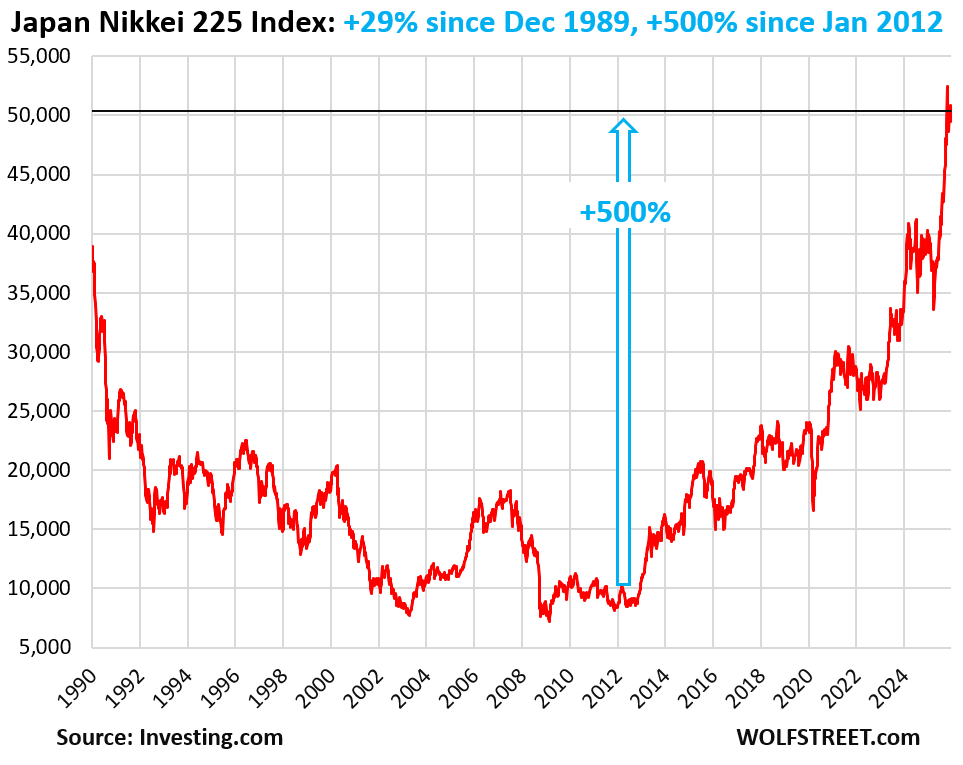
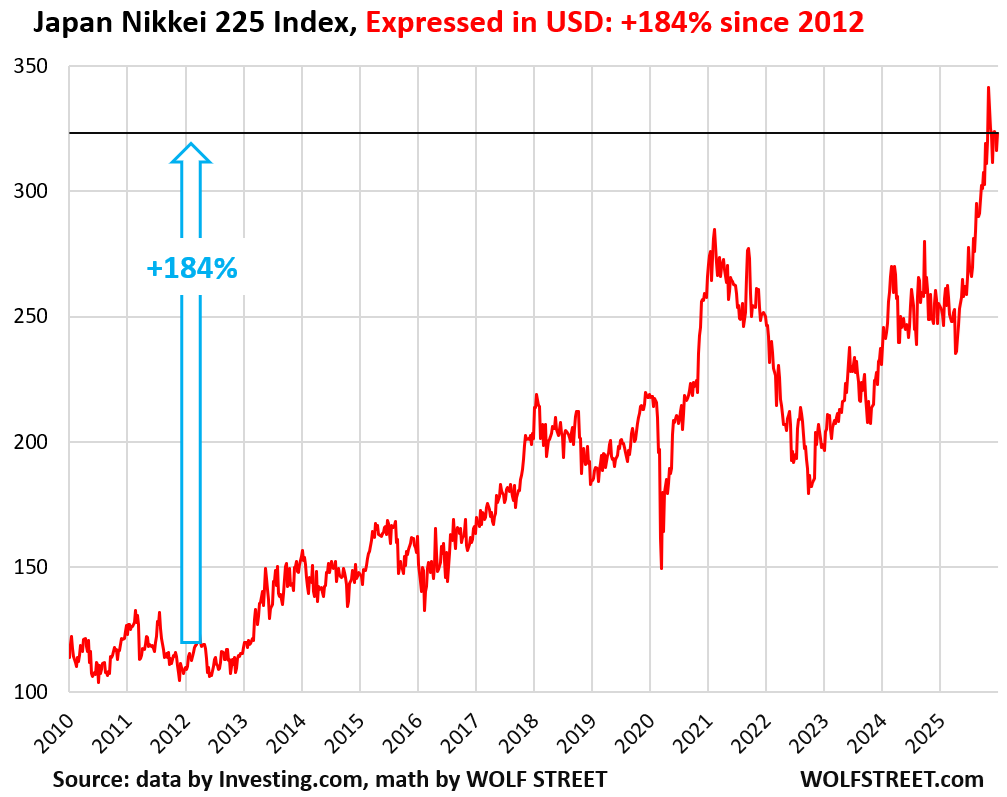
Japan’s Nikkei 225 in YEN and USD:
The Nikkei 225 index soared by 26% in 2025, to 50,339, after having already gained 19% in 2024, when it edged past the 1989 Bubble high, and 28% in 2023.
In the 36 years since the Bubble peak in December 1989, the Nikkei 225 has risen by 29%. It was a wild ride down to 2012, and a wild ride up to 2025.
Since January 2012, the Nikkei 225 has soared by 500%, from 8,390 to 50,339, as the Bank of Japan was going hog-wild with QE, that included equity ETFs and ended up putting over half of Japan’s gigantic government debt on the BOJ’s balance sheet, and triggering substantial inflation that it is now trying to contain.
The BOJ started shedding its bond holdings in 2024 and announced recently that it would very very very very slowly sell its equity ETF shares, as part of its accelerated QT program.
But the yen has plunged against the USD since 2012, when the BOJ set out to knock it down with its policies.
It now takes ¥157 to buy $1. Back in January 2012, it took ¥77 to buy $1. In other words, since 2012, the yen has collapsed by 50% against the USD. A substantial portion of that collapse took place in the three years of 2022-2024.
For USD-based investors in Japanese stocks, that 500% gain of the Nikkei 225 in yen since January 2012 shriveled to a still substantial gain of 184% in USD.
The chart shows the Nikkei 225 index expressed in USD (each Nikkei 225 value is adjusted by the exchange rate at the time):
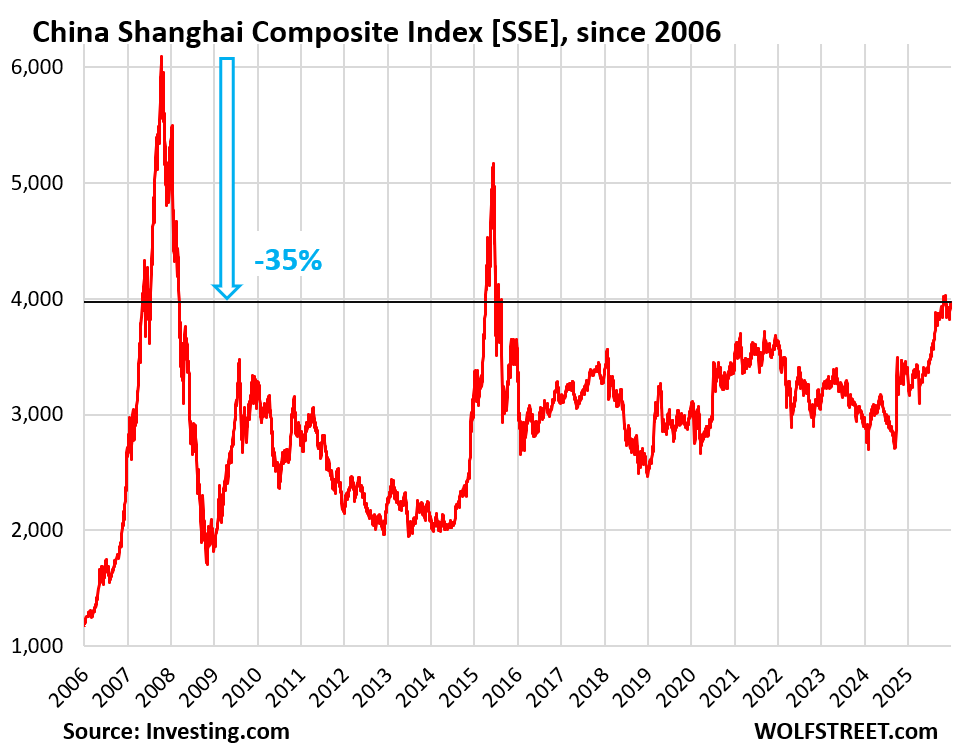
China’s Shanghai Stock Exchange:
The Shanghai Stock Exchange index [SSE] rose by 18.4% in 2025, after the 12.6% gain in 2024, and losses in 2023 and 2022.
China’s stocks experienced two bubbles that both collapsed. The all-time high was reached 18 years ago, in October 2007; and currently, at 3,969, the SSE is down 35% from the peak 18 years ago and back where it had first been in May 2007.
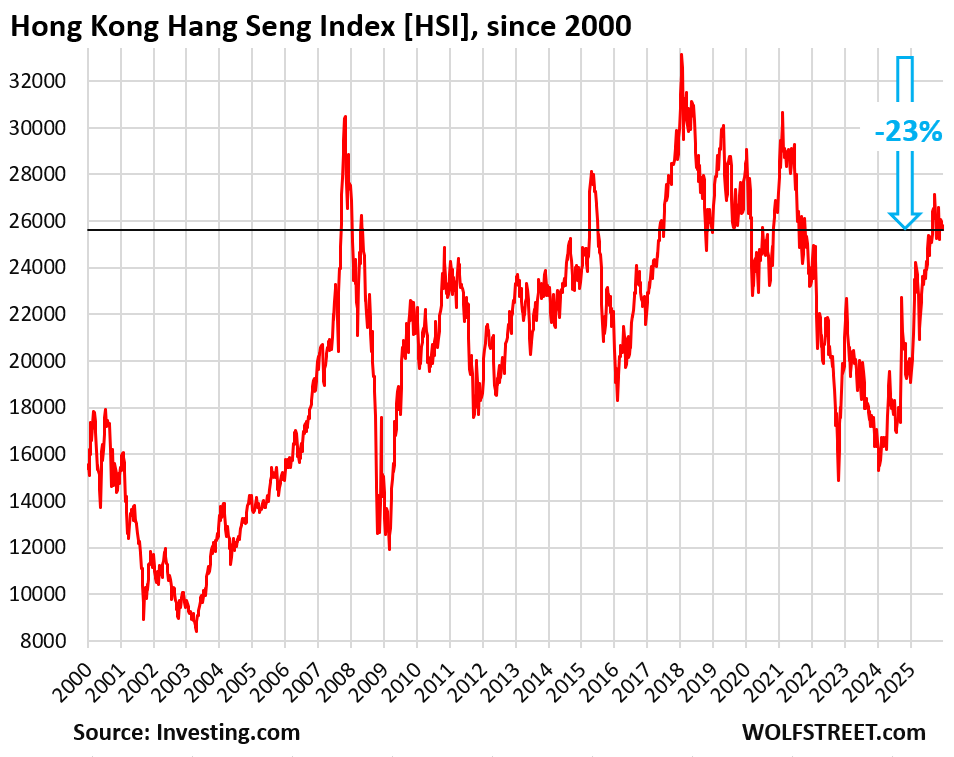
Hong Kong’s Hang Seng Index:
The Hang Seng Index [HSI] soared by 27.8% in 2025, to 25,630, after having already soared by 21% in 2024.
The index is still down by 23% from the all-time high in January 2018 and by 16% from the 2007 high, and is back where it had first been in September 2007.
A very rough 18-year roller-coaster to nowhere.
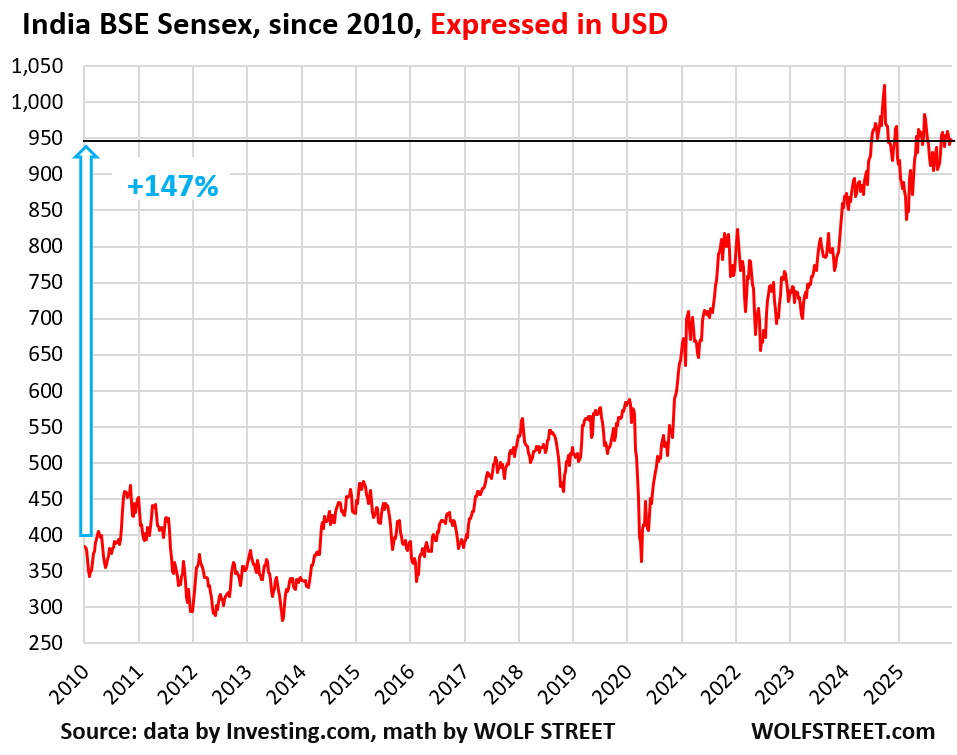
India’s BSE Sensex Index.
The BSE Sensex Index rose by 9.1% to 85,220 in 2025, which left it a hair below the peak in September 2024, with a sell-off in between.
Since 2010, the index has soared by 388%. But over the same period, the Indian rupee has plunged by 51% against the USD.
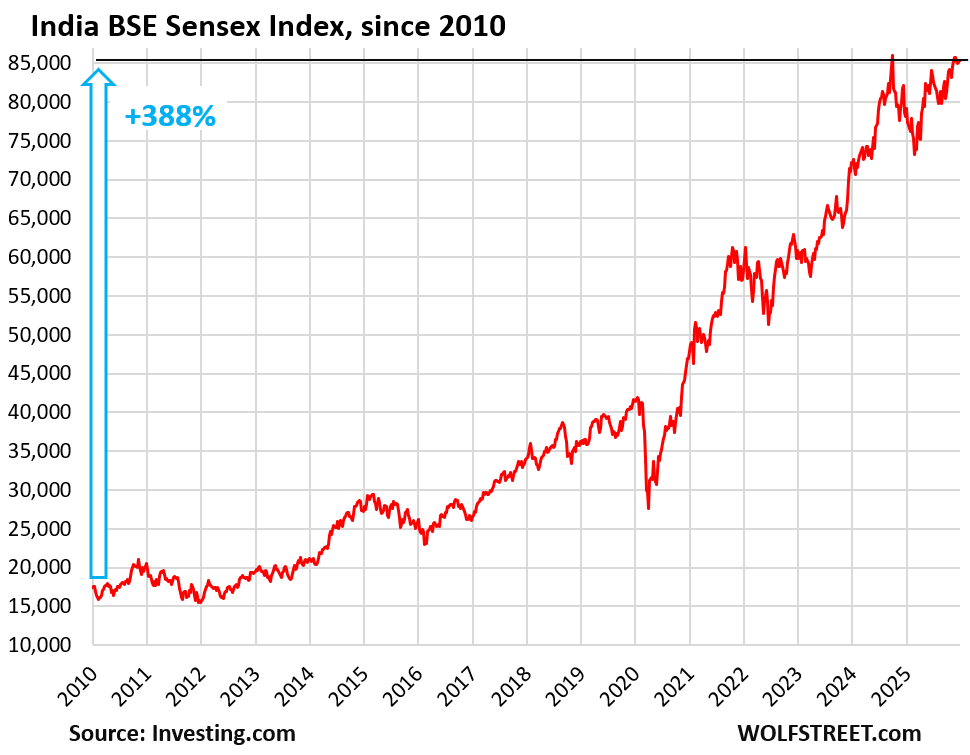
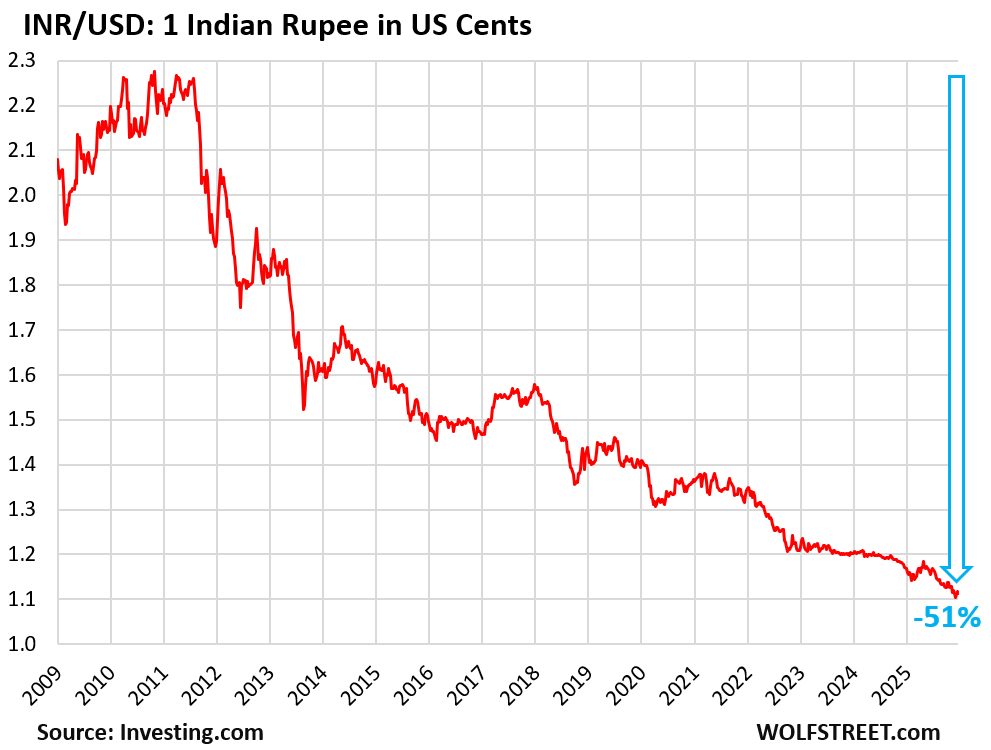
So, for USD-based investors in Indian stocks, that 388% gain in rupees of the BSE Sensex since January 2012 shriveled to a still strong 147% gain in USD terms.
Today’s level in dollars is where it had first been in June 2024.
The chart shows the Sensex expressed in USD since 2010 (each Sensex value is adjusted by the exchange rate at the time).
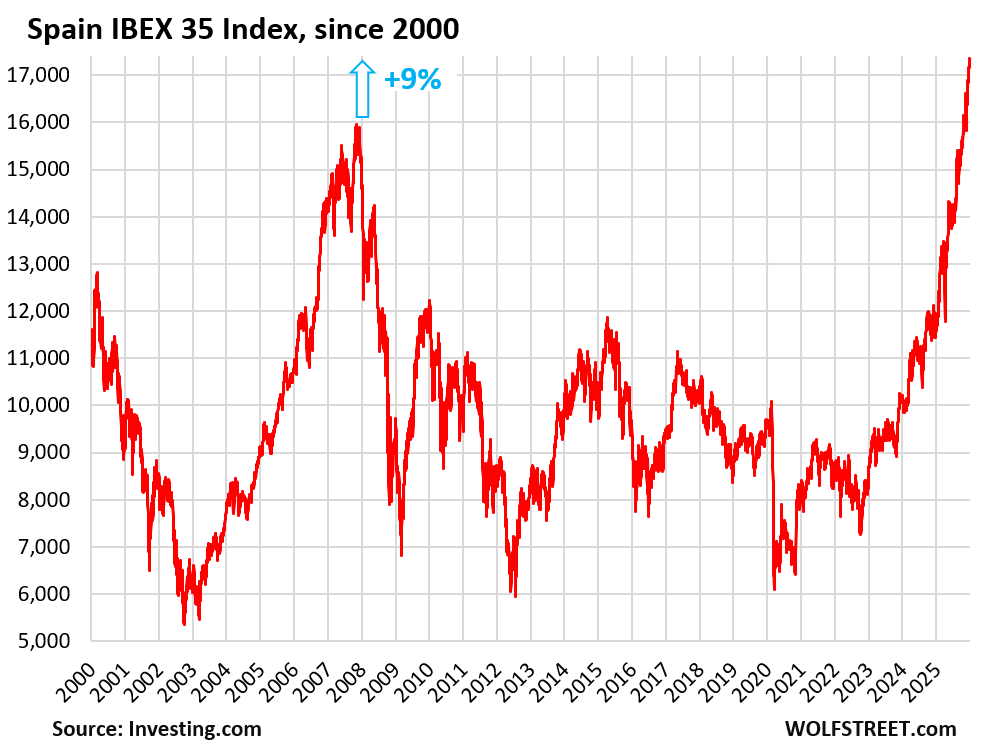
Spain’s IBEX 35 Index.
The IBEX 35 exploded by 49% in 2025, to 17,307 after having already surged by 14.8% in 2024, for a two-year gain of 71%! And for a three-year gain of 110%! Hot patootie!
In late October, the IBEX 35 blew past the prior all-time high of December 2007 and ended the year 9% higher than the 2007 high.
European stocks became a huge favorite for US investors, and when this American hot money piles into a foreign market, it jolts that market, especially a smaller market like that of Spain.
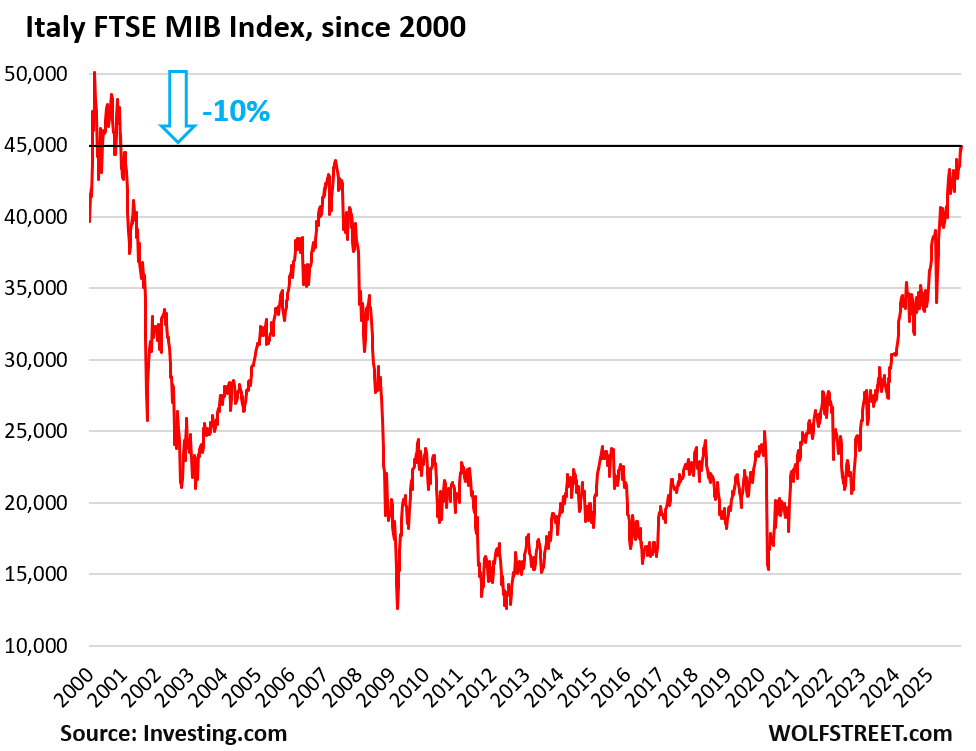
Italy’s FTSE MIB Index
The FTSE MIB soared by 31.5% in 2025, to 44,945, after having risen by 12.3% in 2024. Since October 2022, the index has more than doubled. Since 2012, it has tripled.
But it was still not enough to break the March 2000 bubble high, and today it’s where it had first been in January 2000.
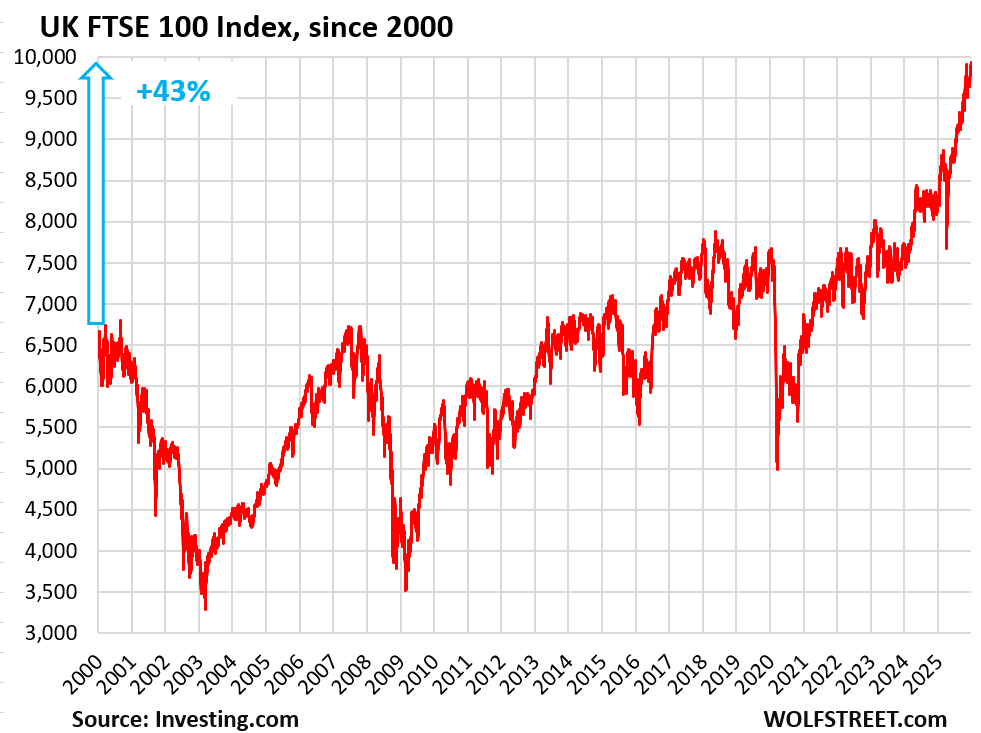
UK’s FTSE 100 Index.
The FTSE 100 soared by 21.5% to 9,931 in 2025, after the 5.7% gain in 2024.
In the quarter century since the beginning of 2000, the index has risen by 43%.
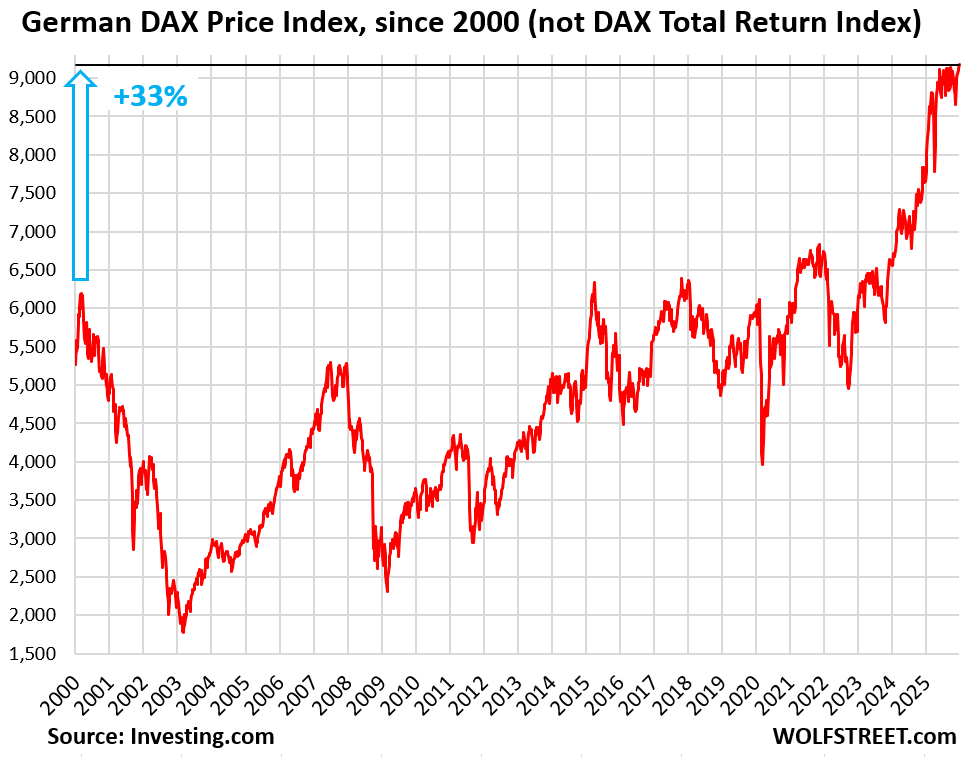
Germany’s DAX Price Index [DAXK].
The most widely cited German stock market index, the DAX, is a “total return index” that includes dividends and is therefore not comparable to a “price index,” such as the S&P 500 Index, and all the other indices here, which do not include dividends.
But the DAX Kursindex [DAXK] is a “price index” that does not include dividends and is therefore comparable to the S&P 500 Index and all the other indices here.
The DAXK soared 20% in 2025 to 9,175, after having already soared by 16.5% in 2024.
Over the quarter century since the March 2000 high, the index has risen by 33%.
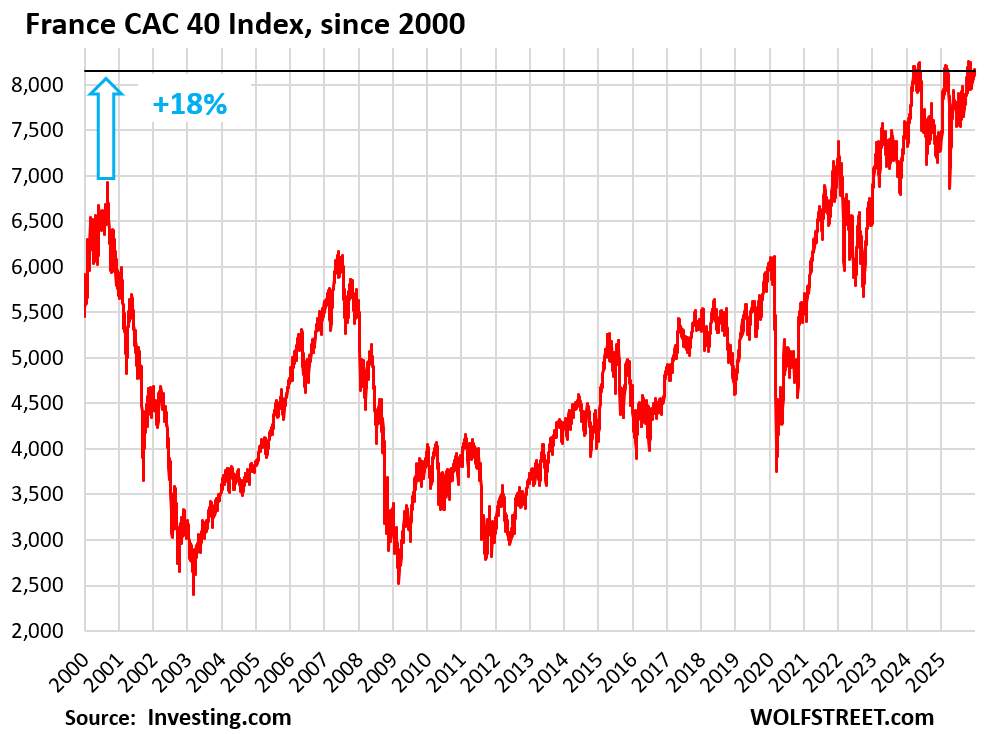
France’s CAC 40 Index.
The CAC 40 rose by 10.4% in 2025, to 8,149 where it had first been in April 2024. But it had declined in 2024.
Over the quarter century since September 2000, the index has risen by 18%.
But since the ECB’s huge money-printing binge began in 2011, the CAC 40 nearly tripled. The miracles of money printing. The ECB kicked off QT in late 2022 and has since then shed 51% of its QE assets (bonds and loans).
Enjoy reading WOLF STREET and want to support it? You can donate. I appreciate it immensely. Click on the mug to find out how:

![]()
Happy New Year everyone!!!
🎇🎉🥂🍾
Happy, healthy, and prosperous New year to you and yours Wolf. May 2026 be brighter and kinder to all.
I would be curious to hear everyone’s thoughts on putting some money in South American ETFs for diversification purposed for 2026. I am torn on what to do with new investable funds. Gold and Europe were both very good to me this past year for sure, so I am torn on more of the same or seek some diversification with maybe a SA large cap index fund.
I’ve honestly been looking for a MENA fund, as long term Africa has a lot of promise and I would call LatAm 2nd.
Well, the answer too such a demanding demand. I would recommend putting it all on the line, America first, an S and P ETF.
Efficient market hypothesis says buy VT (market weight entire world) and never worry about it again.
Well yes of course the universal acceptance of the Efficient Market Hypothesis has always been suspect, given the holistic menu of requirements defining the liturgy of the supply versus demand model that sets the price where the marginal cost is equal the marginal revenue
The majority of business in the US is hardly competitive capitalism but a corrupt form of crony capitalism pocketing the DoD budget.
The current silicon valley strategy. Fuck competition when the Defense budget is granted almost automatically with a cola built into the contract.
With new money I’m just buying good food companies(there are some in South America)…..and defense companies…..and drug companies. It’s feisty times that we live in.
This all just says to me that fiat currencies, worldwide, are being debased, in a semi-coordinated effort.
If everyone is doing it, any one country doing it is less noticeable.
Priced in gold the Dow is actually down since 1971. You see gold was ~35~ and ounce then, and the Dow was ~800~ so you do the math. Inflation works in mysterious ways. Few seem to accurately account for this. I’m always looking for a house to buy when prices approach 100 times average monthly rent. But that’s with cash only purchase on the head. Banks muddy things up too much. And the freekin arrogance OMG. Also insurance and taxes need to be considered these days, and in Florida HOA’s and assessments have gone absolutely ape with condo’s and flood on top of homeowners have gone bonkers too in residential. So Many things have caused this, but our elected must find a way to fix it soon, otherwise the whole shit show goes bust imo. Hence the term ‘boom and bust’.
So I figure there is going to be more hell to pay before that mess clears the markets at the best.
It just depends on exactly how fast these fiat’s expand with inflation and gold will be the ultimate arbiter or the ‘canary in the coal mine’ like it’s been for thousands of years that determines what things will cost imo. Eventually. But make no mistake, hard assets tend to hold up best in fiat expansions, If you can hold on them.
Stocks pay a yield and yields eventually double VAR value at risk, Gold does not pay a yield . My charts don’t go back to 1971, However, from 1981 to 2000 the Dow 30 outperformed Gold by a bunch. From 2000 to 2012 gold outperformed the Dow 30 and from 2019 until now Gold outperformed the Dow 30 but if you change it to the QQQ as a comparison gold has outperformed the QQq since only mid 2021. Maybe the Bear market in gold has started and the bear in equities. 10 20 30 years from now we can say what outperformed what. The super cycle bear will be here for some time if awoken like I believe. More than feeling :)
The above is without yield calculated, so it’s nominal value in dollar terms not real with yield generated
For a more complete gold v. stocks comparison that includes dividends, you can use the S&P 500 Total Return Index. The Yahoo chart goes back to 1988.
Between 1988 and Dec 31, 2025, the S&P 500 TR gained about 5,800%.
Over the same period, gold (Jan 1988 = $470) gained “only” about 830%.
https://finance.yahoo.com/quote/%5ESP500TR/
And the metal will be there and always have a demand. Not so much the fiat currency of the moment.
Once precious metals started to become a consumable item (not just monetary and jewelry) some have started to reconsider it’s value. Maybe you, too?
Diversification is key….
When one asset is up… others down…
Buy in weakness… sell in strength.
Nothing is a concrete given.. nothing…
gotta go with the flow. Don’t follow the crowd.
So, to summarize, world QE equals asset inflation. Congrats to all asset owners!
When the goal is to monetize debts in proportion to GDP growth, beginning from a position of ample liquidity, it looks like they are simply trying to protect asset price bubbles, as opposed to encouraging capital productivity and lasting economic improvement.
That asset price inflation since 2022 occurred during the biggest wave of QT globally ever. QT started in 2022. Between the Fed and ECB, they shed over $5 trillion from their balance sheets, not counting what other central banks have shed.
While the record is clear that asset prices shot up, in my working hypothesis, causing the price of everyday goods to increase in price at a rate that exceeds the cost of living adjustments which is generally considered inflation.
While strangely the understanding of what deflation is, is a fall in asset prices.
Obviously an asymmetric model masquerading as a normally distributed model around a mean which it clearly is not. Indicating an inherent bias
One word: KOSPI
3 more:
Happy New Year
I join you in wishing a Happy New Year to my fellow human beings.
If their is a nagging issue that awaits 2026 like a pulmonary embolism it is the unsustainable difference between the ask and the bid.
Affordability
Someone should capture a screenshot of Kitco’s Rhodium closing price quote showing $981 with a final loss of 89% of value! Is this a holiday joke or a cherry bomb in their machinery?
Buy,I checked that out and feel some weird glitch,that,or it’s uses just vanished?!
I do not own that in me stacks of metal(in hand)but will now keep a eye on it,feel just a Kitco mistake.
Will be a interesting year in metals I fell as was last year.
Happy New Year all!
Reminded me of doing some research into an old belt buckle manufacturer. Some of their literature indicated you could get one made of brass or rhodium…never said “plated”. I seriously doubt there’s any quarter-pound rhodium buckles floating around out there no matter how low the nominal price was in the past.
Years ago when gold was at $600 an ounce, Rhodium reached $10,000 an ounce and was the first metal to do and then collapsed to $700 an ounce. It is a great metal to plate over silver in jewelry and never tarnishes.
Wow, these foreign markets are where that overnight repo money is going. That overnight thing never made sense, but all of these foreign markets are in different time zones.
Misconception here. “overnight” repo means you borrow for example at 10 am in the morning and pay off the loan the morning of the next business day. That’s all that is. In the repo market, you can also borrow for longer, such as one week, or more weeks, or even a year, but those term repos are less common than overnight repos, and the yields are higher.
Why is there so much investment in Spanish stocks? Isn’t the young people unemployment there like 25%?
American hot money chasing after meme stocks, cryptos, AI stocks, Spanish stocks, etc.
because the number includes students not looking for work.
from eurostat:
“Many young people, unlike their older counterparts, are engaged in full-time studies and do not actively seek employment. This means they are not part of the labour force for which the unemployment rate is calculated. To address this, an alternative indicator is calculated for analytical purposes: unemployment ratio for young people. This ratio represents the proportion of unemployed young individuals among all young people aged 15 to 29, whether they are seeking employment or not.”
The unemployment ratio for Spain is around 10%, still high but lower than Swedens.
Wolf, what basis do you have to say that some non US exchanges went up so much because of American hot money.
Because they have been immensely hyped in the US for several years. All kinds of financial advisories talked about it… you gatta buy European stocks. You’re in Canada, so maybe you missed all the hoopla about it, but it was a huge meme here and still is.
Your own Statcan reported on a large increase of foreign purchases (mostly from the US) of Canadian equities.
The big question is, whats next….
Wolf,
Thanks for the historical charts of the equities markets – please periodically update them (the way you do for RE markets).
As time goes on, it is harder and harder to believe in the (remote) accuracy of valuation in individual stocks, real estate properties, etc.
But it remains somewhat easier to believe in seeing national/world capital markets as sort of sloshing between gigantic asset *class* bathtubs.
Long term historical charts of a varied number of asset classes helps to examine this viewpoint.
“please periodically update them”
This article is my classic End of Year article. I’ve been running these charts for years.
I’m a frequent reader and I never knew that.
I’m sure there is a ton of interesting data/charts/posts buried in the depths of Wolfstreet – perhaps a few more site navigation aids (additional tags in the leftmost column?) might help surface these hidden gems and up the page view count a bit.
Plus, maybe you wouldn’t have to say RTFA so much if there were multiple ways to access roughly the same kinds of data (again, additional site navigation tools, post tags, etc.
Here is the article from a year ago:
https://wolfstreet.com/2025/01/01/global-stocks-over-the-long-term-the-sp-500-the-big-standout-vs-markets-of-japan-china-hong-kong-india-uk-france-germany-italy-spain-and-canada/
If you kind of know what you’re looking for, google it; put wolfstreet in front, then the search terms. Ignore the AI result because that can be real hogwash. Go to the wolfstreet links. That’s how I do with when I’m looking for something from years ago.
If you’re looking for something more recent, go to the categories listed at the top of the left sidebar. If it’s about stocks, click on “Companies & Markets.” If it’s about government debt, click on “Debtor Nation.” Etc.
Have a look at the Buffett Indicator – the ratio of the total United States stock market to GDP:
Buffett Indicator = Total US Stock Market Value / Gross Domestic Product (GDP)
We are over 2 standard deviations above the historical trend line going back to 1950. But perhaps other countries have more favorable trends, and this is what is attracting investment? It would be interesting to see all of these countries’ stock market valuations overlaid and normalized to country-specific GDPs.
Whole lotta parabolas in those charts above. I guess based on the last 17 years, they actually will keep going forever, but they usually don’t.
Pump and Dump. USA in the dump phase now for some months, the big traders started pumping the cheaper European markets. They were cheap for the reason that those countries are in a long term no growth mess. 90% of trades are now AI and algorithms, it will be interesting to see what happens when the computers work it out. They will find few buyers in their dump efforts. A chance for me to keep buying USA IT etfs, they will keep moving sideways for a while. Nothing else in the world world for my money.
Happy New Year!
Healthy new year everyone!
We have outperformed the $gdow global Dow index(95%of world market cap) since before 2000, i assume it’s because our trading partners have reinvested their surplus $usd back into our country, that is a benefit of having a huge trade deficit.. I am huge fan of warren buffet, his favorite indicator of stock market valuation is total stock market cap ratio to GDP. Right now USA is ~230% or 2.3. China is trading at 75% or .75 China is growing their GDP way faster than us, no premium given for growth! Warren bought ar 40% or .4 market cap to GDP in 1974 and has bragged about it since :)On 3-6-2099(a secular bear ended) when the SP 500 hit its low at 666 that equaled ironically ~.666 market cap to GDP, i was actually hoping i would of got the chance to buy at .4 like Warren, but the POTUS in 2009 on that day or the next came on tv and said its safe to buy stocks again. perfect market timer he was :) During the secular bear market than began on march 2000 when the sp 500 traded at 1553 the first low wasn’t until oct 2002 (the QQQ bottomed that day) but the SP 500 traded at 768 for the first leg of the bottom. In oct 2007 we get barely new high in the sp 500 at 1576(double top) than the crash happen until we hit 666 in march 09. I watched most of happen on the charts in real time. Where are we today? Secular bull market peaked 12-26-26? super cycle bear comes out of hibernation and no magic bullets in the gun? We had the Great Resignation post covid now we are having the Great Deportation. Unemployment rate inverts below inflation in 26! Time will tell. i have an outstanding call i made here, Dow 30 pukes to 45Kish and bounces back to 46Kish. than its all down hill, coin toss we get a new 52 week low in the spy that was hit on april 7 at $481.80 before April 7. Forecast 2026 year end SP 500 at 4,358.the super cycle bear wants the past due rent! Payment will be paid!
Thanks for hosting Wolf, i hope your eyeballs here trend up and up!! Joy and health to all!
Wait! So on 3-6-2099 the S&P 500 went to 666? Is this Back To The Future Part Four? Biff’s gonna be rebuilding that casino soon! 🥳😂😂
Ha, also my memory may of been wrong with willshire 5000 to GDP in March 2009. Or revision were made to GDP since then. I was tracking it at the time and it was extremely important to me but when I look now it’s a different ratio, go figure.
Thanks for the clarification.
This reads like a zero hedge wet dream
I followed them early on when they started but their comments by their followers became anti semantic, yeah they are perma bearish except when DJT is the POTUS than very bullish, they are in the White House press conference now so every thing is awesome :) :) I have spot gold going to 2650 buy mid 2026 they and their followers worship the metal and crypto. silver is complicated to many variables, small market cap to make a logical target, just it will underperform gold on the way down. I assure you I only follow the charts, Listen to the universe and pay attention :) Like Rasheed Wallace would say the ball don’t lie. Charts don’t either. You just got to look at the right places. I am guessing tomorrow or Monday will be the best time to sell in 2026. MTV just shut down it had a good run for 44 years. All things have time expiration, this bull just reached its. Delusional is in my name :) when $vix closes above 18.52 it’s going to rocket ship higher.
I mean I get it but isn’t true Warren buffet hasn’t outperformed the sp500 since like 2000?
Things always change. One indicator is probably a poor way of judging anything these days.
I just did the math BrK/A has outperformed the spy from March 2000 until now by 71%
Sorry 61% outperformance from the day the spy peaked in March of 2000. Not bad! I did the last math in my head. Ugh.
Thanks wolf for posting the chart in the comments. I use to get Barrons in the mails and read the up and down Wall Street I loved Alan Abelson , than Randal was good too but Alan Abelson I was excited to read his every article, Legend in my mind. I say this because lately I’ve been here reading!!!
QQQ 5 years up, since 2021. 2/3 years down to oversold, to a spring, in 2027/ 28. From there 17 years up.
I’m just sitting here waiting for the AI bubble to pop. This parabolic rise is unsustainable. Short ETFs will be a great thing.
USD/JPY is 156.66, it open the year with the triple 6s. Every trader is paying attention! The yen will rise all year and risk will be sold with its rise. I am taking a holiday. Go Indiana!!!
Thanks again Wolf. Sorry if posted too much today!
Stay away from leveraged short ETFs, they are for suckers.
Just buy put options.
All I see is a collection of central bankers destroying their sovereign currencies…..and the populus scampering to protect themselves by buying just about anything.
If you’re at a poker game and everyone can break their chips in half, the game doubles in size….as counted by broken chips.
And the US has a President who bluntly pushes for lower interest rates, more cypto, and a weaker currency. He likes the idea of breaking the chips in half.
SPX might rise to 7.1K/7.2K, for an UT, before falling lower. SPX, in 2026, is 4Y away from 2022 close. Plenty room for negative stuff, plenty room to drop. In 2028 SPX must rise above 5,900 and move on.
12 years of stock market hell.
Oh boy that sounds fun. Not!
I’m guessing that might be coming soon?
🤬
Surely this can go on forever. Because the UK and Germany have such healthy and promising economies this makes perfect sense. It’s just more evidence of ‘too much money with nowhere else to go’. To be sure, they’ll just figure out how to take more from the poors
Widely disbursed costs (inflation) upon many to the concentrated benefit of a few (asset holders)
Who still believes in “Work hard, be a saver and never a borrower or lender be”????
Not DJT. He wants the saved money, the fruits of labor, to depreciate over time….and so does the Fed apparently. Force people into buying what the elites already own. IMO
“too much money with nowhere else to go”
Just think how much less money would exist without bailouts (QE is just a bailout). They make themselves whole and your cross your heart and do some hail marys because they let you keep crumbs.
Canadian telecom stonks like Bell and Telus seemed to have suffered huge losses this year, while Roger’s Comm. and Quebecor have modest gains.
Junior mining stonks skyrocketed a lot though. The TSX weirdly allow penny and dollar stonks in the index.
You have to be crazy to put new money to work now, maybe the market has another up year, but you will see the S&P at 6000 again at some point.
Maybe 5500, but 6000 is a lock.
I also think gold could have a 20% correction, it is like any other asset, it is not immune from falling, it has in fact had many corrections of 10, 15, 20 percent over the last 20 years.
Well unless you belive in dollar cost averaging which most bogleheads do.
So one would keep buying every paycheck or to support their plan. If it goes up you buy if it goes down you buy. You get the average that time gives you.
Warren Buffet and a lot of talented investors don’t really invest this way. They had their own advantages they could press when the chips were down.
His mentor liked to find deals. He tried that a good bit (called them thrown away cigars with one puff left). Then he credits Munger as opening his eyes to higher quality companies who were down but had good potential.
But yeah doesn’t seem like a great time, unless AI makes our GDP double, triple or quadruple. Then the stock market could shoot to 20,000 and the cautious of us (me included) are left behind paying the same prices as the rich get. And those prices are going to be really high.
But who knows! 🤷
Unless you own physical gold, it isn’t much different than owning crypto. There is some imaginary fixed quantity that is stored in a remote location never to be seen or held.
I admit, I benefitted from both gold and silver this year but got out when I realized it could all go away with a word from Powell and the avalanche began.
What do you call that when ‘it could all go away with a word from Powell’ rather than baseless and very stupid manic speculation?
Russel,I will keep me metals in hand forever,they are a store of value I hold to leave to folks when I get sick of this plain of existence.
I have other goods in baskets and also ready for a man made/natural disaster to best of abilities while also enjoying the day.
As always,we get some economic sanity more then willing to see the metal values drop,would be a price worth paying,just won’t hold me breath!
So much hating on the Federal Reserve on this site, when fiscal policy seems to be more the problem to me. No wonder we never have bad recessions anymore and values of everything keeps going up, when 5-10% of GDP is government deficit spending. Balance the budget and we’d have a recession and correction rivaling the 1930’s.
It takes a spineless legislature to create deficits and a spineless central bank to monetize the debts that fund those deficits. Deficits, absent central bank debt monetization, would correct on their own.
I agree the spineless legislature is the fundamental problem, more than the Fed. Maybe I’m wrong, but I thought Congress creates the “free money” when they pass a budget deeply in the red, and it is the Treasury’s Job to sell IOUs(Bonds) to finance it. Not sure that is the Fed’s fault.
“Maybe I’m wrong, but I thought Congress creates the “free money” when they pass a budget deeply in the red…”
Congress does not create free money. It creates legislation. And the Treasury doesn’t “create free money” either. It can only borrow money and pay interest on it, or collect money via taxes.
Thank You. Really enjoy this website.