Rents spiked in San Francisco, Chicago, NY City, Rochester, Kansas City… rose more slowly in others… fell in Austin, Denver, San Antonio, Phoenix…
By Wolf Richter for WOLF STREET.
Asking rents – the rents that landlords show in ads for their vacant rental properties – are not moving in lockstep across markets. In some markets, overall asking rents for mid-tier multifamily rental apartments, condos for rent, and single-family homes for rent, all combined, are spiking, such as in San Francisco, Chicago, Rochester, New York City, or Kansas City. In some other markets, these asking rents are falling, such as in Austin, Denver, and San Antonio. But overall, markets where rents are rising are overpowering markets where rents are declining.
There is also a big difference between multifamily apartments, where rents are under pressure in many markets due to large amounts of new supply of rental units and condos for rent; and single-family rental homes, where rents have continued to rise in most markets.
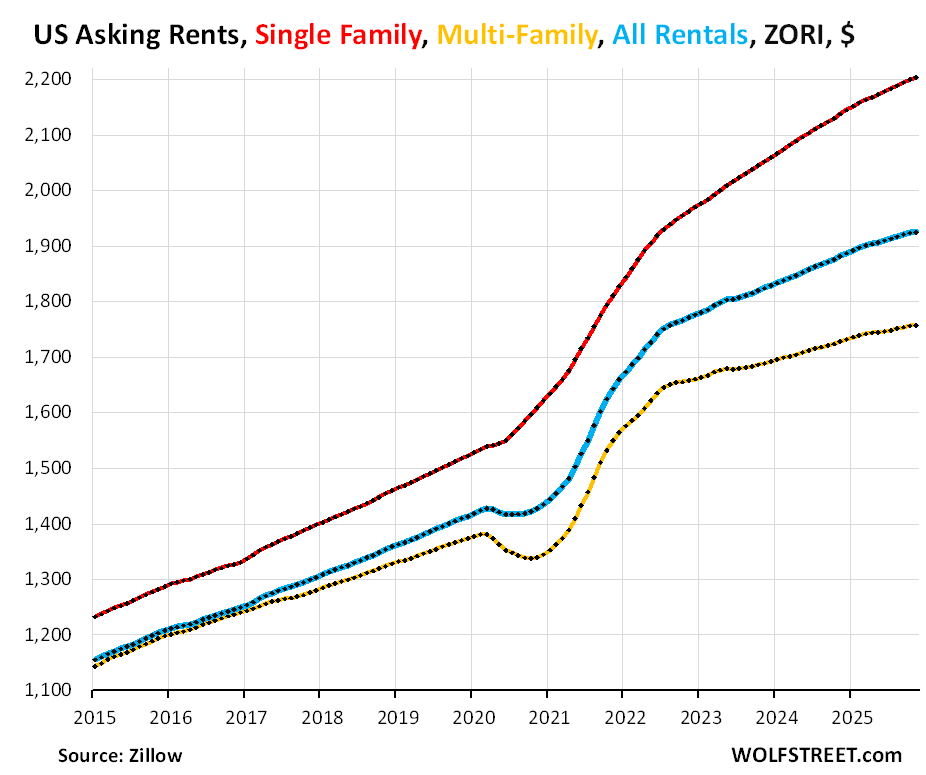
Across the US, asking rents in November rose year-over-year per the Zillow Observed Rent Index (ZORI) for mid-tier:
- Single-family rental homes: +3.1% (red in the chart)
- Multifamily: +1.7% (yellow).
- Overall: +2.3% (blue)
Asking rents are not actual rents that current tenants pay.
Asking rents are advertised rents on units that landlords have not been able to rent out yet and that are still vacant and advertised as for rent.
But the CPI for “Rent of Primary Residence,” released by the Bureau of Labor Statistics as part of the CPI data, tracks actual rents that current tenants are paying. This is a big difference.
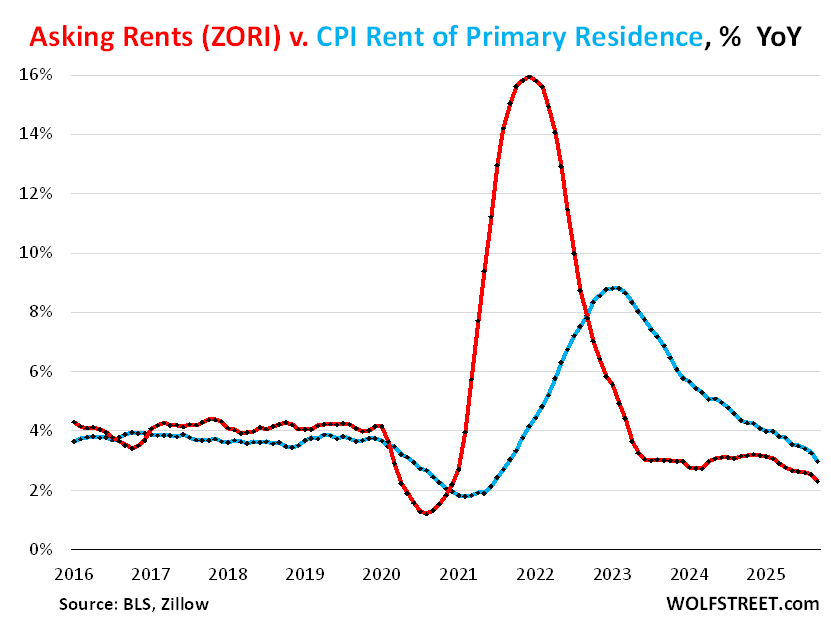
The chart below shows year-over-year percentage changes of asking rents per ZORI (red) and the CPI for Rent of Primary Residence (blue).
From late 2020 to early 2023, asking rents exploded as landlords went hog-wild, but not that many tenants signed new leases at those rents; and annual rent increases on renewals were much smaller. So from late 2020 to early 2023, asking-rent increases overshot actual rent increases for existing tenants by a wide margin, topping out at +16% year-over-year in early 2023 for the ZORI, while actual rents topped out at +8.8% at about the same time. The increases of both measures have been cooling since then.
Rents of SFRs outpace multifamily rents.
There are about 50 million rental units of all types in the US. About 15 million of them, or about 30%, are single-family rental homes (SFRs). Of those 15 million SFRs, 11 million are owned by mom-and-pop landlords and 4 million by larger landlords, including a handful of giant landlords.
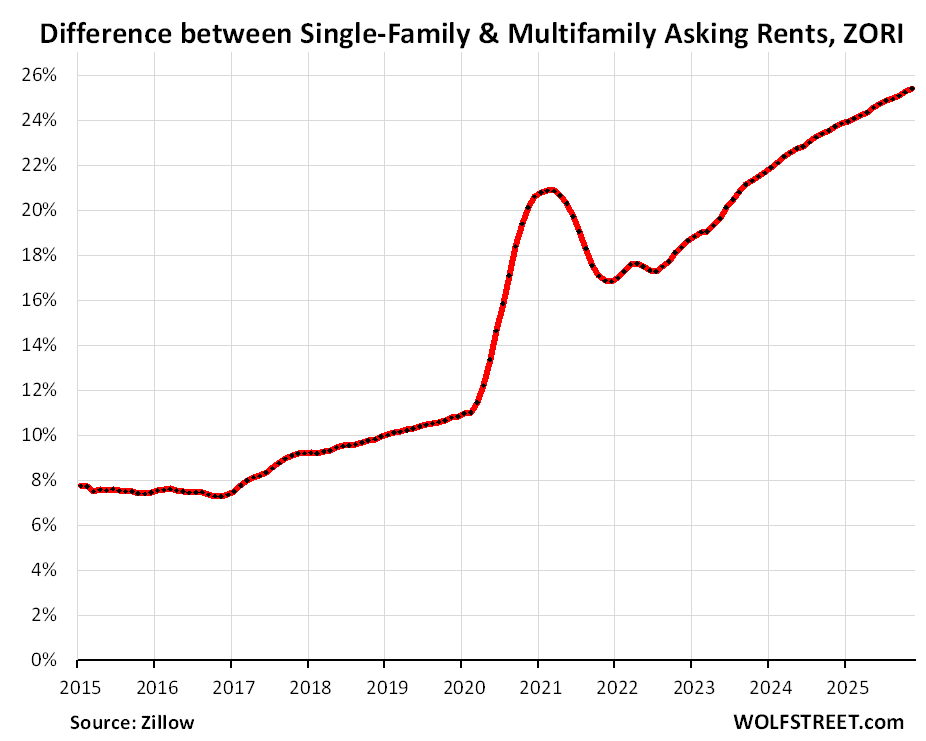
Increases in asking rents for SFRs continued to be much hotter than for multifamily units. And so the difference in asking rents between SFRs and multifamily units has surged over the years.
Asking rents for mid-tier SFRs, at $2,203 in November, were 25.4% higher than asking rents for mid-tier multifamily units at $1,757. Back in 2015 and 2016, single-family rents were 7-8% higher than multifamily rents.
Asking rents for 33 bigger cities.
The charts below of a sample of 33 bigger cities in the US show asking rents for mid-tier SFRs and multifamily rentals combined, per the seasonally adjusted ZORI. In order of year-over-year percentage change.
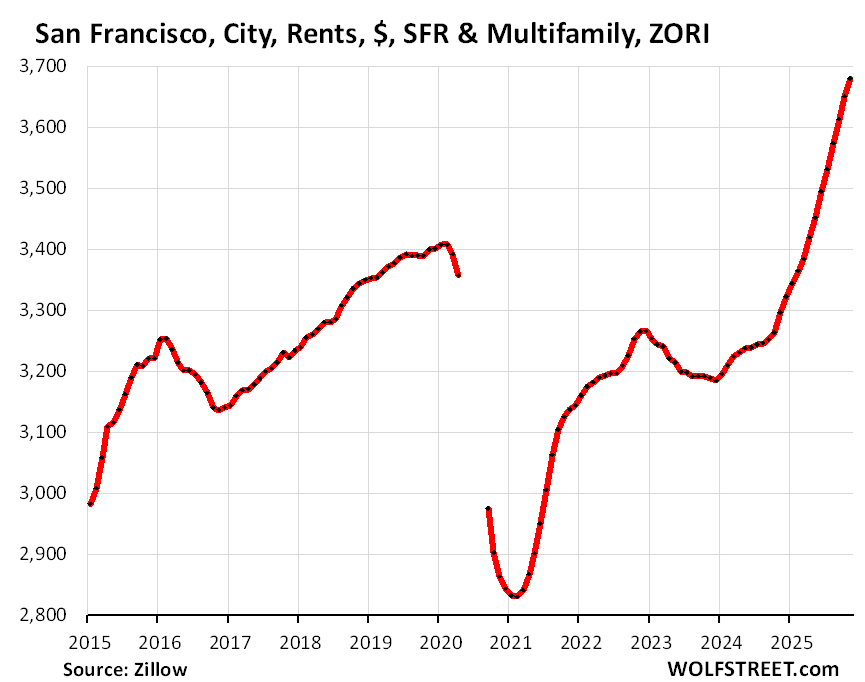
San Francisco, CA: +1.2% in November from October, +10.1% year-over-year, making it the city with the worst year-over-year increase in asking rents among the bigger cities.
Note that rents had plunged in San Francisco, and only toward the end of 2024 did they surpass the 2015 high:
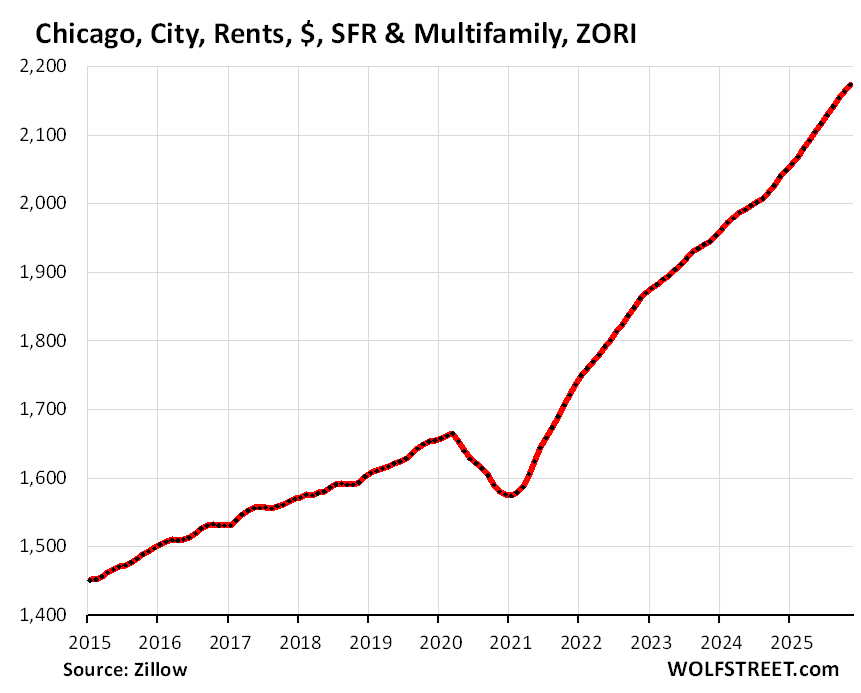
Chicago, IL: +0.6% in November from October, +6.7% year-over-year:
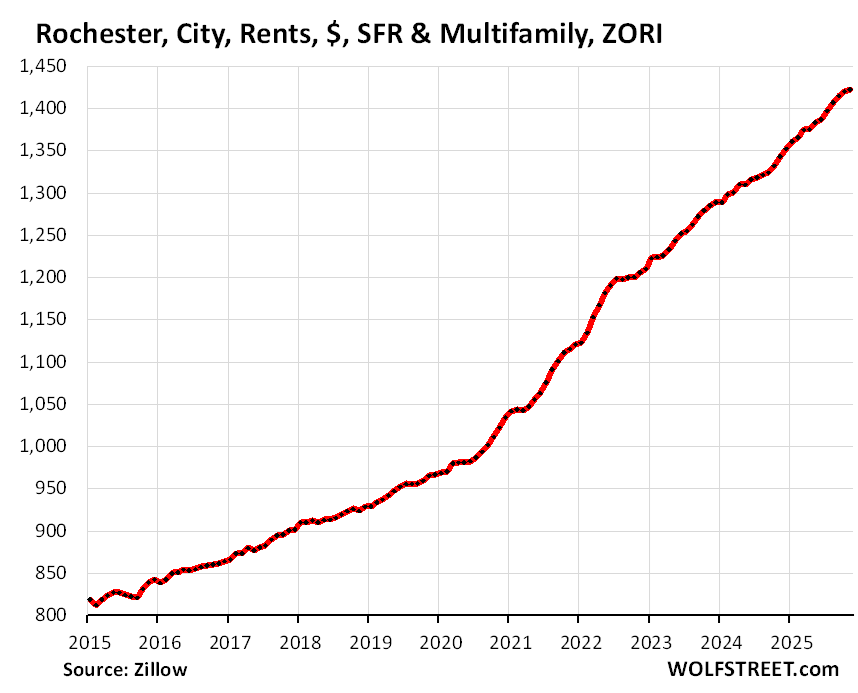
Rochester, NY: +0.7% in November from October, +6.5% year-over-year:
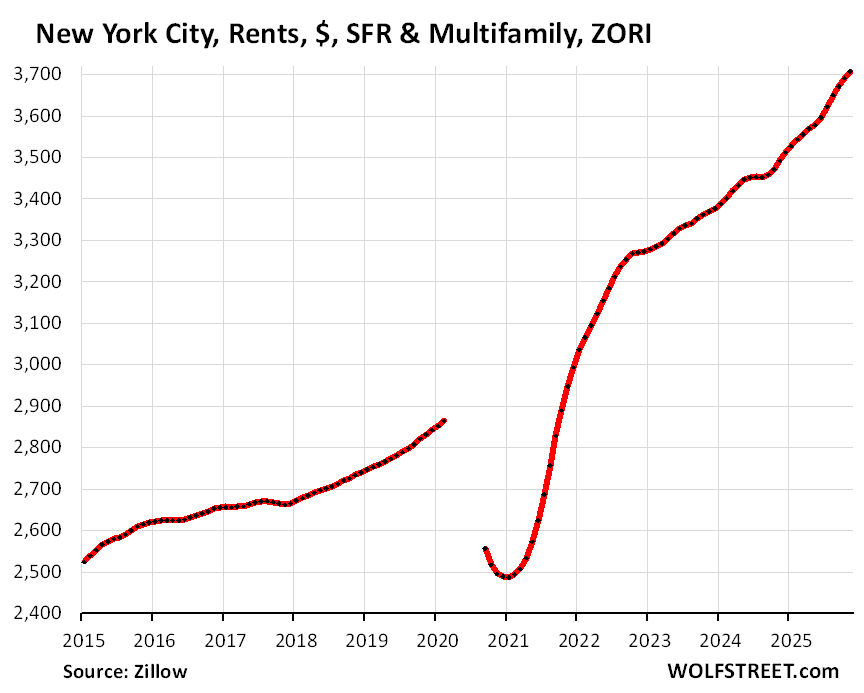
New York City, NY: 0.8% in November from October, +5.7% year-over-year:
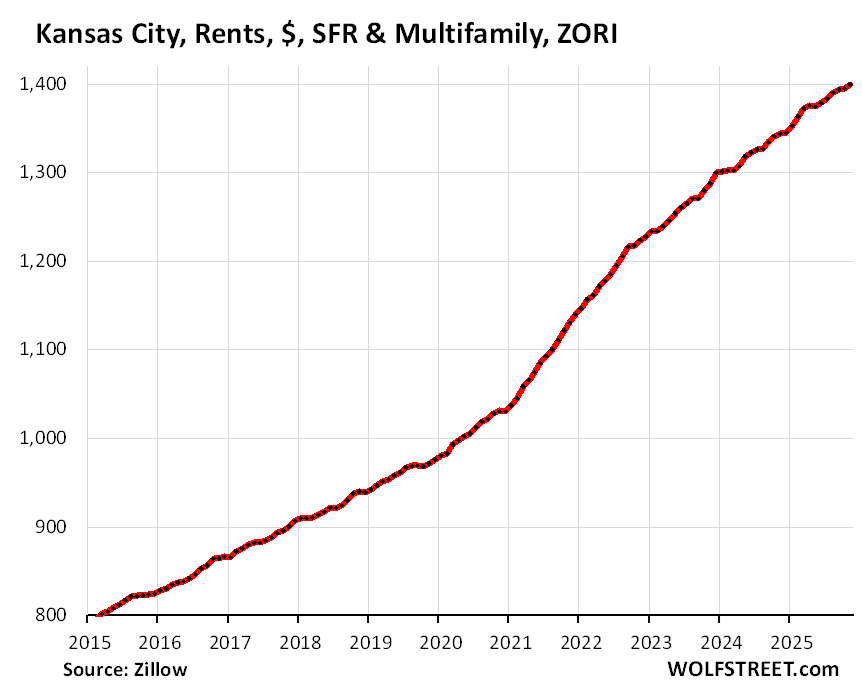
Kansas City, MO: +0.5% in November from October, +4.8% year-over-year:
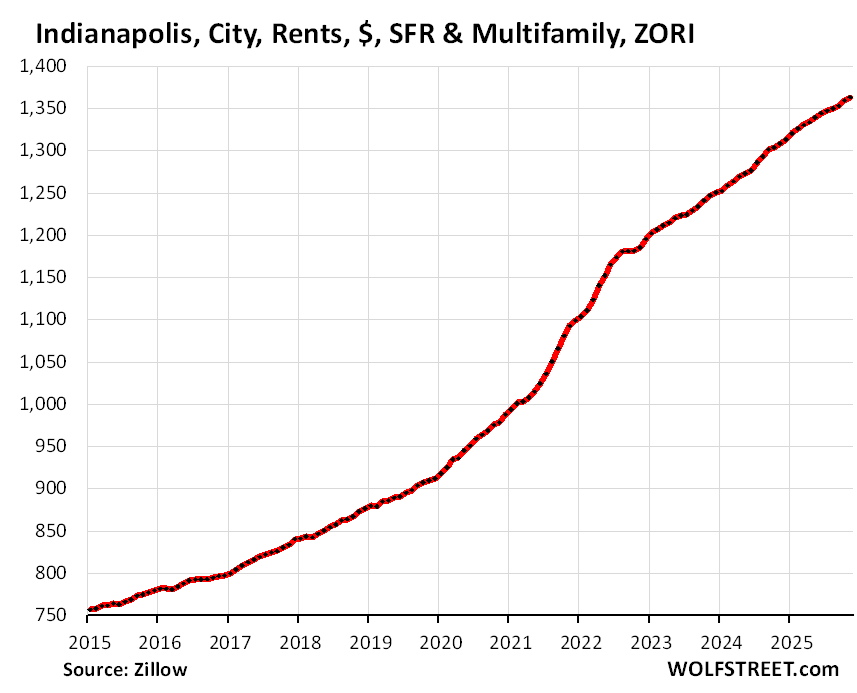
Indianapolis, IN: +0.2% in November from October, +4.4% year-over-year:
Baltimore, MD: +0.2% in November from October, +4.1% year-over-year:

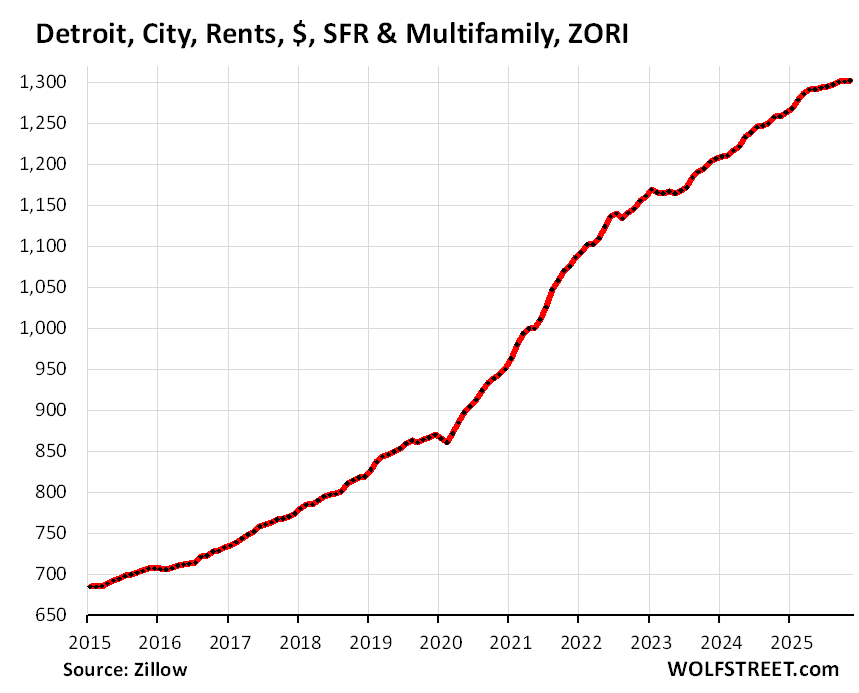
Detroit, MI: +0.2% in November from October, +4.0% year-over-year:
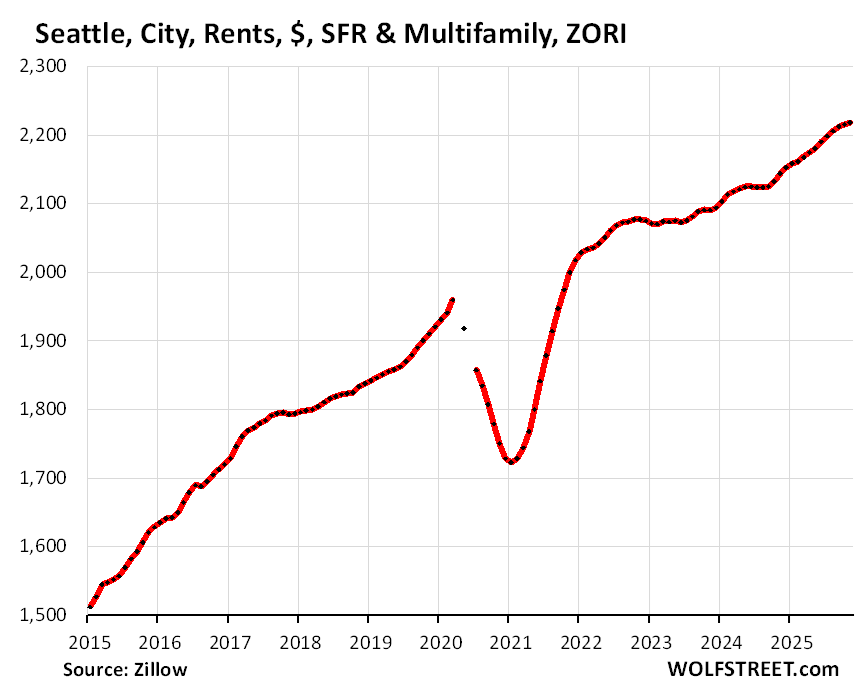
Seattle, WA: +0.3% in November from October, +3.9% year-over-year:
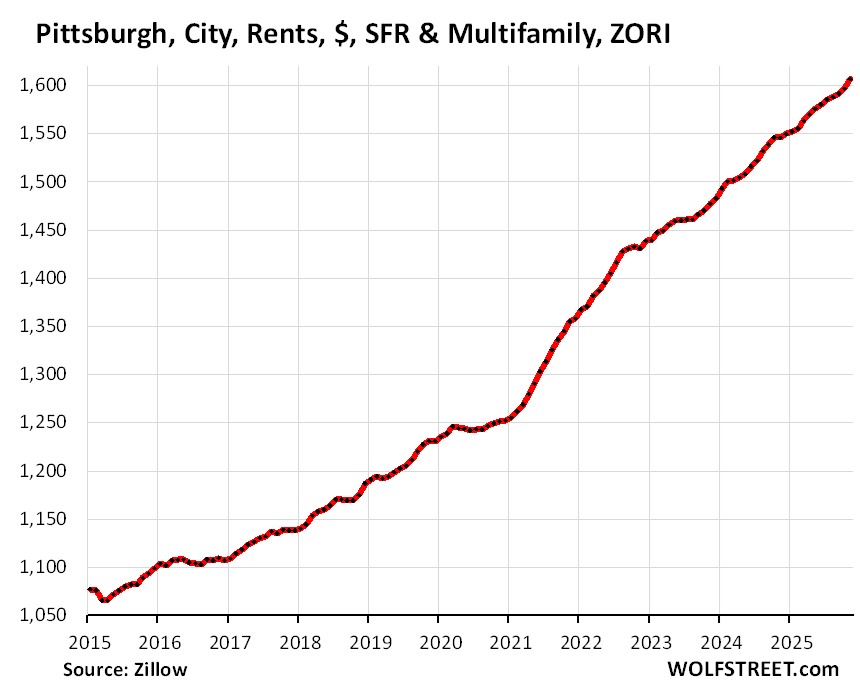
Pittsburgh, PA: +0.2% in November from October, +3.7% year-over-year:
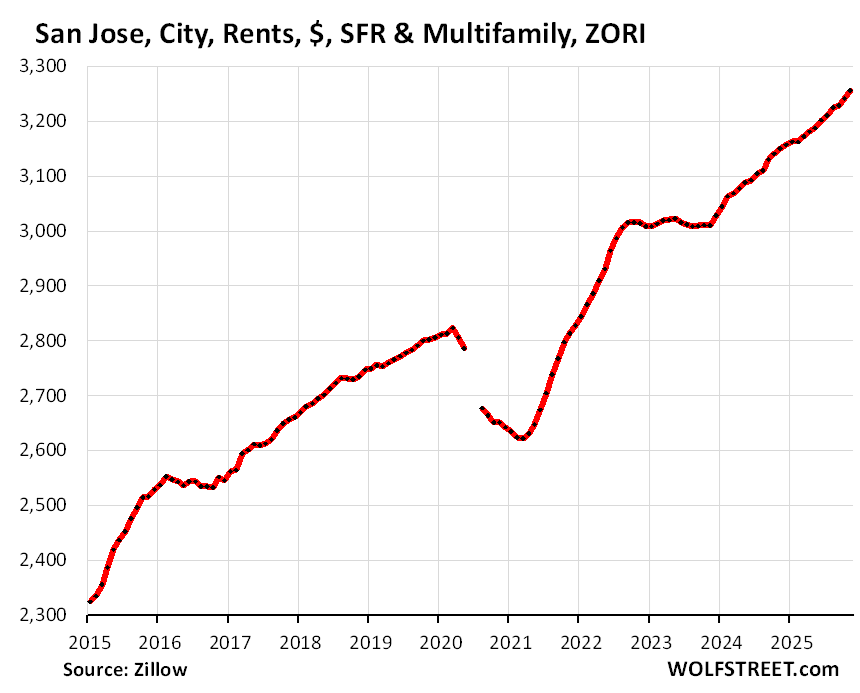
San Jose, CA: +0.4% in November from October, +3.7% year-over-year:
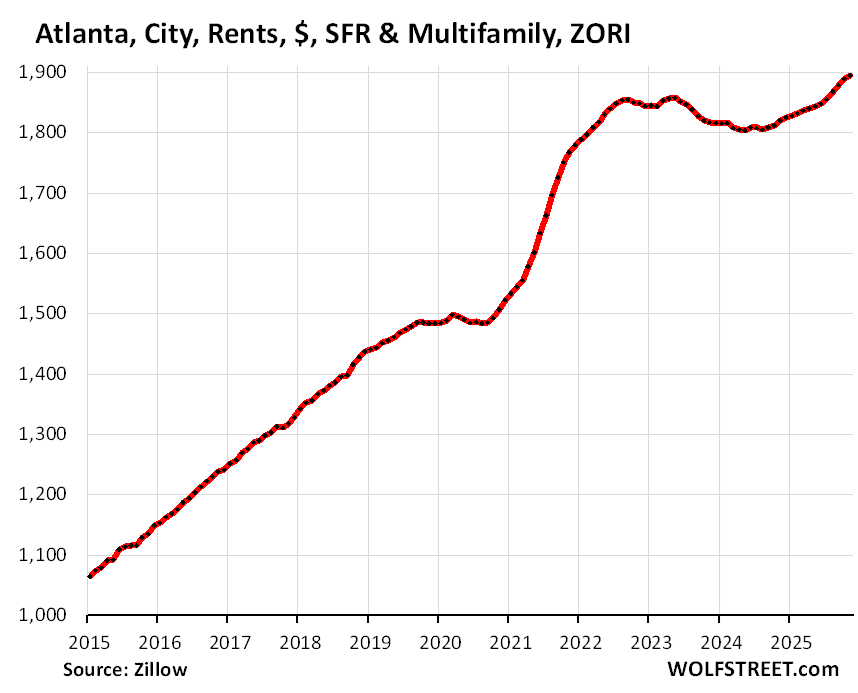
Atlanta, GA: +0.7% in November from October, +3.5% year-over-year. Note the resurge, after the decline:
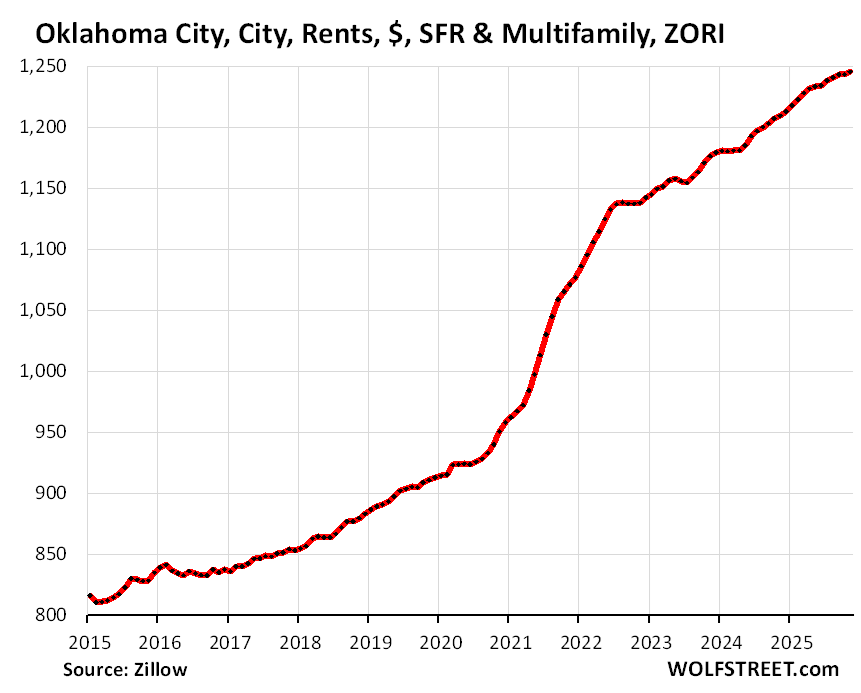
Oklahoma City, OK: +0.2% in November from October, +3.4% year-over-year:
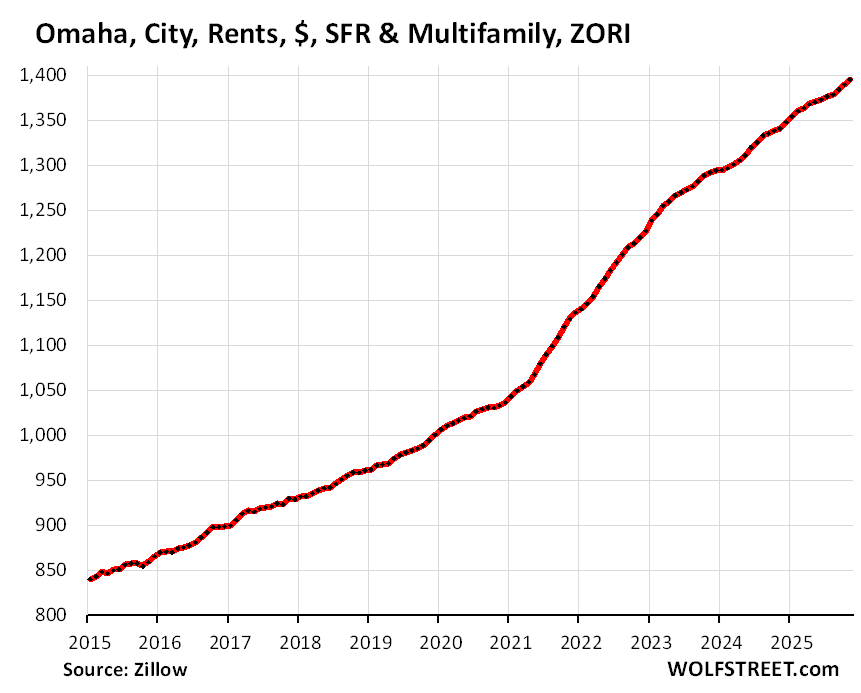
Omaha, NE: +0.1% in November from October, +3.4% year-over-year:
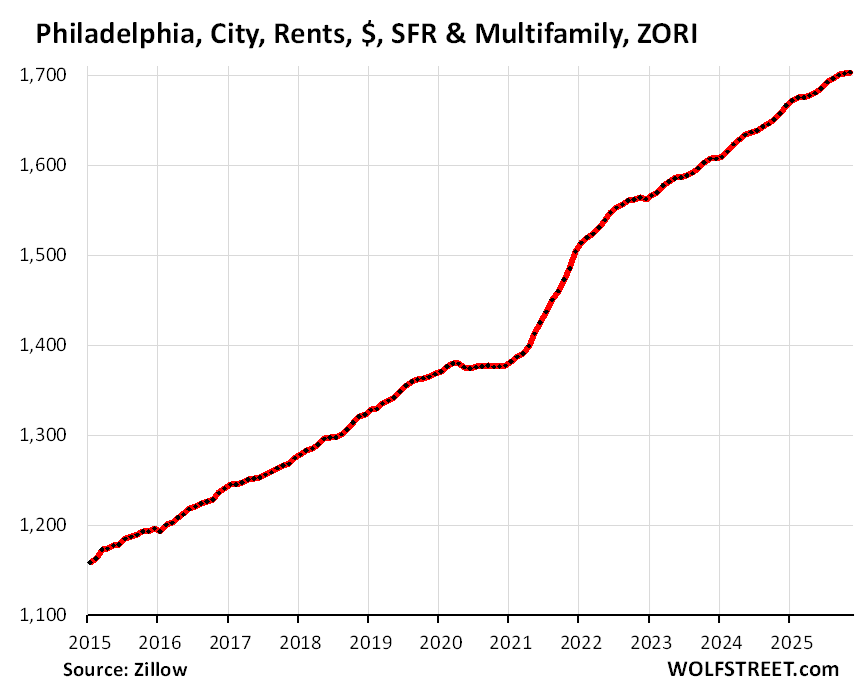
Philadelphia, PA: +0.2% in November from October, +3.3% year-over-year:
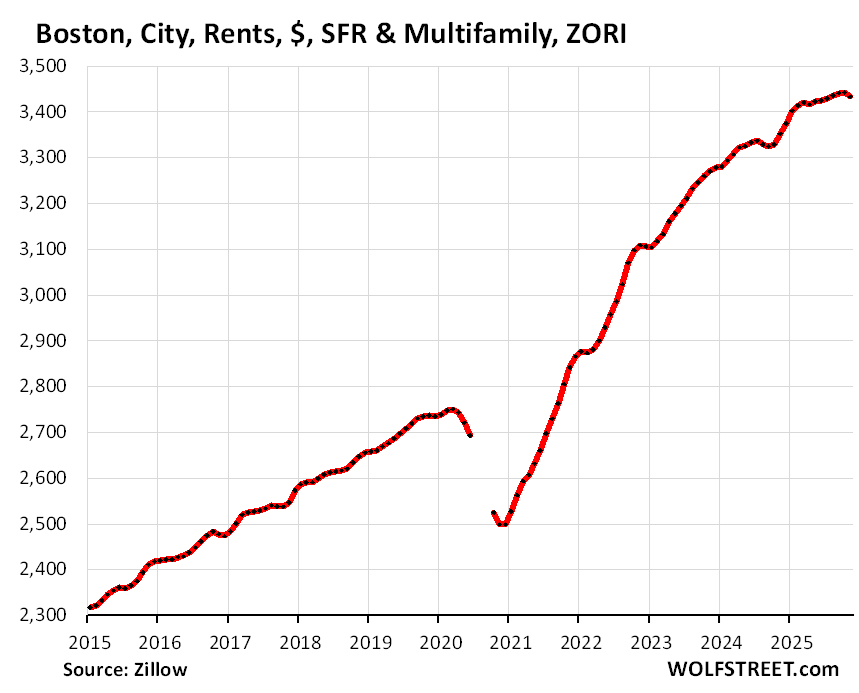
Boston, MA: +0.2% in November from October, +3.2% year-over-year:
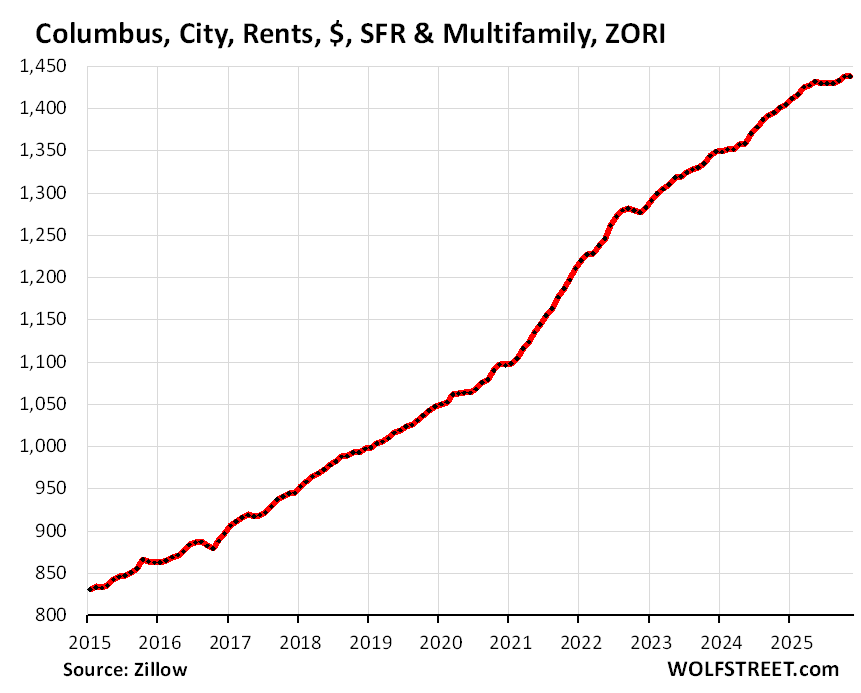
Columbus, OH: +0% in November from October, +3.1% year-over-year:
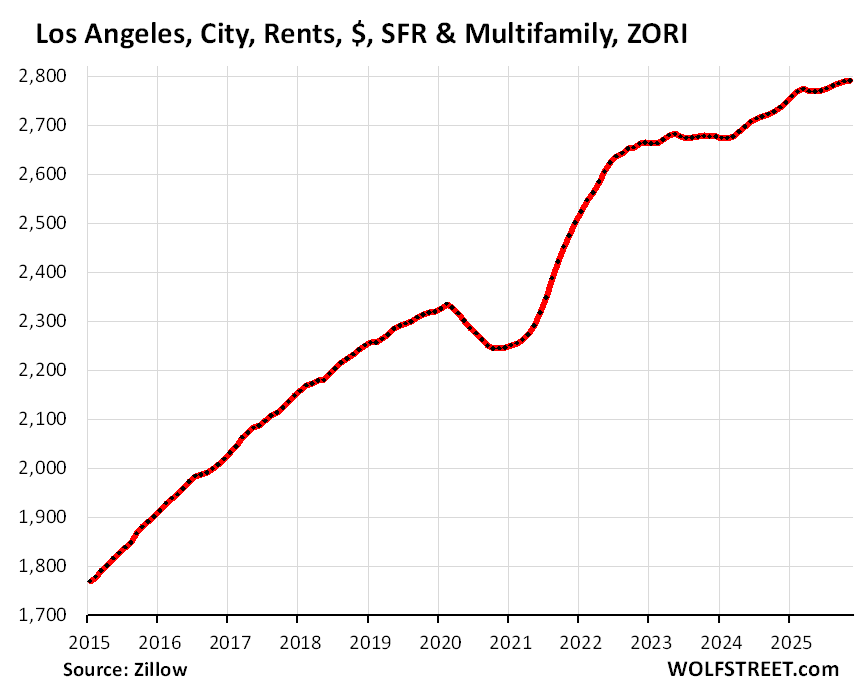
Los Angeles, CA: +0.2% in November from October, +2.3% year-over-year:
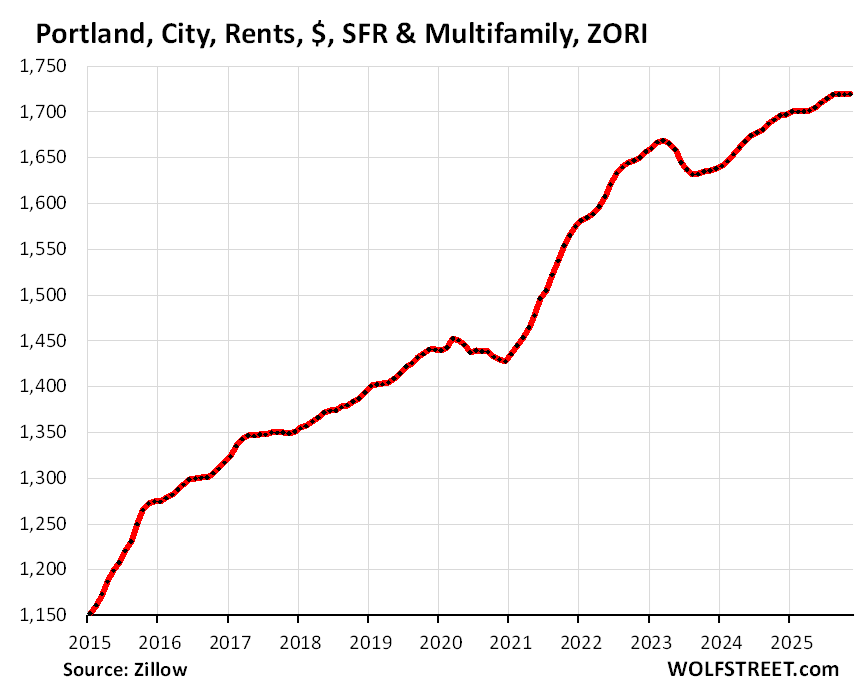
Portland, OR: +0.2% in November from October, +2.3% year-over-year:
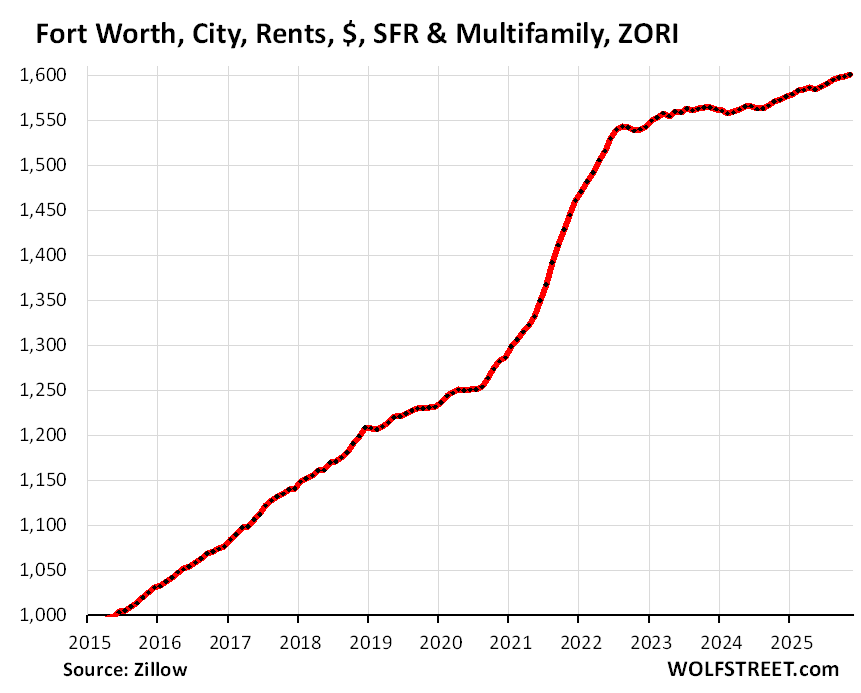
Fort Worth, TX: +0.3% in November from October, +2.0% year-over-year:
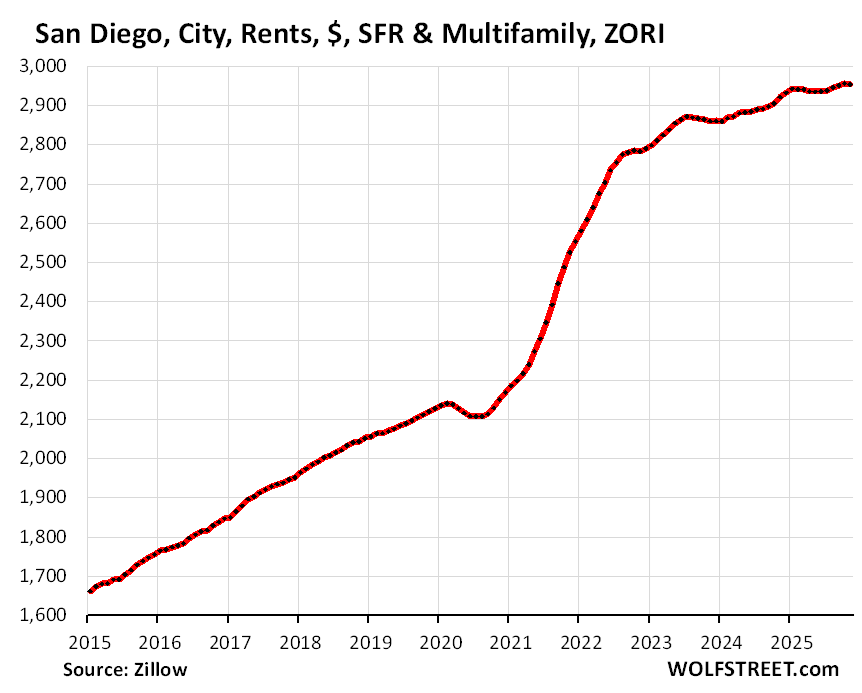
San Diego, CA: +0.3% in November from October, +1.9% year-over-year:
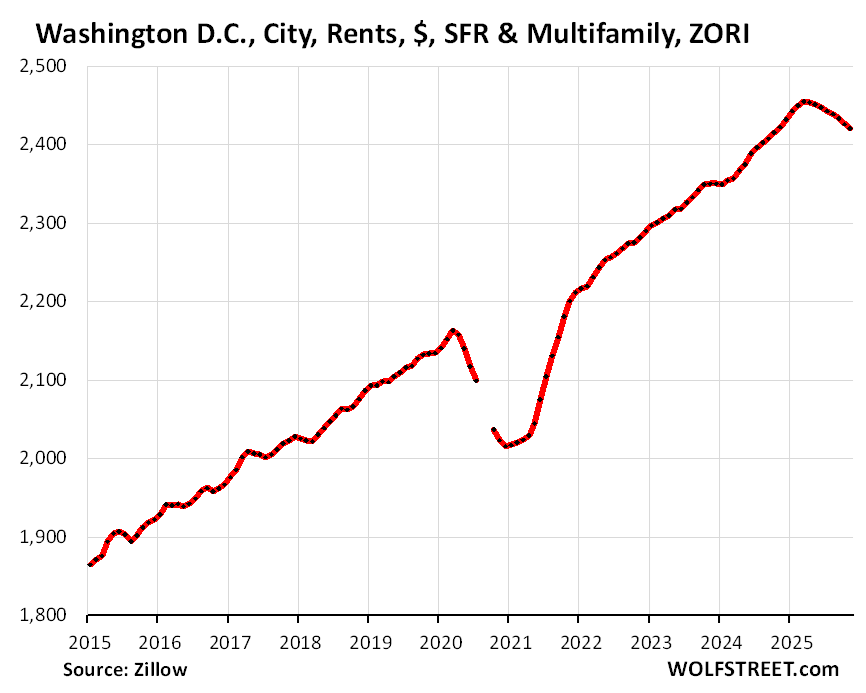
Washington, DC: -0.2% in November from October, +1.5% year-over-year:
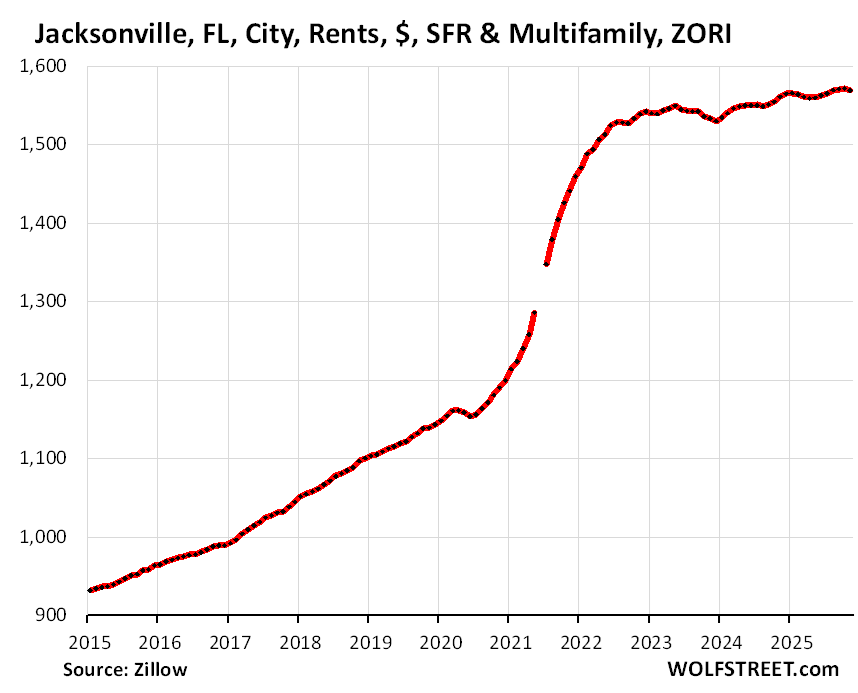
Jacksonville, FL: +0.3% in November from October, +1.3% year-over-year:
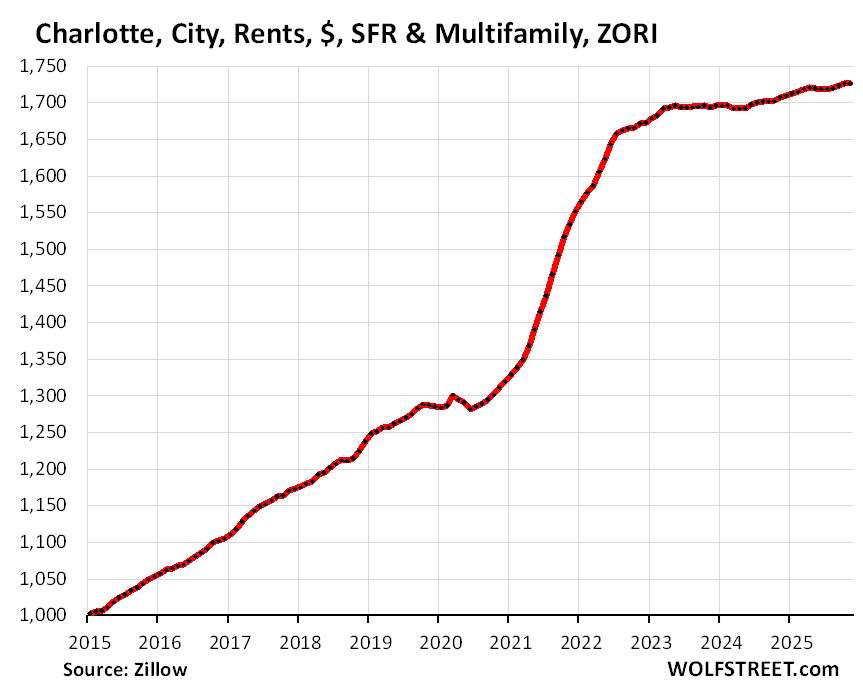
Charlotte, NC: +0.1% in November from October, +1.0% year-over-year:
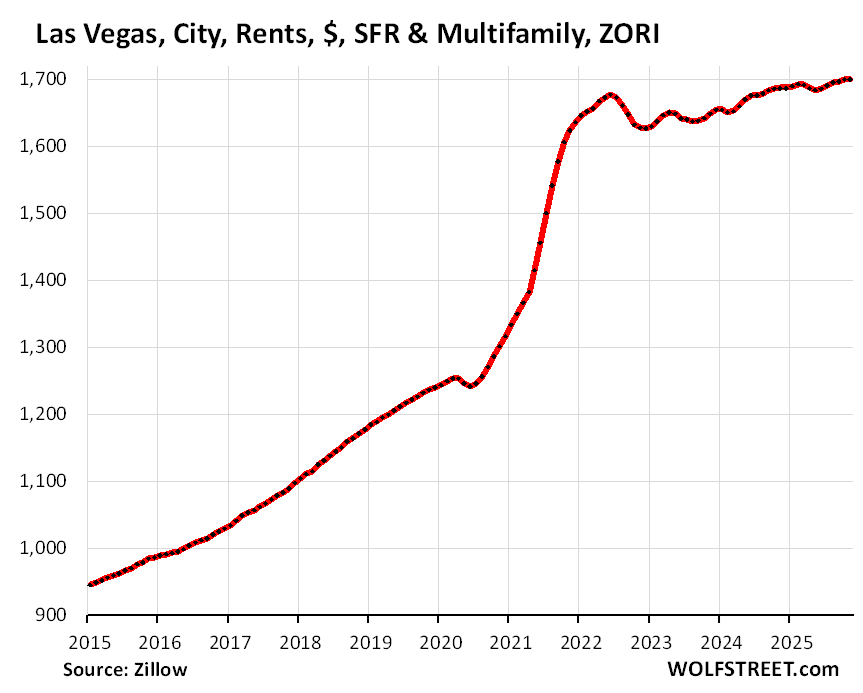
Las Vegas, NV: +0.3% in November from October, +1.0% year-over-year:
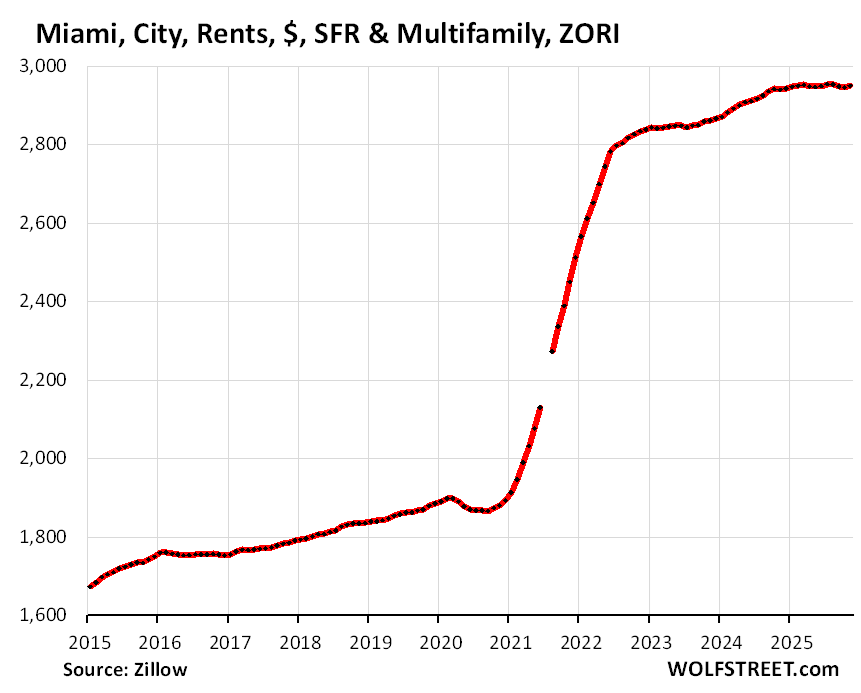
Miami, FL: +0% in November from October, +1.0% year-over-year:
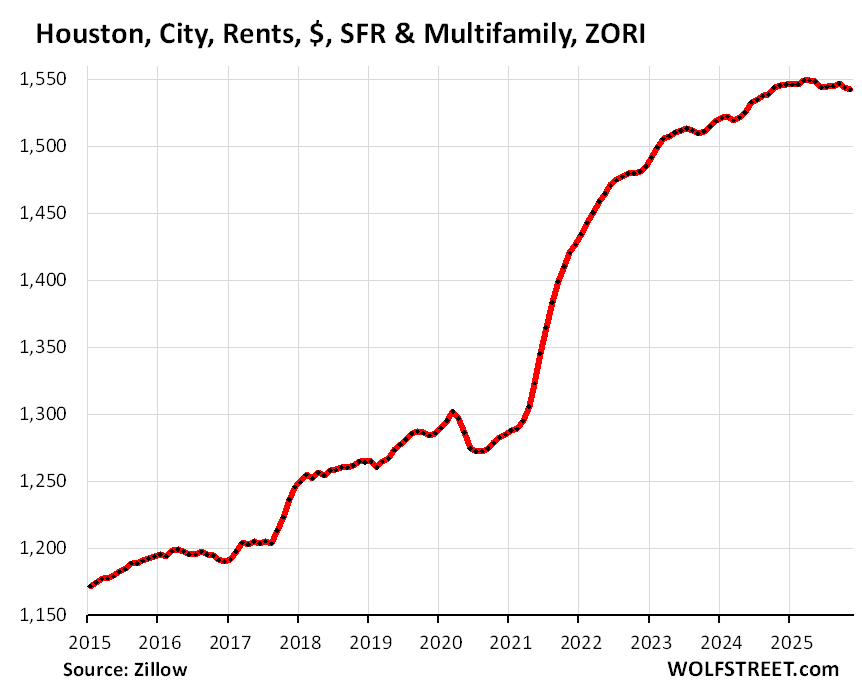
Houston, TX: 0% in November from October, +0.5% year-over-year:
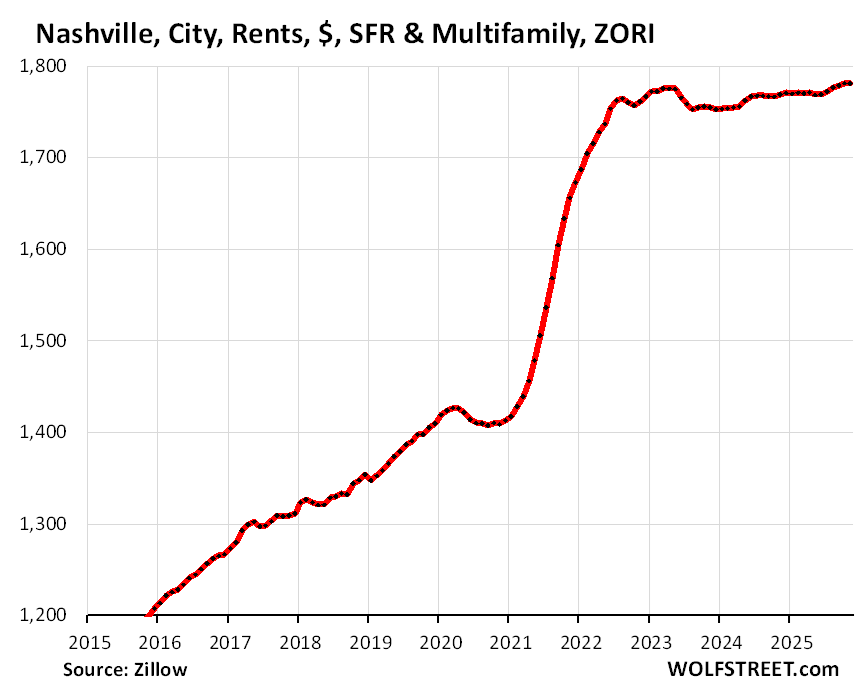
Nashville, TN: +0.2% in November from October, +0.5% year-over-year:
Dallas, TX: 0.1% in November from October, -0.1% year-over-year:

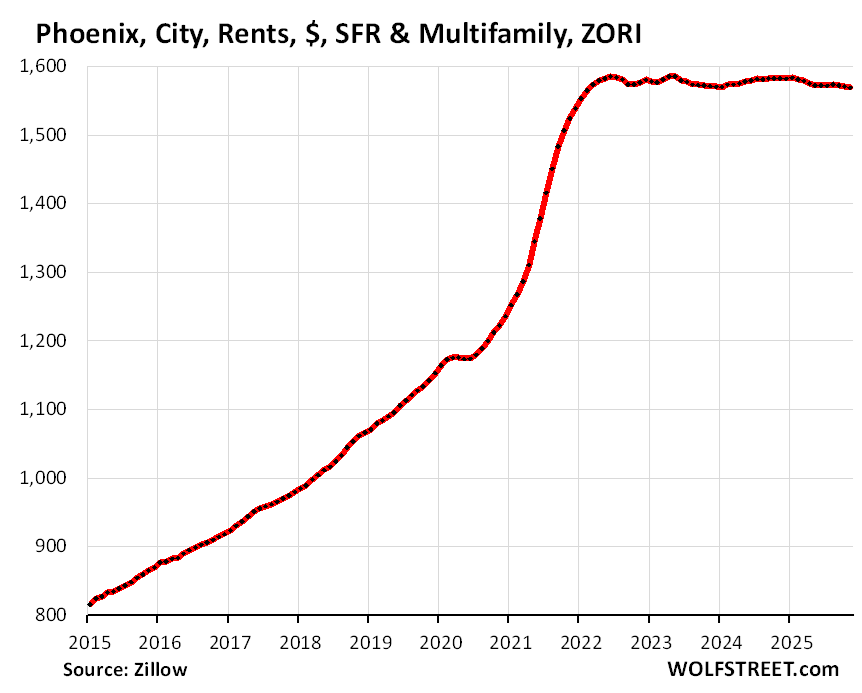
Phoenix, AZ: +0.1% in November from October, -0.5% year-over-year:
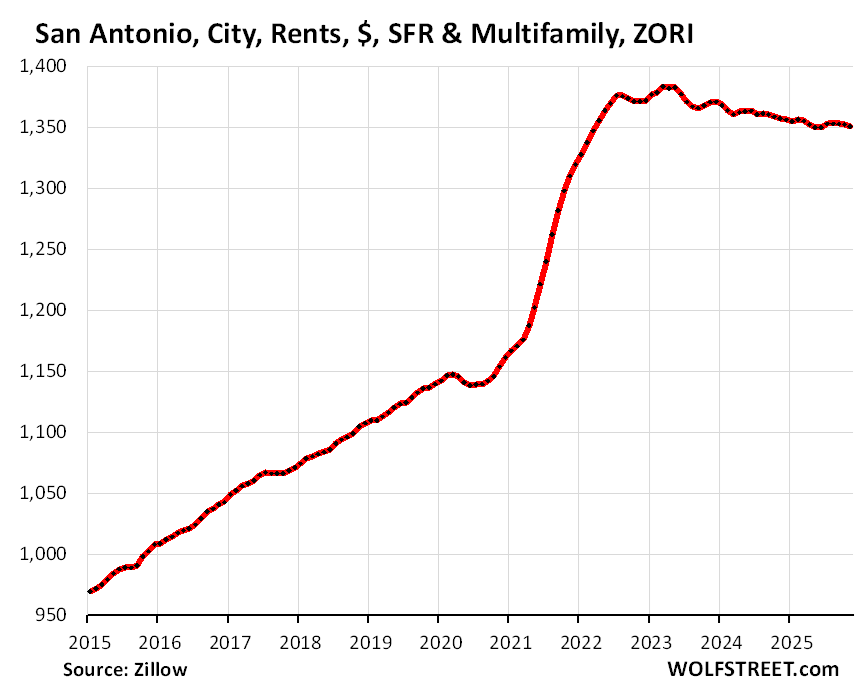
San Antonio, TX: +0% in November from October, -0.6% year-over-year:
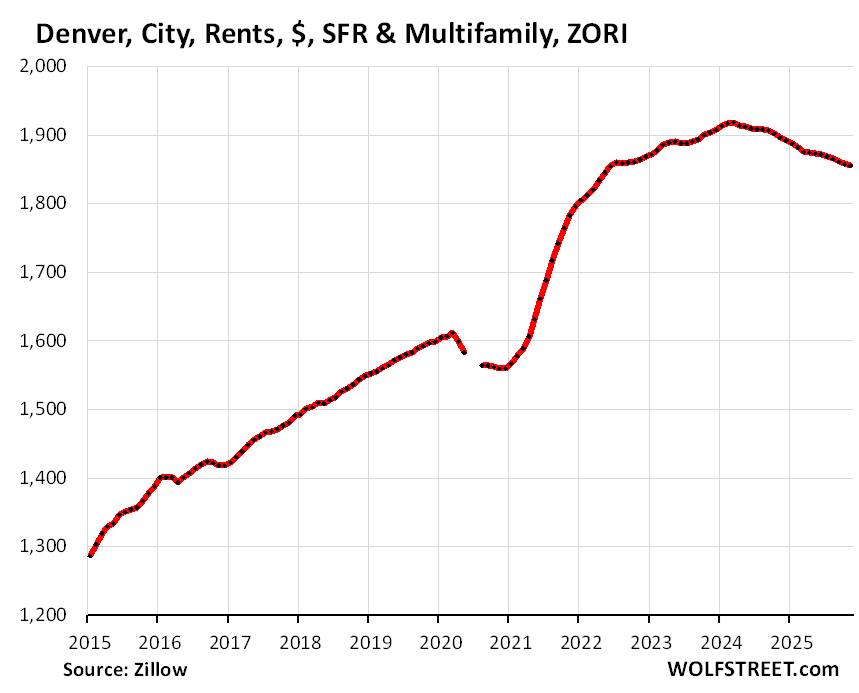
Denver, CO: -0.2% in November from October, -2.2% year-over-year:
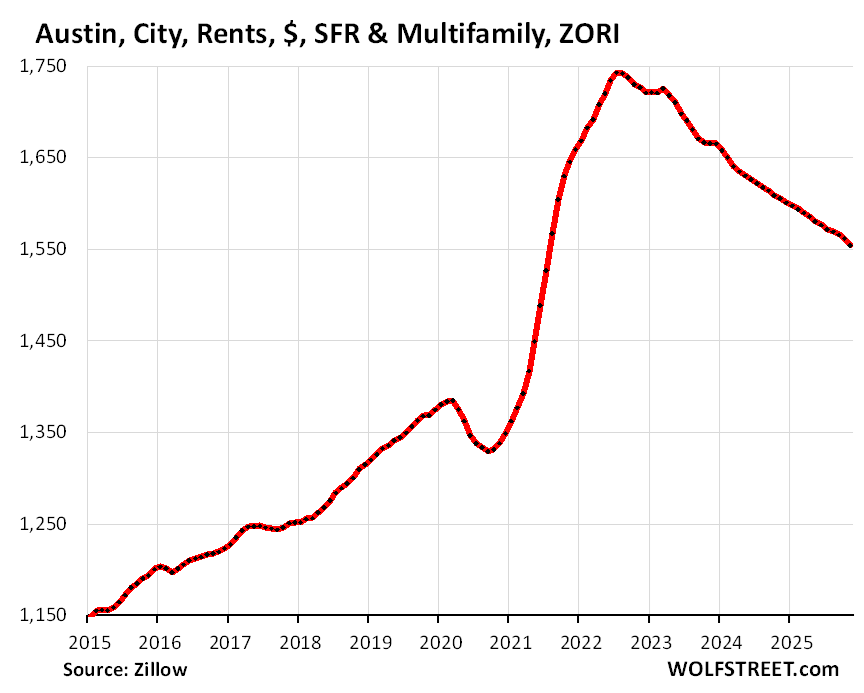
Austin, TX: -0.2% in November from October, -3.0% year-over-year:
Enjoy reading WOLF STREET and want to support it? You can donate. I appreciate it immensely. Click on the mug to find out how:

![]()
FYI Wolf, I just went apartment hunting in Boston and literally every place I looked was offering a free month of rent. A leading indicator of Boston rent declines approaching?
It’s a gimmick…you’re just paying 12 months of rent spread over 11 payments.
It seems inevitable rents will start to fall in greater Boston in 2026. Given the amount of ‘for rent’ signs I’ve seen pop up. So far, prices have held steady; however, the lack of international student demand plus other factors should ease some of the pressure on the demand side moving forward.
Maybe. But 1 month free rent is super-common in many markets. Once you get to three months free…
Would rising asking rents of SFRs indicate OER inflation increases?
MW: Why silver’s surge relative to oil should be a warning for investors
*There are about 50 million rental units of all types in the US.”
This is interesting. I guess with the total number of households being somewhere around 134 million (Census bureau) I would have guessed more rentals, more apartments. Around the cities it seems that multifamily construction outpaces SFH by ten to one so maybe someday it will be 100 million rentals and 100 million lived in single family homes.
50 million rentals (occupied or vacant) out of 147 million total housing units (occupied or vacant). 15 million housing units are vacant for various reasons (Census data).
difference between apartments and houses
can stack and pack multi-generations in them
I know of many 3 generational homes
also have multiple incomes to handle higher rent
Wolf, I noticed there isn’t a 1:1 match for cities listed in this article versus single family home and condo articles. For example, Salt Lake City and Tampa aren’t listed. Is this due to data quality issues for these and other metros?
33 is my max. I go crazy when going over 33. So I wanted to include cities like Omaha, Oklahoma City, Rochester, etc. and others had to be cut out. It’s a “sample” as I said in the article.
Too bad we can’t see separate multifamily rents and SFR rents in the cities.
City-level data is available only combined. Metro-level data is available for SFRs and multifam separately. But metros are gigantic, often with many dozens of cities, and it waters down the sharp movements in cities. For example, San Francisco and Oakland are in the same metro, along with dozens of smaller cities, some in Silicon Valley, some in Wine Country, some in the East Bay. These are very different markets. The New York City metro is even worse. It’s the hugest most diverse metro in the US. So I don’t feel like throwing these cities all into the same pot. I have the national index for that.
In Chicago, during the freezing cold windy winters, apartments should be free. 🧊 🥶
Wisconsin got laws changed to make LANDLORDS responsible for utilities year round
stopping the free taking by renters after october
Kinda like Cubs seats.
🤣 🥁
I’m in an SFO near San Diego, locked in at a good rate since last year and re-upped for next two years. Two houses within two blocks with same floor plan went up since Oct are asking 20% and 25% more than mine and are sitting. Unless some corporate relo comes in, I see them sitting until they come down to the market rate, don’t see how they’re asking what they are unless they are asking high and planning to negotiate down.
In Denver lots of our new apts are sitting vacant for months….
I drive buy a number of buildings daily that have an eery ghost town feel
I work in multifamily in Denver. 2-3 months with free internet and parking is common in the city’s core. Denver way overbuilt.
Northern Colorado not as much.
Meant to say 2-3 months free rent
Zillow showing that rent inflation, often a persons largest expense, has been more than 2x the feds target for a decade seems like a problem. Good thing rent going up $500 is offset by eggs going down a dollar.
“more than 2x the feds target”
Nonsense. The Fed’s target for inflation is for OVERALL inflation to be 2%, not for individual categories. Manufactured goods prices generally increase less than 2%, and often decline. Services inflation, of which rent is part, has always been above 2% when overall inflation was below 2%.
What am I gonna do with all this money,
What am I gonna do with all this dough,
Do rey me, Do rey do,
I plant it in the ground and I made some mo’.
What am I gonna do with all these dollars,
What am I gonna do when the well runs dry,
I can’t call my friends to suffer,
What am I gonna do if they eat too much.
What am I gonna do if these kids build monorails,
What am I gonna do with a rental off their line,
What am I gonna do, well burn baby burn,
Collect my payout and I’ll do just fine.
What are you gonna do about all that money,
Bought the city council off just in time,
Planning commission fits nice in my pocket,
Your stew pot’s cold and I got your last dime.
What are you gonna do, What are you gonna do.
Huh?
Miami and San Diego renters are really hating life right now.
How does one ask for a $12-15,000 raise ?
“Man my rent went up!”
For your chart of “Asking Rents (ZORI) vs CPI Rent of Primary Residence”, I’m betting that the shapes of those curves over time have a lot to do with change in mix of continuing leases vs new leases. For example, I have been on a continuing lease with rent increases of 8%/yr like clockwork, beginning in 2022, going up 8% again in 2026. However it seems to me that as people change where they live for various reasons, they *effectively* shift themselves off of the continuing lease curve, and onto the asking rent curve, muting the overall capture of CPI increases. I’m still paying an increase of 8% every year on my continuing lease, as are many other Californians (the largest share of national rentals), so “changes in mix” is my only good explanation of why the CPI curve is not better capturing my actual rent increases.
1. No. CPI for rent doesn’t work that way. You’re fantasizing. The CPI for rent is based on surveys sent to a large group of ADDRESSES. The same address gets a survey every six month. The addresses that get the survey are rotated monthly. Tenants come and go, but whoever lives at the ADDRESS fills out the survey about the amount of rent they paid for THIS month. So the BLS establishes a track record for each of those addresses going back years and watches rents change at each of those addresses over time. So this includes renewals and new lease signings at each address over time.
2. You’re getting ripped off by your landlord. Why? Because you encourage them to. Start looking at other places to rent to see what you can get for the rent you pay now. You cannot just look at listings; you have to go there and tour the rental property to see what it’s actually like. Look at lots of rentals. Spend months doing that every weekend. The curve that captures your personal rent is a rip-off curve.
Each of those charts above tell a regional and national story. I was told by real estate investors who rent single family and multi family units, people in Utah pay their rent and seldom default. In other states cash for keys to get non payers to move out. Even heard of buying a Subaru to get a non payers to move out a home in LA . Not a business I would want to be in. Unemployment claims have been trending lower, lower than 210k? Maybe a gap below 200k for the Holliday week? The $vix has been under house arrest, but the door is now open, bonuses for Wall Street performance ends tomorrow, so greed is trying hard to keep the vix down. I am sure the unemployment claims will have it say in that outcome