Strong consumer spending growth (despite Sour Mood), big improvement of trade deficit, and government spending growth after two quarters of declines.
By Wolf Richter for WOLF STREET.
Today’s GDP report, delayed by the government shutdown, was the “initial” report for the third quarter. Data collection for it occurred before the government shutdown. It replaces the “advance estimate,” which got canceled due to the shutdown at the time, and the “second estimate” (originally scheduled for November 26). So this release is essentially the “second estimate” and includes the revisions that would have been part of the second estimate.
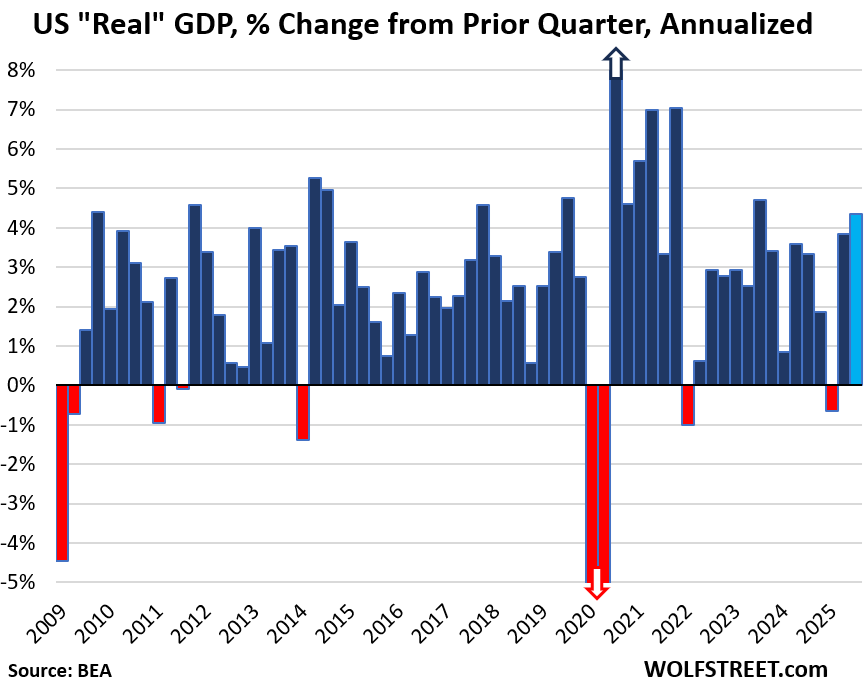
And WOOSH went the economy in Q3. Gross Domestic Product, the broadest measure of the economy, grew by an annual rate of 4.3% in Q3, adjusted for inflation, after the 3.8% growth in Q2, and the -0.7% decline Q1, according to the Bureau of Economic Analysis today.
By comparison, in the years between the Great Recession and the pandemic (so excluding recessions), average quarter-to-quarter GDP growth was 2.5% annual rate. The average 20-year quarter-to-quarter GDP growth, including recessions, was 2.2% annual rate.
The decline in Q1 had been driven by an explosion of imports due to tariff frontrunning. Imports deduct from GDP; exports add to GDP. But that frontrunning of tariffs in Q1 and other trade shifts due to tariffs caused a dramatic improvement of the trade deficit in Q2 and Q3, from the horrible levels of Q1, contributing substantially to the high growth rates in both quarters.
Consumers also pitched in and spent hand over fist, despite their allegedly very sour mood as depicted by these silly consumer sentiment surveys. Consumer spending, adjusted for inflation jumped by 3.5%, the highest since the red-hot quarters last year.
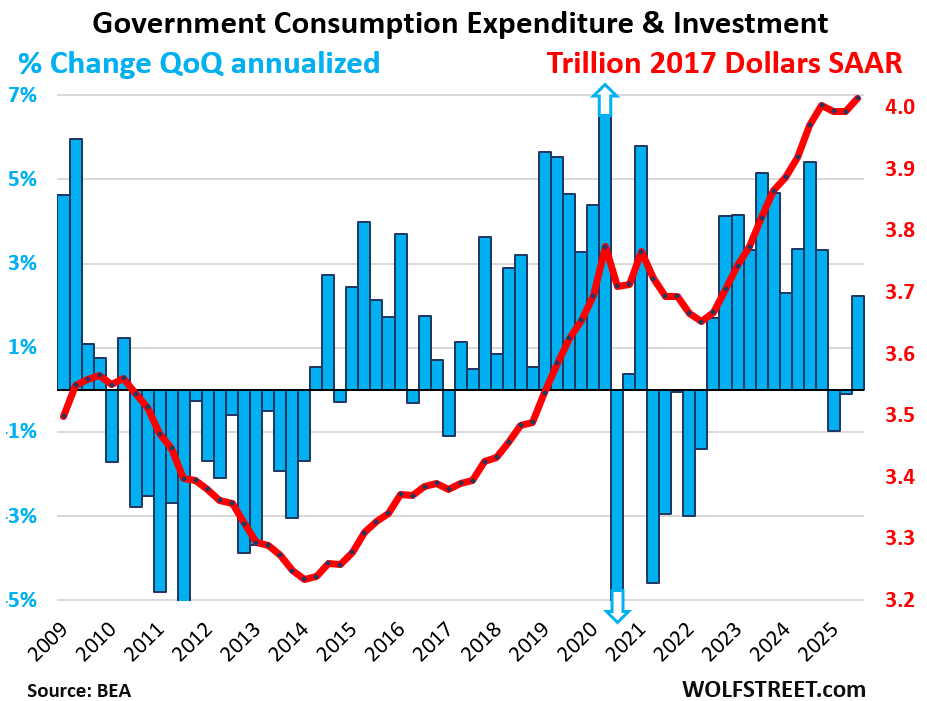
Government consumption expenditure and investment (federal, state, and local) also rose, after two quarters of declines.
But Gross private domestic investment deducted 3 basis points from GDP growth, with fixed investment adding only 19 basis points (as residential fixed investment continued its plunge, while other fixed investment rose), and with change in private inventories deducting 22 basis points from GDP growth. So this time, no help from the investment department.
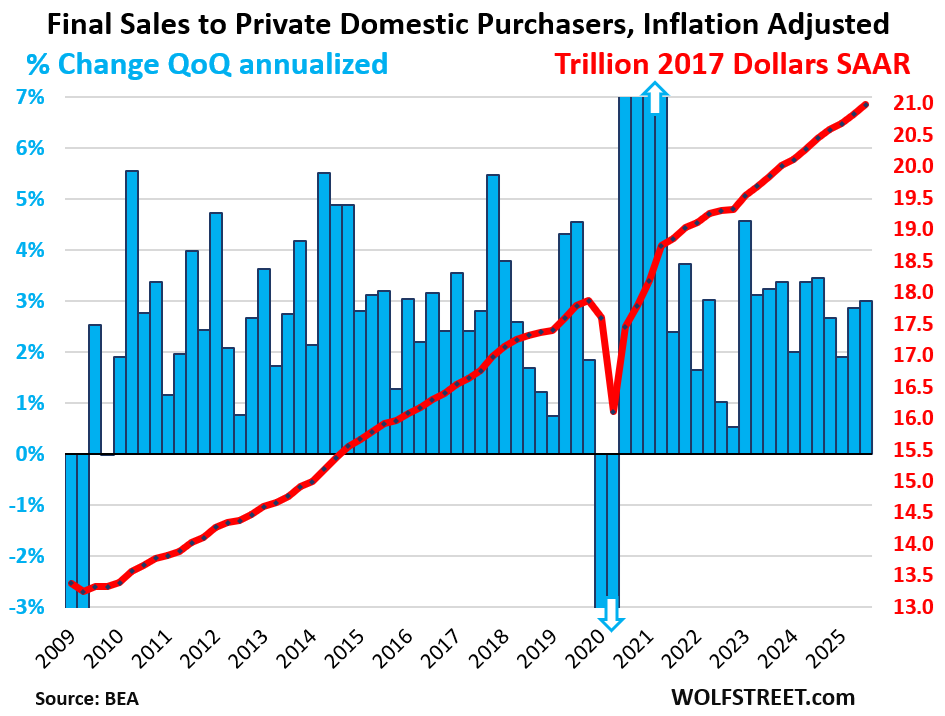
The core of the private US economy, “Final sales to private domestic purchasers,” excludes the above complications of exports, imports, government spending, and changes in inventories. This measure rose by an annual rate of 3.0% in Q3, adjusted for inflation, the best growth rate since Q4 2023. So at the core, the US economy continues to hum along at solid growth rates.
Here is overall GDP growth, adjusted for inflation.
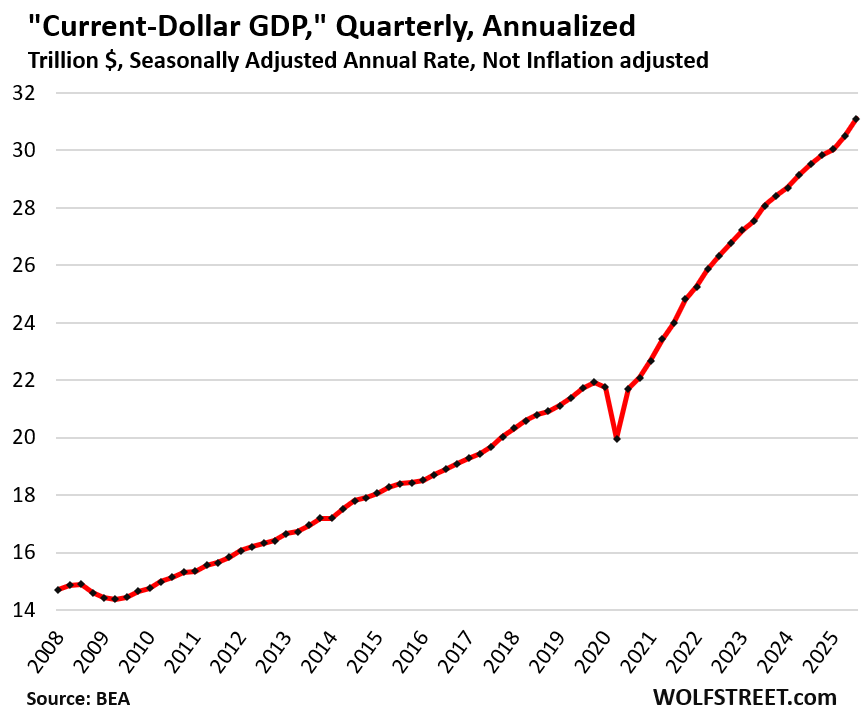
Not adjusted for inflation, “current-dollar GDP” grew by an annual rate of 8.2% to $31.1 trillion, after the 6.0% growth in Q2.
This “nominal GDP” it represents the actual size of the US economy in current dollars and forms the basis for the Debt-to-GDP ratio and similar GDP-based ratios.
The chart shows current dollar GDP, expressed in seasonally adjusted annual rates. You can see the sharp acceleration over the past two quarters, following the dip in Q1:
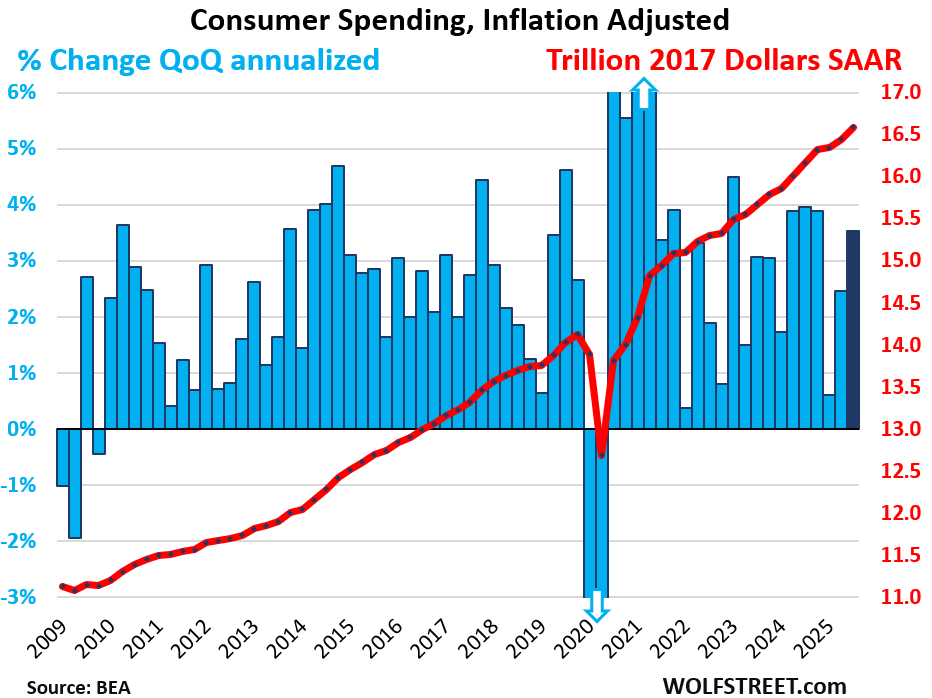
Consumer spending rose by an annual rate of 3.5% in Q3, adjusted for inflation, to $16.6 trillion. This growth rate added 2.39 percentage points to the GDP growth of 4.3%.
Consumer spending accounted for 69% of the US economy.
The spending growth was spread across goods and services:
- Services: +3.7%.
- Durable goods: +1.6%
- Nondurable goods: +3.9%.
The blue columns show the growth rates (left axis), the red line shows the dollars (right axis), all in seasonally adjusted annual rates (SAAR):
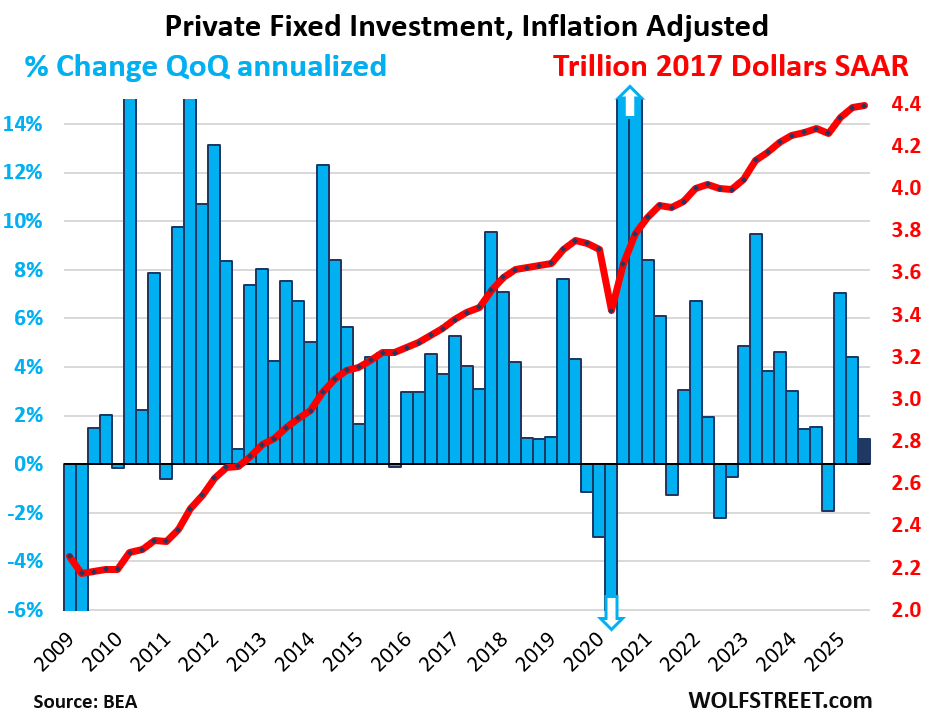
Private fixed investment, which excludes changes in inventory, rose by only 1.0% annualized and adjusted for inflation, after having jumped by 4.4% and 7.1% in the prior two quarters. Of which:
- Nonresidential fixed investments: +2.8%:
- Structures: -6.3%
- Equipment: +5.4%.
- Intellectual property products (software, movies, etc.): +5.4%.
- Residential fixed investment: -5.1%.
Private fixed investment accounted for 18% of the US economy.
Government consumption expenditures and gross investment rose by 2.2% annualized, adjusted for inflation, after two quarters of declines.
Federal government spending rose by 2.9% annualized, after two quarters of declines, on a jump in national defense spending, while nondefense spending continued to decline for the third quarter in a row:
- National defense: +5.8%
- Nondefense: -1.1%
The increase in federal government spending added 19 basis points to the 4.3% of total GDP growth.
This does not include interest payments, and it does not include transfer payments directly to consumers (the biggest part of which are Social Security payments), which are counted in GDP when consumers and businesses spend these funds or invest them in fixed investments.
State and local government spending rose by 1.8%, the slowest growth rate since Q4 2022.
Combined, federal, state, and local government consumption and investment accounted for 17% of the US economy.
The majority (61%) of government spending came from state and local governments. Federal government spending accounted for 39% of total government spending.
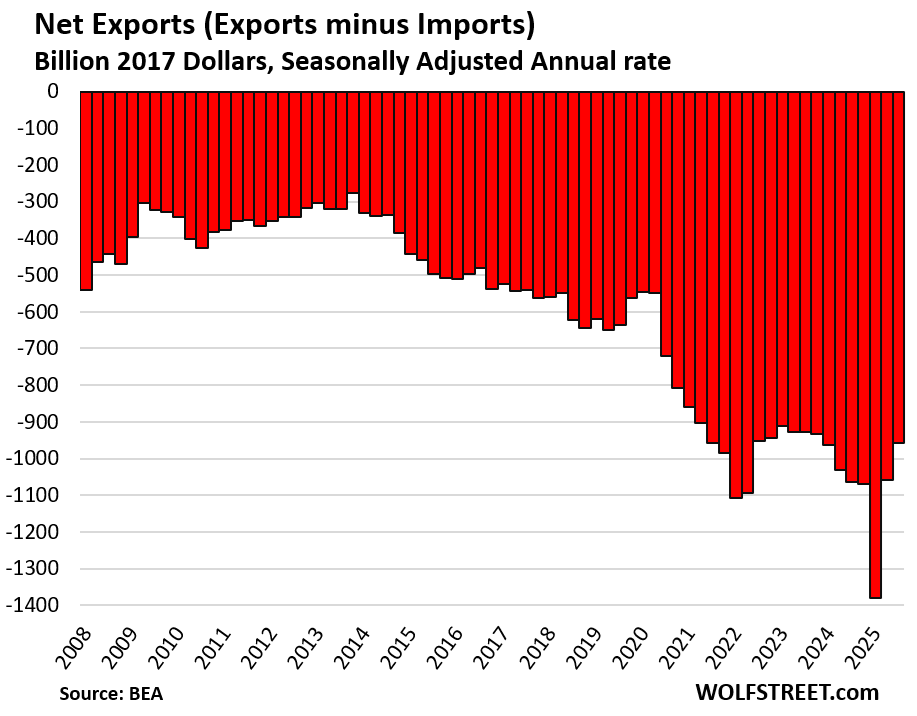
The Trade Deficit improves.
Imports dropped by 4.7% in Q3, to $3.66 trillion annualized after having already plunged by 29% in Q2, more than undoing the entire historic tariff-frontrunning spike in Q1. Imports are a negative in GDP, and when imports drop, they improve GDP.
- Imports of goods: -7.5% to $2.93 trillion
- Imports of services: +6.3% (includes US tourists spending overseas) to $721 billion.
Exports jumped by 8.8% in Q3 from Q2, to $2.70 trillion. Exports are a positive in GDP.
- Exports of goods: +7.4% to $1.77 trillion.
- Exports of services: +11.2% to $933 billion (includes foreign tourists spending in the US).
“Net exports” (exports minus imports) improved further to an inflation-adjusted trade deficit of $957 billion, the least bad trade deficit since Q4 2023, and a level first seen in Q3 2021.
The core of the private US economy: “Final sales to private domestic purchasers,” included in the GDP report today, is a measure of the private US economy. It excludes exports, imports, government consumption expenditures, government gross investment, and changes in inventories. It covers about 87% of GDP and presents the core of the private US economy.
Final sales to private domestic purchasers rose by an annual rate of 3.0% in Q3, the best growth rate since Q4 2024, to $21.0 trillion.
The Fed needs to watch out. The economy is running hot. This makes for two quarters back-to-back with hot economic growth, driven in part by strong consumer spending, despite all doom-and-gloom consumer sentiment surveys.
Maybe economic growth is slowing down in Q4, and maybe it will slow down next year, or whatever. But those are speculations. Consumers have surprised quarter after quarter. They’re making record amounts of money, and they’re spending it, and they’re saving some too. The trade shifts are now coming into focus. And the much-discussed decline in residential fixed investment is overcome by increases in other categories of fixed investments.
The last CPI inflation report was marred by missing data due to the government shutdown and gave misleading inflation figures. This is not an economy that needs a rescue through rate cuts. This is an economy that is a feeding ground for inflation.
Enjoy reading WOLF STREET and want to support it? You can donate. I appreciate it immensely. Click on the mug to find out how:

![]()
Thanks Mr wolf
Yep. Time to pause the cuts for the foreseeable future.
I’m one to believe that cutting rates doesn’t really lead to employment growth..just fatter margins.
Exactly
The game, the misdirection narrative is that somehow lower rates…..already lower than historical norms….will some how reverse layoffs and improve employment for “Main Street”. But unemployment is still under 5%.
What is killing “Main Street” is the failure of the Fed to combat inflation.
Nearly everything is at all time highs and the Fed cuts. Its is remarkable.
And the deficit spending continues because the cost of borrowing is being sheltered by Fed gimmickry. IMO
The Fed aims at the “public bucket” but misses into the “elite bucket”. Darn. Almost every time.
Inflation percent used should be closer to 8% and not a single person will change my mind. I bet we see 15%-20% inflation within a year.
U-Hal trucks are delivering Xmas stuff along with USPS, UPS,
AMZN, FedEx and WMT private guys with a camera. In Jan they will cannibalized each other. The middle class are buying in Dollar General. The rich sent Saks Fifths Ave to the recycle bin.
The positive I take from this is less likely to have rate cuts or at least fewer rates cut. If an economy was like a rising tide I would take away more positive from it. Not suggesting it is bad news by any means, just not particularly relevant in how I personally evaluate. To me it isn’t a contradiction to see a sour mood among consumers despite solid overall consumer spending and GDP.
Wolf, what about “productivity”? Could that be increasing and thereby justify lower rates?
There is no direct link between productivity and interest rates. Rising productivity is going to first and foremost increase profits — which is why companies go after increasing productivity. Companies are not going to voluntarily pass on their profits to consumers. Competition might force them to, but the thing about inflation is that companies have the confidence that they can get away with price increases. And as we have seen, corporate profits exploded during the big inflation years.
It’s lonely on my one-man island at times. Nonetheless, I continue to boycott Doritos, Name Brand Soft Drinks, Disney, NFL, Etc….
I’ll keep doing my part, if for no other reason than necessity. You can count on me to hold a grudge and keep those corporate profits smaller!
Happy holidays.
Thanks Wolf’
SAAR: Seasonally Adjusted Annual Rate, But, also Sa’ar is Hebrew for Storm. May you all weather the upcoming Storm.
The Algo got the Bulls Tee d up for Santa rally that historically starts tomorrow, Wednesday, December 24, 2025, and goes through Monday, January 5, 2026. Will they hit the ball or miss? Am I the last bear? Did Gold hit its target today? Have fun!!
Mi yitan vena’avor et hasara
I just have a comment regarding the video and the astounding vertical move in metals, I looked at the chart of the silver ETF (SLV) going back 20 years, and the last time it was this far above its 200 day average–more than 70 percent– was April of 2011, and then it dropped from $47 to $33 (30%) in five days. I’m not making any predictions, just an observation.
Thank you for watching the videos. A new one almost every day. They’re interesting — Chris gets into lots of technical trading stuff.
Where do I go to view the videos?
Short bonds!
You have to pay the dividend every month. You also risk big losses if the economy loses steam or stocks have a bear market (very possible in my opinion) and the Fed needs to lower rates for a genuine, legitimate reason.
Perhaps the stupidest rate cut in history.
The 1/2 trillion dollars increase in our means-of-payment money supply will not be “washed out”.
Overheated rooms in the Econo-lodge? Have a soothing glass of ice cold Bitcola! Wait..how can you tell if the glass is half-empty or half-full if you can’t see the product? Oh well, we can always go battleship shopping instead. Time for a bakesale. Let’s get those ICBM’s out the door. It’s big stick clearance days for Christmas. Mall’s open 24/7. (No cash exhanges permitted. Pennies will be rounded up to the nearest trillion.)
Hellvis needs boats! Hellvis needs boats!
Hellvis, Hellvis, Hellvis,
Hellvis, Hellvis, Hellvis,
Hellvis needs boats!
(RIP Mojo Nixon 1957-2024)
“Residential fixed investment: -5.1%.” I guess the new housing sickup continues.
It seems like everyone is confused about this economy. According to Bloomberg, we have GDP above all forecasts save one, inflation below all forecasts, consumer sentiment declining for five straight months, and the highest pessimism in the job market since 2021, with the leading story being a job market that’s more or less frozen like the housing market. There’s also a lot of concern about the default rates on auto loans, and how the incoming increases in health insurance premiums and the restart of student loan payments are going to affect all of that. Throw in a giant white swan called the “AI bubble,” and the sentiment surveys don’t look all that surprising.
One specific thing I’d like to know in regards to all this consumer spending, including on Black Friday etc, is which theory is correct: that people feel good and are splurging on all this stuff, or they feel bad and are pulling all of these purchases forward in anticipation of inflation, tariffs and a loss of job security – all of which would be more consistent with the surveys. Personally, the latter reason is why I’m buying anything that I am. Anyone else?
In a podcast yesterday, the chief economist at VantageScore (they do the credit score models) made some remarks about a third version of that theory: that he isn’t sure whether the increases in spending are due to people splurging or just due to the prices increasing. He also said that the spread in spending and default rates between the low and high ends of the income spectrum keeps widening, and he expects that people will have an even harder time of things going into next year, especially at the lower end, just based on trendlines alone.
Net Exports of non-monetary gold (NMG) in Q3 had a significant impact on net trade and accounted for the majority of the reduction in the US trade deficit.
Given these Q3 GDP numbers are considered the revision, is it correct to assume that any impact of NMG for investment (non-industrial usage), which should be the vast majority of the net export, have been stripped out of the calcs?