The beginning of the 4th year of demand destruction in the resale market after the price explosion from mid-2020 to mid-2022.
By Wolf Richter for WOLF STREET.
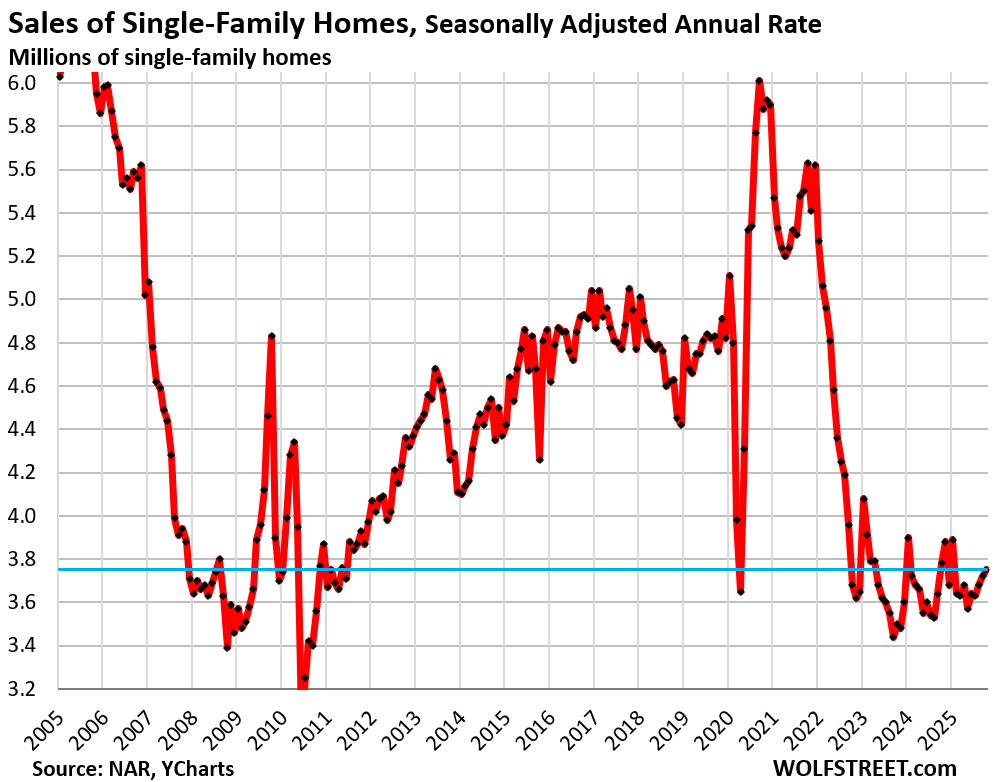
Sales of single-family homes that closed in November rose seasonally adjusted by 0.8% from October, but were down year-over-year by 0.8%, and by 22% from November 2019. At an annual rate of 3.75 million, sales were at Housing Bust levels.
Welcome to the beginning of the fourth year in a row that sales of existing single-family homes have wobbled along crushed levels (historical data from YCharts):
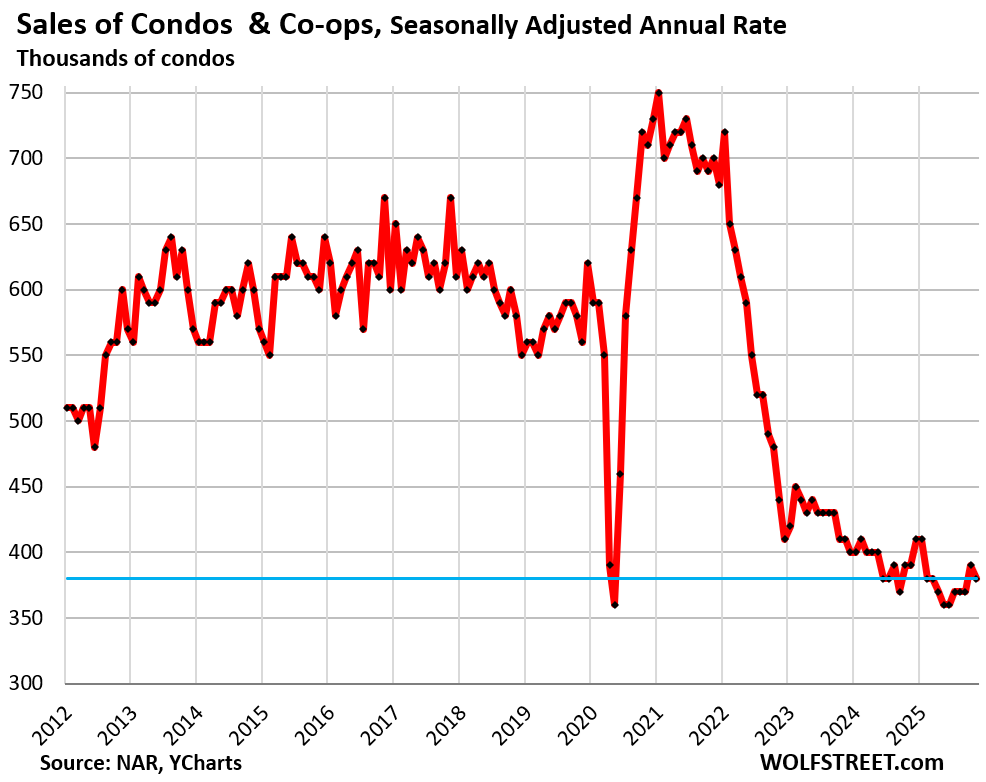
Sales of condos and co-ops fell seasonally adjusted, both, month-to-month (-2.6%) and year-over-year (-2.6%), to an annual rate of 380,000, according to the National Association of Realtors today.
Compared to November 2019, condo sales were down by 32%. NAR’s data on condos goes back only to October 2011, and within that time frame, sales have been wobbling along record lows for over three years (historical data from YCharts).
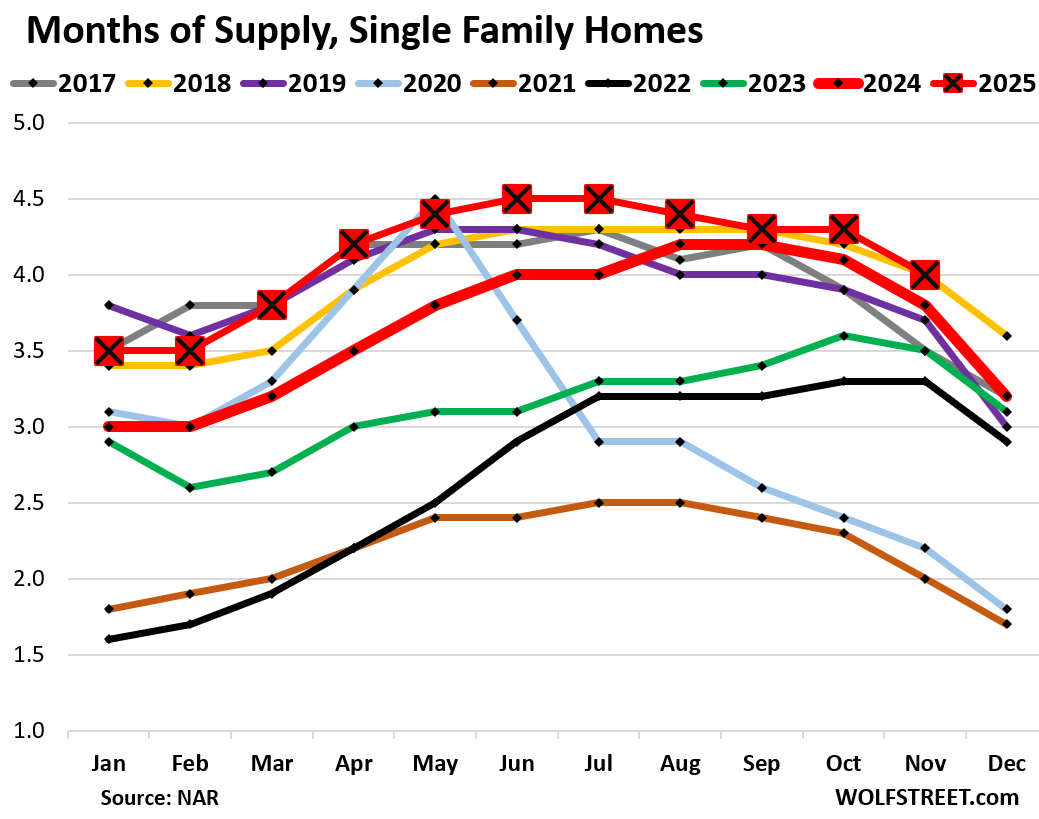
Most supply in years.
Supply of single-family homes dipped along seasonal patterns to 4.0 months (red line with big squares in the chart below), the highest for any November since 2018 (also 4.0 months, yellow line). Back in November 2018, mortgage rates had surged to 5% and were starting to shake up the housing market.
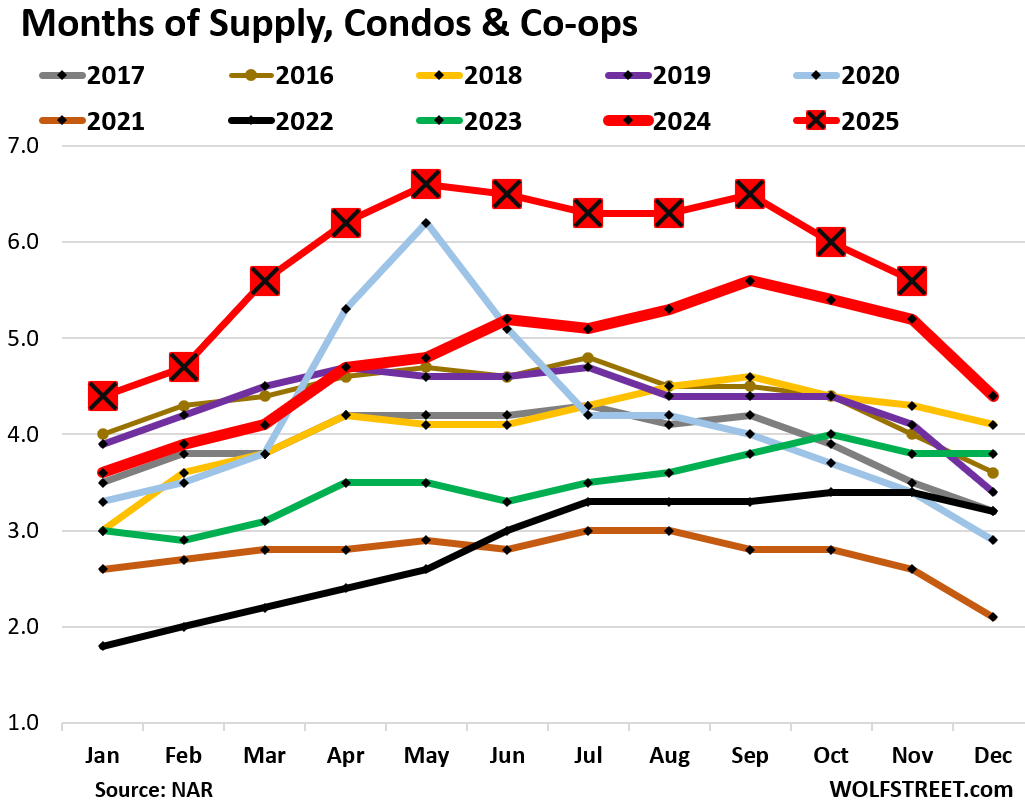
Supply of condos declined seasonally to 5.6 months, the highest for any November since November 2011 during the Housing Bust. Compared to November 2019, supply was up by 37%.
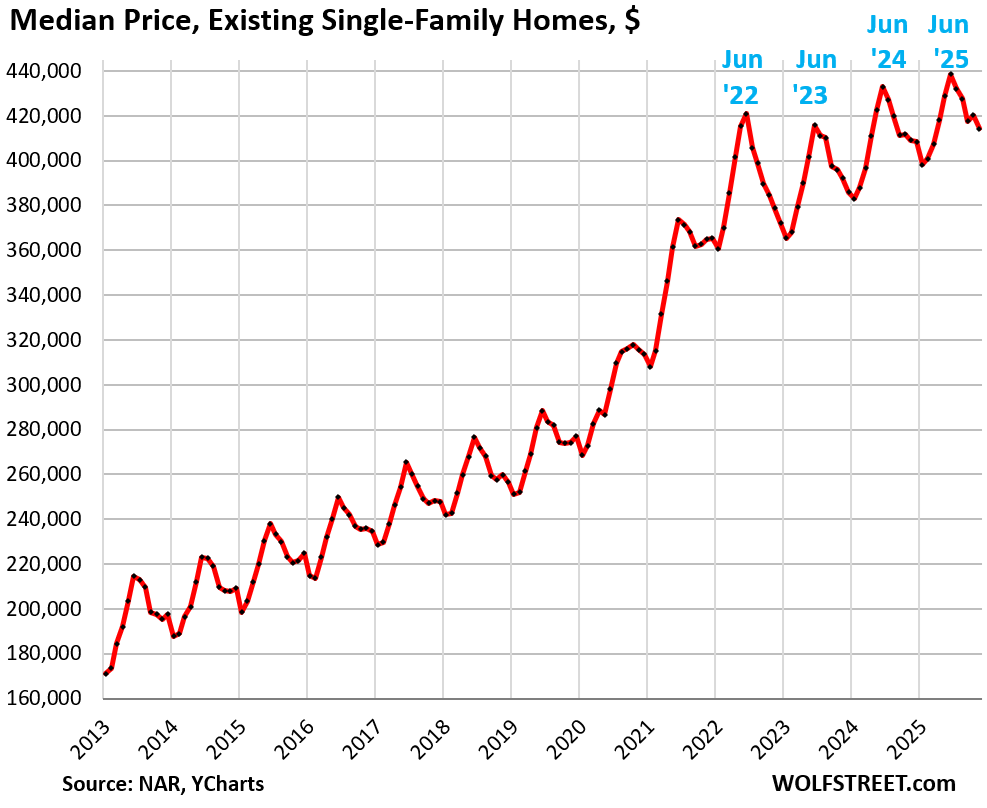
The national median price of single-family homes fell by 1.4% in November from October along seasonal patterns, to $414,300, reducing the year-over-year gain to 1.2%.
This national median price of single-family homes had exploded by 47% from June 2020 through June 2025, most of it during the two years of mid-2020 to mid-2022.
June marks the seasonal high each year. January or February marks the seasonal low each year. The index is not seasonally adjusted. The seasonal zigzag is a result of shifts in the mix of what is on the market and sells, which shifts the median price up or down.
The national median price of condos and co-ops dropped 1.5% in November from October, and by 1.5% year-over-year, to $358,600.
This national median price of condos and co-ops had exploded by 43% from mid-2020 through mid-2025, most of it during the two years of mid-2020 to mid-2022.

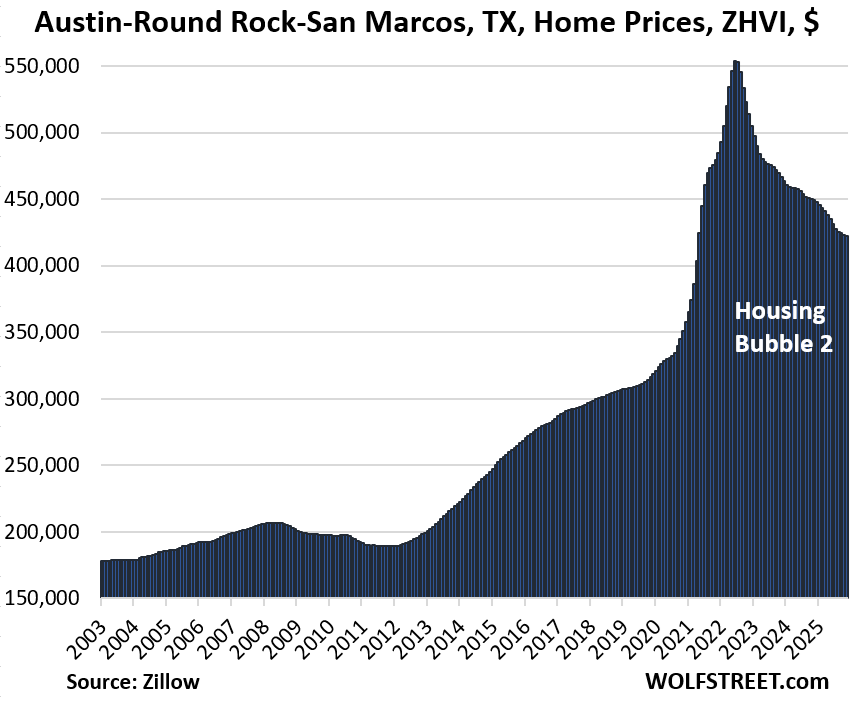
But price dynamics differ in individual markets.
The national median price is meaningless for specific markets. In some markets, home prices have fallen substantially, including by 24% in the Austin-Round Rock-San Marcos metro, the biggest drop in our lineup of 33 large and expensive housing markets. The drop so far has backed out only about half of the 74% price explosion from January 2020 through June 2022:
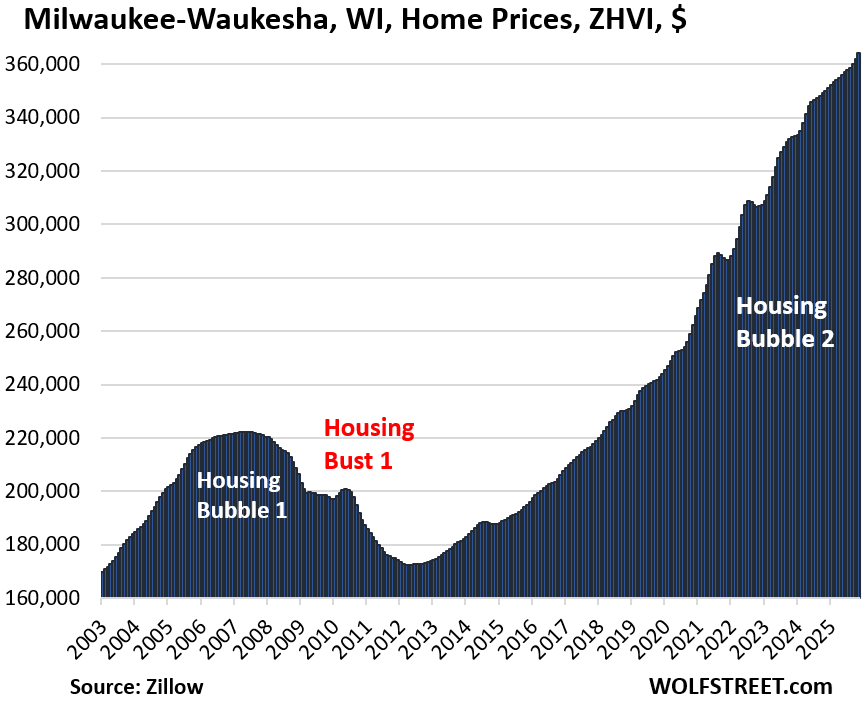
Conversely, the Milwaukee-Waukesha metro is the market with the biggest year-over-year gain (+4.1%) in our lineup of 33 large and expensive housing markets:
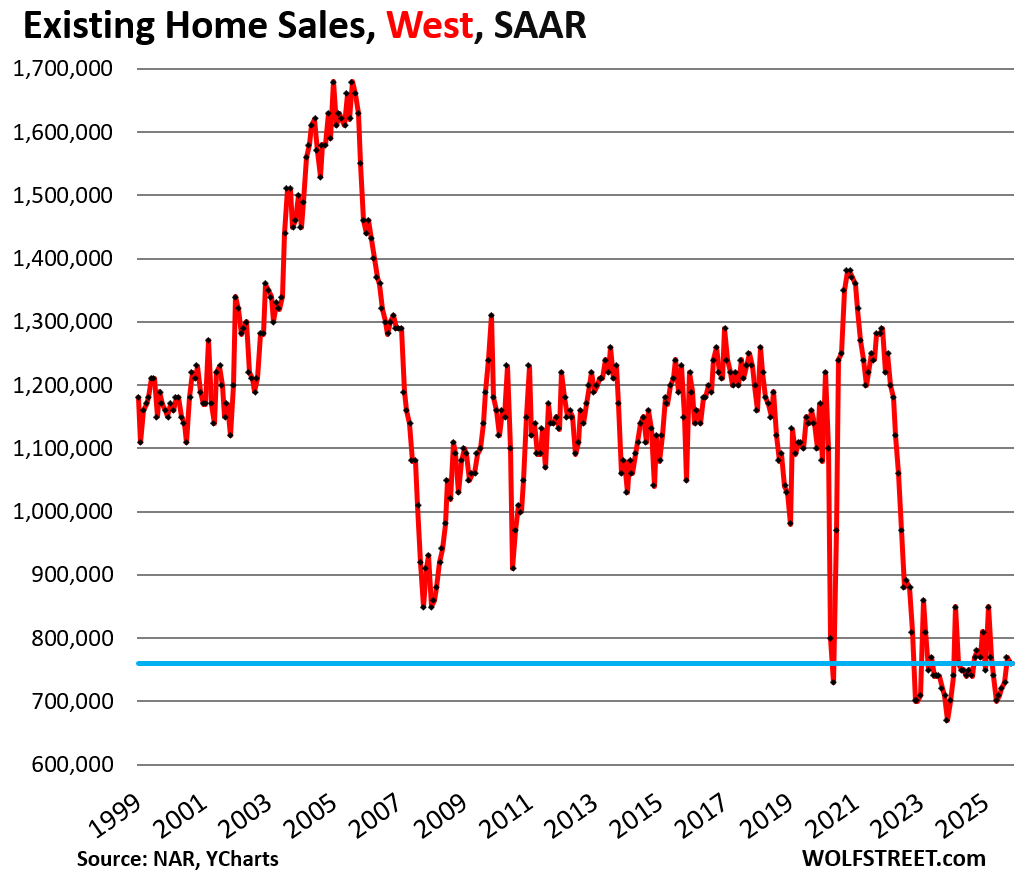
Demand destruction by region.
The charts below show the seasonally adjusted annual rate of sales (SAAR) in the four Census Regions of the US. A map of the four regions is at the top of the comments below.
In the West, the seasonally adjusted annual rate of sales remained at 760,000 homes in November compared to the prior month, and was down by 1.3% year-over-year, by 31% from November 2019, and by 27% from November 2018.
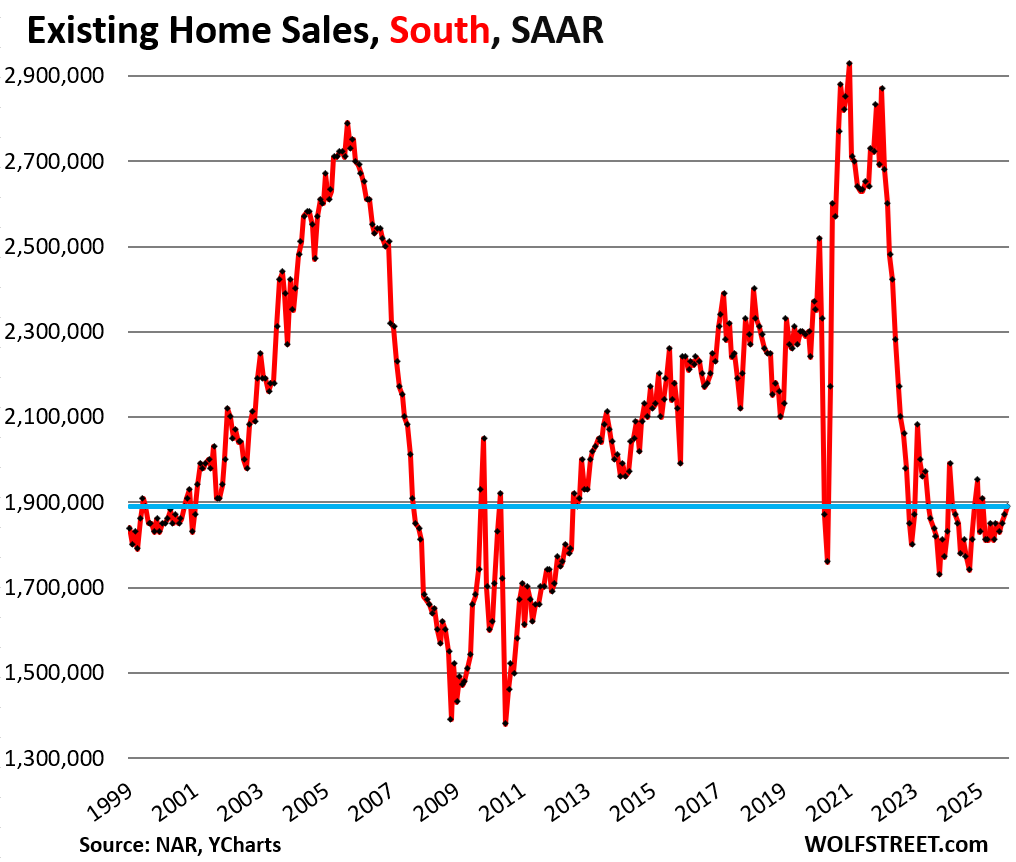
In the South, the seasonally adjusted annual rate of sales rose from the prior month to 1.89 million in November, but was unchanged from a year ago, and down by 16% from 2019 and by 13% from 2018.
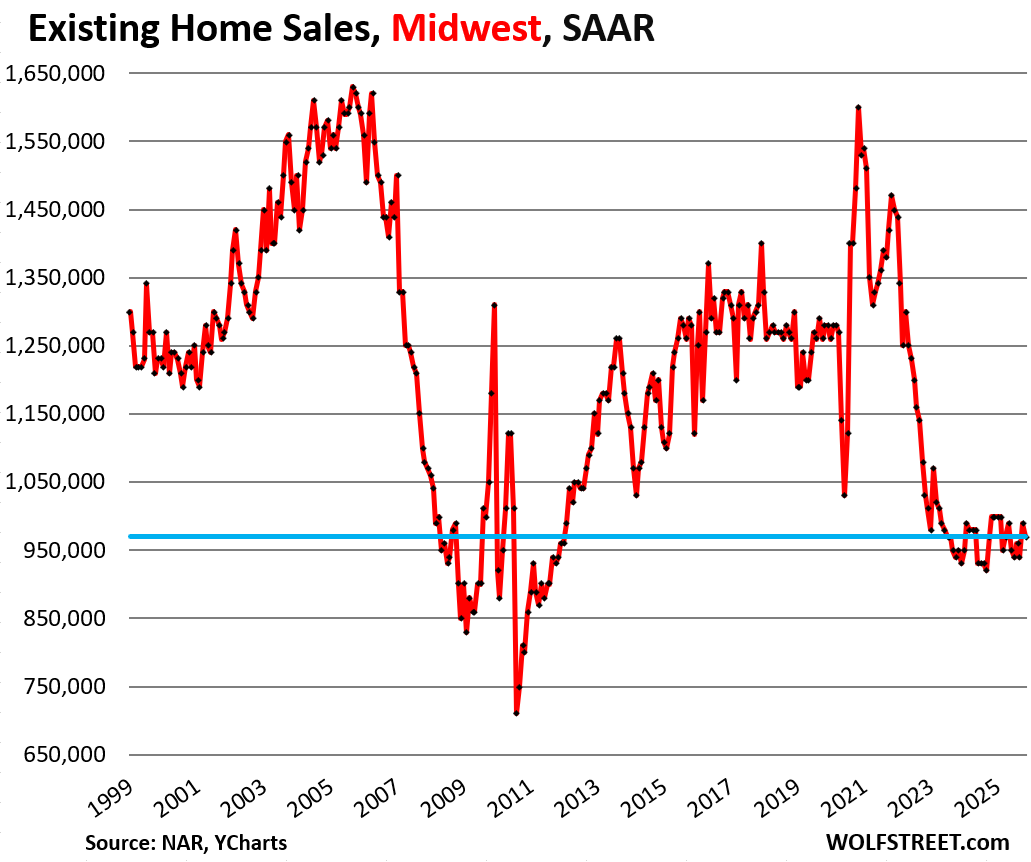
In the Midwest, the seasonally adjusted annual rate of sales fell from the prior month to 970,000 in November, down by 3.0% year-over-year, by 24% from 2019, and by 23% from 2018:
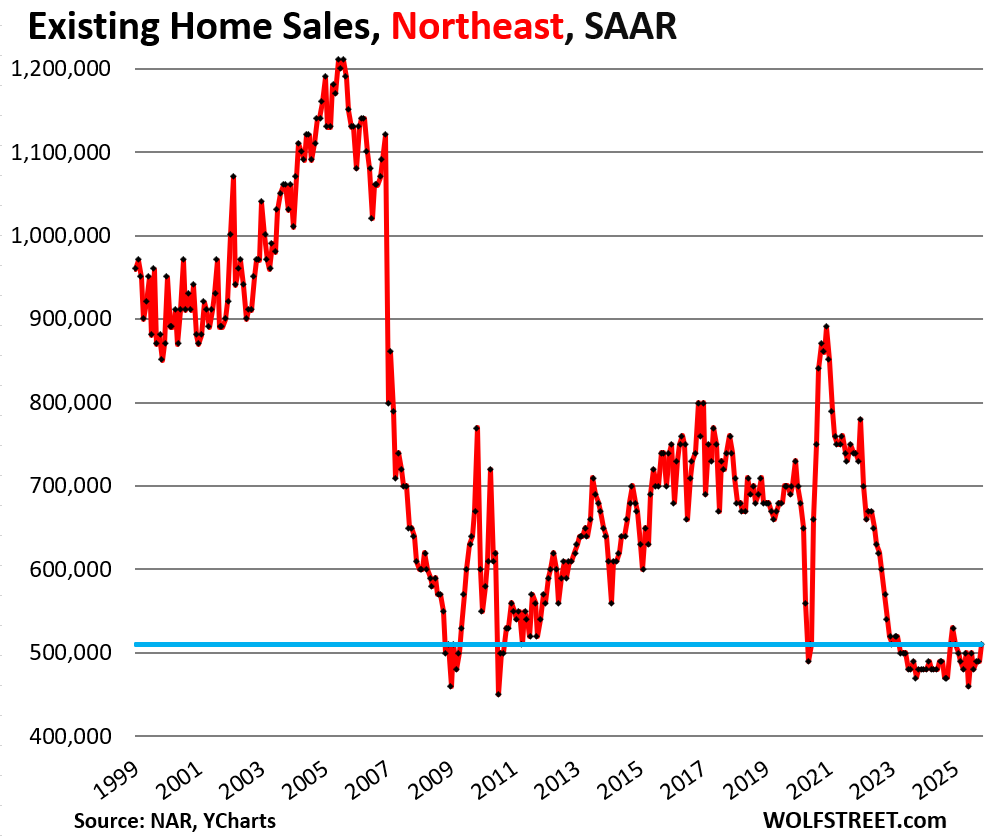
In the Northeast, the seasonally adjusted annual rate of sales rose from the prior month to 510,000 homes in November, unchanged from a year ago, and down by 27% from 2019 and by 28% from 2018.
Enjoy reading WOLF STREET and want to support it? You can donate. I appreciate it immensely. Click on the mug to find out how:

![]()
Here is a map of the four Census regions of the US:
Why are prices still going up in some markets
Some markets are still relatively cheap. Prices there surged too, but from low levels and are still low compared to high-priced areas. I keep thinking about my former hometown Tulsa, which had been through three decades of a housing depression. Obviously, incomes are a lot lower too in those areas, with far fewer opportunities. Cities like Tulsa were so desperate that they paid working-from-home people to move there if they brought their jobs with them (with some success). But it seems from some sporadic reporting that not everyone who made that move is particularly happy with it. It goes something like this: “Sure, housing costs a lot less than in San Diego, but…”
Wisconsin’s economy is supposedly still in expansion. I guess that coupled with relatively low unemployment has allowed it to continue….for now. That said, I sure as hell am not buying. 😉
There are two charts of SF Wolf, where one was supposed to be condos and coops.
I live in the Northeast; and looking at the sales volume in the 1999-2005 years compared to now is incredible to see. Hard to believe there was that much volume of sales at one point.