What Are They? And why now?
By Wolf Richter for WOLF STREET.
At its meeting on October 30-31, the Fed decided to end QT on December 1, citing tighter liquidity; and it mentioned the concept of “reserve management purchases” and their potential composition, which it said it would further discuss in future meetings, which opened the new era of post-QT.
So we’re going to hear more about “reserve balances” and “reserve management purchases” at the meeting this week, if not in the statement, then at least in the press conference; and if not voluntarily offered by Powell in his prepared remarks, then in his reply to the slew of questions from reporters about it.
Liquidity has been getting tighter after the Fed shed $2.4 trillion in securities during QT. That tightness in liquidity became apparent in September and October with turmoil in the repo market. During the years of mega-QE and still during much of QT, liquidity was sloshing in vast excesses through the system. But that is over – the turmoil in the repo market has demonstrated that.
And the minutes cited two places on the Fed’s balance sheet where this tightness in liquidity has manifested itself – both of them are liabilities on the Fed’s balance sheet.
- Reserve balances – cash that banks have put on deposit at the Fed – dropped by $1.42 trillion from the peak at the end of QE in December 2021, to $2.86 trillion now.
- Overnight reverse repos (ON RRPs) – cash that mostly money market funds put on deposit at the Fed) plunged by $2.37 trillion from the peak in September 2022 to near zero now.
Reserve balances are cash that banks have put on deposit at the Fed in their reserve accounts – sort of big checking accounts at the Fed. Banks pay each other through these accounts daily in vast sums, and they earn interest on their balances. The rate of Interest on Reserve Balances (IORB) is one of the Fed’s five policy rates, and with the October rate cut was set at 3.9%.
In normal times, reserve balances should grow with the banking system, which should grow with the economy. During QE, reserve balances ballooned far faster than the economy. During QT, reserve balances shrank even as the economy grew.
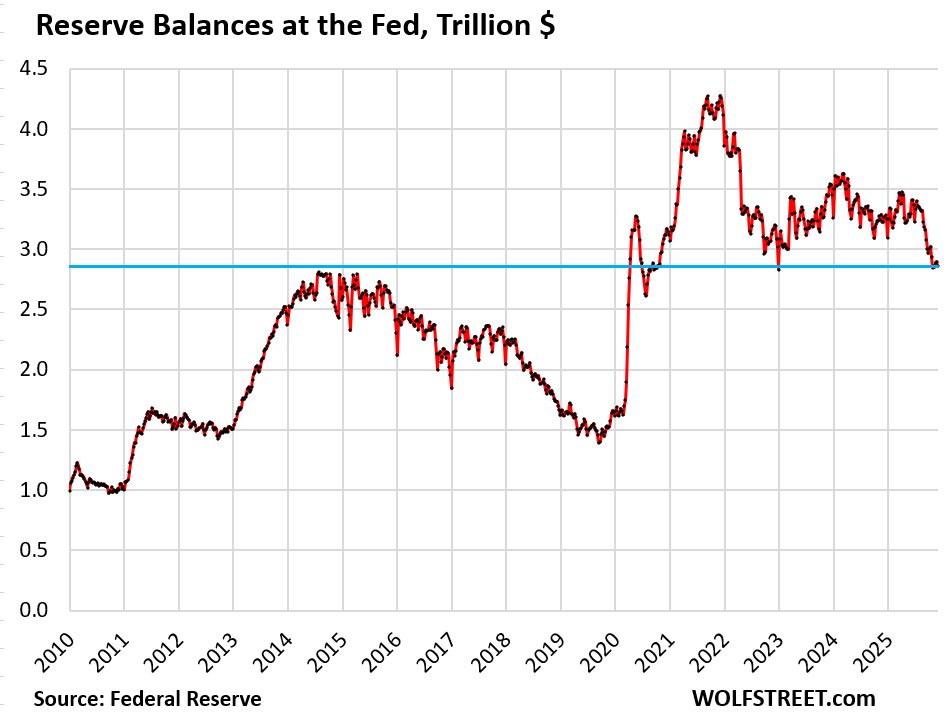
Even when the Fed holds the balance sheet steady, reserve balances continue to shrink as other liabilities grow – mainly currency in circulation and the government’s checking account (TGA) at the New York Fed, both of which are demand-based.
The Fed held the balance sheet steady in 2014 through 2017, and reserve balances fell. Then at the end of 2017, the Fed started QT-1, and reserve balances fall further.
And even after QT-1 ended in mid-2019, the Fed held the balance sheet steady, and reserve balances continued to shrink until the repo market blew out.
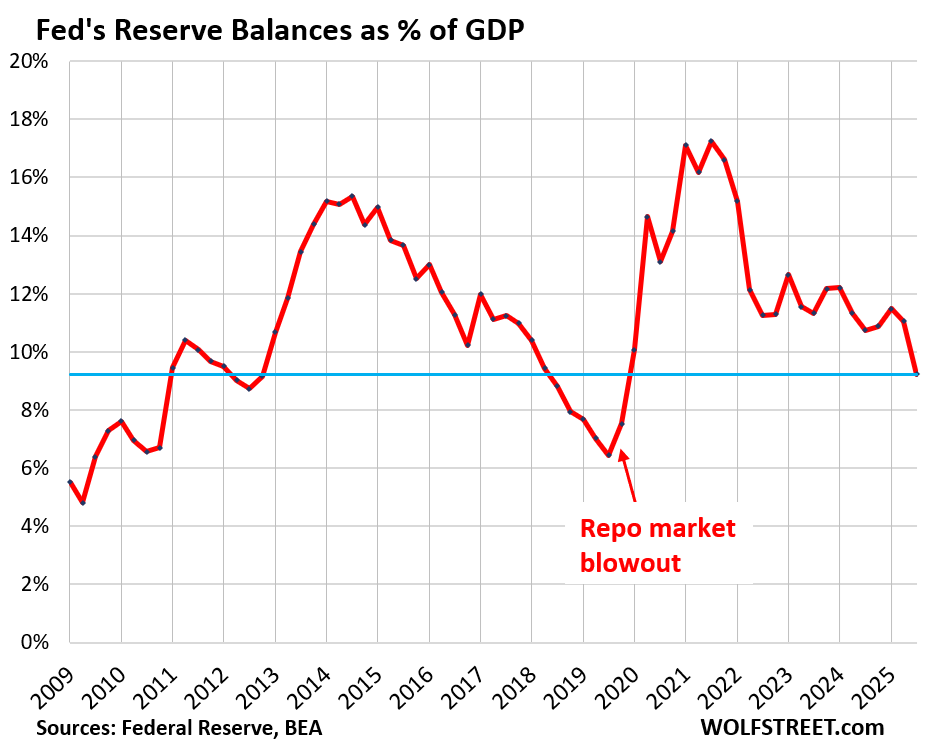
Reserve balances in relationship to the economy – as a percentage of GDP — shows the distortions that QE caused, and to what extent QT, and even holding the balance sheet flat, deflated those distortions in relationship to the size of the economy.
Reserve balances of $2.86 trillion have dropped to 9.2% of GDP currently, from the peak of 17.3% at the peak in Q3 2021.
ON RRPs are the other form of liquidity on the Fed’s balance sheet, which is where money market mutual funds deposit their extra cash that they don’t know what to do with. During QE, they’d exploded from zero to $2.2 trillion, and now after three years of QT, they’re back to zero.
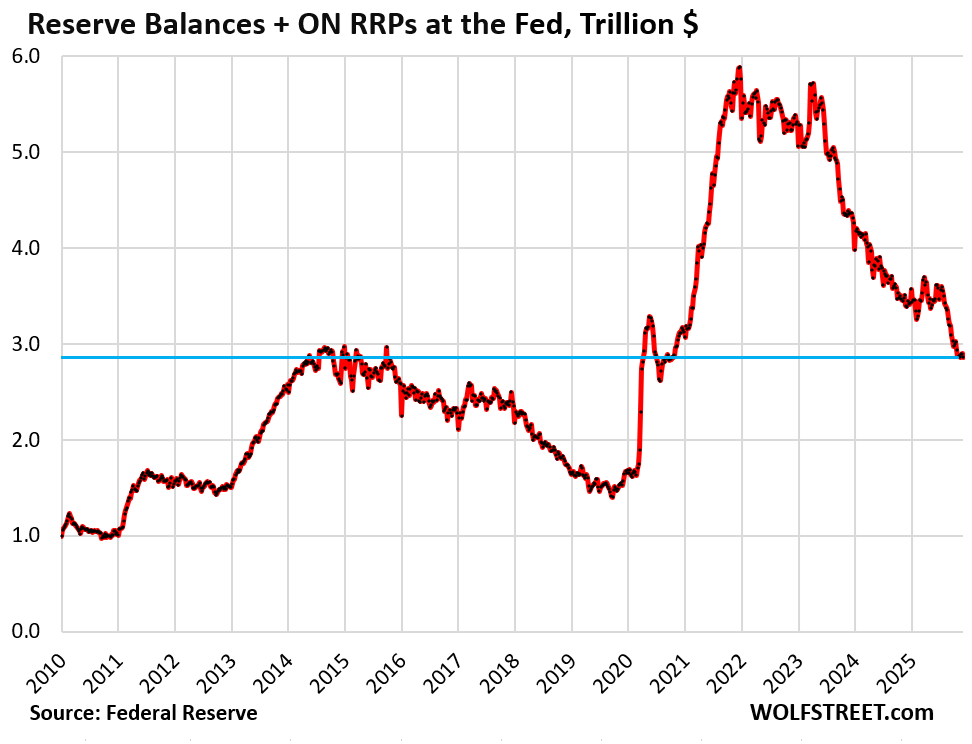
But there were big shifts of liquidity between reserves and ON RRPs, and it is helpful to look at them as combined liquidity.
The combined liquidity (reserve balances plus ON RRPs) had peaked at $5.87 trillion in December 2021, when QE was ending. It has now plunged by $3.02 trillion, to $2.86 trillion, with ON RRPs being near zero:
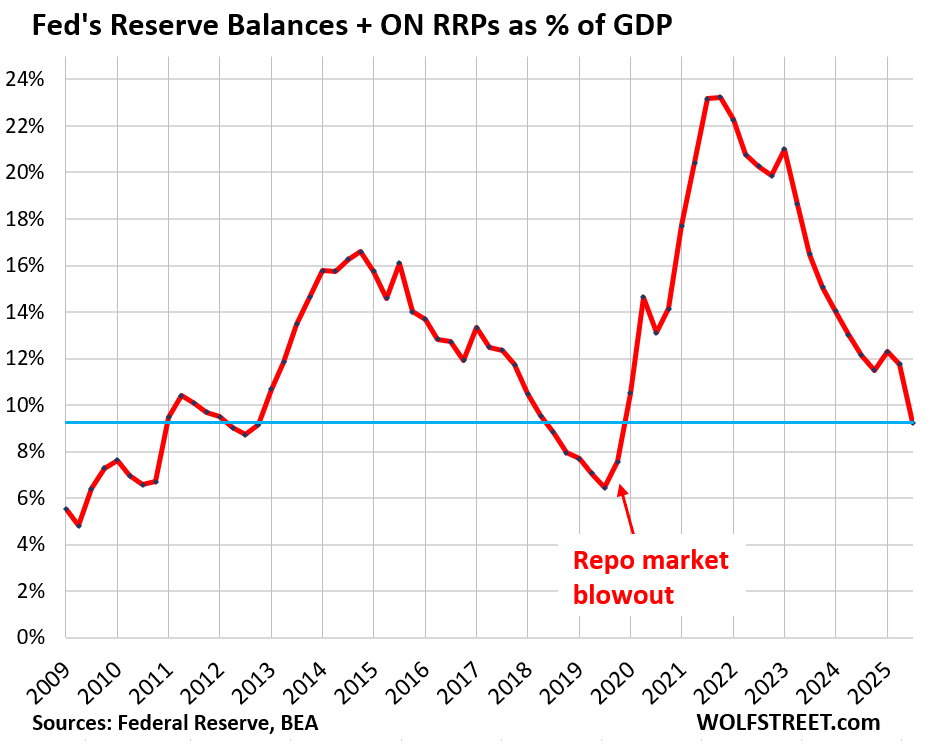
Reserves and ON RRPs combined have also dropped to 9.2% of GDP, with ON RRPs at near zero, and reserves at $2.86 trillion. But the combined peak had reached 23.4% of GDP in Q4 2021, when QE ended.
Reserve balances alone don’t show to what extent the Fed’s QE had flooded the markets with excess liquidity and how much of that has been removed by now in relationship to the economy.
“Reserve management purchases” that the Fed is now talking about are similar to the classic method before 2009 with which the Fed has kept reserves and its balance sheet roughly proportional to the economy and the banking system, with total assets at around 6% of GDP.
Back then, it engaged in repos and purchased Treasury bills (mature in 1 year or less) to increase its assets and control short-term interest rates.
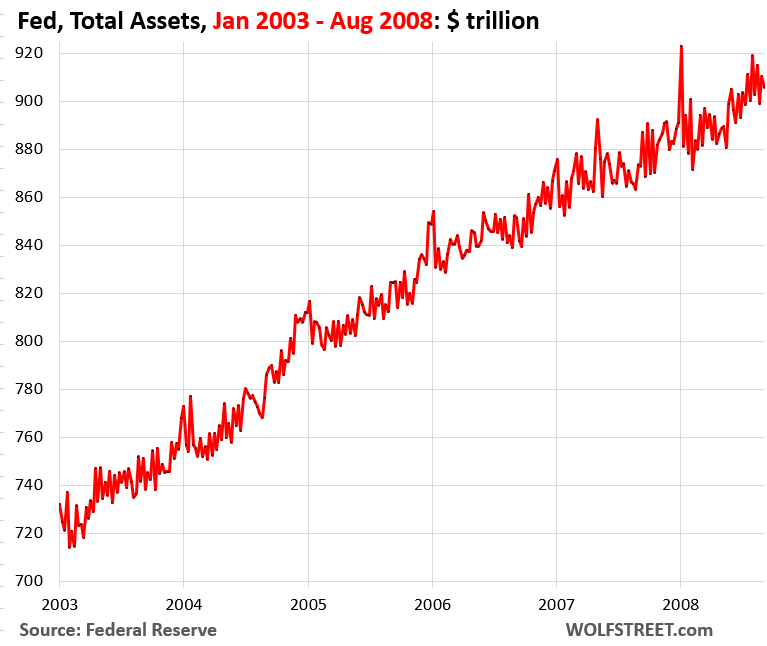
The chart below shows the Fed’s balance sheet from January 2003 until the bankruptcy of Lehman Brothers in September 2008. What gave total assets this jagged line were the repo transactions that varied dramatically from day to day, as the Fed attempted to actively manage short-term interest rates by adding or removing liquidity from the banking system via repos with its counterparties.
That was the old version of today’s Standing Repo Facility (SRF). In 2009, as QE flooded the system with cash, the Fed scuttled the SRF as it was no longer needed, which came to haunt the Fed in 2019, when the repo market blew out.
In early 2021, the Fed officially switched to an “ample reserves regime” (as practiced de facto since 2009), from a “scarce reserves regime” (as practiced before 2009). Under this “ample” reserves regime, reserve balances are much larger than before to make sure that there is “ample” – but not “abundant” – liquidity in the banking system.
If the Fed were to revert to a “scarce reserves regime” and minimum reserve requirements, as it did before, reserve balances could be a lot smaller than today. Since the Fed revived the SRF in 2021, which can provide daily liquidity to the banks, the Fed could back off its “ample reserves” regime.
But that won’t happen anytime soon, based on the Fed’s discussion of the “reserve management purchases,” whose explicit purpose it is to prevent reserves from becoming “scarce.”
Enjoy reading WOLF STREET and want to support it? You can donate. I appreciate it immensely. Click on the mug to find out how:

![]()
Once again, another mechanism by the Fed to suppress interest paid to depositors. The 3.9 % is ludicro u s since the Fed is holding these banks reserves to facilitate transaction clearing between banks. This was another deal put in place by the Fed under the QE king. Banks still get away paying zip on demand deposits but they get paid 3.9% at the Fed with our money.
Just another all street subsidy for wall street banks.
1. “Once again, another mechanism by the Fed to suppress interest paid to depositors.”
No, the Fed’s Interest on Reserve Balances [IORB] is one of the Fed’s “floor rates” which keeps short-term interest rates from falling much below that 3.9%. So when banks need cash from depositors, they have to raise their CD rates toward the 3.9% to attract new money. The market is now pricing in a rate cut this week, and if that happens, it will bring the IORB down to 3.65%. That’s were banks are now positioning themselves with the CD rates. So the IORB is one of the reasons why the banks had to pay higher yields to attract new deposits, or to keep deposits.
Demand deposits (such as a checking account) are just free money bank customers give to banks. In return, they get lots of services for free that used to come with fees. You should keep those balances down to a safe minimum, such as two or three months’ expenditures. The rest of what you want to keep liquid needs to go where cash earns near the IORB, such as money market funds, CDs, etc.
2. “Just another wall street subsidy for wall street banks.”
Kind of and kind of not. The Fed’s Interest on Reserve Balances could be seen as a subsidy to the banks, but if IORB didn’t exist, the banks would invest their cash in T-bills and similar securities and earn about the same, so it’s not a subsidy when netted out.
“Reserve balances – cash that banks have put on deposit at the Fed –”
With the huge government debt auctions, isnt it reasonable to assume these auctions are sucking up cash, thus reducing reserve balances?
With the money supply hitting new highs, liquidity issues seem to be more related to high levels of committed capital rather than lack of money supply in the system.
Reasonable assumptions? Your thoughts.
Yes, but only briefly, and only in the instant when the auction sales settle a few days later, they suck up cash from reserve balances and move it to the TGA (government’s checking account at the Fed). As the government then spends the auction proceeds, they go from the TGA into the bank accounts of the recipients, which are part of the reserves, and therefor become reserves again. So in the constant flow of auction sales and government spending, the day-to-day movements can be big, with reserves suddenly falling when big auction sales settle on the same day, and with reserves jumping on a big-spending day. This is one of the reasons why there need to be enough reserves in the system to deal with these big day-to-day fluctuations.
Wolf: can you comment on why the Treasury decided, years back, to move cash from a group of large banks to its consolidated account at the Fed. It seems that by doing that they are draining reserves then adding them back as the govt spends the money. Does that make any sense? The US Treasury can’t deal with 10 banks to manage its money?
This shift occurred during the Financial Crisis. The US government wanted to avoid for all times that its funds, or part of its funds, might ever get locked up in a collapsing bank. If the government cannot access its cash, especially during a crisis, things could get really messy really quick. So that was a reasonable move.
But yes, it does impact the Fed’s balance sheet and reserves. So that just has to be managed.
If the scarce reserve regime was successful for so long, and with the SRF and other management techniques like the ad hoc BTFP, why is the Federal Reserve so concerned about shrinking further from ample reserve regime?
The scarce reserves regime became a problem after banks were allowed to become huge, and risky, after the Glass-Steagall Act was repealed in 1999. To deal with their daily liquidity needs, banks were borrowing from each other unsecured in the federal funds market (interbank lending), without collateral. And so they were all connected to each other and dependent on each other for daily funding. When rumors spread that one of the banks was perceived as too risky, the other banks stopped lending to it, and the bank ran out of liquidity, and then couldn’t pay back the loans from other banks, and they ran short on liquidity, and contagion spread like wildfire across the banking system that way.
This unsecured interbank lending has essentially died down after the Financial Crisis and is used mainly for a strange arbitrage between the Federal Home Loan Banks and foreign banks. You can read about this here:
https://wolfstreet.com/2025/11/01/what-does-the-federal-funds-rate-which-the-fed-targets-still-measure-not-much-mostly-a-bizarre-arbitrage-trade/
So if the Fed returns to a “scarce reserves regime,” banks should not be allowed to borrow from each other in the unsecured federal funds market. They should borrow secured in the repo market, or secured at the Fed’s SRF.
Wolf
Did you just give us a hint of what you think of the Glass Steagall repeal?
repeal of Glass-Steagall was a huge mistake. I have said something to this effect ever since I started this website.
Deposit-taking banks should never be hedge funds.
Instead of repealing it, they should have amended it to allow for banks to be active nationwide. Limiting banks to just their home state became impractical in the internet era and the modern highly mobile world.
Repo Market: The Repo market doesn’t make any kind of sense; who cares if money is sitting in a bank when it is closed and nothing but their securities when it is open. Never seen a Western where the outlaws waited until nighttime when the Safe was refilled with money and the bank wouldn’t notice a robbery when it opened in the morning, because there is never any cash on hand then.
I think you know the answer.
The Fed has a rational fear of asset price deflation, after irrationally providing artificial asset price support for decades.
Eyeballing Wolf’s second chart “Fed’s Reserve Balances as % of GDP” shows a number at roughly 9%. Over the years and honestly not paying too much attention I always thought banks were required by the Federal Reserve to maintain a reserve of 10%, understanding that to mean $1 in available cash for every $10 on deposit by customers. Assuming that almost all money runs through the banking system on a daily basis, I would assume that the amount of “ample reserves” available today (9% of GDP) is somewhere around a long term historical range (10% of GDP). I’m hoping someone will step in and show me the error of my ways.
“banks were required by the Federal Reserve to maintain a reserve of 10%,”
no required reserves since 2009 is my understanding
Greenspan reduced legal reserve requirements by 40 percent to counter the 1990-1991 recession. He should have just engaged in open market operations of the buying type.
Then the banks became unbound in 1995, meaning the multiplier of 10/1 changed. The multiplier, the money stock divided by required reserves, rose to 206 to one by 2008.
Today, the banks are constrained by the remuneration rate, which is typically higher than their net interest rate margins. Lowering the IORB from 3.9 percent could spur lending/investment by the banks. Watch commercial bank credit expansion.
“the remuneration rate” ?? Do you mean IORB??
I think the term ample reserves is a misnomer. The times short-term rates go above the remuneration rate are outliers.
Well I think that you have missed the meaning completely. The plan is to allow inflation to dilute the value of the currency in order to justify the high asking price of an American home.
Kent, reserve requirement (fractional reserve ratio, FRR) used to be 10% of total loans (“assets”), not GDP. It was never about GDP. Mentioning FRR and GDP in the same breath is nonsense. Bringing up GDP is a distraction that inflationists are trying to use to justify money-printing. Printing money increases reserves + currency by a 1:1 ratio. That’s what printing money is.
Wall St and the top 1% love it, as it causes massive asset inflation, while labor of the rest of us is dramatically reduced in value.
Narmageddon,
Read the article. Your line, ” Printing money increases reserves + currency by a 1:1 ratio” is just nonsense. I’m not going to repeat the article in the comments, so go read it, pay attention to TGA and ON RRPs, and the HUGE shifts between them and reserves. Reserves is just one of the liabilities element. For example, $2.4 trillion of money printing went into ON RRPs, not reserves, and then during QT were drained out of ON RRPs. There are at least 100 articles on this site that explains this relationship, including this one.
It’s tough to reach any destination when you don’t know where you are and have no idea where you’re going, isn’t it?
An economy is an endless process not a destination.
That would be true if it was actually Laissez-faire
Laissez-faire leads to chaos and anarchy. Traffic laws exist for a reason. They’re enforced, and you get punished if you run a red light and kill someone because you were in a hurry. Same with markets and an economy in general, from building codes to labor laws. Not all rules are perfect. And some rules are maybe unnecessary (or someone thinks they’re unnecessary). But to make a vast and immensely complex economy work, with 340 million packed together, an economy that is globally connected to everything, you need to have rules and governance.
The money certainly has a destination.
The Fed has always been able to add reserves to the banking system, in any amount and at any time. Why did it adopt the “ample reserves” regime? Under that regime the Fed pays interest on reserve balances. IORB decreases the Fed’s remittances to the Treasury. It is an indirect subsidy to the banks paid by the taxpayer.
“It is an indirect subsidy to the banks paid by the taxpayer.”
Yes and no. If IORB didn’t exist, the banks would invest their cash in T-bills and similar securities and earn about the same, so when netted out, maybe not a subsidy.
But if the IORB didn’t exist, the Fed will have to “require” banks to keep reserves, so revert to “minimum reserve requirements.”
The IORB is one of the Fed’s “floor rates” – it keeps short-term interest rates in the money markets and the Treasury market from falling much below the IORB. It’s why you were getting 5.5% on your T-bills in 2023, and why you’re getting 3.7% on your T-bills now, and maybe a little more in money market funds. If the Fed stopped paying IORB, those short-term rates might drop some.
IORB … the Fed pays the interest
IF the banks instead, without IORB, bought T bills,….the Treasury pays.
The Treasury paying interest to banks would then be in return for their money being “lended” to the government. A transaction. The Govt benefits and the banks benefit.
But when the Fed pays IORB, where is the transactional benefit to both parties? The banks benefit, but where is the benefit to the Fed?
Milton Friedman, as I understand, wanted the Fed to pay banks interest on required reserves. There is some wisdom in this as a “requirement” is met and then interest is paid as a result.
Dr. Milton Friedman was one dimensionally confused. Reserves are “Manna from Heaven”.
Indeed :)
The important thing is that if the banks bought t-bills, instead of holding interbank demand deposits, it would be creating new money and credit.
“From January 2003 …until Lehman”
Looking at those old charts and the low balances and ratios makes me wonder if the Fed and the economy as a whole will ever be able to operate without the training wheels again. Likely not.
What are the economic implications of QE and QT in this scenario? I understand some more mainstream economic concepts but what this means to me has seemed to elude me
Fed reduced the reserve requirement in 2020 to zero, and hasn’t reinstated it. There may be a few exceptions to this, but I believe they’re minor.
The chart below shows the Fed’s balance sheet from January 2023 until the bankruptcy of Lehman Brothers in September 2008.
Should be from 2003?
Thanks. I got this finished in the middle of the night by which time my brain had become dysfunctional.
Fed total assets were < $1T in Aug 2008, before they jumped by $800B after congress hurries Bernanke's Iron dome to save the banks and the RE market. It was used again in Mar 2020, creating a tsunami of money. RRP sucked it first, before raising rates.
The Fed did extensive research on what happen sept 19 2019, they listed multiple reasons tax payments were due a few days earlier, primary dealers net max long and needed repos for pay for UST holdings. But this one “Banks, a small but growing lender in the triparty repo market, also did not increase lending over these few days.3 Increased uncertainty and the temporary nature of the rate spike likely contributed to banks’ reluctance to increase their lending of excess reserves” ~ human perception of risk!!! Plus they knew what was on their off balance sheet books with counterparty risk, did they extended margin to NBFI players? latent fragility turns into exploding tail risk!! What happens when 90% of passengers are on one side of the boat? latent fragility turns into exploding tail risk! I had to say that twice. Third time is the charm.
“latent fragility turns into exploding tail risk!”
Hemingway when asked “when did you go broke”…
“Gradually, then suddenly”
It all sounds like dedperate measures to delay a recession already baked into this mess.
They have failed to control inflation that matters to the average person and now it is worse now that the potus controls the fed.
It took 5% inflation over five years to bring asset prices to today’s lofty levels. How much inflation will it take to grow asset prices over the next five years?
They need to get inflation under control, now, not five or ten years from now, without concern about where asset prices land.
I suggest that inflation is well under control by the most incompetent Federal Reserve board in the 100 year history since it’s invention.
Bear, didnt you hear?
The Fed is cutting rates to help Main Street. (ha) Which is further excuse to pump assets and increase inflation, an inflation which is ruining people on Main Street.
I am not sure it’s done deal, tomorrow will be the most important Jolt report of the year, if we add 100k open jobs get to 7.3M opening and we get a delayed employment cost index on fed day, that’s going to pop higher than expectations. Ice is arresting people with jobs, jolt should be up tomorrow. The average number of continuing jobless claims in the United States from 1967 to 2024 was 2,753,690. The record low was 988,000 in May 1969, and the all-time high was 23,130,000 in May 2020., record low was during the peak of the war draft. Our job market is solid! We don’t need no inflationary cut this week. I am in 7% :)
Interest on reserves allows the Fed to short sell people’s bank accounts – during a crisis – to save the banks from themselves, during a RE plunge, or any other systemic collapse. It’s a defensive tool. To prevent a crisis a ACA enrollment cut + tariffs can reduce or eliminate income tax. Lower income tax + higher real wages ==> a booming econ.
In a booming economy nobody care about tariffs. Lower gov debt, the
want of the dollar will rise, but first [1M] SPX might go down.
Lower rates, during inflation, accelerate gov debt destruction.
Hmm. Reserve Balance managemnt. Sounds like code for QE.
No it doesn’t. It’s back to pre-2009, pre-QE balance sheet management, as I explained in the article. I even posted a chart (last one) to show how the Fed’s balance sheet was growing from 2003-2008, and how it was managing its balance sheet back then. The Fed’s balance sheet has always grown from day one, and roughly in line with economic growth. QE is different: it causes the balance sheet to grow far faster than economic growth.
“Back then, [the Fed] engaged in repos and purchased Treasury bills (mature in 1 year or less) to increase its assets and control short-term interest rates.”
“What gave total assets this jagged line were the repo transactions that varied dramatically from day to day, as the Fed attempted to actively manage short-term interest rates by adding or removing liquidity from the banking system via repos with its counterparties.”
The terms “control” and “actively managed” aren’t lost on me. The Fed wants to control short term rates, long term rates, and money supply. Really doesn’t seem like a free market in the slightest.
MC
Oh for a “journalist” to ask how controlling is part of a free market. I remember in the late 70s how the banks would raise their prime rates (or lower) on Fridays. The Fed seemed very much in the background. They didnt try to control the narrative or every tick, march out Governors to “say the right thing” at the “right time”, etc.
The Fed has become something very different over the decades, usually changing form with each “crisis”.
One can only suspect the Fed has changed at the direction of a few who benefit greatly from the alteration.
IMO
So, Wolf man, earlier today my brain had a ‘aha moment.’ I realized that the Chief Clown wants to cut $ Billions out of the government interest payments, realizing it’s going to hammer us little people even harder (more inflation). Hold on, folks.
Wants to and can are not the same.
You seem to be a refugee from a time when productivity gains in the standard of living accrued to the worker, the propaganda version of America as opposed to the reality.
The standard of living has increased vastly over any 20 year time period – it hasn’t kept pace with productivity gains since 1972 (when you are unrestrained in your money printing that happens) but now is the best time to be a US worker as compared to any other time.
Whats it all mean? Tell me in one sentence.
The Twitter generation?
Something is going to happen.
Wolf,
Looking at that Reserve Balances at the Fed chart, it seems pretty clear that the spikes upward are directly related to “Quantitative Easing” events (formerly known as money printing).
That is, Fed prints money => Banks end up with excess balances they can’t safely put to work in private lending markets.
But how about the downward movements of the Reserve Balances (sharpest in 2018, 2019, and 2022) – what Fed events (and others) are they correlated with?
In general (perhaps mistakenly) I view the RBatF levels as indicative of Fed money injected into the banking system that the various banks cannot really find particularly good lending opportunities/securities purchase opportunities for – so the banks leave these idle reserve balances at the Fed to earn the risk free IORB.
in 2018 and 2019, the RB at Fed fell faster. The only major macro event I remember was the Fed gradually raising rates…presumably by withdrawing liquidity (money) from the banking system.
But it isn’t like the Fed simply takes various banks’ RB on deposit (I don’t think) so what is the actual pathway from a) the Fed wanting to generically “tighten” to b) RB at Fed actually going down.
Ditto 2022, with even more dramatic correlation of Fed tightening (desire for increased interest rates) to the rapid fall of banks’ RB at Fed.
What intermediate steps occur (in which markets) for this correlation to occur?
As with a *lot* of Fed operations, the detailed mechanics seem pretty fuzzy and not widely talked about (other than maybe at WolfStreet).
You may have explained this in some form (Fed balance sheet rolloffs somehow causing drawdown of IORB-earning reserve balances?) but not in the context of Fed Reserve Balances.
I discussed this in the article: liquidity shifts between reserves, ON RRPs, and the TGA. At the end of QE and early on during QT there was a massive shift from reserves to ON RRPs. The TGA can be a real issue during the debt ceiling and afterwards, and during government shutdowns, when the government doesn’t disburse the funds in the TGA, and thereby keeps those funds from entering the reserves.