Despite all moaning and groaning and sour feelings in consumer land, credit card delinquency rates improved further.
By Wolf Richter for WOLF STREET.
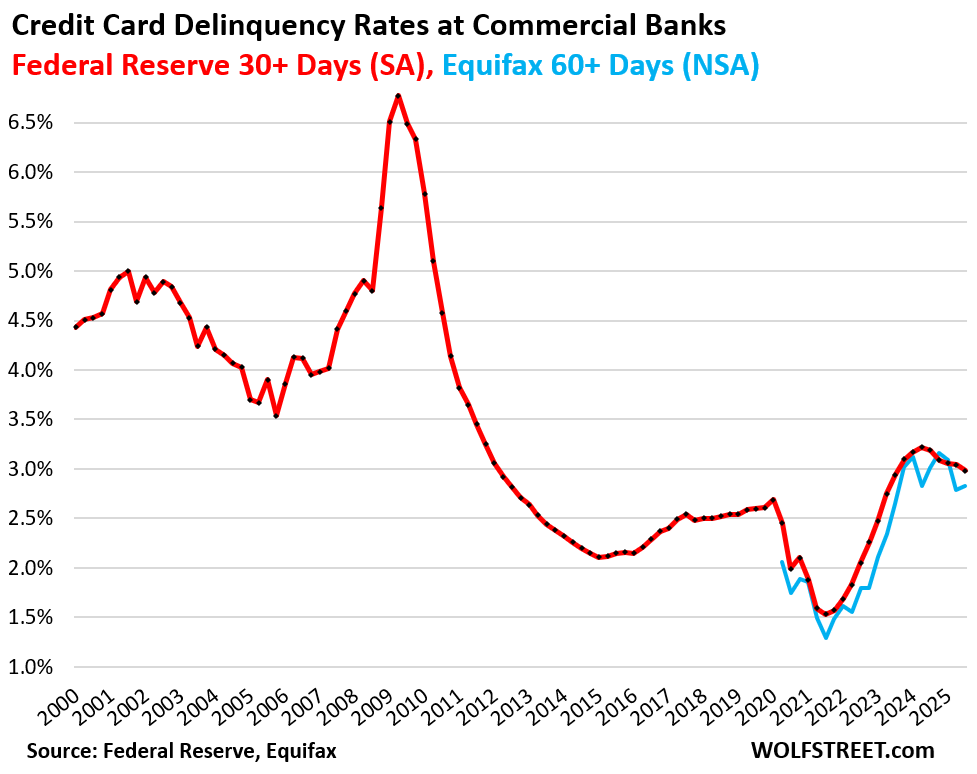
During the Free-Money era, credit card delinquency rates had dropped to very low levels, and then, as the Free-Money era ended, they rose out of the trough and then overshot, which peaked in early 2024, and since then they’ve headed lower again.
The 30-day-plus delinquency rate on credit cards issued by all commercial banks declined to 2.98% at the end of Q3, seasonally adjusted (SA), the lowest since Q2 2023, and down from 3.19% a year ago, according to the Federal Reserve today, based on data from commercial banks (red in the chart). This includes credit cards by subprime-rated cardholders.
The 60-day-plus delinquency rate for all bankcards, including subprime, not seasonally adjusted (NSA), edged down year-over-year to 3.02% (from 3.23% in Q3 2024), per Equifax (blue in the chart).
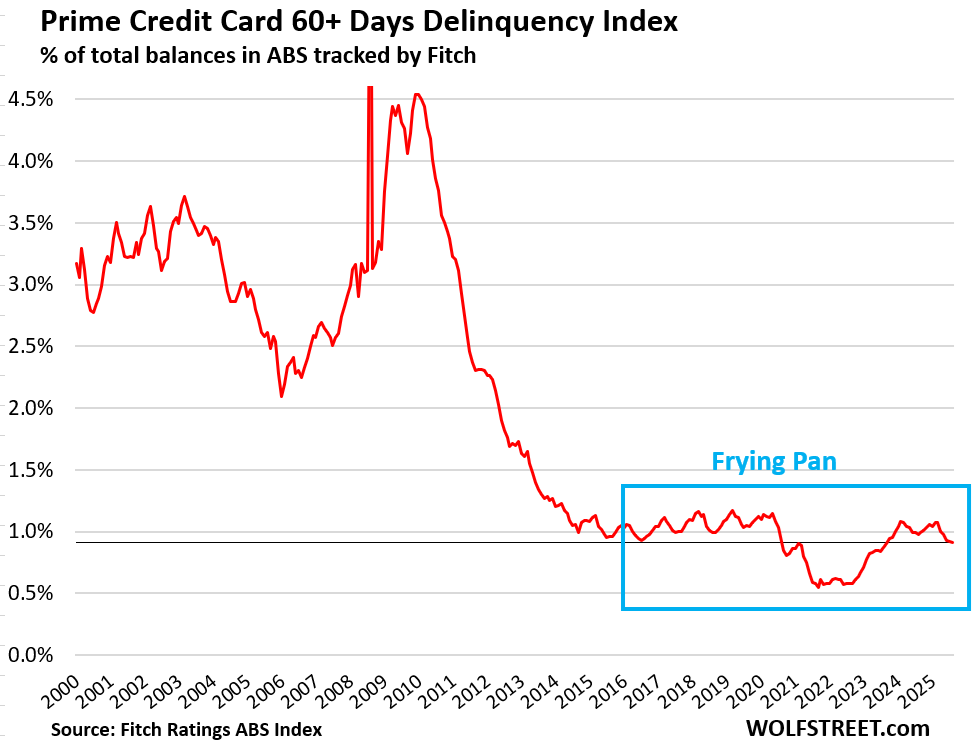
For prime-rated cardholders, the serious delinquency rate of 60-plus days dropped to 0.91%, the lowest on record outside of the Free-Money era, according to data from Fitch Ratings, which tracks the performance of Asset Backed Securities (ABS) backed by credit card balances whose holders had a prime credit rating when the accounts were opened.
The “frying pan” pattern, as we have come to call this phenomenon, shows how delinquency rates declined during the Free-Money era, and then reverted to just-below pre-pandemic levels, forming this frying pan figure that we have seen crop up in many delinquency, default, and foreclosure charts.
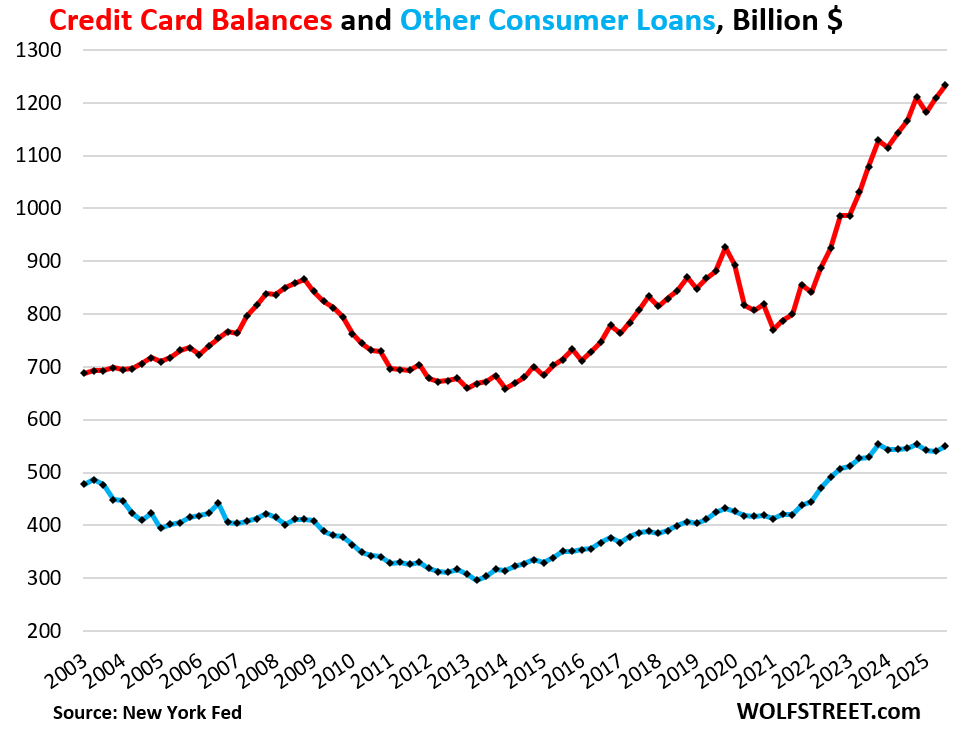
Credit card balances: a measure of spending, not of borrowing.
Credit card balances (red line in the chart below) rose by $67 billion year-over-year, or by 5.7%, in Q3, to $1.23 trillion, on growth in consumer spending and price increases (data from the New York Fed’s Household Debt and Credit report).
Credit card balances are a measure of spending, not a measure of borrowing. Credit card balances are statement balances before payments are made. They reflect the fact that credit cards have become the dominant consumer payments method in the US and largely replaced checks and cash. Debit cards are the second most popular payment method. Credit cards are used to pay for anything, from smart parking meters to business trips (hotels, airfares, meals, etc.) for which cardholders get reimbursed from their corporate or government employers. Roughly $6 trillion a year are run through credit cards. Most of these balances get paid off every month by due date and never accrue interest.
So what we’re looking at here is increased spending, including through higher prices, and not increased borrowing. These month-end credit card balances do not reveal the amounts that are accruing interest and would represent actual borrowing.
“Other” consumer loans (blue line), such as personal loans, Buy-Now-Pay-Later (BNPL) loans, and payday loans, inched up a hair year-over-year (+0.7%), far less than the rate of inflation, to $550 billion. Balances have barely risen over the past 22 years, despite the growth of the population, income, and spending over the period.
How much of a burden?
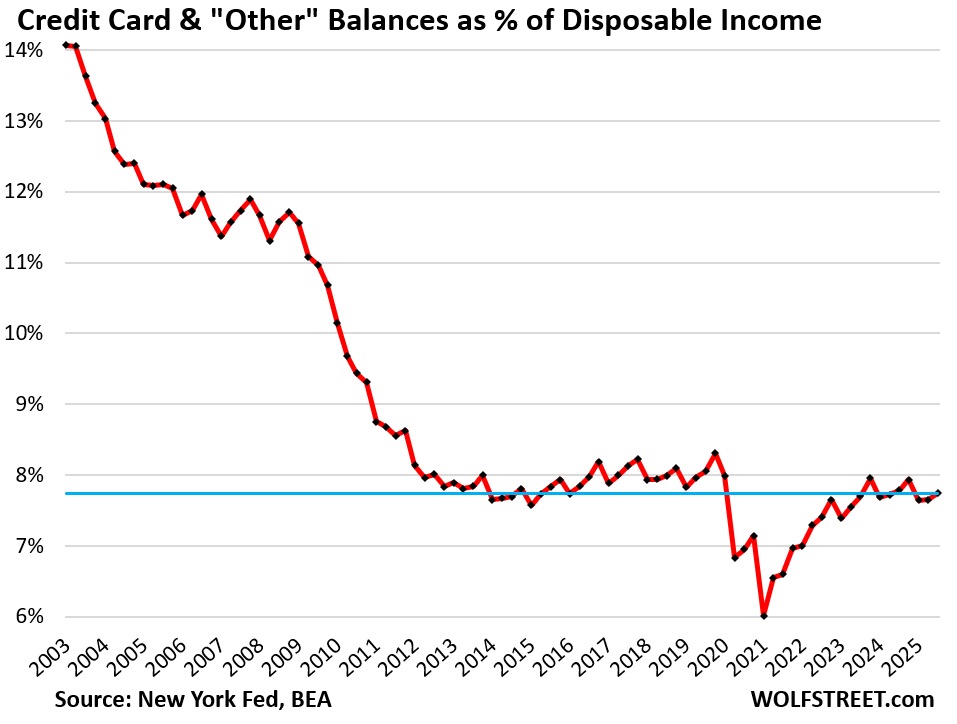
Combined, credit card balances (red in the chart above) and “other” consumer debt (blue above) rose year-over-year by $71 billion, or by 4.1%, to $1.78 trillion.
Debt-to-income ratios are classic measures of borrowers’ ability to deal with the burden of their debt. They track the amount of the debt outstanding, compared to income.
For consumers, a good income measure is disposable income, released by the Bureau of Economic Analysis. It is household income from all sources except capital gains – so from wages and salaries, interest, dividends, rentals, farm income, small business income, transfer payments from the government, etc. – minus withholding and estimated taxes. Disposable income is essentially what consumers have available to spend on goods and services, and to service their debts.
Due to the government shutdown, the BEA has not yet released disposable income for September. So I used the data for July and August and estimated September based on average growth year-to-date.
The ratio of credit card and other consumer loan balances to disposable income inched down year-over-year to 7.7%, as disposable income rose slightly faster (+4.7% year-over-year) than the combined balances of credit cards and “other” consumer loans (+4.1%).
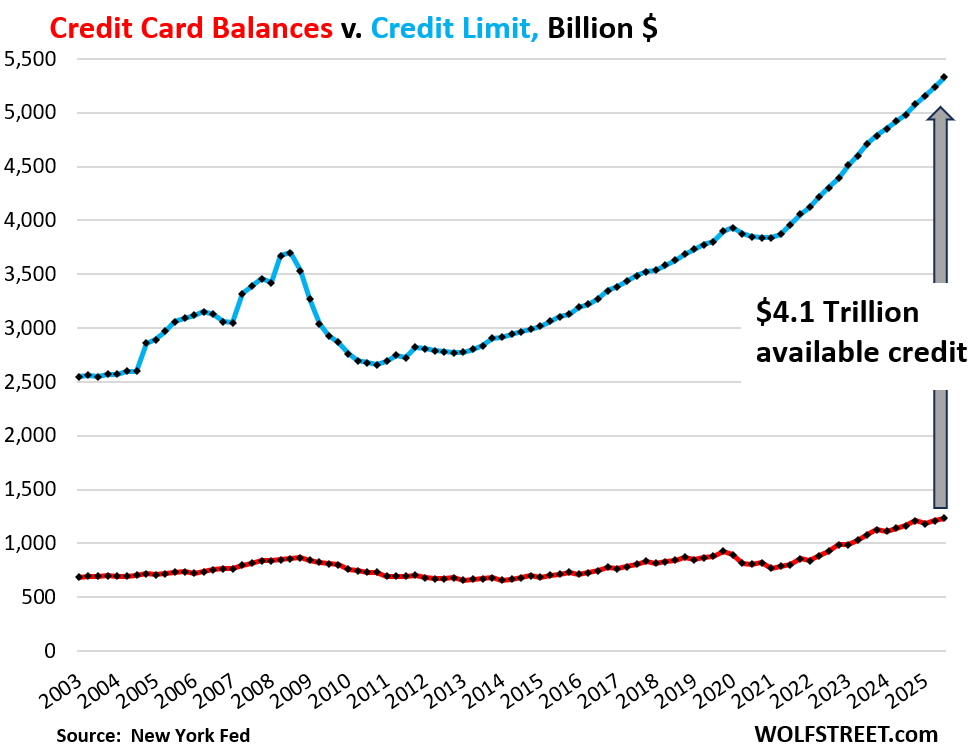
Credit Limits & Available Credit.
Swipe fees are a profit center for banks. Those are the percentage fees that banks collect each time one of their cards is used for a purchase. So banks are trying aggressively to get people to set up new credit card accounts, and they incentivize consumers to use those cards by kicking back 1% or 2% or more (cash back, loyalty points, miles, etc.) of the amounts spent on the card.
They also raised credit limits of existing accounts, and the aggregate credit limit (blue in the chart below), now at $5.3 trillion, has grown far faster than outstanding balances (red).
And thereby the total available unused credit rose to a record $4.1 trillion (gray arrow).
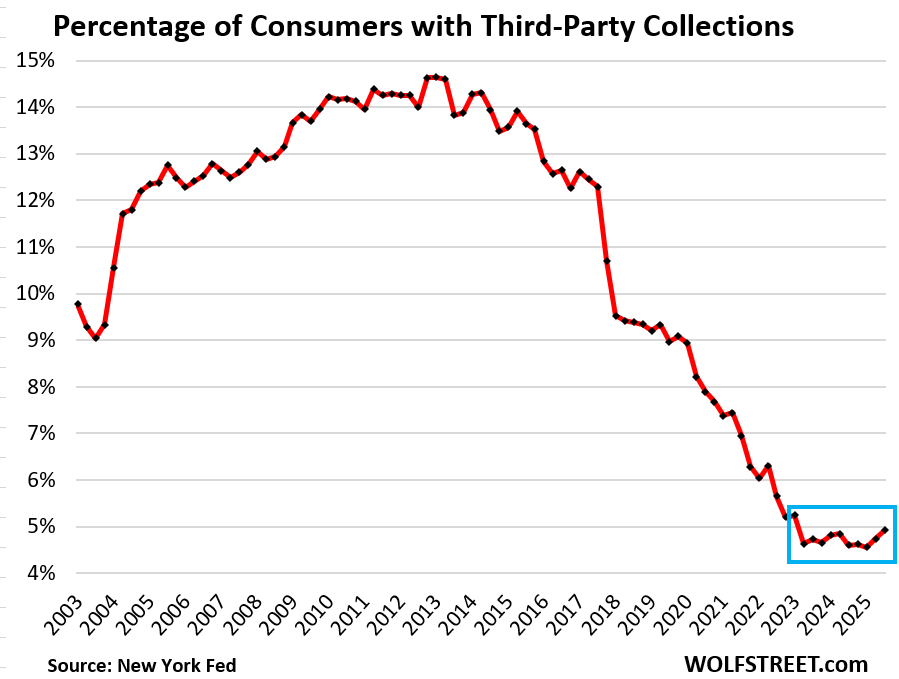
Third-party collections.
The percentage of consumers with third-party collections – where defaulted credit card & other credit balances can end up – remains at historic lows, having dropped from over 14% a decade ago, to 4.9% in Q3.
A third-party collection entry is made into a consumer’s credit history when the lender reports to the credit bureaus, such as Equifax, that it sold the delinquent loan, such as credit card debt, to a collection agency for cents on the dollar. The New York Fed obtained this data on third-party collections in anonymized form through its partnership with Equifax.
This rounds off my four-part quarterly analysis of consumer debt and credit. And in case you missed the reports on auto loans, mortgage and HELOC debts, and overall consumer debt, including student loans and bankruptcies:
Enjoy reading WOLF STREET and want to support it? You can donate. I appreciate it immensely. Click on the mug to find out how:

![]()
Thanks Wolf for the interesting and beautifully presented data as always. So if I look at the other 3 parts of the series, I see:
* Household debt (and mortgage debt as a subset) as % of income best in 20 years
* Auto and student loan debt not fantastic but not terrible
* Delinquencies, foreclosures, collections etc also look great
So it seems like the median consumer is doing perfectly fine. Why is sentiment so poor then? Are people still angry about inflation even though it’s been sub-4% for 2 years?
It also makes me disappointed in all the recession fear-mongering that happens on the wider internet. Don’t see any case for it, at least with these charts.
“Why is sentiment so poor then? Are people still angry about inflation even though it’s been sub-4% for 2 years?”
Yes. Americans hate, hate, hate inflation and high prices. We’ve had lots of inflation ( = “rate of change”) in 2021 and 2022, and prices rose to very high levels ( = “price levels”), and it pissed people off, and then prices continued to rise from those already high levels, but at a slower pace. Even smaller and less frequent price increases (rate of change) on top of high prices (price levels) piss everyone off, including me.
But consumers keep buying and keep paying those prices, which is why prices keep going up. “Pissed off” for Americans doesn’t mean “curtail spending.” Americans don’t cut spending until they have to, and now they don’t have to; they’re employed and making money and have gotten the biggest raises in 40 years.
My guess is the ‘have nots’ are let’s say 25% of the population. That is still 70 million people making a lot of noise on social media. Then you have the ‘haves’ that are happy to piggyback off the misery of the less fortunate to create social media content and click bait. That is a lot of negative sentiment floating around. I could be completely wrong.
Wall street used NVDA as a lever to breach Oct 10 and Sept 17 lows. Thereafter they sprang above. Option #1: a short covering. Option #2: 7K+ in Jan/Feb, before a major correction in Q1 and Q2 2026. Option #3: IWM is backing up, before rising for years.