Federal and state governments cut 122,000 employees this year through September. But other industries hired.
By Wolf Richter for WOLF STREET.
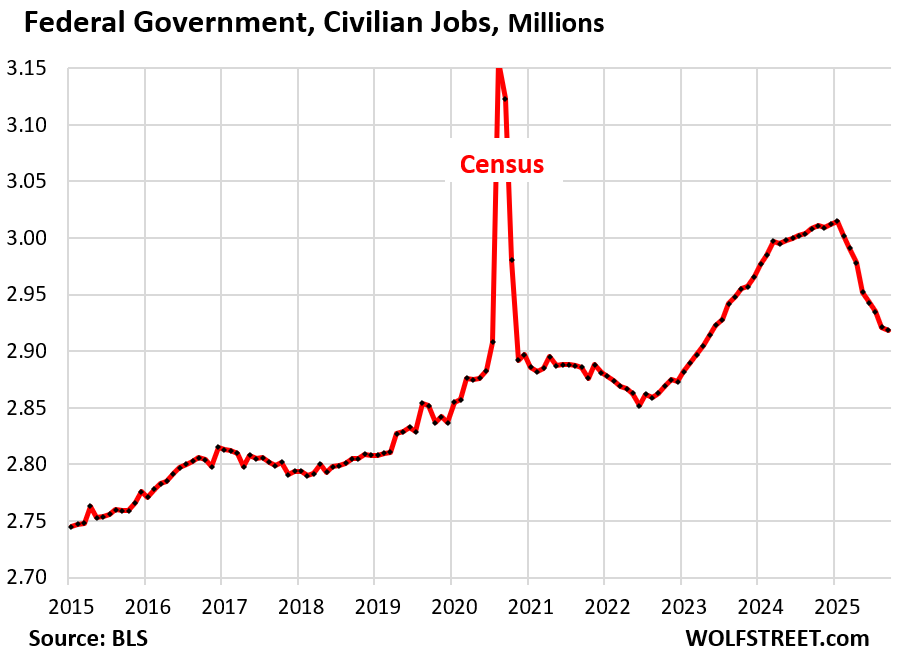
The headcount reduction by the federal government reached 97,000 since January, including a further reduction of 3,000 civilian employees in September, according to the nonfarm payroll report for September, released today by the Bureau of Labor Statistics.
But this does not yet include the roughly 100,000 civilian employees of the federal government that took the voluntary “deferred resignation” deal in the spring under which they got paid through September 30. Since they were still on the payrolls in September, but came off the payrolls on October 1, that reduction will hit the next nonfarm payrolls report, which will be for November, the October report having been cancelled due to the government shutdown.
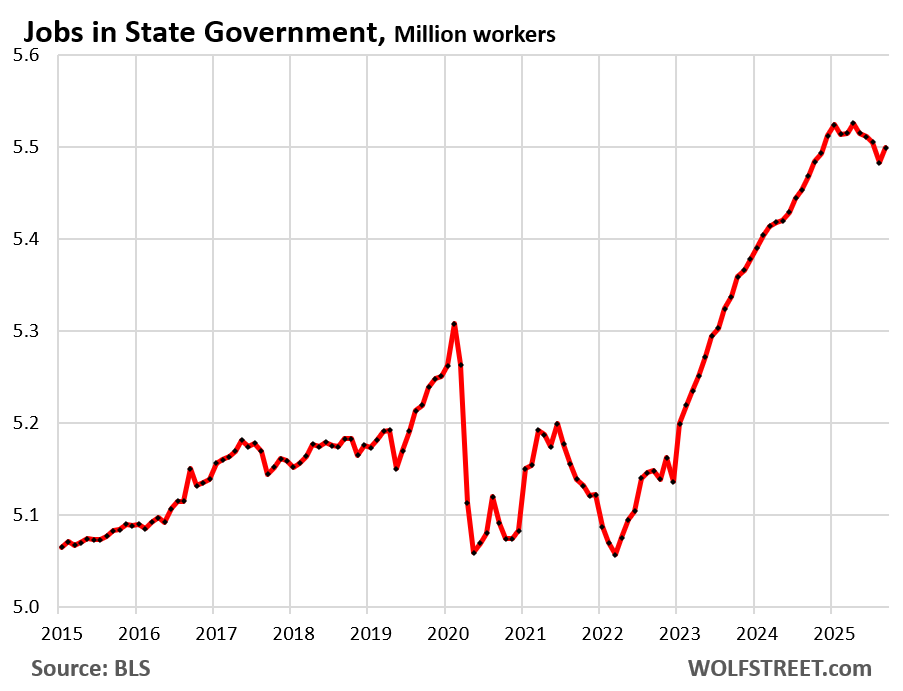
State governments have shed 25,000 employees since January, including September’s increase of 16,000 (through August, they had shed 41,000 employees).
Government payrolls don’t include workers at government contractors. They’re in private-sector categories, such as in “Professional and business services,” and we have seen some declines there this year, though it is impossible to determine what portion is due to government cutbacks.
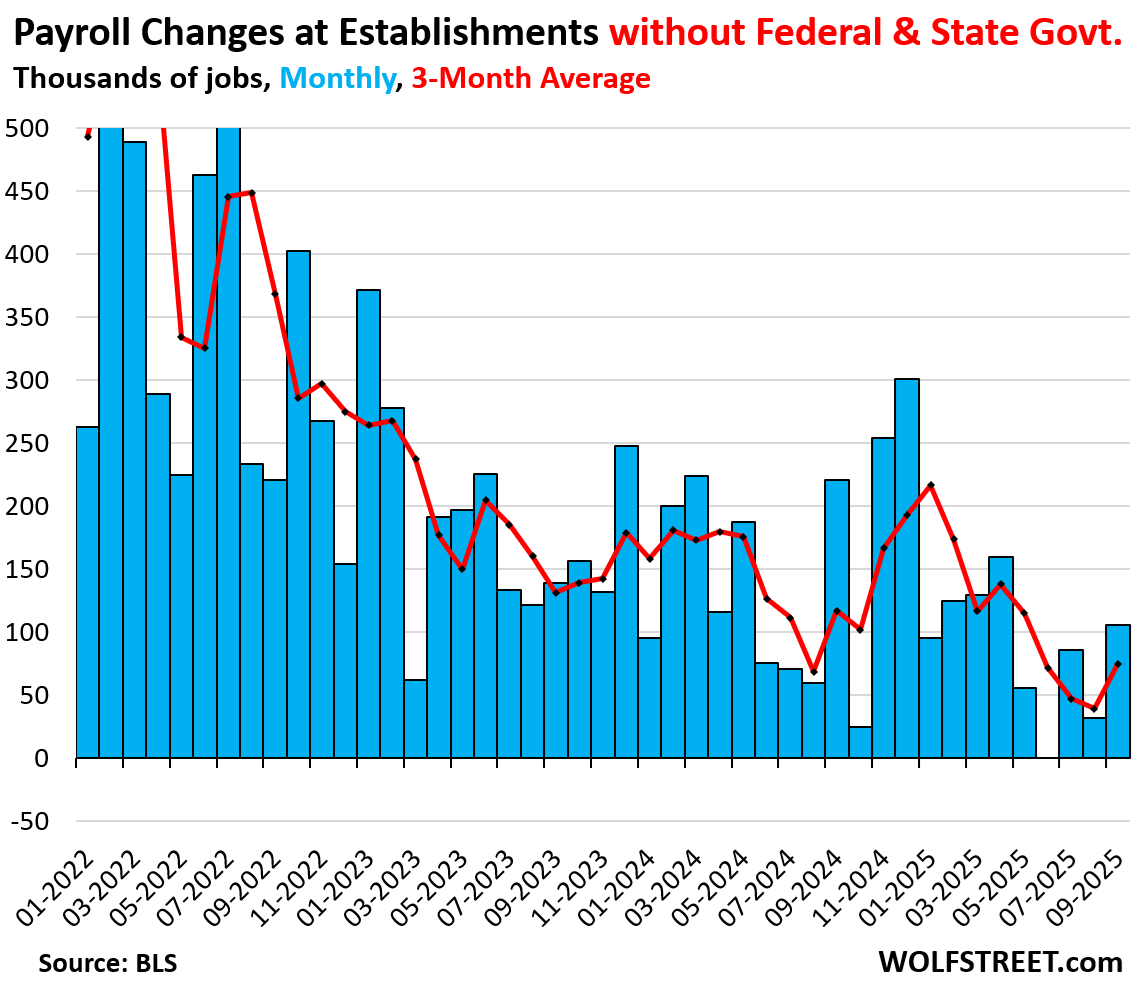
So, nonfarm payrolls without federal and state governments rose by 106,000 jobs in September from August. In June, there was zero job growth, and the trend has bounced back since then (blue columns in the chart).
Over the past three months, this measure rose by 161,000 jobs. The 3-month average, which irons out the month-to-month squiggles, rose by 54,000 jobs (red line).
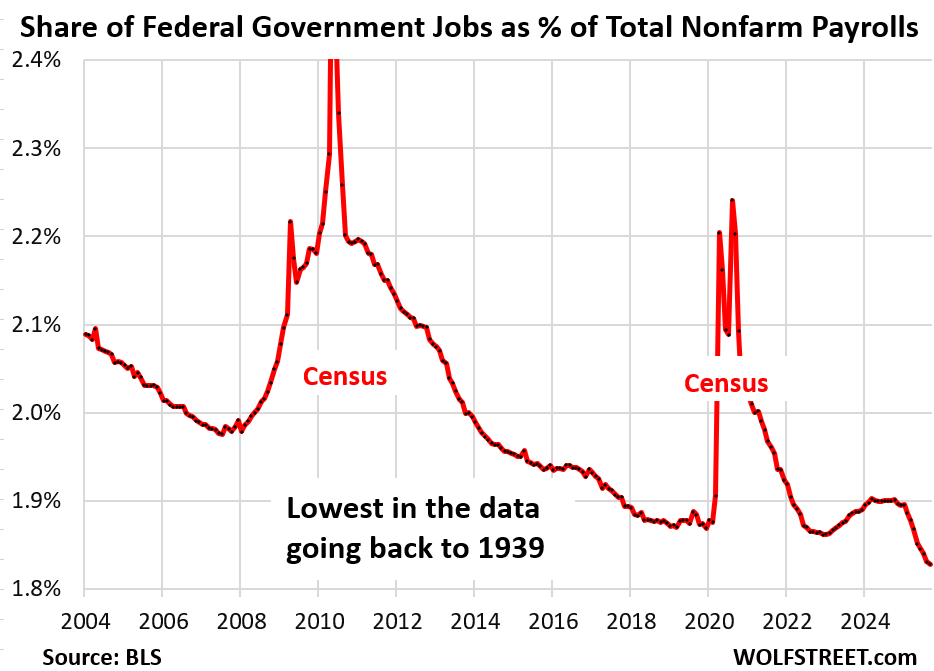
Civilian employment at the federal government dropped by 3,000 in September, to 2.92 million, taking employment back to where it had been in June 2023.
The share of federal employment dropped to 1.82% of total employment, the lowest in the data going back to 1939.
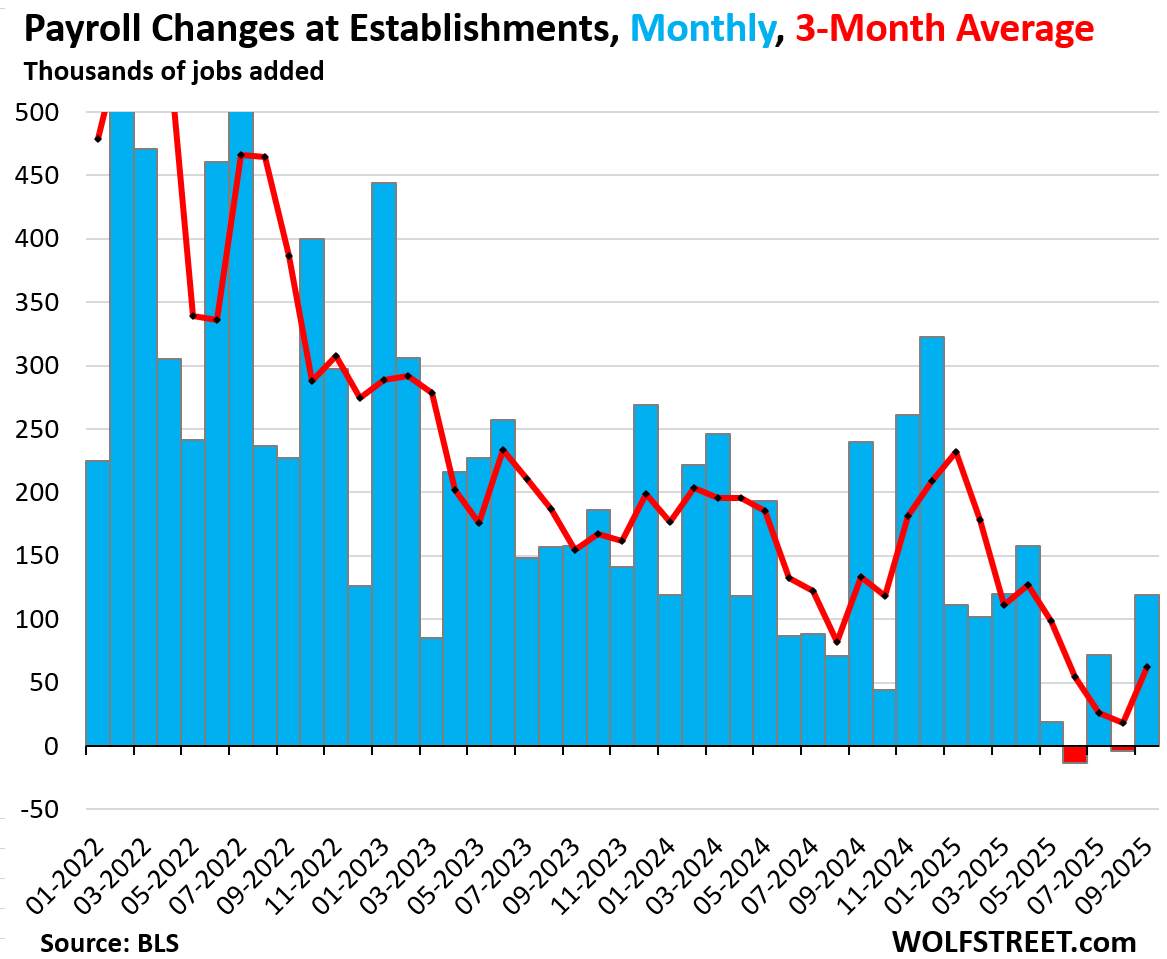
Total nonfarm payrolls rose by 119,000 in September from August, to 159.6 million. July and August were revised down by a combined 33,000 jobs.
Over the past three months combined, 187,000 jobs were added to payrolls, even as the federal government shed 25,000 jobs over the three months, and state governments shed 12,000 jobs. The 3-month average rose to 62,000 jobs (red line).
The government shutdown in October didn’t impact the data collection for this September report – it only delayed it. But it killed the October report. October figures will be included in the November report, according to the BLS, which also explained today:
“September estimates from the establishment survey include both data collected on our normal schedule prior to the shutdown and also September data that businesses self-reported electronically during the shutdown. As a result, the establishment survey collection rate (80.2 percent) for this initial release of September 2025 data is higher than usual.”
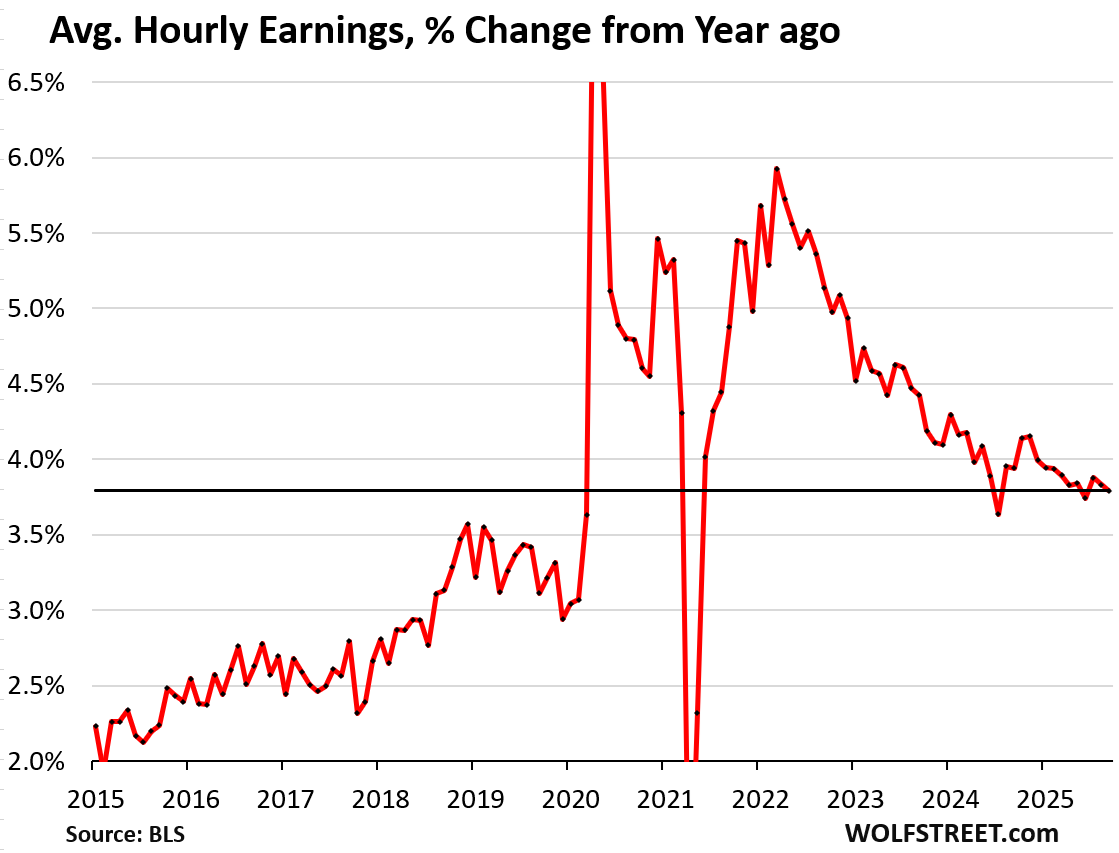
Average hourly earnings rose by 0.25% in September from August (+3.0% annualized. The three-month average hourly earnings rose by 4.0% annualized, a slight acceleration. The three-month average has zigzagged since April.
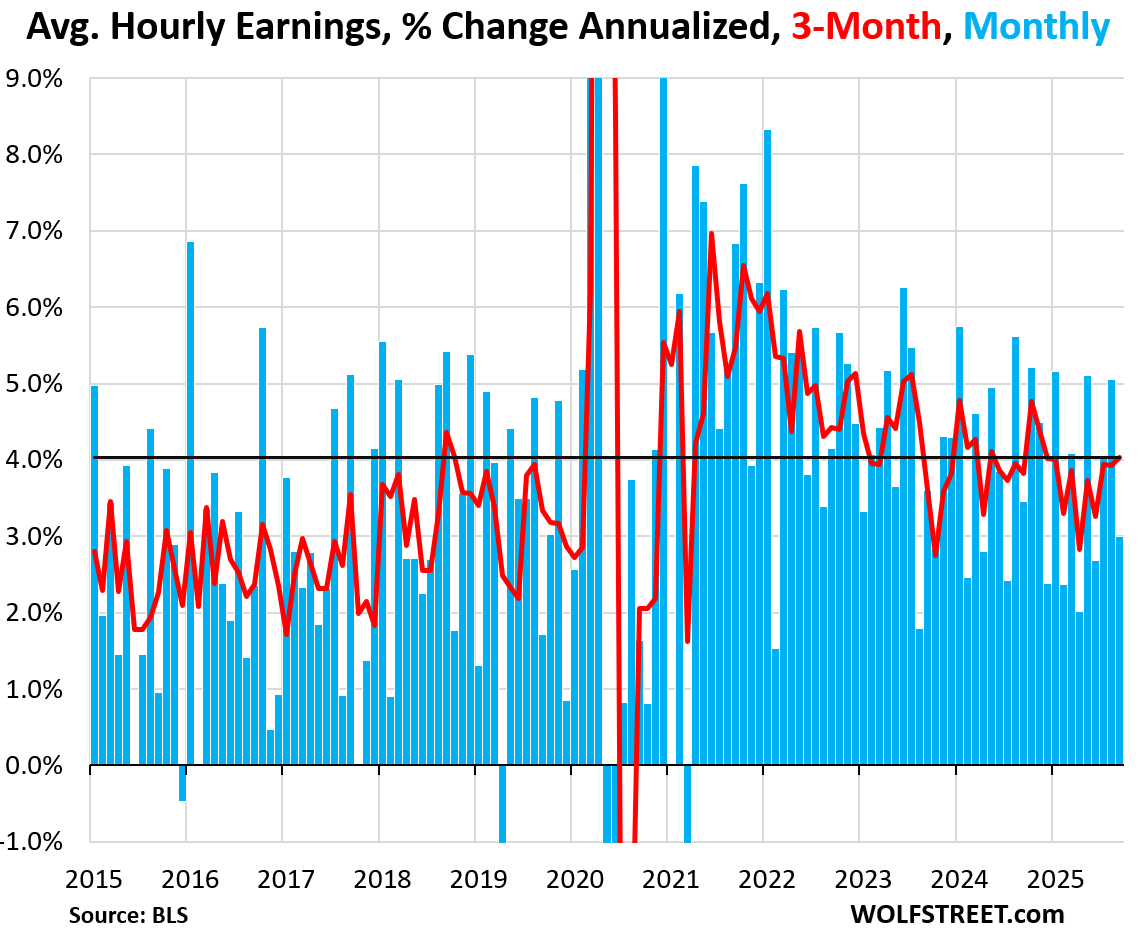
Year-over-year, average hourly earnings rose by 3.8% in September, a slight deceleration from the prior two months, but well above the wage growth before the pandemic.
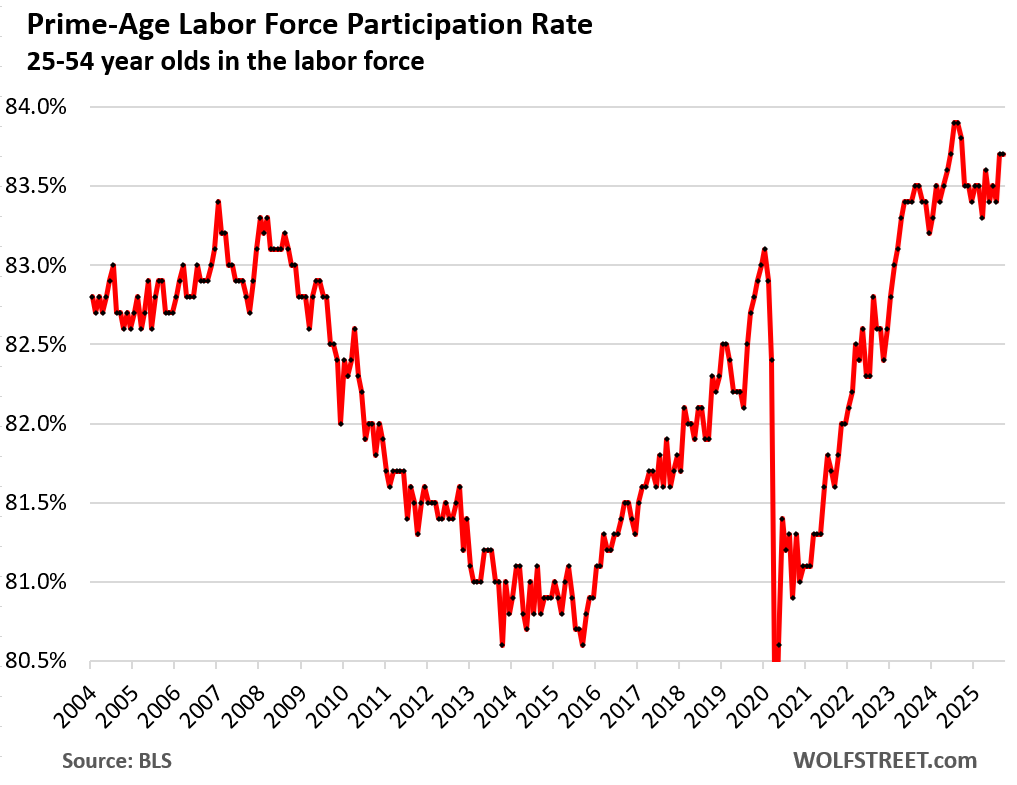
The prime-age labor force participation rate (25-to-54-year-olds) remained at 83.7% in September, same as August, which is historically high.
The labor force participation rate shows the percentage of the population that either has a job or is looking for a job. When people retire and stop looking for a job, they exit the labor force but remain in the population until they die. The surge of boomer retirements, which started about 15 years ago and continues, has pushed down the overall labor force participation rate, as these retired boomers are still in the population but no longer in the labor force. The prime-age labor force participation rate eliminates the issue of the retiring boomers.
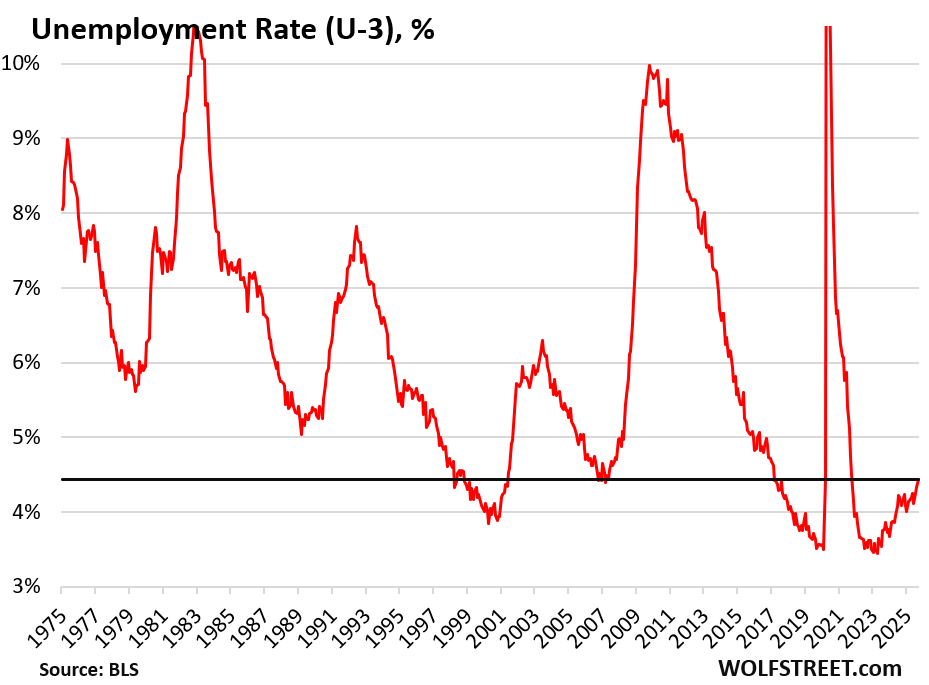
The unemployment rate (U-3) rose to 4.4% in September, still historically low, but quite a bit higher than it had been in recent years.
This is in line with the Fed’s projections. In its last “Summary of Economic Projections” (SEP), released at the September meeting, the Fed projected the unemployment rate to reach 4.5% by the end of 2025. This rising unemployment rate has been among the causes for the Fed’s labor market concerns and rate cuts, despite accelerating inflation and “solid” economic growth through Q3.
The unemployment rate reflects the number of unemployed people who are actively looking for a job divided by the labor force (people working or looking for a job).
Jobs by Major Industry over time.
The jobs in each industry are defined by work location. The primary activity at that facility determines the industry category. For example, a worker at an Amazon fulfillment center would be under “transportation and warehousing,” not “retail.” It’s not the company that matters, but the work being done at that specific location.
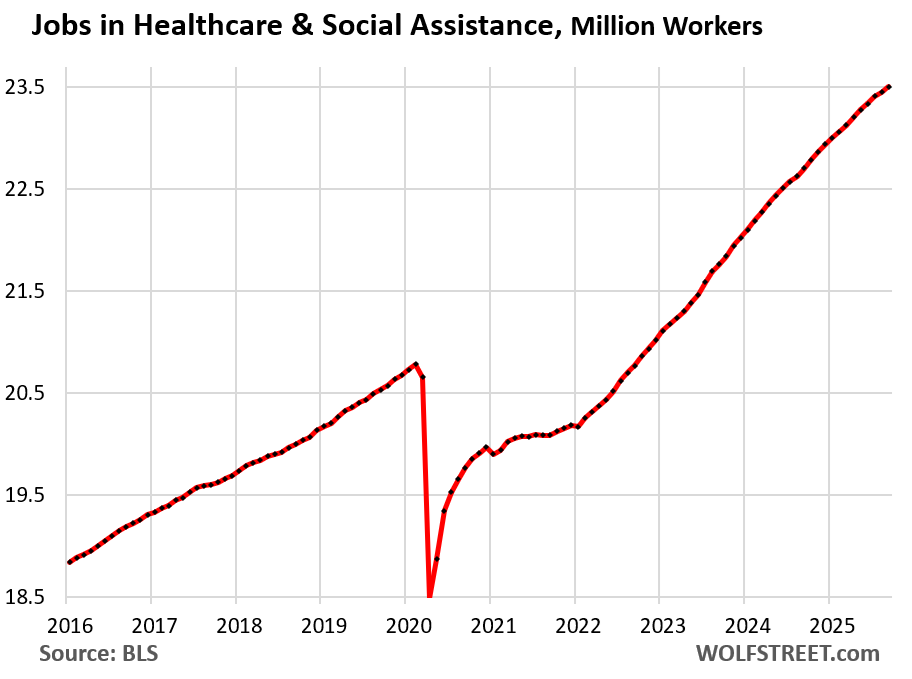
Healthcare and social assistance:
- Total employment: 23.5 million.
- 3-month average growth: +56,000
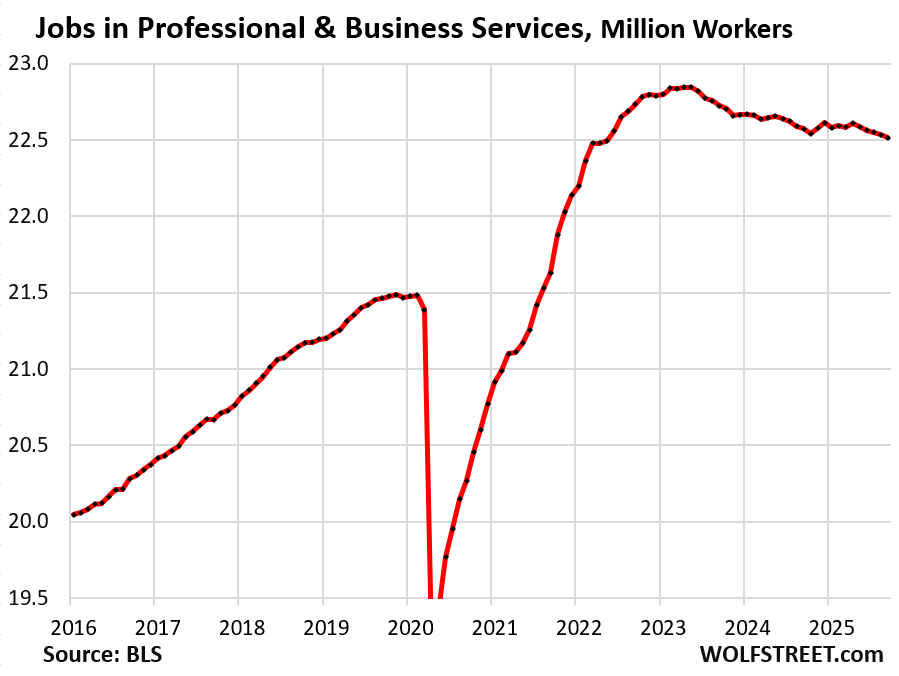
Professional and business services: includes facilities whose employees work primarily in Professional, Scientific, and Technical Services; Management of Companies and Enterprises; Administrative and Support, and Waste Management and Remediation Services.
It includes jobs in tech and social media.
The increasing use of AI, which started years ago, has also been fingered as one of the reasons for the reductions in employment.
The explosion of employment in 2021 and 2022 turned out to be over-hiring. Companies then came to their senses and began shedding the excess they’d added over those years.
- Total employment: 22.5 million
- 3-month average change: -17,000
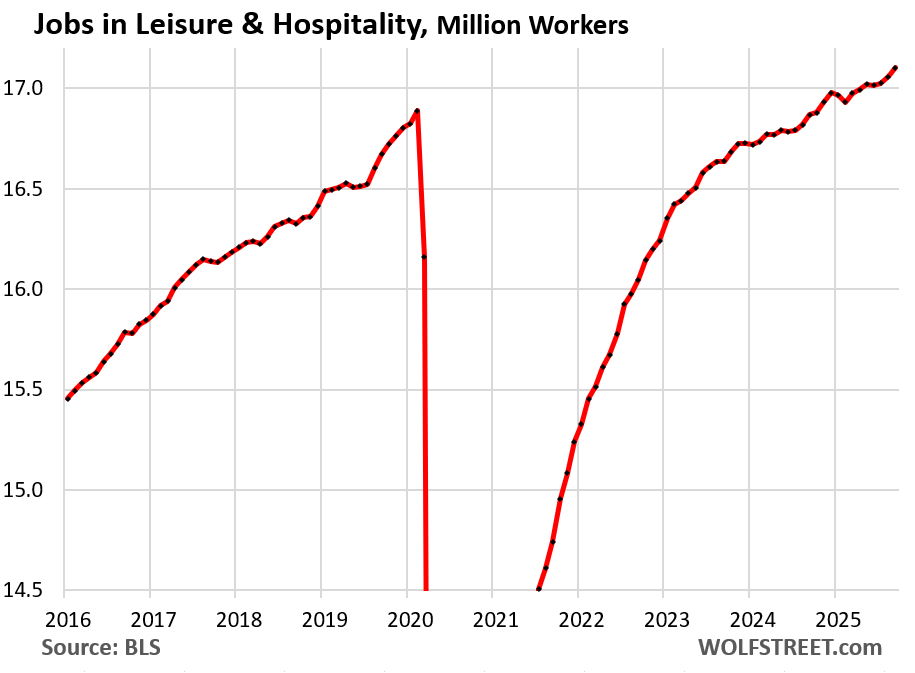
Leisure and hospitality – restaurants, lodging, resorts, etc. After the collapse of employment during the lockdowns, the industry’s employment has fully recovered and has continued to grow:
- Total employment: 17.1 million, new record.
- 3-month average growth: +29,000
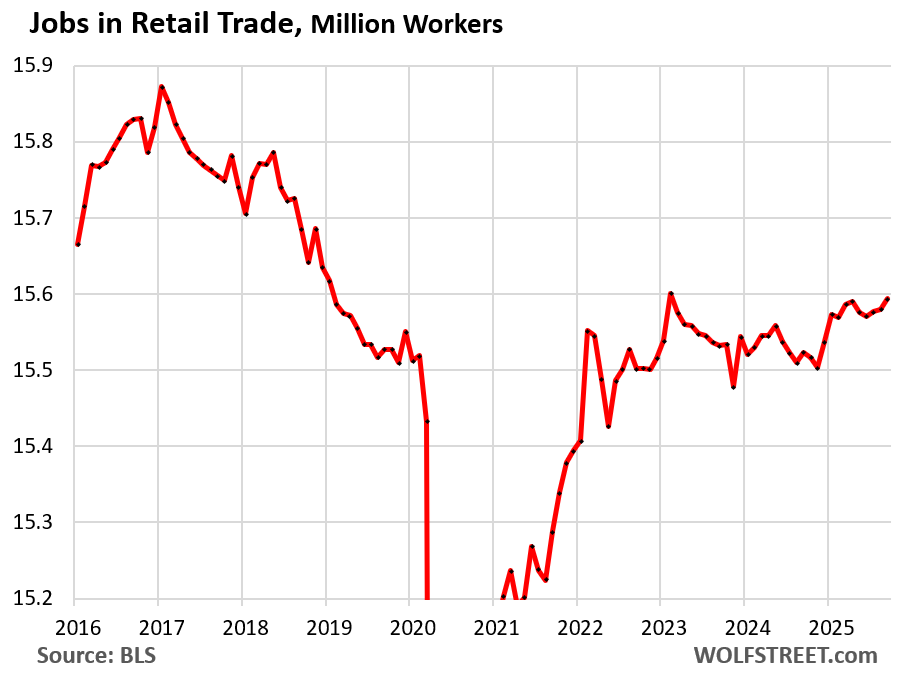
Retail trade includes workers at brick-and-mortar retail stores, such as malls, auto dealers, grocery stores, gas stations, etc., and other retail locations such as markets. It does not include the tech-related jobs of ecommerce operations, drivers, and warehouse employees.
A big portion of this sector has been under pressure from ecommerce, and dozens of major retailers have been liquidated in bankruptcy court, some of which we have documented since 2016 in our Brick-and-Mortar Meltdown series. The long-term decline in employment began in 2017, driven by employment at malls, with malls themselves turning into zombie malls around the country.
The brick-and-mortar retailers that are doing well are those that are selling groceries, motor vehicles, gasoline, and other products that are under less pressure from ecommerce.
- Total employment: 15.6 million
- 3-month average growth: +8,000.
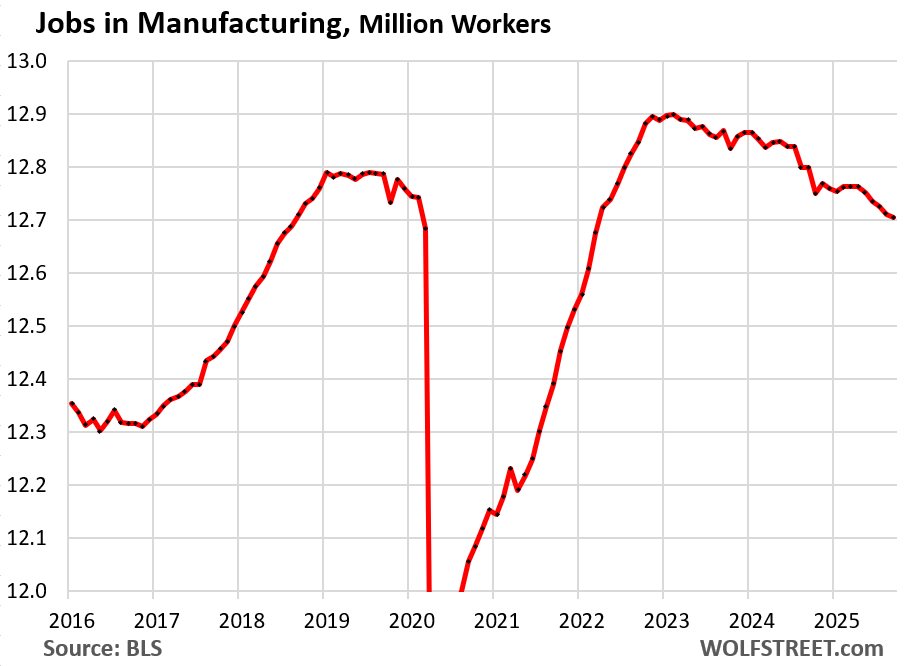
Manufacturing: Automation is key and drives manufacturing in the US. Companies are investing lots of money to push automation to the next level. Automation replaces lots of human labor doing repetitive manual work. Manufacturing jobs of today often require high skill levels and include tech jobs.
- Total employment: 12.7 million
- 3-month average growth: -10,000
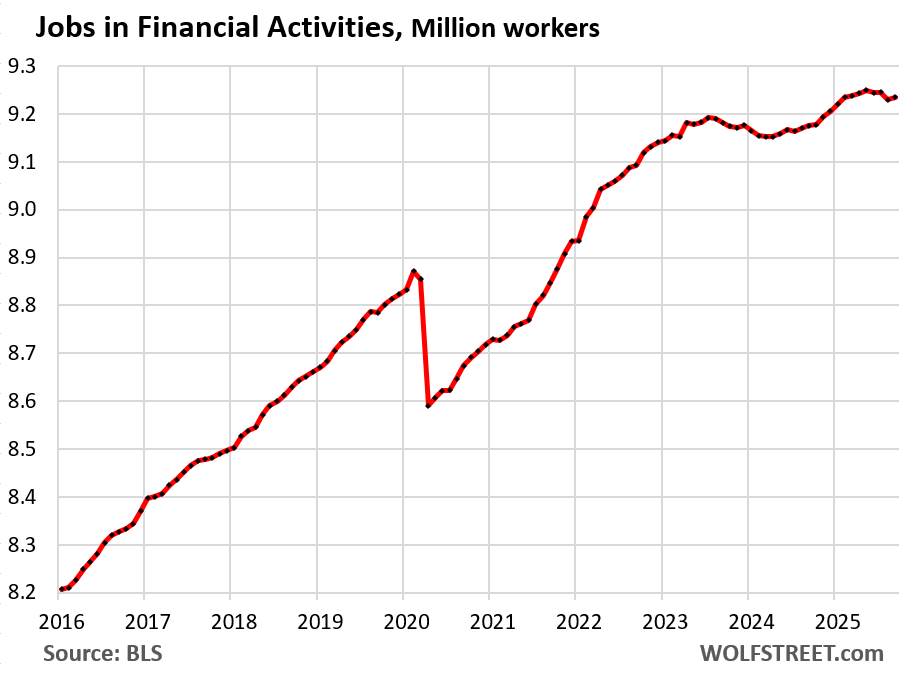
Financial activities (finance and insurance plus real estate renting, leasing, buying, selling, and management).
With home sales down by 25% for three years, and mortgage originations down by even more, a large number of real estate agents have exited, as have employees at mortgage lenders and mortgage brokers. We can see that here.
- Total employment: 9.2 million, new record
- 3-month average change: -3,000
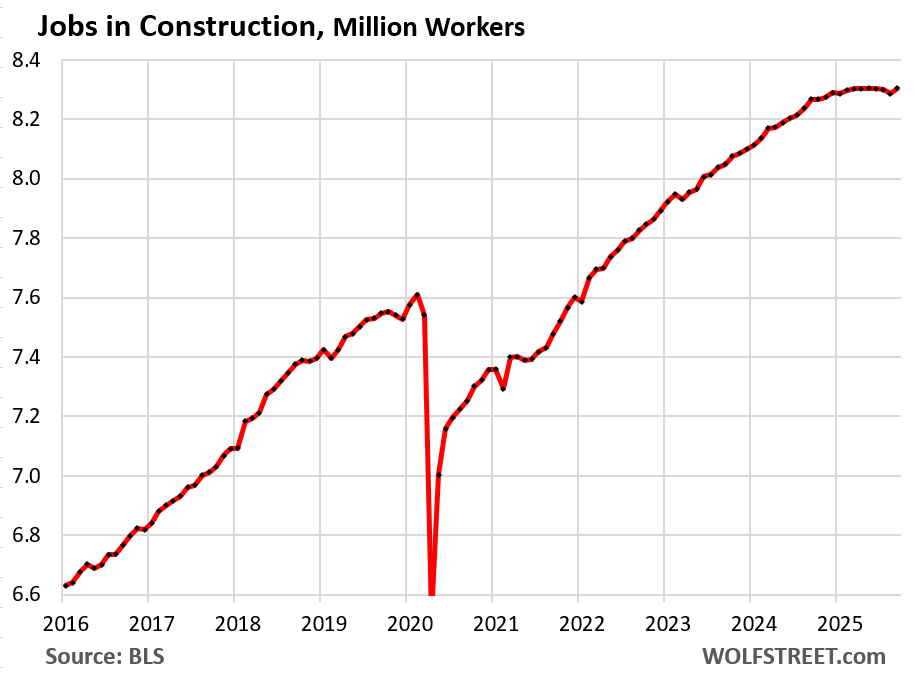
Construction (all types, from single-family housing to highways). Construction in the housing sector and the office has been hit by lack of demand. But construction in other sectors has been stronger, and construction of data centers, factories, and power plants has been booming amid complaints of shortages of skilled labor.
- Total employment: 8.31 million
- 3-month average growth: +1,000
Transportation and Warehousing:
- Total employment: 6.7 million
- 3-month average growth: +1,000
![]()
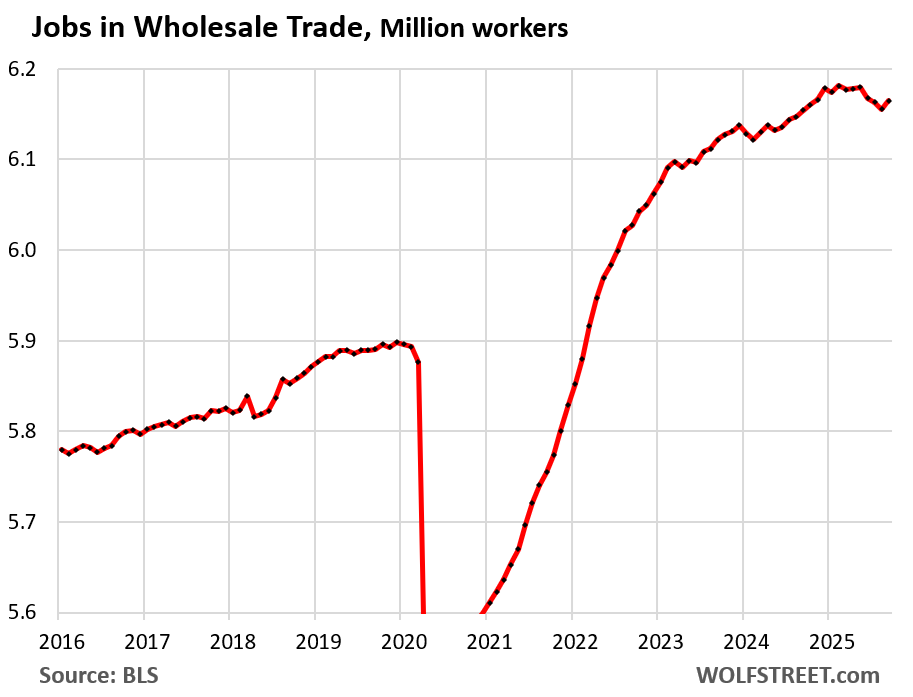
Wholesale Trade:
- Total employment: 6.2 million.
- 3-month average growth: -1,000
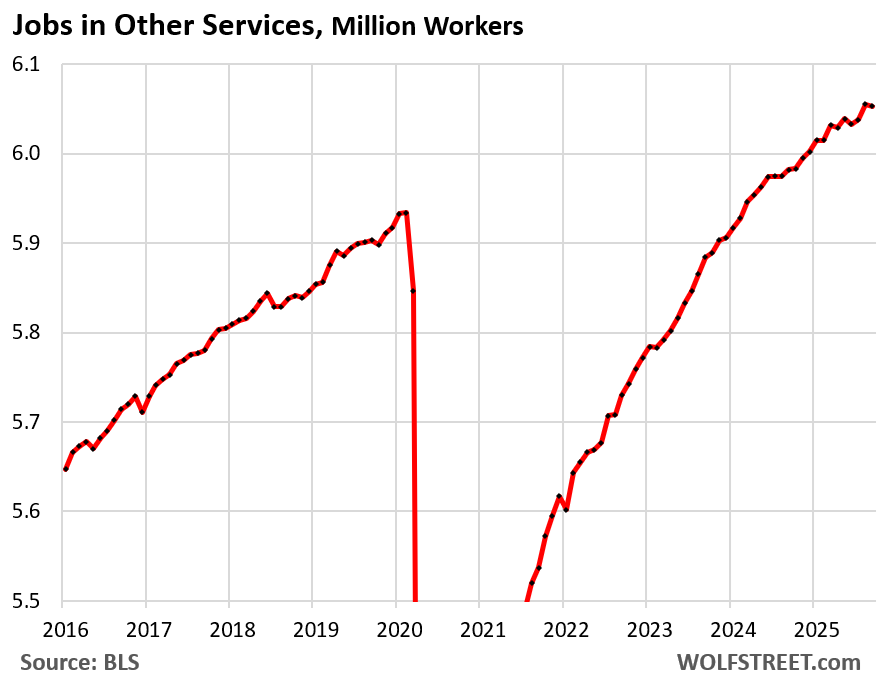
“Other services”: includes equipment and machinery repairing, promoting or administering religious activities, grantmaking, advocacy, drycleaning, laundry services, personal care services, death care services, pet care services, photofinishing services, temporary parking services, and dating services.
- Total employment: 6.05 million
- 3-month average growth: +7,000
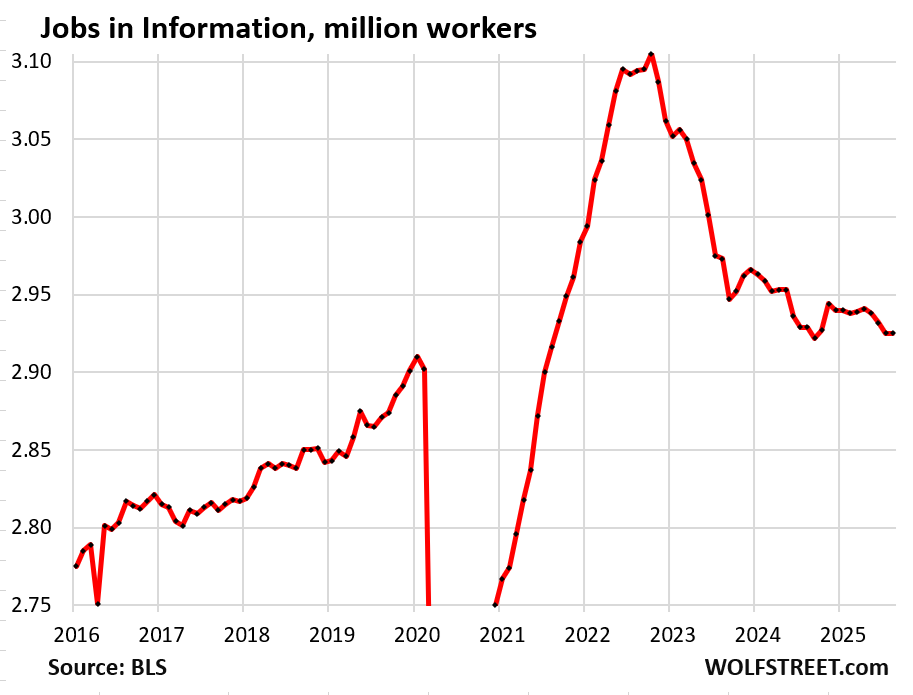
“Information” includes facilities where people primarily work on web search portals, data processing, data transmission, information services, software publishing, motion picture and sound recording, broadcasting including over the Internet, and telecommunications.
This includes work sites by tech and social media companies that had gone on an over-hiring binge during the pandemic, and they have admitted it, and they have reversed course.
And AI has had a profound impact in these sectors for years.
- Total employment: 2.93 million
- 3-month average growth: -4,000
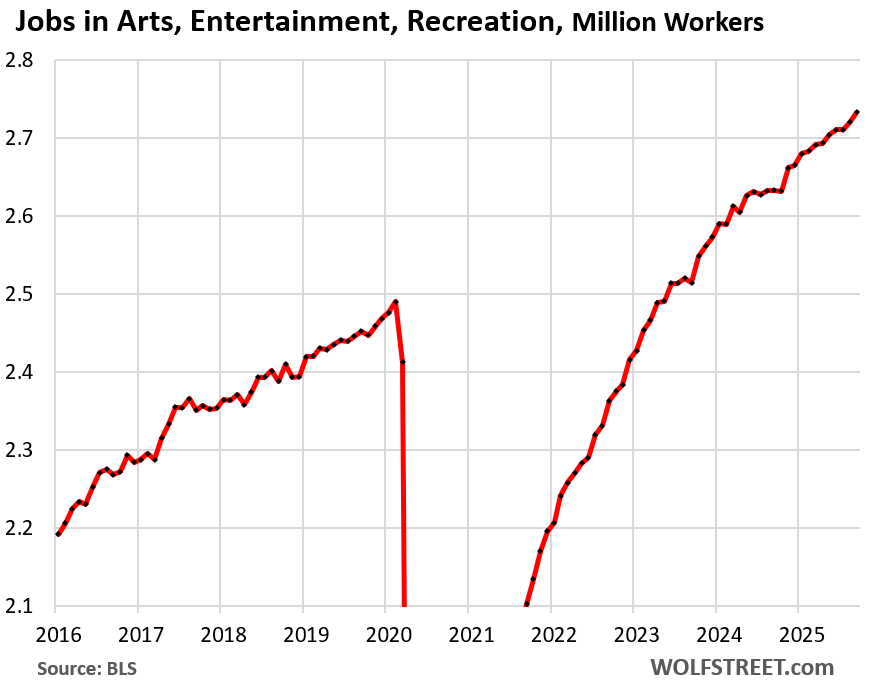
Arts, Entertainment, and Recreation:
- Total employment: 2.73 million, a record
- 3-month average growth: +8,000
Federal government:
- Total employment: 2.92 million
- 3-month average growth: -8,000
State governments: A large part of employment here is in colleges and universities, and in healthcare. First responders and law enforcement are also large components.
- Total employment: 5.5 million
- 3-month average growth: -4,000
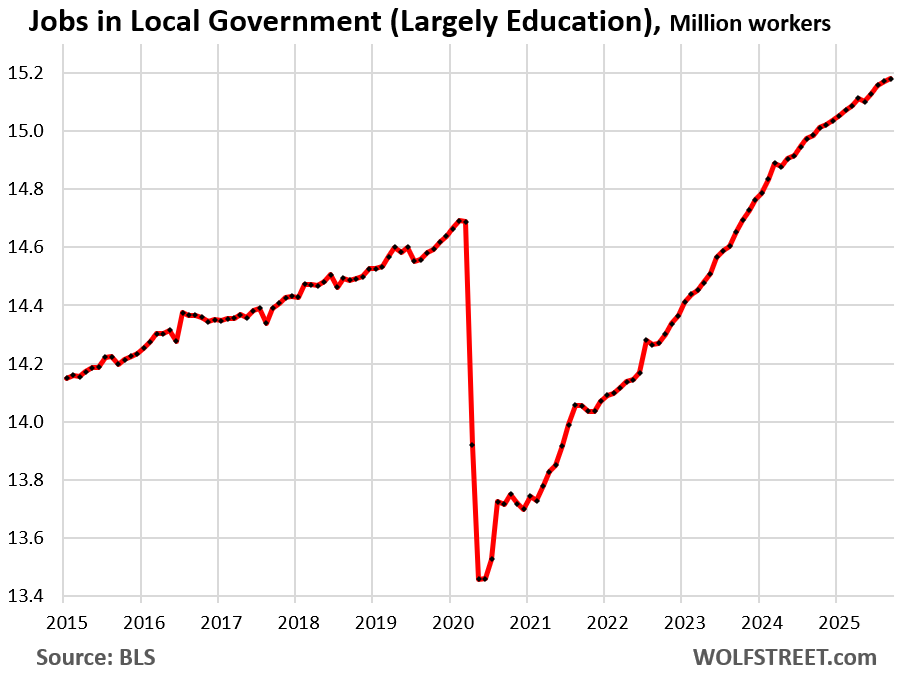
Local governments: Most of the jobs are in education across all grade levels, from preschool to community colleges and trade schools, in healthcare, and law enforcement.
- Total employment: 15.2 million
- 3-month average growth: +18,000
Enjoy reading WOLF STREET and want to support it? You can donate. I appreciate it immensely. Click on the mug to find out how:

![]()
Huang on a minute… they said AI can only go up. Sam Alman-Fried investing $1.4 Trillion over the next 3 years. What more do they want?
AI UP = Jobs down => “AI + Robots are the only thing that can sLave us!”
“Rise of the Machines” is a catchy title after all.
I would have thought the labor force participation rate would have gone up since we tick up from 4.3 to 4.4 and still added 119k jobs i was expecting with immigration deportation 30k to 50K new jobs per month would keep us steady with the unemployment rate. see what dec brings us.
As far as Huang, he said sales “were off the charts” last night”, to me this implies a parabolic chart move and eventually all parabolic up moves eventually run out of gas and {collapse} back to baseline. parabolic moves create Eifel tower patterns, eventually the highest point is top tick than its all downhill.
SPY 641 coming tomorrow? 3.313% drop in spy from high to low today, in Willshire 5000 land that equates $2.261 trillion dollar drop from high to low. the Bulls are hanging by thin thread. The last 2 Fridays buyers came in, $btcusd bounced on a line @ 86K, if it fails the April lows of 74.4K will be in play, quickly! have a good night! thanks for the article, Wolf!!
Severe correction or bear market. Get out of the way
President plunge protection chairman is on it” New York Federal Reserve President John Williams said Friday he expects the central bank has more room to lower interest rates”. He been in the news lately . He is afraid terms like collateral, parties and collateral, risk, or collateral squeeze will become fashionable in the news again.
I don’t know how anyone can think at this point that the Fed hasn’t made supporting the stock market one of their mandates.
I understand that Williams is only one vote on the committee, but it’s more the optics of it. A mild correction, even from absurd heights, is cause for alarm to these people.
Delusional about inflation
This “plunge protection” conspiracy idiocy gets old. It’s spread by people/media who don’t pay attention and prefer to make up stuff.
All 19 Fed governors and presidents have fanned out expressing their diverging opinions about the Dec rate cut. A majority want to be “patient.” Waller, Bowman, and Miran want a cut. Williams is “open” to a cut in the “near future.”
Oh, and to add on to that, the treasury market is now pricing in a 70% chance of a December cut, up from 30%.
The way the algos trade is just hilarious, and sad.
TSonder305
Good lordy. Look at the yields!!! The Treasury market is pricing in a near-zero chance of a cut. Short-term Treasury yields (1-6 months) are set on a hold in December. And they’re usually right.
The federal funds futures, which are nearly always wrong, bet on a cut.
I remember this like yesterday~ From NY times ~ William J. McDonough, president of the New York Federal Reserve Bank, made a dreadful mistake when he orchestrated a ”bailout” of Long-Term Capital Management, the multibillion-dollar investment fund that bought most of its assets with borrowed money.~ “In September 1998, a group of 14 banks and brokerage firms( sitting with Fed chairman Greenspan and NYFed invested) $3.6 billion in LTCM to prevent the hedge fund’s imminent collapse.” The NY Fed is and always will be the chairman of saving Wall Street!!. Powell has little appetite. Counterparty risk will become big again. JPM Morgan announced last month they would accept bitcoin and Ether as collateral. I will not refer to the NY Fed as PPPT. anymore here. Coincidental; that the next inflation report is coming after the next Fed meeting instead of before? I am sure it’s not related to charts and trying to prevent upcoming sell off.
Delusional about inflation
There is ZERO talk or need or use of a bailout. Why post this stupid BS after I told you that all Fed governors and presidents have been pushing their opinions about a Dec cut, with a majority saying “need to be patient” and a few saying “cut” and Williams saying “open” to a cut “in the near future,” and it was routine for them to talk about it, which is what they always do, and that’s how they communicate, except now, there is a big division. I just hate this kind of stupid conspiracy bullshit at every twist and turn. It’s not entertainment, though you may see it that way, it’s just stupid.
Wolf, my mistake. I saw the headlines on the Times and Reuters, and didn’t think they had been co-opted by the same BS as Zerohedge. Looks like I was mistaken.
Here’s a question though.
If traders really believed there’d be a cut, instead of this weird futures market (which I admittedly don’t understand), wouldn’t it make more sense for them to just buy 3-6 month treasuries and then sell them when the rate cut happens (and get the capital gain)? What is the point of this futures market?
TSonder305
The federal funds futures market is used for hedging purposes, where big investors hedge certain risks and are willing to pay for those hedges. Hedges are always costly. But in the media, this is used as a form of prediction about the Fed’s policy rates, which it is not.
In terms of your idea of buying a 6-month T-bill and then selling it after a rate cut for a (very small profit)… the problem is, what are you going to do with that small profit? Buy another T-bill with an even lower yield? If you hold that 6-month bill to maturity, you get the entire higher yield you bid on at auction, that’s how you come out ahead.
Where you come out behind with a six-month is if the Fed hikes rates. You should have bought short-term bills, such as two months, to benefit from the rate hikes.
Thanks for the constructive feedback. It made me think of this;
May all beings be peaceful.
May all beings be happy.
May all beings be safe.
May all beings awaken to the light of their true nature.
May all beings be free.
Have a great weekend.
Sincerely Dan
Which is an interesting conversation about the Fed lowering the short term interest rate below the rate of inflation will result in a rise in the long term rate.
One would have to be pretty naive to believe that inflation is under control.
These charts provide a crucial, granular view that the top-line jobs number often obscures. The continued drag from federal job cuts is a significant story, revealing a sector-specific downturn that acts as a persistent headwind even as other industries show stability or modest growth. It highlights that the “labor market” is not a monolith.
Given the scale of these government cuts, what underlying factor do you believe is most responsible for the overall labor market’s apparent resilience? Is it simply the sheer size of the private service-providing sector absorbing the shock, or are there specific industries within that sector demonstrating unexpectedly strong demand for workers?
Providing government contracts for
donors is more rewarding for the elected than maintaining a competent federal
and state workforce. Notice the increase
in the deficit and federal workforce decline as a percentage of the total workforce.
I wonder if, after some time, those fired government workers will find new, more productive employment in the private sector?
Wonder how many had 20 years in and just took the pension and “retired”. Probably not significant enough to really impact many of the number like prime age workers and perhaps many of those aren’t prime age anyway. Government workers ages tend to skew a little higher. Plus in 3 years, who knows, they might just be rehired.
That’s me except I have 35 years in (30 regular + 5 years in deferred retirement). Position is being phased out. Near retirement age anyway so there won’t be any more employment for me unless it’s passive gig work.
It would be an interesting exercise to understand how many people would be employed if we did not have public debt of $38T. On average, we have ~$200K in debt per worker, and the average salary is ~$70K/year, so there is a 3X multiple in debt, propping up every job (or put another way, 3 years of labor, on average, to pay down the debt). The debt has grown to ~125% of GDP, and that growth recently has been in response to spikes in unemployment, e.g. the financial crisis and the pandemic–effectively the debt was taken on to create jobs, which did not subsequently drive up GDP relative to debt. Essentially, we have a program that keeps employment low with public debt (but of course those same workers then have to turn around and pay for the debt themselves with inflation–no free lunch).
One would think that the powers-that-be capitalists are looking at this and realizing that the next recession/depression when unemployment inevitably spikes, the game plan should be to go hard into automation instead of rehiring (“Never let a good crisis go to waste”), since investing in human labor is “pushing on a rope” to increase GDP relative to debt. When unemployment spikes again to 10% or higher, it will be interesting to see if the government responds bigly with debt-financed stimulus/bailout to bring jobs back in line with a baseline, or if the jobs will just be replaced with automation.
You need resources knowledgeable in your systems and processes to automate. It is difficult to automate after you have reduced your headcount, while expanding your business. Automation in this scenario often fails and leads to company bankruptcy.
Do gov’t stats include the huge number of employees working for contractors that support the gov’t?
government contractors are included in the private-sector categories, as I pointed out, such as Business and professional services.
New York Times reporting a $400 million Chinese factory in Louisville, KY will employ “more than a dozen new hourly and salaried positions.”
“GE Appliances began re-shoring parts of its supply chain in 2010 in response to the rising costs of transportation and labor in Asia, as well as a fear that the company would lose its edge in innovation if it kept manufacturing abroad.”
More recent investments were moved up in timeline, due to tariffs.
Interesting to compare Retail Trade with Transportation & Warehousing.
Which begs the question, why is Dillards stock up 1,200% in five years?
Dillard’s is an exception, in terms of its stock price. But its revenues have declined over the past four years despite inflation over those years. Annual revenues in its fiscal 2025 were below those of fiscal 2022. It has quietly closed a bunch of stores and has undertaken other cuts. So it’s just another one of those stock market things.
Walmart is an exception because it has a growing grocery business (largest grocer in the US now) and a booming ecommerce business. All stores that sell groceries are protected from ecommerce, as I pointed out. Walmart’s ecommerce growth has been between 20% and 30%+ ever year, year after year. That and groceries is where its growth is coming from.
Turtle,
I didn’t know Dillards stock was way up in the last five years. I don’t follow the markets. However, I do follow the fashion world and Dillards has some store brands that dupe high end designs that are high quality and reasonably priced. This could be the reason for their staying power compared to their competitors.
Exactly. I don’t live near a Dillards anymore, but for many years they were my go-to for clothes shopping. Their buyers knew what they doing and the wares were top quality, a mere step below high end, and worthy purchases. I still have things I bought 25 years ago from Dillards. The closest one to me is two hours away now, and I really miss the store.
October CPI canceled and November inflation report pushed back until after Fed’s next big interest-rate vote
That’s one more reason to keep rates unchanged at the December meeting.
It does not matter which country,region of the world Canada,US,Europe,China etc. massive,out of control government spending,borrowing,government jobs,programs crowd out,push out private sector jobs and investment.
In Canada we had and still have 11 years of out of control debt,deficits binge because of the Liberals,Justin Trudeau federal government and the new guy Liberals Carney is no better.
Soon Canada will get it’s credit crating on it’s bonds cut and interest rates will be higher making it worse.
Even the Bank of Canada is trying to avoid getting blamed by saying they can’t do much more and the federal government must use fiscal policy,basically more federal government debt,borrowing,more spending money Canadian taxpayers don’t have.
They are both responsible for devaluing,debasing all of people’s money,savings,property high inflation,high rental,property prices,high taxes,high cost of living period and the finger pointing to each other or against Trump,Covid, what other excuse is getting lame and tired.
They keeping using failing policies over and over and think we are not noticing how they are making things much worse year after year.
Can we PLEASE have QT and Rate Cuts???
No.
Rate cuts will only defer the much needed price reductions in single family real estate.
Just FYI,
Using eyeballed approximations from the charts, here are the 2016/2025 employment levels and 2016-2025 percentage change for the 15 charted employment supersectors –
transpo and warehousing – 4.9 mil, 6.7 mil, 37% growth
construction – 6.6, 8.3, 26%
health care social assist – 19, 23.5, 24%
arts, entertainment – 2.2, 2.7, 23%
professional and biz svc – 20, 22.5, 13%
financial activities – 8.2, 9.2, 12%
leisure and hospitality – 15.5, 17, 10%
other services – 5.6, 6.1, 9%
state gvt – 5.1, 5.5, 8%
local gvt – 14.2, 15.2, 7%
wholesale – 5.8, 6.2, 7%
info – 2.8, 2.9, 4%
federal gvt – 2.8, 2.9, 4%
manufacturing – 12.4, 12.7, 2%
retail – 15.7, 15.6, -1%
Just a lot to mull there in terms of,
– relative sector size
– relative sector growth
– sustainability and volatility
– etc.
I just think that such time series can be very informative – going back to 2000 might be even more eye opening.
(One note – that federal employee number will not reflect contractor employees ultimately financed by the gvt – they show up under other sector categories. Also, the numbers really can’t express the degree to which certain sectors – such as health care and social assistance – are fairly heavily reliant on government funding. All of that just goes to stability and sustainability.)
Not looking to pick fights – just want to lay out where some of my thinking proceeds from.