The 6-month Treasury yield sees Fed on hold in December. Cutting rates as inflation accelerates is a delicate operation that the bond market isn’t fond of.
By Wolf Richter for WOLF STREET.
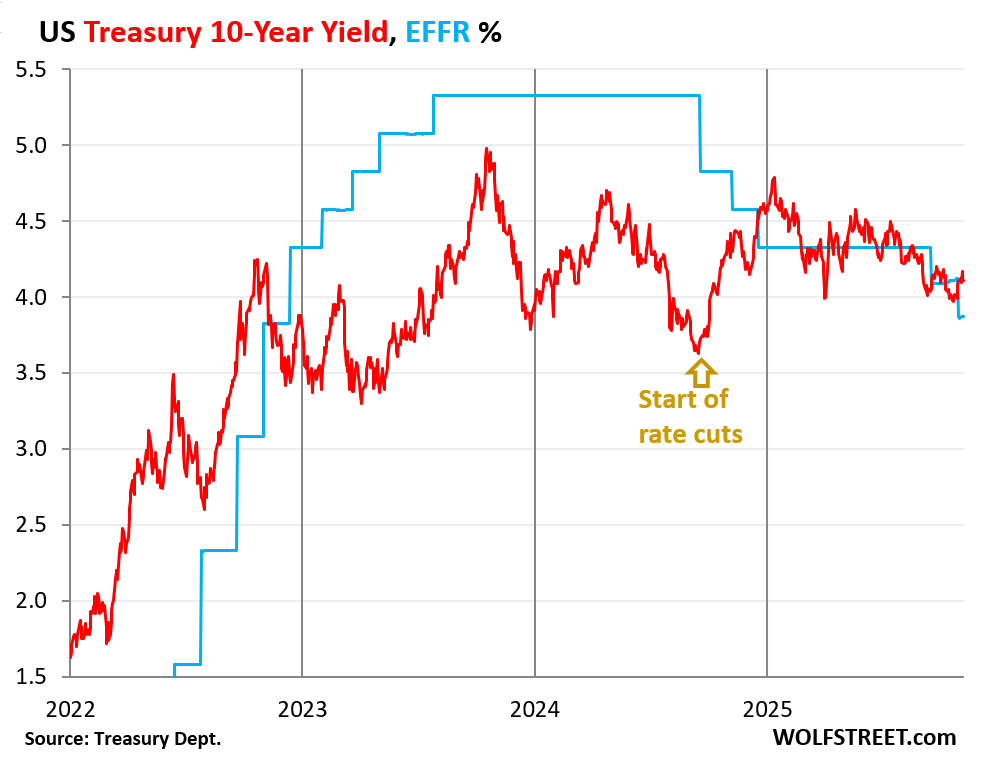
The 10-year Treasury yield closed on Friday at 4.11%, essentially where it had been for seven trading days, up by 12 basis points from October 28, the day before the Fed cut its policy rates, and up by 48 basis points since the first rate cut in this cycle in September 2024, when the 10-year yield was 3.63%.
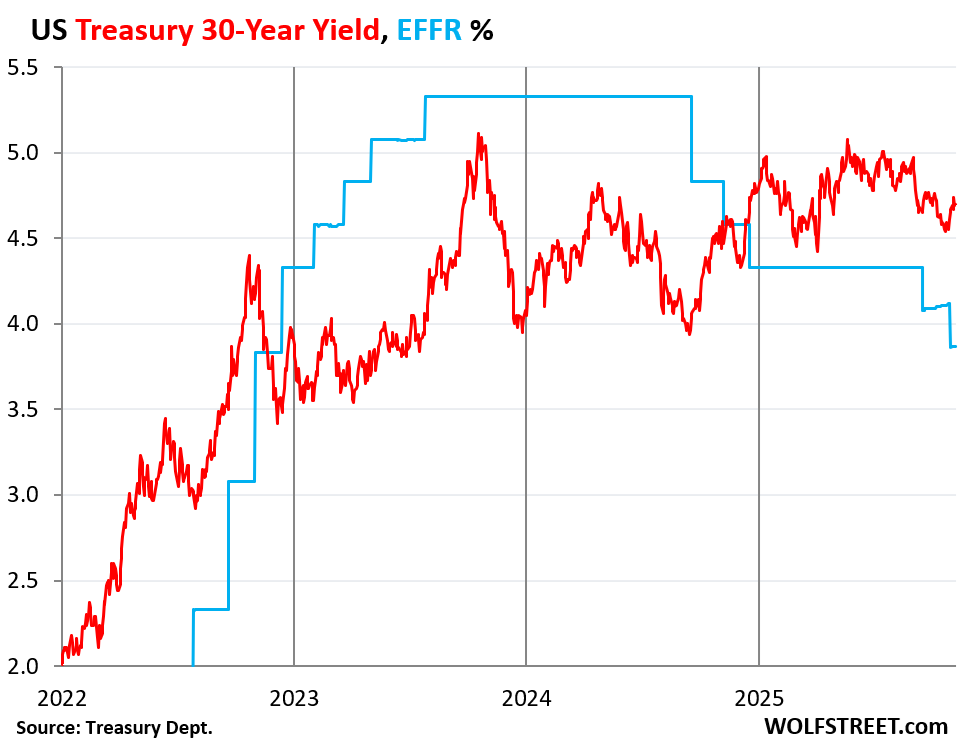
The 30-year Treasury yield rose to 4.70%. It was 4.55% just before the October rate cut, and 3.94% before the rate cut in September 2024.
The Fed has now cut by 150 basis points, and the 30-year yield has risen over the same period by 76 basis points. Long-term yields are determined by the dynamics in the bond market, not by the Fed’s short-term policy rates.
The 6-month Treasury yield, which is normally good at predicting the Fed’s next rate move as the market digests every comma of the Fed’s releases, speeches, and press conferences, is predicting the Fed will hold its rates in December.
Since the Fed’s rate cut at the end of October, the entire yield curve from the 3-month Treasury yield to the 30-year Treasury yield has risen. And mortgage rates have risen too.
But the Effective Federal Funds Rate (EFFR), an overnight rate that tracks now largely vanished interbank lending, and that the Fed targets with its policy rates, dropped by 25 basis points to 3.87% after the October rate cut (blue in the chart).
The 10-year Treasury yield, at 4.11% (red) is now 24 basis points above the EFFR. In normal credit markets, long-term yields, such as the 10-year Treasury yield, are higher and often quite a bit higher than short-term yields, such as the EFFR. When it’s the other way around, when short-term yields are higher than long-term yields, the yield curve is said to be “inverted.” The 10-year yield and the EFFR have been in and out of inversion all year long:
The 30-year Treasury yield ended the week at 4.70%, up by 15 basis points from the day before the Fed’s rate cut at the end of October.
The upward trend of the 30-year yield started in August 2020, after trading briefly as low as 1.0% in March 2020. That yield had been pushed down by the Fed’s mega-QE. By the end of 2021, it was at 2.0%. Since October 2023, it has bumped into the 5%-mark several times.
The 30-year Treasury yield reacts to bond-market issues, such as expectations of future inflation and expectations of supply of new bonds that have to be absorbed, rather than the Fed’s short-term policy rates.
Also note how the EFFR inched up just a tiny bit towards the end of October during the repo market turmoil, which settled down last week.
Cutting rates as inflation accelerates is a delicate operation that the bond market is not fond of. The bond market fears a Fed that is lackadaisical in face of inflation. And the bond market is worried about the onslaught of new supply of bonds to fund the ballooning government deficits.
The bond market could decide that it wants to be compensated a lot more for those two risks – inflation and supply – via higher yields, especially if inflation continues to accelerate, with services inflation, which accounts for about 65% of the inflation basket, being the big driver, and goods inflation chiming in.
Last fall, when the Fed cut by 100 basis points in four months, the 10-year Treasury yield jumped by 100 basis points. This taught the Fed a bond-market lesson, and it put further rate cuts on ice, and started talking hawkish, which succeeded in coaxing long-term yields and mortgage rates back down.
Then in September and October 2025, the Fed went at it again with rate cuts, but more carefully. And after the October cut, the Fed put a December rate cut into doubt, in part to keep the bond market from throwing another hissy-fit.
The 6-month Treasury yield predicts a Fed “hold” for December. On Friday, it closed at 3.80% (red line), well within the Fed’s target range for the EFFR of 3.75% to 4.0% (shaded area).
Just before the Fed’s October rate cut, it had dropped to 3.75% and had been on a downward trajectory, which has since then reversed.
The 6-month yield reacts to expectations of the Fed’s policy rates over the next two or so months and is a good indicator where the bond market thinks the Fed’s policy rates will be within its window. It nicely predicted the last two rate cuts; and it nicely predicted the first four rate cuts in 2024. And it nicely predicted the rate hikes in 2023, except for the moment of bank panic in March 2023. It goes by what the Fed says, and sudden panics are outside of that. And it wrongly predicted a rate cut for early 2024 amid general rate-cut mania.

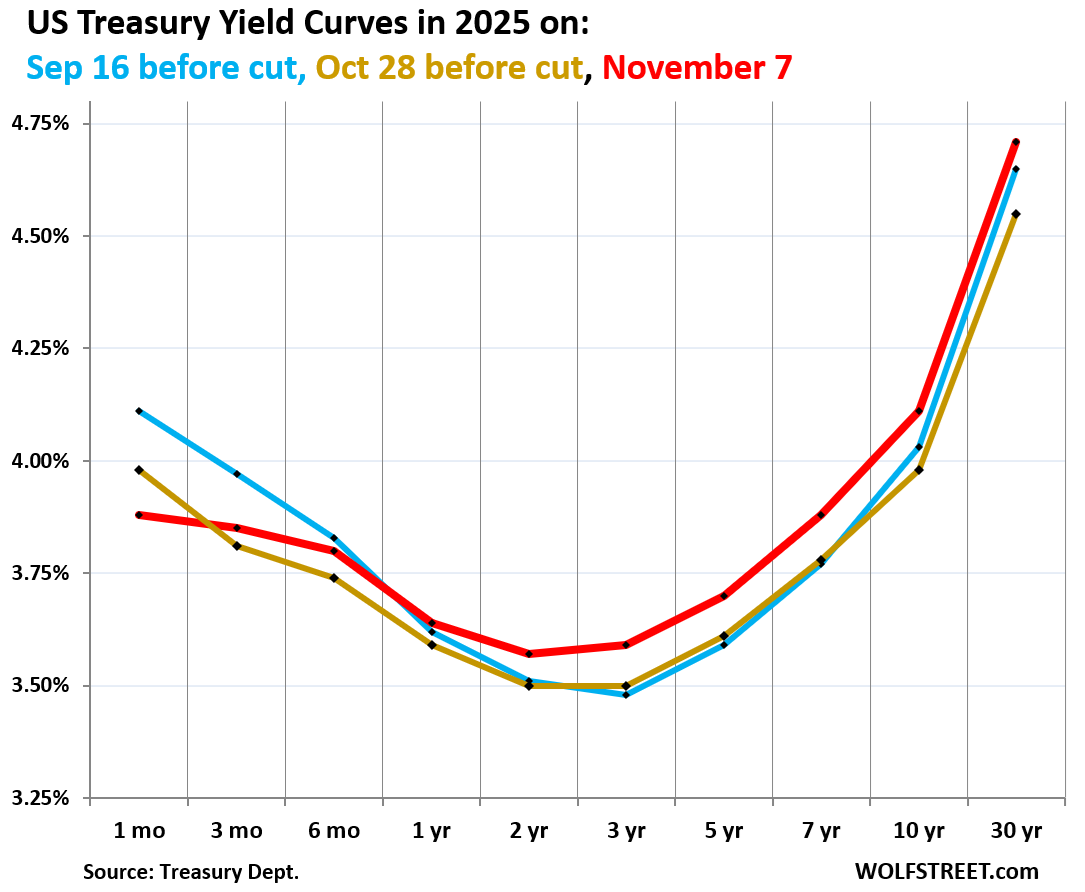
The yield curve has moved up since the last rate cut. The chart below shows the yield curve of Treasury yields across the maturity spectrum, from 1 month to 30 years, on three key dates in 2025:
- Red: Friday, November 7.
- Blue: September 16, just before the Fed’s rate cut.
- Gold: October 28, before the Fed cut rates again.
The 1-month yield (3.88%) is boxed in by the Fed’s policy rates (3.75%-4.0% since the October rate cut) and closely tracks the EFFR (3.87%). That’s the only yield that dropped since the October rate cut.
Both the three-month yield (3.85%) and the six-month yield (3.80%) rose since the rate cut, indicating that the bond market figures the Fed will keep rates steady in December.
The 1-year (3.64%), 2-year (3.57%), and 3-year (3.59%) yields have all risen since both the October and the September rate cut. They’re moved in part by expectations of the Fed’s policy rates within their window, and they’re expecting more rate cuts next year, but fewer of them than they did two months ago.
But the further yields go out on the yield curve, the more they’re influenced by inflation fears and supply concerns – and there are lots of both.
Mortgage rates have re-risen since the October rate cut. The daily measure of the average 30-year fixed mortgage rate by Mortgage News Daily has jumped by 22 basis points since just before the October rate cut, to 6.32% on Friday.

Mortgage rates of 6% to 7% used to be the lower end of the normal range before the Fed’s QE started distorting interest rates during the Financial Crisis.
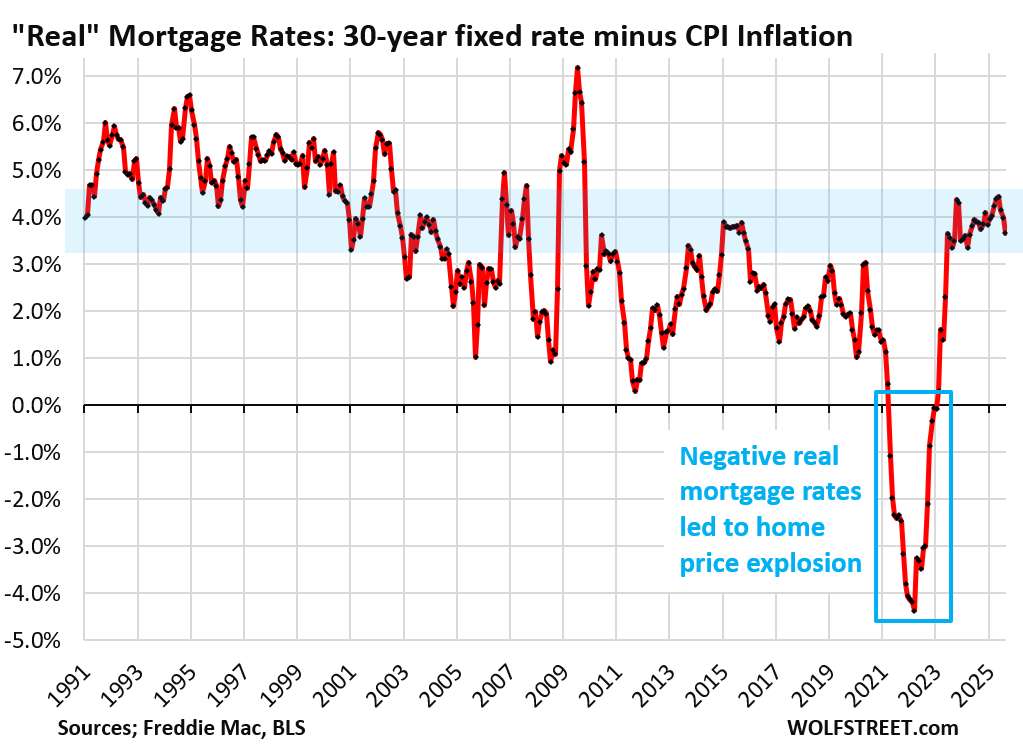
The 6% to 7% mortgage rates are now only a big deal because home prices exploded by 50% and more in just two years from mid-2020 to mid-2022, after they’d already surged for years, inflating home prices to where they’re no longer economically feasible.
But that home-price explosion was a result of the Fed’s reckless monetary policy that created 30-year fixed mortgage rates below 3%, while inflation had begun to rage and was heading to 9%. The Fed, with its reckless policies, orchestrated negative “real” mortgage rates of -3%, -4%, and even lower – better than free money, and when money is free, buyers’ brains turn to mush, and prices don’t matter. Then the music stopped.
Enjoy reading WOLF STREET and want to support it? You can donate. I appreciate it immensely. Click on the mug to find out how:

![]()
I thought the T-bills market (0-12 months) have direct by the FED with their interest rates policy, is that not the case? I know there’s correlation/causation for sure but based on even the T-bills rate going up slightly (in the midst of the last cut), I am guessing the Bond market are the ultimate decider for all Treasury bills/notes/bonds rates? Has there been time in our history when T-bills rates diverge greatly from FED funds rate or can that ever happen? I know they don’t have direct control over the notes/bonds market except through unconventional means like yield curve control..etc
Short-term yields predict the Fed’s next move as the bond market prices in expectations (sometimes wrongly) of where short-term rates will be in a month or two or three (depending on maturity).
BTW: all yields are calculated. The 6-month yield, for example, is calculated of all Treasury securities that mature in about 6 months, but none mature in exactly 6 month, so that requires more calculations. It includes 30-year bonds that have about 6 months left to run before they mature and therefore trade like a new 6-month T-bill.
Wolf, does that mean you could theoretically produce a yield curve chart for every month from 1 month to 360 months (30y x 12 months), given that there are outstanding treasuries at almost every remaining maturity? May not be very useful but it could be cool to see a “finer resolution” yield curve.
You can obviously calculate anything you want. What I said was that there is no 10-year yield that is not calculated because no security out there matures in exactly 10 years from now. Notes mature on the 15th of the month and at month end. 10-year notes are sold at auction with maturities of 9 years, 11 months, or whatever, not even exactly 10 years. So all these yields are calculated from a variety of different transactions.
The Treasury bond market now sees that future short term rates are not going to compensate for inflation.
The bond market is way too sanguine about inflation, in my opinion.
Agreed, and I’ll go further with an unpopular comment. Unemployment needs to hit 6% to contain inflation. The Fed’s decision to focus on labor, rather than containing inflation, is exactly the wrong move at this juncture. Wage growth is 4.5 percent for job-stayers and 6.7 percent for job-changers. This is way too high, and presages further services inflation (65% of the inflation basket, you say) from already high levels.
I think we are all miscalculating/dismissing the amount of deflation coming by the recent tech advancements and incoming efficiencies and looming job losses. 10 year going to fall
Bringing costs down doesn’t bring prices down, but brings up profits.
What brings prices down or at least prevents them from rising faster is competition for the same sales dollar. But AI is now being used to set sales prices, and AI is colluding with AI, and so there may be the opposite effect on prices.
Direct collusion by parties actively colluding, or giving non-public pricing information to 3rd parties, and allowing them to collude for the sellers, to the detriment of buyers, is still collusion.
I’ve heard of software that enables collusion described as CaaS software – it sells Collusion as a Service.
Collusion in any of its forms, should be identified and prohibited.
Keith, how much enduring deflation did we get out of the PC/Internet tech advancement era? Nothing I pay for is cheaper than it was 25 years ago. Except TVs and computers. Yeah, OK, those deflated. But not insurance of any kind (home, auto, health), not home appliances, not clothes, not tools, not food. Haircuts, dental work? Nope. Cars? Ha! Whatever efficiencies were enabled by those tech advancements got absorbed way up the chain from the point-of-sale where I run my credit card by companies and the monetary system.
But now I can watch people shout at each other in ALL-CAPS and post cat videos on a variety of social media platforms, so maybe the cost of entertainment is lower and we can call that deflation.
Hey, I’m all for the advancement of technology; I spent my career in it. But the future is already here — it’s just not very evenly distributed.
In any inflationary environment such as the present 3% inflation in the US long term yields (interest rates) will typically rise to compensate and that is precisely what we are presently seeing and will include mortgage rates.
Why would anybody be surprised to see long term interest rates rising?
I think we’re all cynically half-expecting to see this market continually becoming more irrational because everyone believes that the bubble has become Too Big to Fail.
“Cutting rates as inflation accelerates is a delicate operation”
If I remember correctly, the Fed started to cut rates in Aug / Sept 2007 and we were in a recession by December. Over the later part of 2007, inflation accelerated just like today, until it didn’t.
My goodness the similarities are just uncanny, except back then we didn’t have QE, interest on reserves the amounted to less than $50B & a 120% debt to GDP ratio.
The only reason why inflation was hot in 2007/2008 was the price of oil which had shot to $150 a barrel, which pushed gasoline prices into the stratosphere for a while, before those prices collapsed. Core CPI, which excludes gasoline and other energy, was between 2% and 2.5%, and core PCE was below the Fed’s 2% target.
Back then, the economy was approaching a recession and in Dec 2007 was in a recession. Now we have GDP growth of over 3%. We don’t now have QE; but we’ve had QT over three years.
What would the interest rate on a 50 year mortgage look like?
It would be higher than a 30-year rate. If you want a low mortgage rate, get a 15-year mortgage (average 5.5%) versus 30-year (average 6.2%) per Freddie Mac data. So add another 20 years to a 30-year, and maybe you’d go to 6.7%…. for 50 years.
I know mortgage math is hard. And people cannot do it. But that 50-year mortgage won’t change much except rip off borrowers even more.
In terms of the payment, the difference is small. The difference on a $500,000 mortgage is $168 per month, going from a 30-year mortgage at 6.2% to a 50-year mortgage at 6.7%.
I assumed a 50-basis point higher mortgage rate for a 50-year mortgage, based on the current rates (Freddie Mac average) for a 15-year mortgage = 5.50% average, and a 30-year rate = 6.22%. What, you didn’t know that the average 15-year mortgage is 5.5% while the average 30-year is 6.2%?
50-year, per month: $2,894 at 6.7%
30-year per month: 3,062 at 6.2%
Difference: $168 per month.
But you make 20 years of interest payments extra for this! You will pay a freaking fortune to the banks.
And if you sell your home after 10 years, you still owe nearly the entire 50-year mortgage balance. Talk about being stuck in a house!
If you want to starve your banker, get a shorter term mortgage, such as a 15-year. It is because of this math that in the late 1980s when I got a mortgage, with interest rates higher than today, I chose a $15-year mortgage. Slightly higher monthly nut, but substantially lower rate and half the mortgage payments over the life of the mortgage! The problem with a 30-year mortgage is that the first many payments are nearly all interest, and very little principal. A 50-year mortgage is even worse; for the first two decades, it’s similar to an interest-only mortgage.
I am just curious to learn how the Fed’s reckless policy created a 30-year, 3% mortgage. Please provide some insights on this?
Did you just arrive on earth today?
“QE” by the Fed, including the purchase trillions of dollars of Mortgage-Backed Securities, of which $2.1 trillion remain on the Fed’s balance sheet; plus even more trillions of dollars of Treasury securities. At one point the Fed’s total assets were nearly $9 trillion. The Fed did this purposefully to push down long-term yields and interest rates, such as 30-year bonds and mortgages, far below the rate of inflation (free money), and thereby, along with the liquidity QE added, inflate asset prices, including home prices. And ALL assets were bid up. That was the explicit policy of the Fed at the time. There may be hundreds of articles on WOLF STREET about QE and subsequently QT. I have no idea how you could have missed that.
It is my humble opinion that interest rates on longer term government bonds do not properly reflect the risk being taken by the holders of those bonds. Inflation is only one of the risks. The bigger risk likely is the rapidly expanding government debt which is not being addressed. While the Trump administration has tried to address the waste and fraud in government there is no interest by the democrats to cut spending. Just the opposite: they want to expand government spending because it enhances their position with their constituents. At some point people will no longer want to purchase so-called risk free government bonds. At some point the cost of interest will become so high that taxes will have to rise just to cover interest payments and or other government programs drastically reduced and the likely default on interest payments, and or out of control inflation. If the U.S. dollar at some point is no longer accepted as the international currency, America will suffer a dramatic economic collapse.