The long-defaulted federal student loans were pulled out of the forbearance closet.
By Wolf Richter for WOLF STREET.
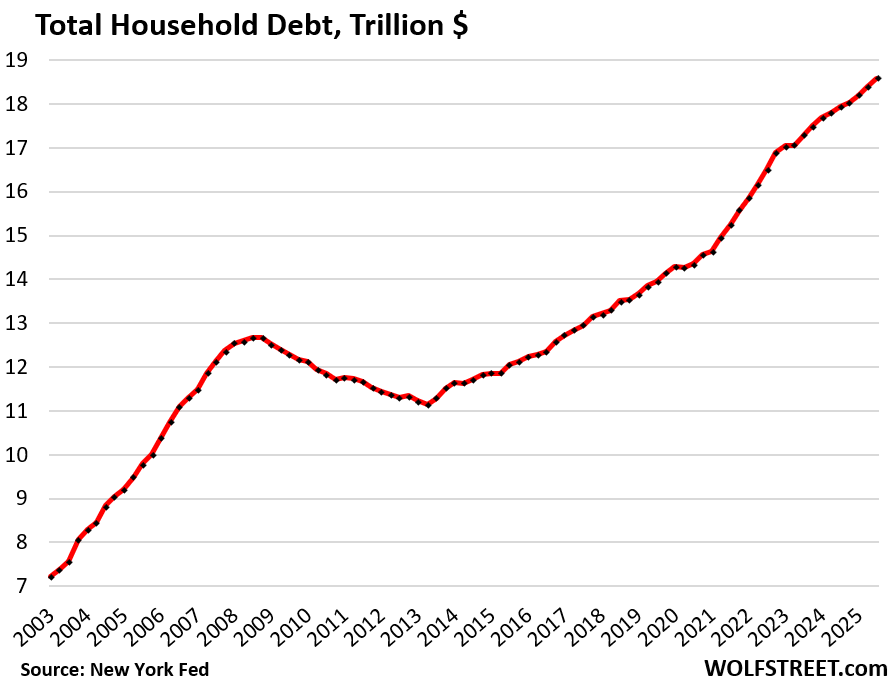
Total household debt outstanding in Q3 rose by 1.1%, or by $197 billion, from Q2, to $18.6 trillion, according to the Household Debt and Credit Report from the New York Fed today. Year-over-year, household debt rose by 3.6%, or by $642 billion.
Household debt includes mortgages, HELOCs, auto loans, student loans, credit cards, and “other” revolving credit such as personal loans and BNPL loans. I will discuss these categories in separate articles over the next few days. Today, we’ll look at the overall debt, its burden, delinquencies, collections, foreclosures, and bankruptcies.
It’s not that households carry an ever-bigger debt burden; they’re not. It’s that the number of households has grown over the years, and that the income per household has grown on average over the years, and they have grown faster than household debt, and the burden of this debt has declined over the years.
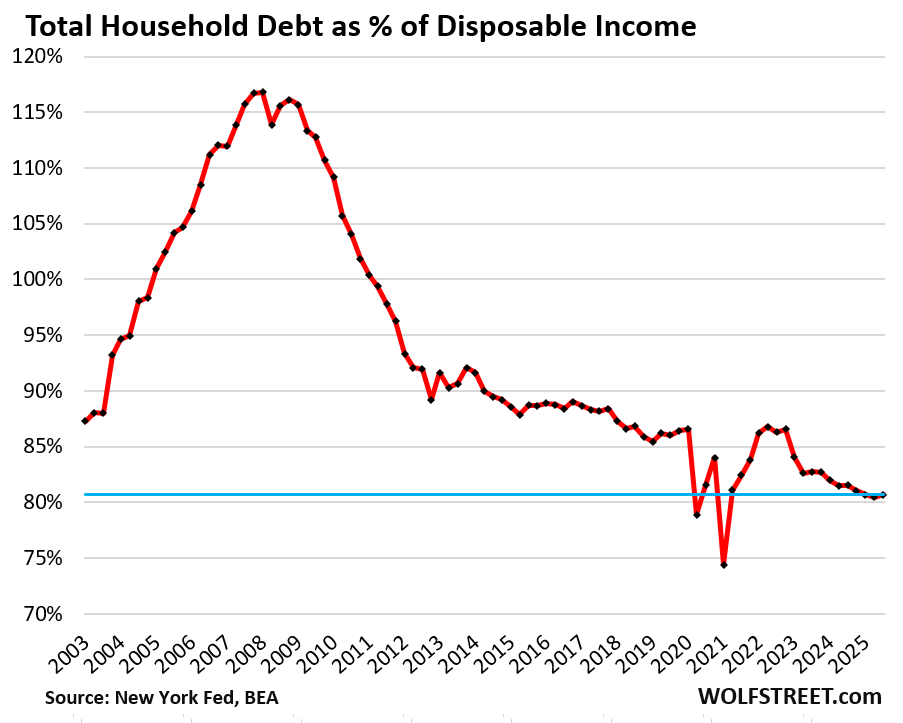
The burden of household debt: Debt-to-income ratio.
The debt-to-income ratio is a common way of evaluating the burden of a debt. With households, we can use the debt-to-disposable-income ratio.
Disposable income, released by the Bureau of Economic Analysis, is household income from all sources except capital gains, minus payroll taxes: So income from after-tax wages, plus income from interest, dividends, rentals, farm income, small business income, transfer payments from the government, etc. It’s essentially what consumers have available to spend and service their debts.
Due to the government shutdown, the BEA has not yet released disposable income for September. To get Q3 disposable income, we can use current data for July and August and estimate September based on average growth year-to-date.
The debt-to-disposable income ratio in Q3 was 80.7%, a hair higher than Q2, which had been the lowest in the data going back to 2003, except for two freak quarters during the stimulus era (Q1 2021 and Q2 2020).
Seen as an economic entity, American households are in good shape. They’re making record amounts, their balance sheet is in good shape, 65% own their own homes, over 60% hold equities, and they’re sitting on a record pile of interest-earning cash: $4.7 trillion in money market funds and $3.4 trillion in CDs that all generate interest income.
Our Drunken Sailors, as we lovingly and facetiously call consumers, have in fact become a fairly sober bunch, in terms of borrowing. They learned a lesson during the Great Recession, most of them. Not all of them.
Subprime-rated borrowers – a small subset of consumers – are always in trouble with high debt-to-income ratios, missed payments, and bad credit history, which is why they’re called subprime.
“Subprime” means bad credit, not “low income.” The high-income young dentist that got into it over their head is a classic example of high-income subprime. They’ll get it worked out and clean up their credit, but for a while they’re subprime. Credit problems are driven by this small subset of consumers.
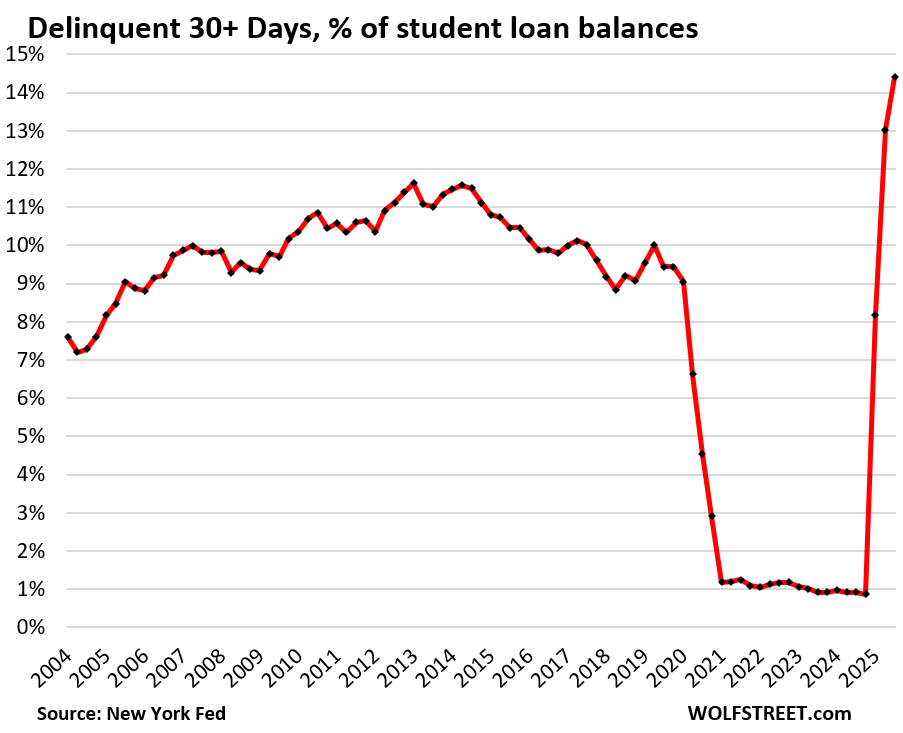
And student loan borrowers… In 2025, federal student loans that had been covered by the government’s forbearance policies since 2020 came out of forbearance, and those loans that had defaulted but hadn’t counted as defaulted suddenly started showing up on credit reports again, and delinquency rates exploded.
The 30-day delinquency rate spiked to 14.4% in Q3, the worst ever, up from around 1% during the nearly 5-year forbearance era, according to the NY Fed’s report today, based on Equifax data.
Of the $1.65 trillion in student loans outstanding, $238 billion were 30-plus days delinquent in Q3.
Student should have been taught early on in college that delinquent loans mess up credit scores, limit the ability to borrow, and increase the interest rate borrowers have to pay when they do borrow.
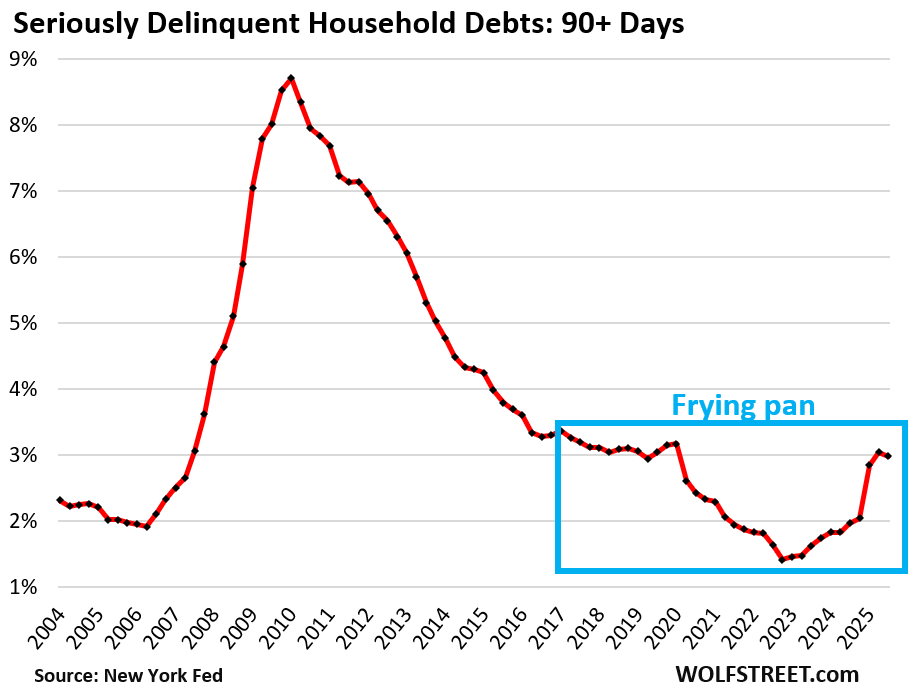
Overall delinquency rate got hammered by bad student loans. In Q1 and Q2, the 90-day-plus delinquency rate – the rate of “serious” delinquencies – for all household debts had gotten hammered by the student loans that began counting as delinquent, pushing it from 2.0% in Q4 2024, to 3.04% by Q2 2025.
But in Q3, the 90-plus day delinquency rate for student loans dipped to 9.4%, and this caused the overall 90-day delinquency rate to dip a hair to 2.98%. And that’s below where it had been before the pandemic. Note the infamous – on WOLF STREET – “frying pan” pattern.
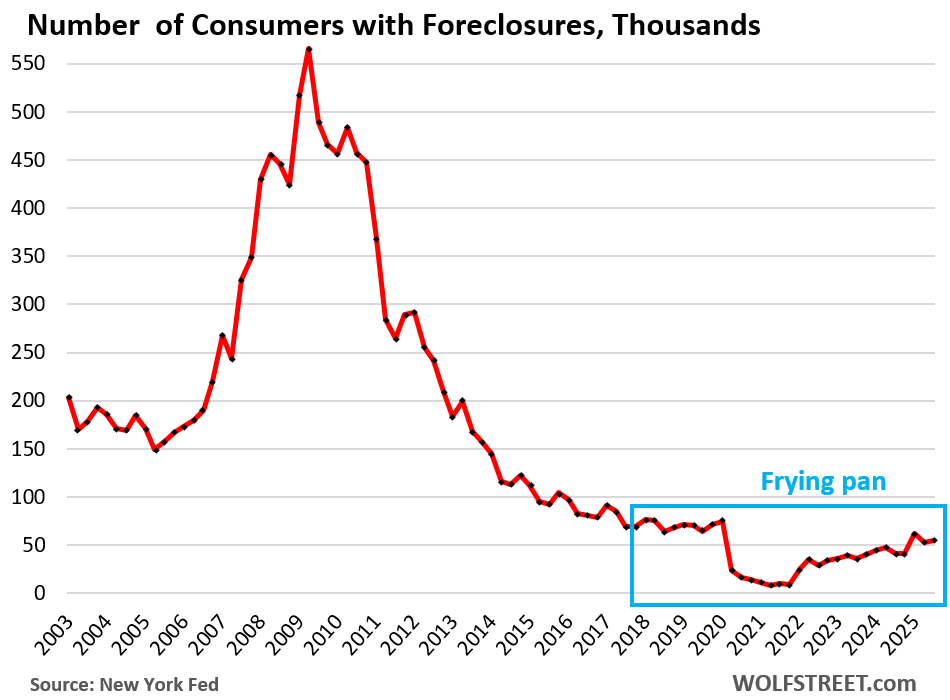
Foreclosures are low. The number of consumers with foreclosures in Q3 inched up to 54,760, well below the low end of the 65,000-to-90,000 range of the Good Times in 2018-2019, and was far below the number of foreclosures in prior years.
During the Free-Money and mortgage-forbearance era, when foreclosures were essentially impossible, foreclosures fell to near zero.
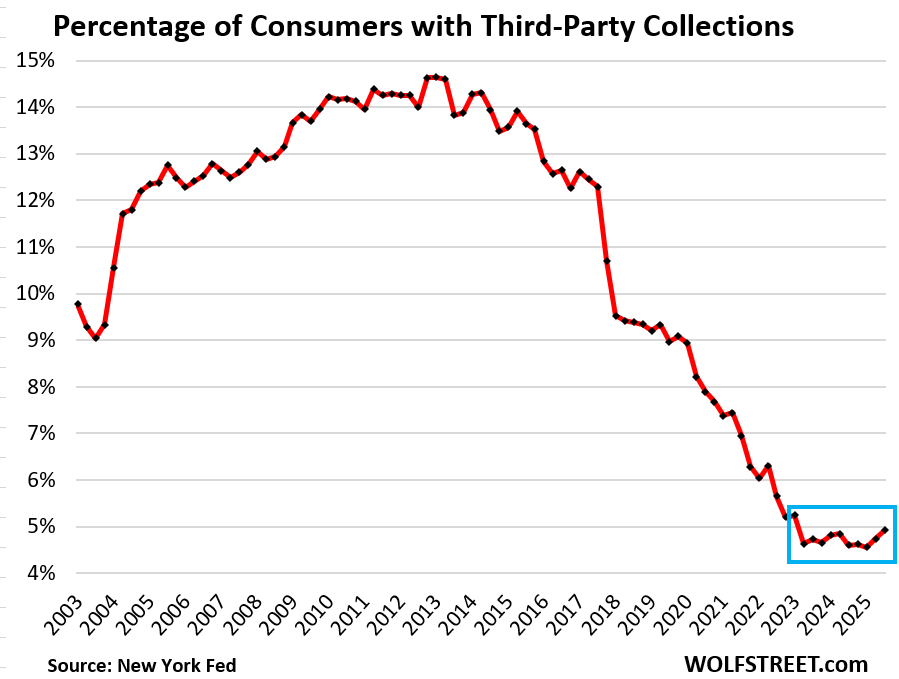
Third-party collections at rock-bottom. A third-party collection entry is made into a consumer’s credit history when the lender reports to the credit bureaus, such as Equifax, that it sold the delinquent loan, such as credit card debt, to a collection agency for cents on the dollar. The New York Fed obtained this third-party collections data in anonymized form through its partnership with Equifax.
The percentage of consumers with third-party collections had plunged from over 14% in 2013 to 4.6% in early 2023 and has hobbled along near those record lows even after the free money vanished. In Q3, it was 5.0%.
If the defaulted federal student loans are turned over to collection agencies – and there are discussions about that – it would cause the percentage of consumers with collections to spike in a spectacular way.
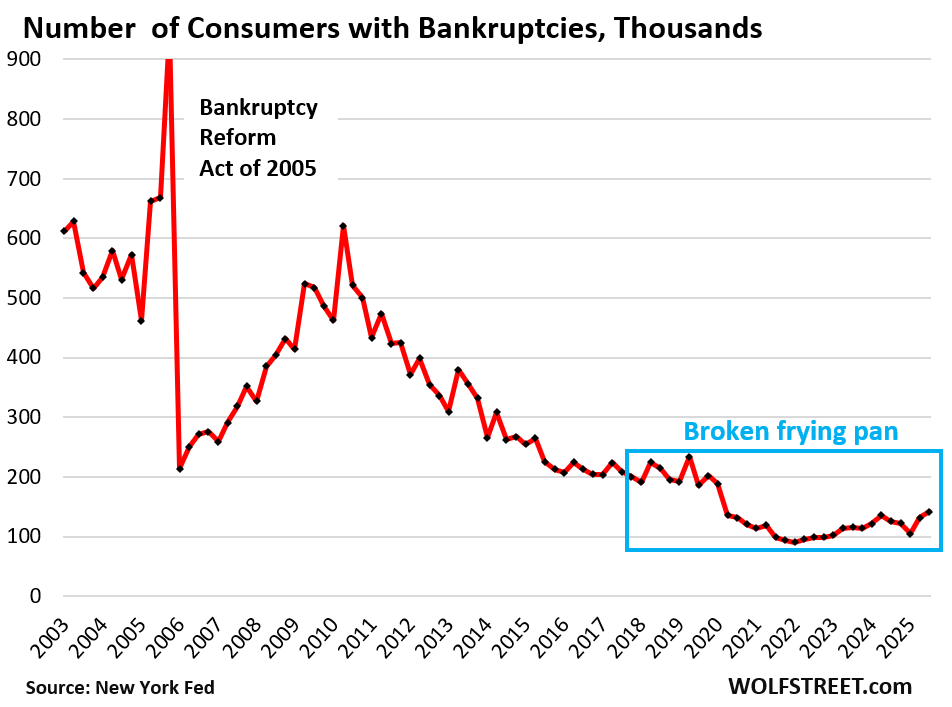
Bankruptcies at rock-bottom. The number of consumers with bankruptcy filings rose to 141,640 in Q3.
During the Good Times before the pandemic, the number of consumers with bankruptcy filings ranged from 186,000 to 234,000, which had also been historically low.
I will wade into housing debt, credit card debt, and auto debt in three separate articles over the next few days. Next one up is housing debt.
Enjoy reading WOLF STREET and want to support it? You can donate. I appreciate it immensely. Click on the mug to find out how:

![]()
What do you make of the feds recent cash infusion.
Those were repos at the SRF. They have already been backed out entirely and the SRF is back to zero as of today.
Read the articles here. I just explained that yesterday:
https://wolfstreet.com/2025/11/04/government-shutdown-adds-to-repo-market-liquidity-pressures-but-the-feds-srf-did-its-job-and-now-went-back-to-sleep/
Forgive me….
I am not sure I understand the “frying pan” graph.
What is the significance of the pan ?
Covid
Good question HUCK, thanks for asking….I too was unsure of meaning.
So the “drunken sailors” are in your analysis “doing ok to very ok”, whats all the national “crises”media attention to a so called “Affordability Crises”?
1. The crisis media keeps producing clickbait BS no matter what, day-in day-out, week after week, month after month, year after year.
2. Home prices, after exploding, have gotten way too expensive, and the solution is to not buy, but let the boomers sell their homes to the angels in the sky. And prices will become more affordable, and that has already started to happen in lots of markets that I have covered here. Does the crisis media tell you that home prices are way too high and need to come down?
3. The crisis media also always hushes up income growth.
“Does the crisis media tell you that home prices are way too high and need to come down?”
Yes, nearly everywhere.
And indeed, the crisis media loves to say “the consumer is tapped out” and the clickbait b.s. readers believe it. It’s tiring.
Re; Not so drunken sailors
A You Tube talk about “money” (what this site spins on, per Wolf) from a VERY well known Bay Area (had houseboat, Sausalito) philosopher who I had the luck to actually get to talk to back in the 60’s when he was at SRJC for a couple weeks. My English 1B teacher was a “struggling” writer who somehow made his acquaintance, which got me into a few of his other activities when not making paid speeches at JC, the primary reason he was up there.
Will likely get rejected as most links do, but Wolf gets to watch it.
I am wondering if there is something hidden in number of households. We know the average age of owning a home is older. Are more people living with their parents? Are people delaying forming their own household? Could this possibly hide some troubles in the debt that young people have?
Nothing “hidden” here.
A household is one address, and addresses are known (the address of a house, the address of an apartment, the address of a condo, and it doesn’t matter whether owned or rented). If three generations live in one address (for example, in the same house), it’s one household. If only one person lives there, it’s still one household. If six roommates live there, it’s one household.