Price declines and increases vary dramatically in different markets.
By Wolf Richter for WOLF STREET.
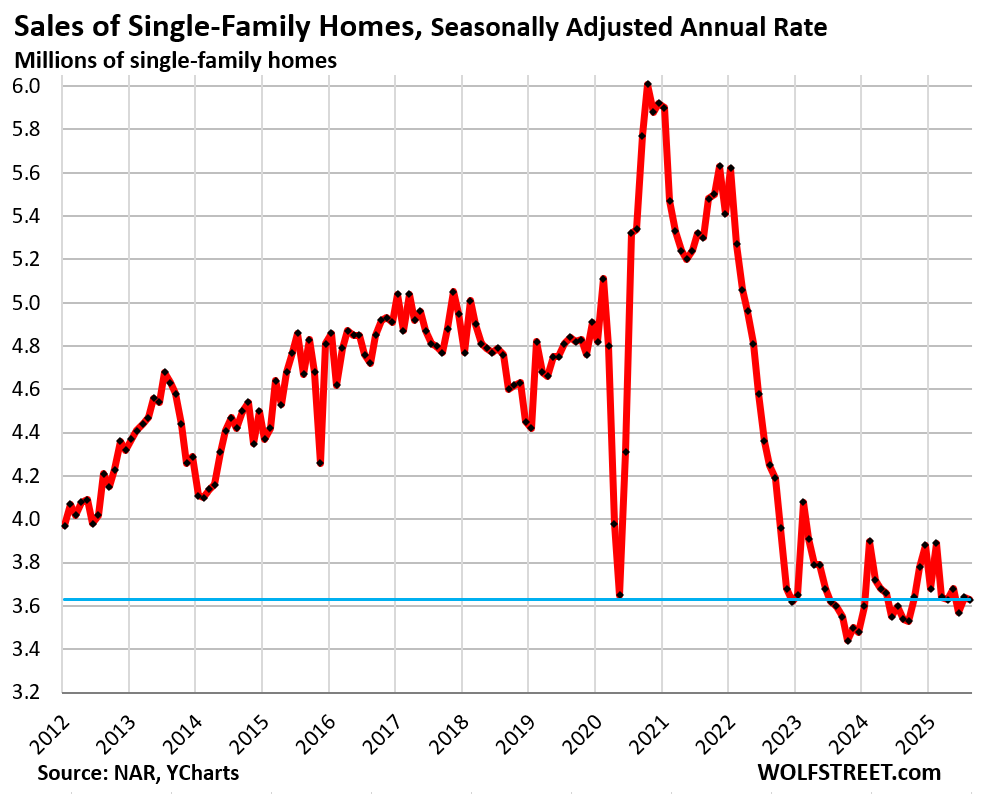
Sales of single-family homes that closed in August fell by 0.3% from July to a seasonally adjusted annual rate of 3.63 million homes, according to the National Association of Realtors today.
Compared to August 2024, sales were up by 2.5%. Compared to August 2019, sales were down by 25%. Compared to August 2021, sales were down by 32%. Compared to August 2009, the depth of the Housing Bust, sales were down by 2.7% (historical data from YCharts):
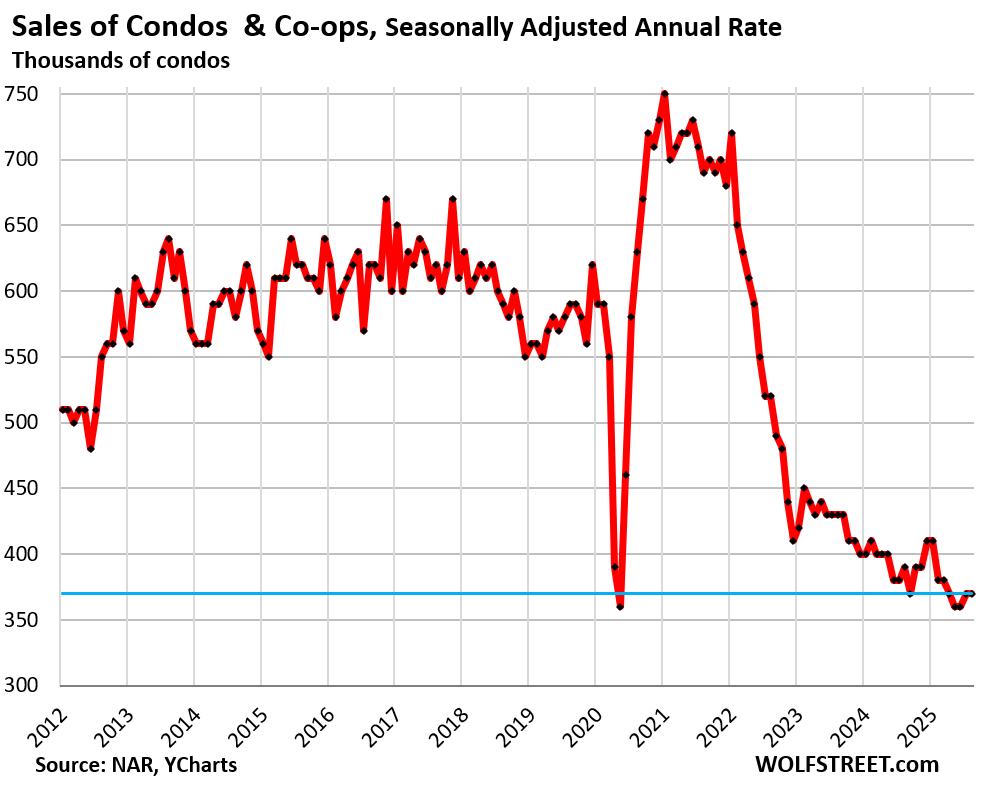
Sales of condos and co-ops that closed in August were unchanged from July at a seasonally adjusted annual rate of 370,000 condos. May and June had been the record lows in NAR’s condo data going back to 2011.
Compared to August 2024, sales were down by 5.1%. Compared to August 2019, sales were down by 37% (historical data from YCharts):
Lots of supply.
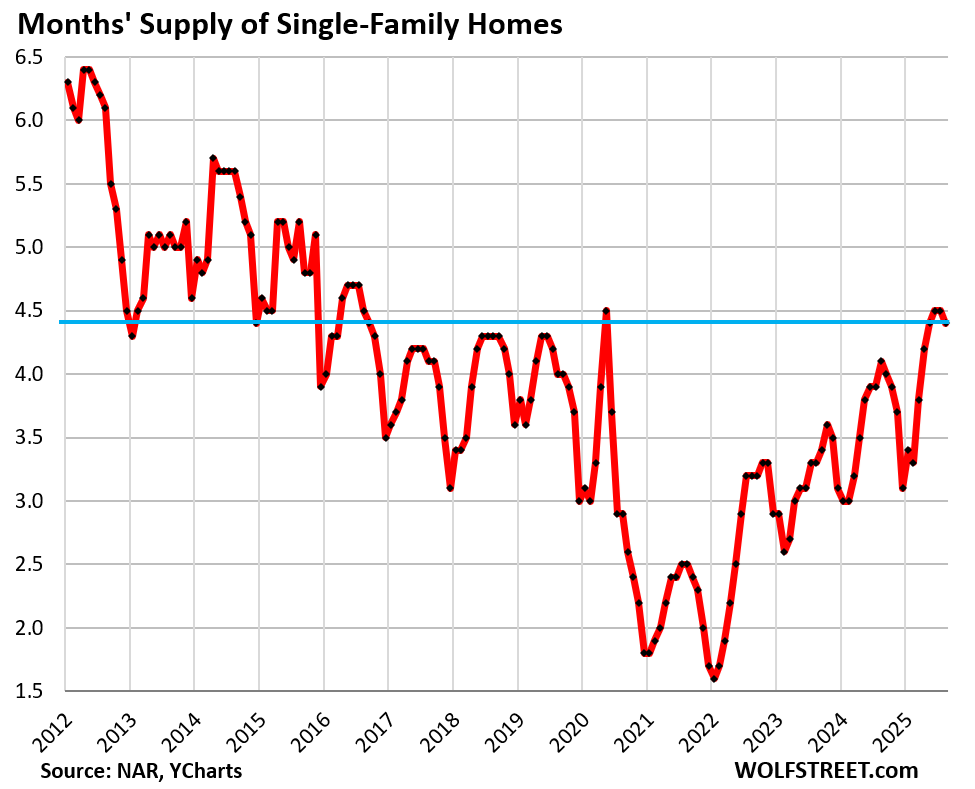
Supply of single-family homes has been soaring for the past two years and after hovering at 4.5 months in June and July, dipped in August to 4.4 months. A decline in August and in the rest of the year was often part of the pre-covid seasonal patterns.
The current supply levels are the highest since mid-2016, except for Lockdown May 2020 when closed sales had collapsed, thereby causing months’ supply to spike.
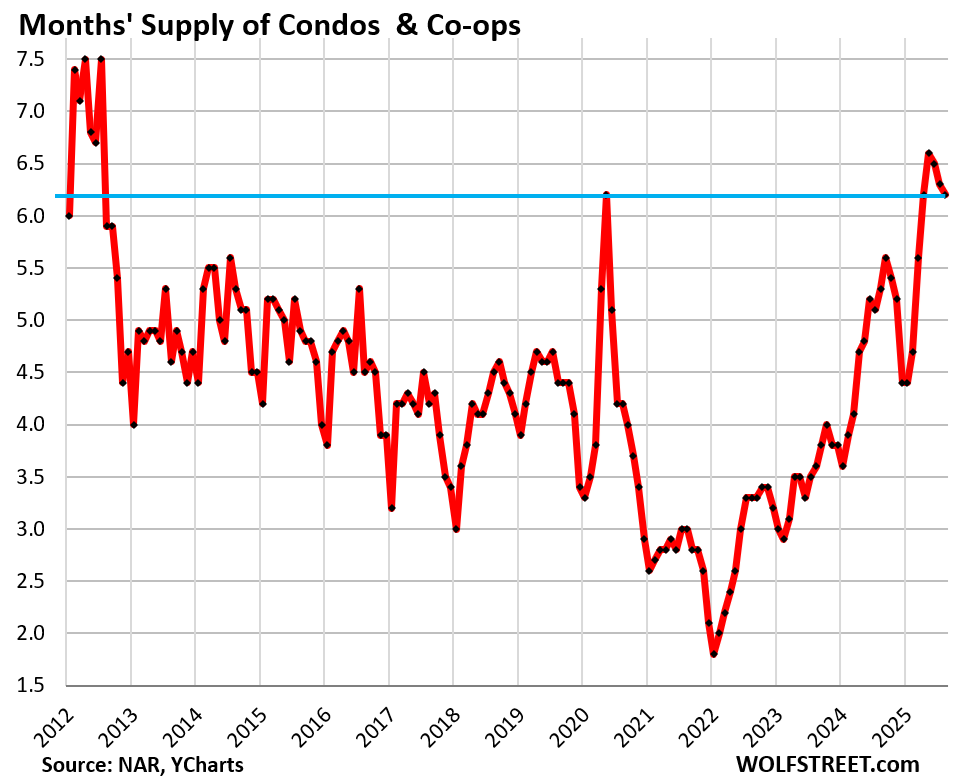
Supply of condos dipped to 6.2 months in August, from the highest levels since the Housing Bust.
This is about 40% more supply than in August 2019 (historical data from YCharts):
National price measures say nothing about individual markets.
Mortgage rates in the 6-7% range are back in the lower part of the historical range before QE in 2009 began to distort everything. Those mortgage rates are not the problem; prices are the problem. They exploded by 45% and more in a couple of years, from already very high levels after years of massive increases, and now they don’t make economic sense anymore.
Too-high prices cause demand destruction, and when prices drop enough, but not until then, demand reappears. Sorting that out is what markets are for.
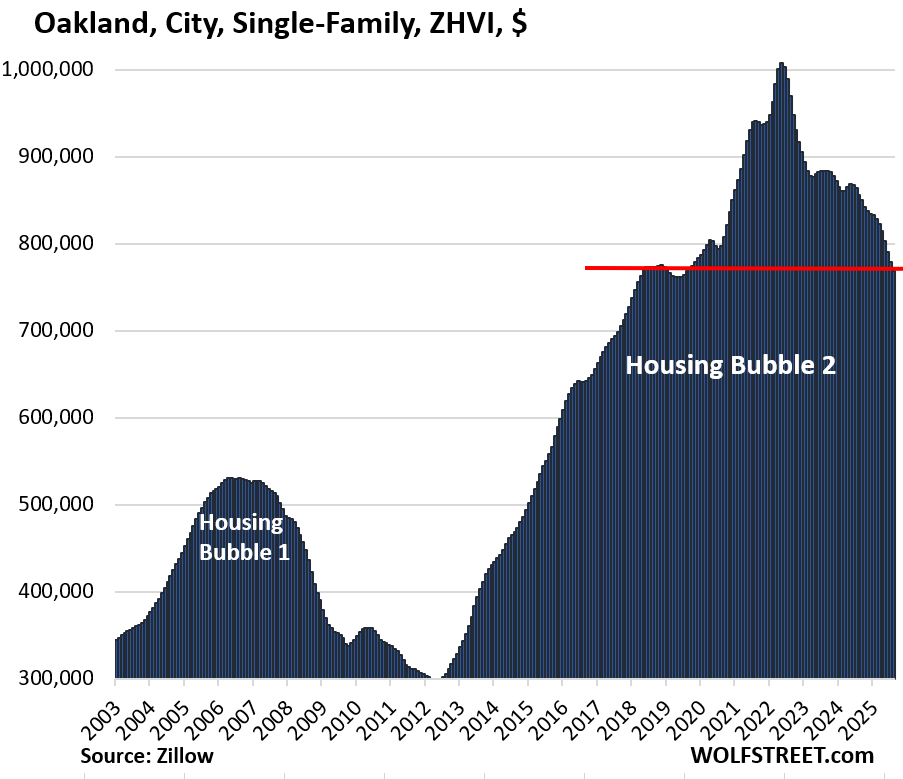
Prices have already dropped sharply in many markets. Here are the 14 bigger cities where prices of single-family homes have already dropped by 10% to 24% from their peaks, with Oakland and Austin booking the 24% declines.
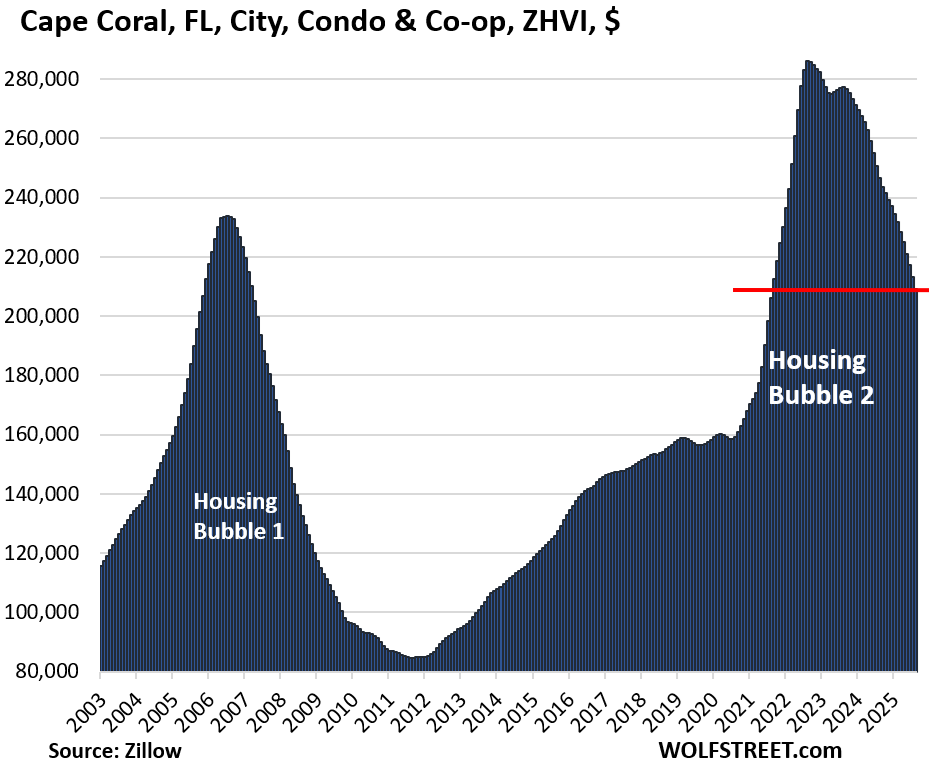
And here are the 25 bigger cities where prices of condos dropped by 12% to 27% from their peaks, with Oakland and Cape Coral booking 27% declines, and Austin a 25% decline. Condo prices in some of the most hyped markets in Florida are now in free-fall, after huge price gains.
Here is Cape Coral – this kind of price explosion in a two-year span is economically not sustainable and has to unwind:
There are other cities with somewhat smaller declines. And there are cities where prices have held roughly level.
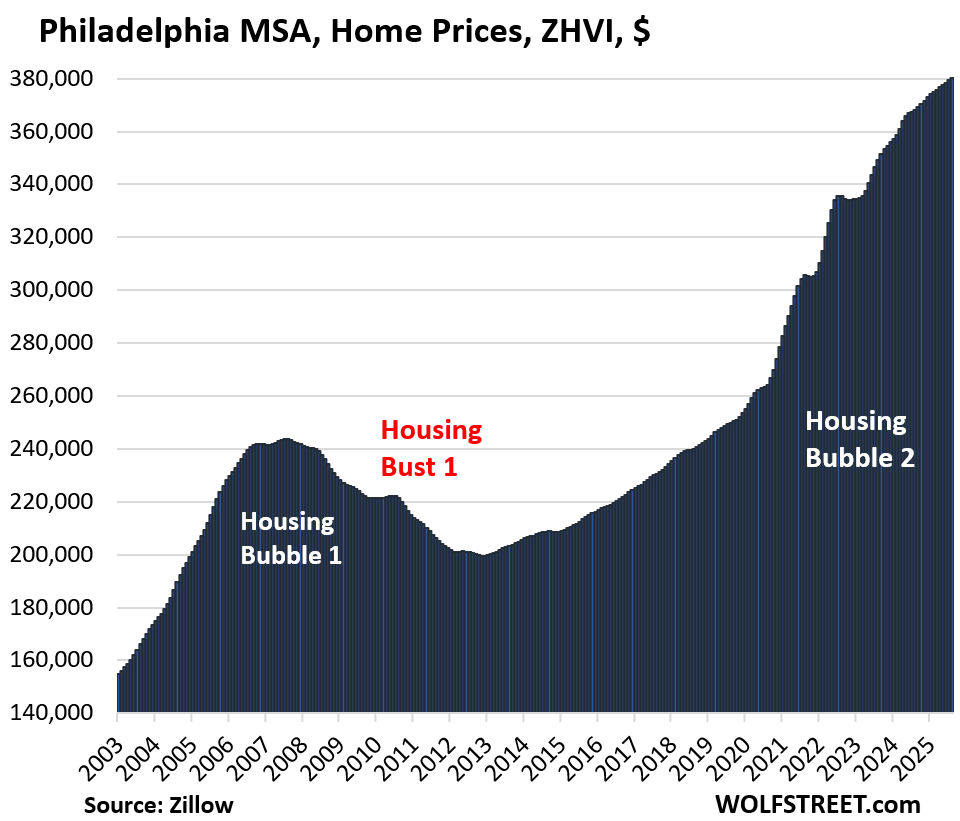
And there are cities with continued price gains, such as the Philadelphia metropolitan statistical area, single-family homes and condos combined:
So prices go market by market. Any national price index throws all these individual dynamics into one bucket and comes up with a national figure. And results may vary. Here are two national indices.
The National Association of Realtors produces a national median-price index of homes that sold. The median price is the price of the one home in the middle of all homes that sold that month. Shifts in the mix of what sold distort the median price, which is why the median price rises like clockwork in the spring when more higher-end homes come on the market and sell, which changes the mix of what sells toward the higher end, and shifts the median price higher. In the second half of the year, the reverse takes place, with fewer higher-end homes in the mix, and the median price shifts lower. That a shift in the mix of what sells moves the median price is the primary shortcoming of a median-price measure.
There are better measures of national home prices than the median price. For example, Zillow uses its “Database of All Homes,” which includes data from public records (property tax data), MLS, brokerages, local Realtor Associations, real-estate agents, and households across the US and includes pricing data for off-market deals and for-sale-by-owner deals. The data is far broader than the NAR’s data which only includes sales on the MLS.
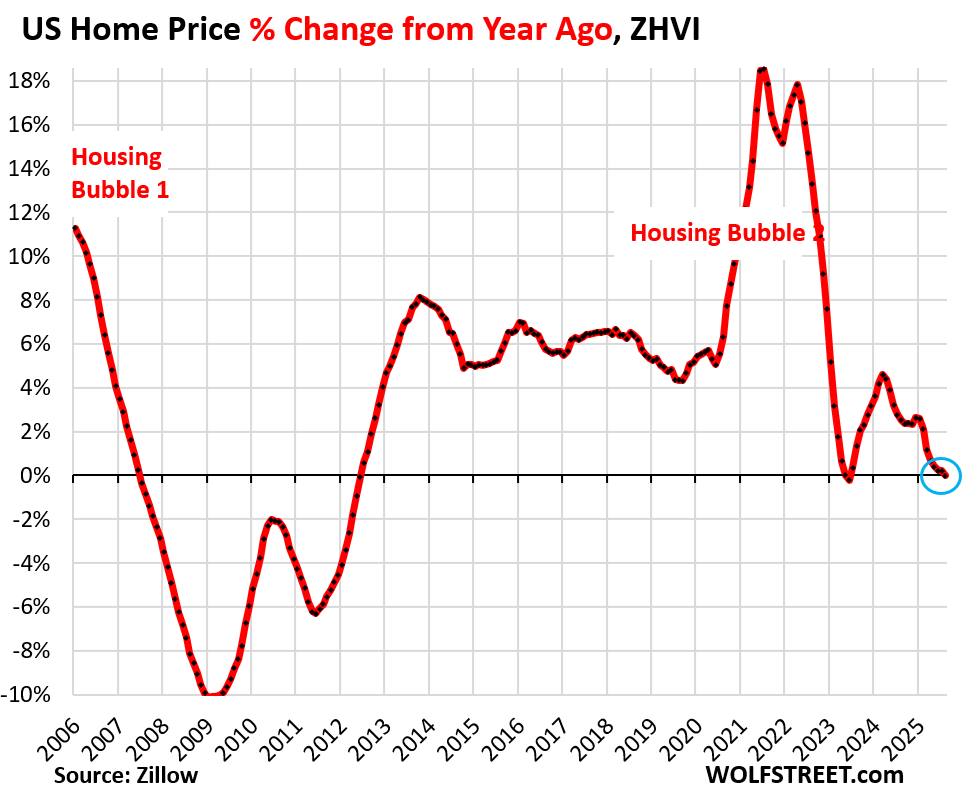
The Zillow Home Value Index uses prices of mid-tier homes (middle third). Focusing on mid-tier homes substantially reduces the distortions caused by shifts in the mix of the homes that sold that month.
The ZHVI, on a year-over-year basis, turned slightly negative in August (-0.2%). The index is not seasonally adjusted.
The index had spiked by 42% from mid-2020 through mid-2025.
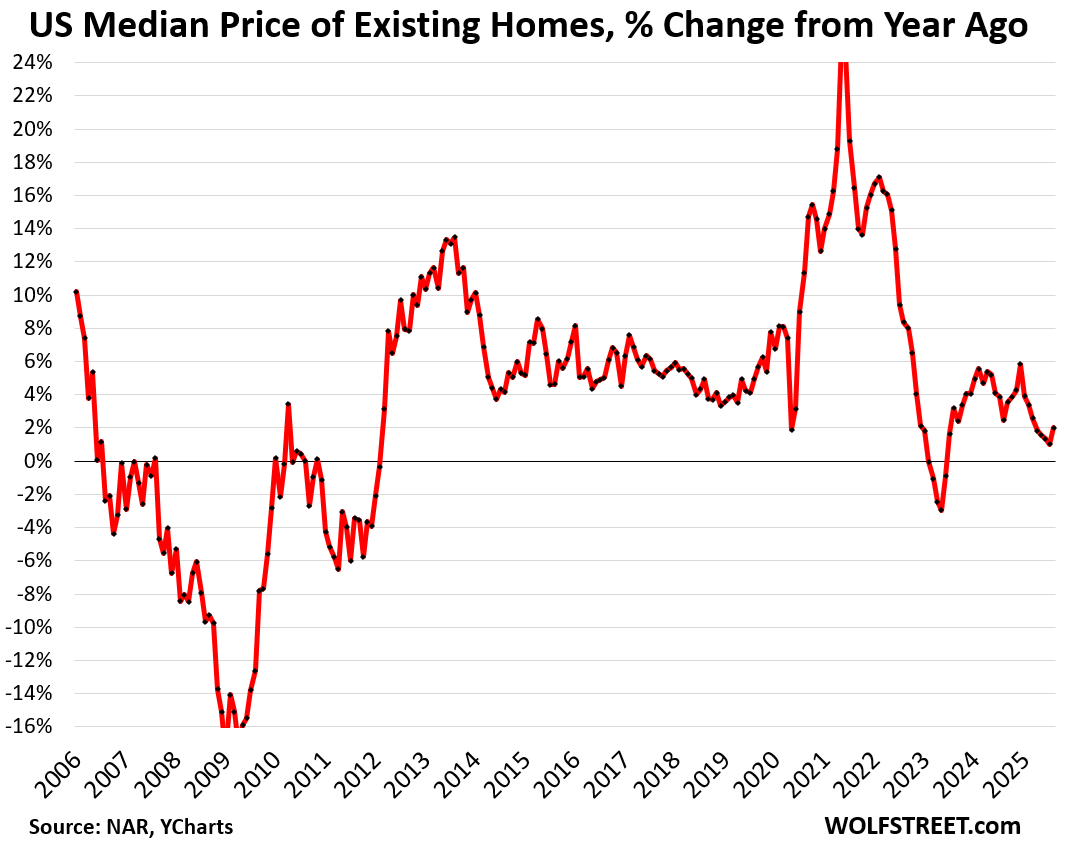
The NAR’s median price index soared by 47% from mid-2020 through mid-2025. The index is not seasonally adjusted.
The median price index, on a year-over-year basis, was up by 2.0% in August. The up-and-down month-to-month zigzag chaos is a result of shifts in the mix.
Enjoy reading WOLF STREET and want to support it? You can donate. I appreciate it immensely. Click on the mug to find out how:

![]()
CarMax sees surprise drop in used-car sales even at lower prices, and the stock dives
KMX -20.07%
CarMax has been on the forefront of jacking up prices, and consumers have had it, and CarMax is losing business to other dealers. If you want to buy an overpriced used car, go to CarMax.
Yep. They tried that with BMWs a few years back and got laughed off the parking lot! Yet, somehow, according to the WSJ today, CarMax became the largest seller of used cars in the US.
People like their no-negotiating model and their huge inventories. And CarMax leveraged that with high prices. But now they’re losing customers to other dealers.
This might interest you. Back in about 2001, we moved from the Washington DC area to Manhattan. But we didn’t want to own cars in Manhattan, so we sold both of our cars beforehand. I shopped my 2-year old 540i (a gem, minuscule miles) around to different dealers for a cash price, and it was rip-off city. Then I took it out to CarMax, they looked at it, drove it, checked Carfax, and wrote a bank draft for Kelly Blue Book (maybe trade-in value), which was far bigger than any of the dealers had offered, all within about 2 hours. Obviously, the car was a rarity on a used car lot, but they did the same with my then -fiancée-now-wife’s Ford. It was amazing. I thought they were overpaying for both. But they knew their customers and knew what they could get for those cars, and they probably made good money on them. The store was like a well-oiled machine, operated by salaried employees that did their jobs.
Interesting! Thanks for your detailed reply! We love our 540i and its one of the few in Oxford Green with Sand Beige interior.
I had a similar experience sellibg Carmax two cars around 5 years ago. Got higher prices than the others. Very easy to desl with Carmax.
Didn’t know Wolf had an E39! Best car ever made IMO. Anecdotally, Carmax and Carvana haven’t been out bidding us by much lately. We have been able to keep more trade ins. We like to move used cars quick so we price them right and they don’t stick around on the lot long.
The problem is Carmax went way too far with their prices. I just bought a new car and looked at Carmax. I was willing to spend just a little bit more to not deal with a dealer but CM was $3K more for the same model. I could actually buy a brand new model from the dealer for the same price as CM. 10 years ago you might have had to pay an additional $1K but had the option to buy their warranty so it was worth it.
I do like their inventory and hope they come back to reality when it is time to replace my wife’s car.
Going to be cheaper supply coming with the bankruptcy of Tricolor auto.
Yes, dramatic but one question…. What is your take if Fed cuts big?
We seem to be in a situation where inflation will have to be tolerated given the options otherwise are worse overall.
I see a free-for-all where some will win but most will lose in the Fed cutting that must happen as we are like an airplane about to stall… Car Max has issued warning on sales. Homes, Autos are the big economic drivers.
I think the Baby Boomer factors vis-a-vis all the real-time change of the economy which are at almost “light speed” in being understood after the damage is done to many buy the knowledgeable few. The upspoken reality seems to be scaring all the “in the know” players like yourself.
It is now highly unlikely that Federal Reserve will cut interest rates further at all this year as cutting overnight short term rates would just push mortgage interest rates much higher. Why cause more unneeded pain?
I’m not Wolf but my guess is that if mortgage rates were to fall to (random number) 5% or so is that there would be a small flurry of sales by people who only look at the rate. Sales would taper off quickly, though, because sellers would immediately raise prices and it becomes a wash for the buyer. The whole exercise just reinforces the stagnation in the market as buyers wait for lower rates, which are immediately offset by price increases as soon as they happen.
The only sane way out is a firm refusal to drop mortgage rates for a couple of years. Which may be difficult in this political environment.
To all the roller coaster designers out there, use that Cape Coral graph and just build something just like that, probably makes for a pretty exciting ride…kind of reminds me of the decommissed Superman ride at Six Flag…
To people that bought at the peak there…yikes, good luck…
It is a stark pattern but considering it’s roughly 80k in price, I bet they feel better than Oakland buyers which appear to be rapidly approaching a 250k haircut. Yikes!
Oakland is in real trouble. I was up there last month and it has the same charm as a Walking Dead set. It wouldn’t surprise me if it goes another 250k at this point.
We should soon see a return of price discovery as the ability to wontonly suppress foreclosure is legislatively knee-capped, come Oct 1.
Many here will remember the Wizard of Oz. The take away was when Dorothy meets the Wizard and finds that he is not anything like everyone thinks…. This was a major life lesson as a kid.
I had the opportunity to work in the CPA realm with ex White House Alum. Amazing what I saw. I also got to audit government programs. I still reel at what I saw in the NGO world with people asking for donations while driving BMW and Mercedes Benzs’ in the parking lot.
After business school and multiple masters degrees and different businesses I often returned to the lesson learned in the Wizard of Oz about how they tell you it is and how it really is…. I assert that much of what we hear, read, and see is not at all what it appears to be. Add the magic of tech and most of us are or will be toast in the future as opportunities to enjoy Capitalism diminish. Scary at best.
It is sobering to see the fear and loathing that permeates the in the emotion of outrage about what “is” the case.
Welcome to the Crypto Capitalism with the Hunger Games Society.
The FED and .gov f**ked the whole system with their greed, now they hold their official meetings and make up BS stories about the fake eCONomy and what’s going on.
How was the Federal Reserve in any way ‘greedy’ at all? Do you realize that they rebate 94% of their profits each year (if they have profits) to the US Treasury and this has always been the case.
You don’t think the individual members weren’t benefitting from what they did???
Big Club,
DC runs the Fed (despite ever more farcical claims of independence) much, much more than the various banks do.
That said, the entire banking system has infinitely closer ties to DC than is commonly understood (the entire banking system more or less functions as an operational arm of DC financial policies).
I’m not saying that individual banks and bankers don’t become rich/very rich.
But at the end of the day DC is the master of the US banking system in much more intimate ways than is generally appreciated.
Through interest rate setting (money printing) and a ton of other “regulatory” and “informal” controls, DC is much closer to running the banks than the reverse.
(Now, who really runs DC is a separate question…)
If some of those banks every decided to go truly rogue (in other words, go against general DC policy – loudly) DC would make life, very, very hard for them.
And note the overwhelming trend of banking industry consolidation – from 15,000 banks in 1990 to maybe 4,500 today.
Even as DC has made it much harder to launch de novo banks (as reflected in the numbers).
The banking system is a key channel for US government policy and DC will never willingly surrender that profound power/influence.
At this point it will be a loooong time before the Fed can remit anything to the Treasury.
Nobody benefitted from the central bank policies. That’s why we have nearly complete wealth equality across this great nation and a strong middle class. Most people can afford healthcare, education, childcare, and homeownership without issue. Rarely do households require 2 incomes. It’s not like the top 20% income holders are supporting the economy or anything weird like that. The policies enacted were for the benefit of the assetless majority, not the minority who hold nearly all the assets. There is no asset bubble that was created. It’s wonderful. Long live prosperity!
How much did their well heeled WScronies make?
“Mortgage rates in the 6-7% range are back in the lower part of the historical range before QE in 2009 began to distort everything. Those mortgage rates are not the problem; prices are the problem. They exploded by 45% and more in a couple of years, from already very high levels after years of massive increases, and now they don’t make economic sense anymore.”
“Too-high prices cause demand destruction, and when prices drop enough, but not until then, demand reappears. Sorting that out is what markets are for.”
Thank you for the great summary here. Yes, mortgage interest rates (i.e. 30 yr. fixed-rate) are in the normal range, but prices are unaffordable to the average shelter-buyer.
Yes, given the chance, and absent interventions, the housing market can find prices that the average shelter-buyer can afford. Free markets do this. Centrally planned, command-and-control markets, not so much. Adam Smith’s “invisible hand” vs. the very visible hand of .gov and the Fed.
I agree with your “Housing Bubble 1, 2” labels on the applicable charts above. While inconvenient for some, asset bubbles always burst. Corollary: the bigger the boom, the bigger the bust. Add in the near simultaneous AI stock bubble and this will in my view – all get really interesting soon. Humpty Dumpty.
Prior to the GFC the means-of-payment money didn’t increase for 4 whole years. The CPI even went negative in 2010, hence QE2 in November.
https://fred.stlouisfed.org/series/CPIAUCNS
Housing Bust #2 to date shows no such contraction.
“The CPI even went negative in 2010”
You should be old enough to remember: the price of oil had spiked to over $140 a barrel by mid-2008, which caused gasoline to spike, which caused overall CPI to exceed 5%. But then starting in July 2008, the price of oil began to collapse, and dropped below $40 by the end of 2008 and stayed below $40 till early 2009, which with a lag caused gasoline prices to collapse, which caused overall year-over-year CPI to turn negative. It was all energy driven. Core CPI, which excludes energy and food never went negative at all.
Looks like home prices at least need to go back to 2018-2019 levels i.e. pre covid to bring any sanity.
ThanksWR
Worse, since the rates are higher and are going to remain so.
Prices need to come down to 2012 levels for housing to finally recover.
Never underestimate how far a bubble can pop.
“Prices need to come down to 2012 levels for housing to finally recover.”
For me, comparing the levels of SFH inlation since 2000 relative to other macroeconomic metrics since 2000 tells the tale…housing has exploded in ways that other US “growth” metrics simply haven’t.
That strongly suggests to me that the levels of SFH “appreciation” since are far in excess of what is truly sustainable.
Just like in Bubble 1.0.
Using 2000 as a base year (and who is to say 2000 SFH prices weren’t already inflated)…
1% compounded price growth would yield 28% gains 25 yrs later.
2%, 64% 25 yrs later
3%, 109% 25 yrs later.
Many/most metros have SFH price appreciation post 2000 well in excess of those numbers.
But contrast that to the much slower growth in GDP numbers, median household incomes, etc. – all the supporting apparatus of home price affordability/sustainability over the same 25 years.
ZIRP (that is, money printing) deranged the linkages – but not fundamentally, not sustainably.
DC used ZIRP to use morphine to treat a gun shot US real economy.
Which of course isn’t a real treatment.
In fact, it is the opposite.
You could summarize this entire article with one sentence –
“The housing market is going to hell in a handbasket.”
Nonetheless, Mr. Wolf, you do have good info, and we love the charts.
I don’t think that’s an accurate summary LOL
the handbasket has long sloped sides. Kind of wavy.
It’s called ‘rotting away on the MLS.’ There are no buyers for a large percentage of what’s “for sale.” The young won’t be funding your retirement, greedheads.
If you are ever sitting around with time to kill pull up Zillow and look at Naples FL single family homes for sale. Note the hundreds of homes on the market for $2 million plus. Now pull up sales for the last 90 days… and note how different the profile of sold homes is from the profile of listed homes. It’s like the market is suffering from some sort of mass delusion.
Imagine purchasing a multi million dollar home with a hurricane bullseye target on it. They have had three hurricanes since 2000.
Transaction volume is about 70% of normal volume, so a large majority of potential buyers are still buying.
Not sure why they feel the need to buy at this moment. Everybody needs a place to live, but they don’t need to buy. And if they buy, they don’t have to pay a sonething fancy, and they don’t have to live near a coast.
I would never do something like that, so perhaps I’ll never understand. But I have a feeling I’ll be asked to pay for it via bailouts.
Look at the POLITICO AI article with Sam Altman on Super intelligence. I look at Politico to see what the enemy is thinking. I am delving into AI as it is worthwhile and you will see easily what is coming.
Im 70
I will not invest further and will focus on no mortgage, cars debt free, and enjoying my 100k retirement in a place like TN.
Did it occur to you that Altman has a horse in the race?
It is the realities created by AI, not Sam Altman, that I fear. Split second decision-making with the ability to beat human decision-making that cannot be over come by human reading of charts. In the past time was not as critical as it is today. It is access to real time data which few will ever have. To think you can overcome this is fools gold.
Every time I get closer to buying a 2bd condo in Oakland, you put out an update on that housing market. But something tells me I’m not the only one who thinks 340k for a 2bd in a 1960’s building is still a little insane. Wonder if we’ll get to 100k per bedroom in condos next year
2b2b condo built in 60’s or 70’s listed around $1.5M in coastal cities of 🍊 county CA. 😊
Interesting time indeed!
I wonder how much this housing market since plandemic reflects the sentiment toward 💸.
Though slow homes listed @ ridiculous price are still sold @ where I am, even it needs so much LTC 😮
Makes me wonder whether something other than affordability or supply / demand are driving buyers into this market as a way to preserve their assets.
Most can understand yield on T-bills so easier for them to think houses serve to purpose of preserving purchasing power in the long run while cost of homeownership is very high especially if we consider opportunity cost of what could have been invested 🧐
Cheaper dollar enables foreigners to buy US properties at a discount?
I don’t know anything about the US housing market, but if most existing homes are sold through Estate Agents, don’t the agents have a massive incentive to tell their clients that if they want to sell, they need to cut the price by 20% or so? Are the agents useless at selling that idea to potential clients or do they just not care – if they get paid anyway for advertising the home at a hopeless price?
If you’re the selling agent, the homeowner will fire you if you don’t say what the homeowner wants to hear. It’s very hard to tell your client that they should give up $200,000.
President Trump is about to help older people sell homes. I hear that he is considering eliminating capital gains for over 65s entirely if they have lived in their homes for 10 or more years. Therefore, big old vacation homes could be reduced in price by $200, 000 per million of appreciated value. Big families needing big houses and seniors needing to downsize would gain greatly from this tax change.
What utter nonsense. Do you really think that seniors selling houses are going to reduce their listing prices because they don’t have to pay capital gains? They already are exempt for $500,000 in gains if married, which means very few houses are even subject to this outside of very HCOL areas.
If this is implemented, which I hope it isn’t, it won’t mean that families will get a better deal on houses. It’ll be a gift to people who don’t need its
I’m sorry but it’s not clear from your post why this is different from the current situation.
Ap – given our changes in immigrant demographics, and that families in ‘first world’ countries tend to trend smaller,you might find the days of ‘big’ ‘Murican families have well-passed…
may we all find a better day.
This right here is the truth. I work full time in brokerage, mostly middle market CRE. There’s a fine line to balance of telling sellers what they want to hear while being realistic/objective in order to facilitate a transaction. Most of the time, these sellers will give the listing to whichever scab tells them what they want to hear.
The house once owned by Johnny Carson in Malibu, CA was just listed today for $110,000,000 and sits on 4 acres and has 7,100 square feet including its 2 bedrooms, not to mention a live tree growing in a closed in court in the middle of the house. It last sold for $46,000,000 in 2007 and current listing price is $64,000,000 than when it last sold. If folks are shopping for a beach house in SoCal it is certainly one to check out!
California mansions are just places for the ultra wealthy to park their money and avoid taxes. That’s why it’s $110 million. Same thing with billionaires row in Manhattan where hardly anyone lives.
Housing prices have a long way to drop to be consistent with the average wage. Like incomes, the housing “market” will become even more bifurcated. Prices in the good neighborhoods will remain high. I am amazed by the “extend and pretend” that continues in the commercial space.
Interesting times.
The ten year yield is no longer being displayed at the top of the CNBC bond link. Gee, I wonder why….
Go ahead Tumpty-dumpty, fore Jerome to lower rates, I triple dog dare you. You can still get to the chart, 4.16% as of this typing. Wolf and I agree, they may lower the FFR, but the bond market knows that the Fed is going to let inflation run wild.
Hedge accordingly
I’m sure trump read this comment
Good to see such optimism!
LOL!
The FED dare not trigger a recession as tax receipts would fall. Deficit spending is already out of control. N-gDp level targeting at work.
There’s an article on CNBC today that says that consumer sentiment dropped across most of the population. The one exception was people with a lot of stock holdings.
So basically, if you have tons of stocks, you’re thrilled because there’s a perception that the Fed will put a floor under your new found but hard earned,”wealth.”
If you don’t, you’re unhappy.
Great society that our leaders have created!
Stocks have had it. The bubble will now burst.
That clickbait BS on consumer sentiment is just beyond BS. People need to quit posting it. It’s split along political lines. Republican sentiment is high, and Democrats’ is low. This includes the BS U of Michigan survey, with a huge difference between the two, that then doesn’t get average out. This stuff is just beyond garbage. They’re not “consumer sentiment surveys” — they’re “political leaning surveys.”
Look at the f***ing details of the U of Michigan survey, you’ll see, don’t just use CNBC headline clickbait BS of the survey to construct a stupid-ass theory on it.
Oh, I absolutely agree that it’s just a BS political poll. But, if sentiment is higher among the top few percent with a lot of stock holdings after controlling for other factors, couldn’t that still be worthwhile?
The surveys themselves are BS. They produce nothing worthwhile, just clickbait.
Off-topic but I’m wondering what people think will happen to interest rates and the stock market if the government shuts down next week?
This housing market makes me really nervous. I was in a situation where I needed to buy something about 3 years ago. Inventory in my price range was mostly garbage needing tens of thousands of work. I want to get out of my home and build something that suits me, but if this market pops before then, I’m screwed as far as being able to sell and go elsewhere. Luckily I’m close to the Chicago Metro area which hasn’t seen price declines yet.