Oakland, Austin, New Orleans, Cape Coral, San Francisco, Birmingham, Washington DC, Fort Myers, Denver, Portland, Phoenix, Sarasota, Naples, Hayward.
By Wolf Richter for WOLF STREET.
In 14 bigger cities, prices of mid-tier single-family homes have dropped by 10% or more from their peaks through August, seasonally adjusted. In two of them, prices have dropped by 24%.
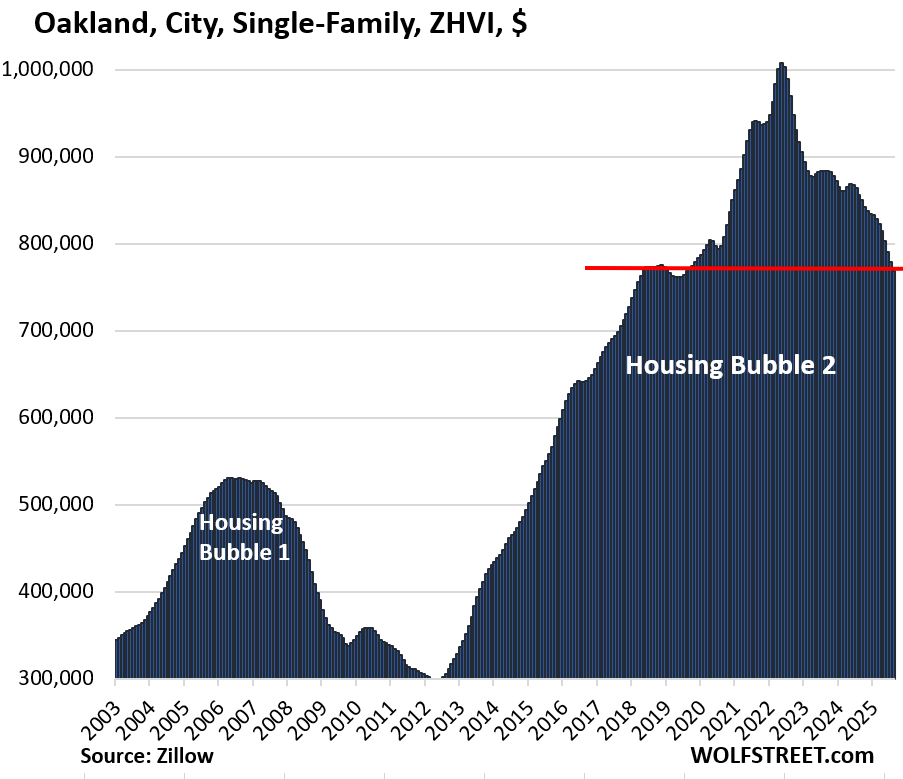
- Oakland, CA: -24%
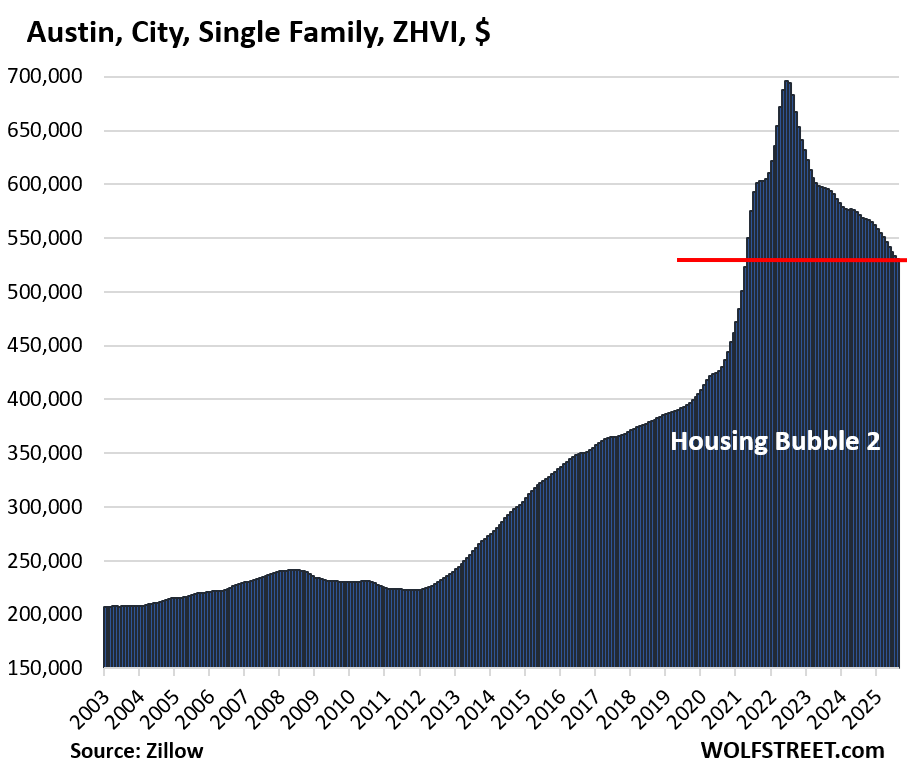
- Austin, TX: -24%
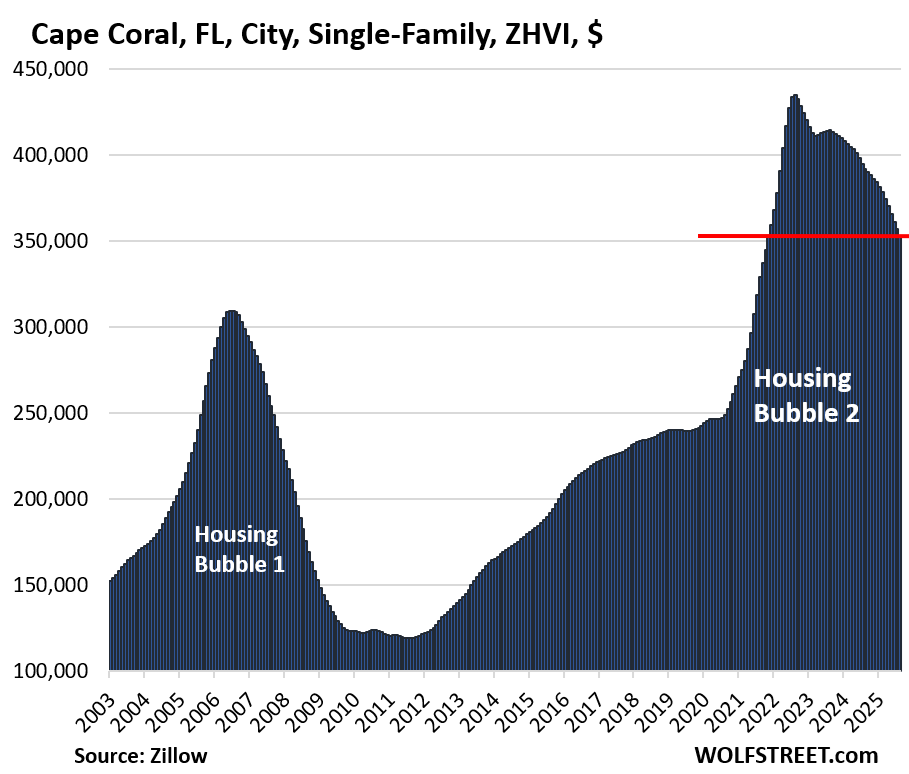
- Cape Coral, FL: -19%
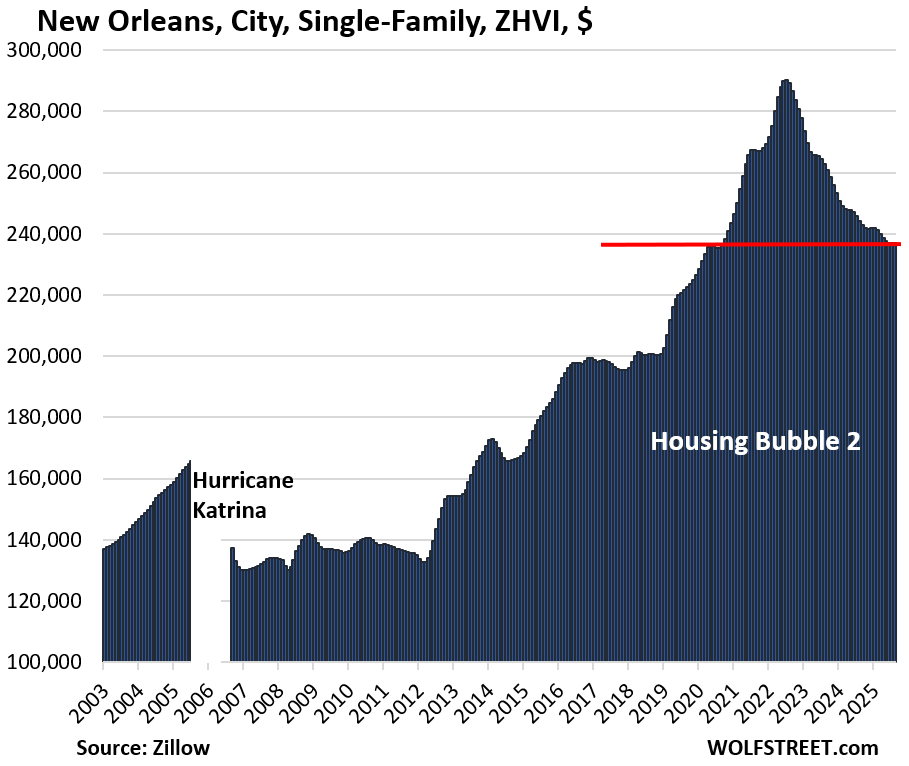
- New Orleans, LA: -18%
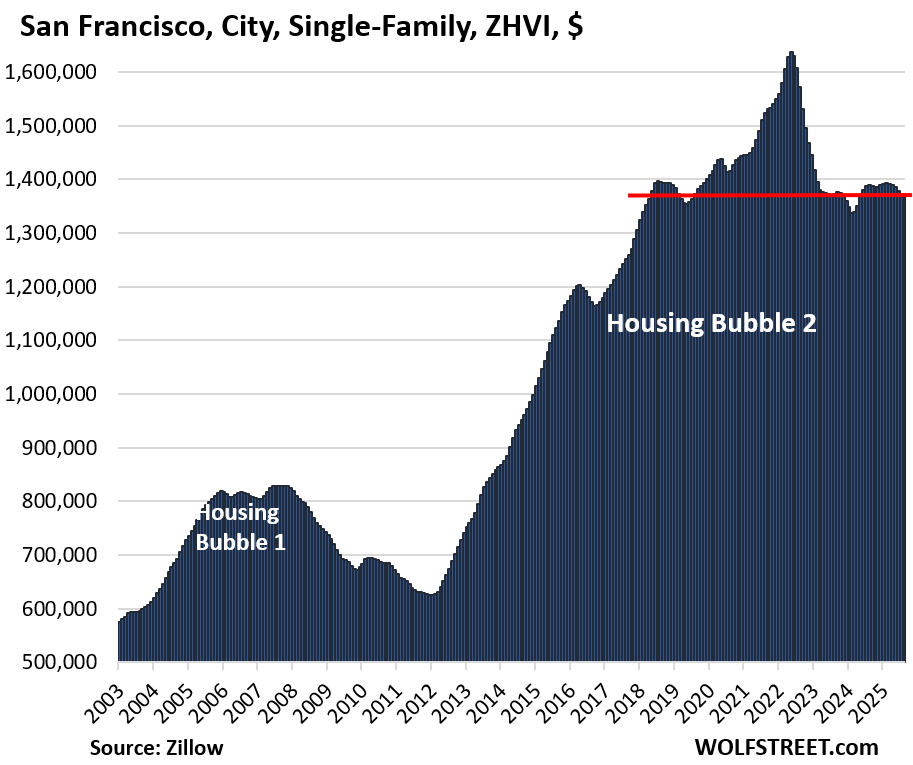
- San Francisco, CA: -16%
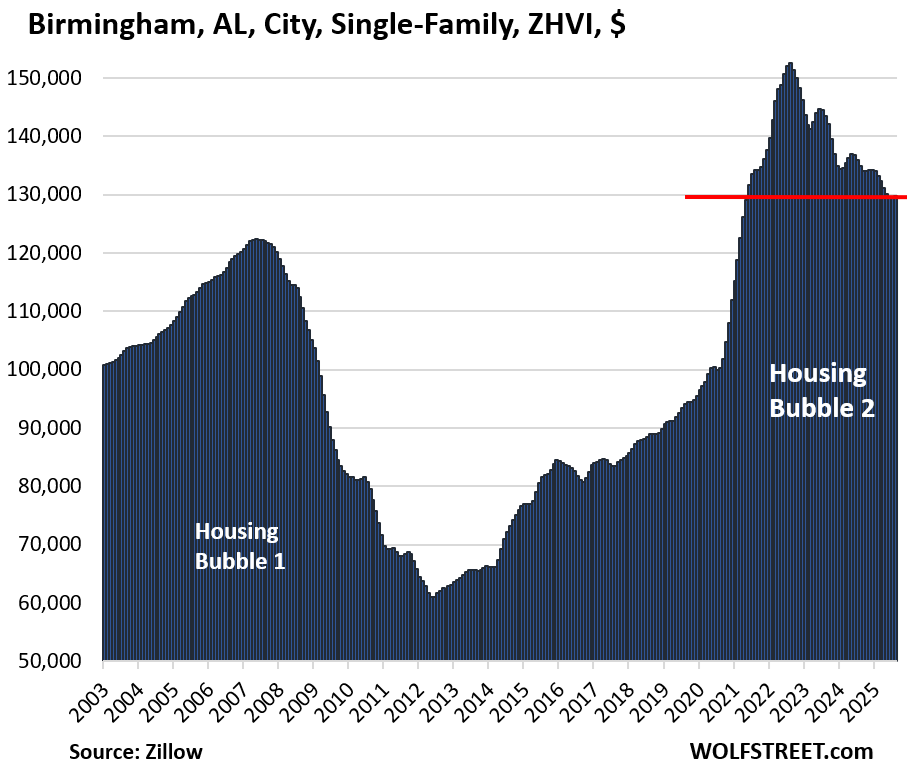
- Birmingham, AL: -15%
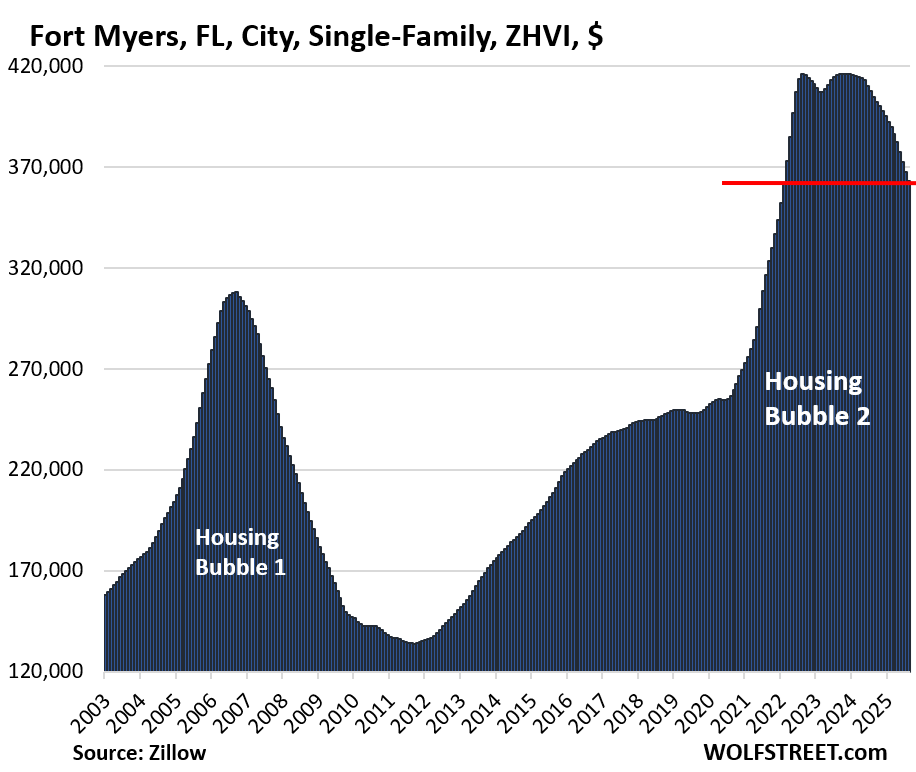
- Fort Myers, FL: -13%
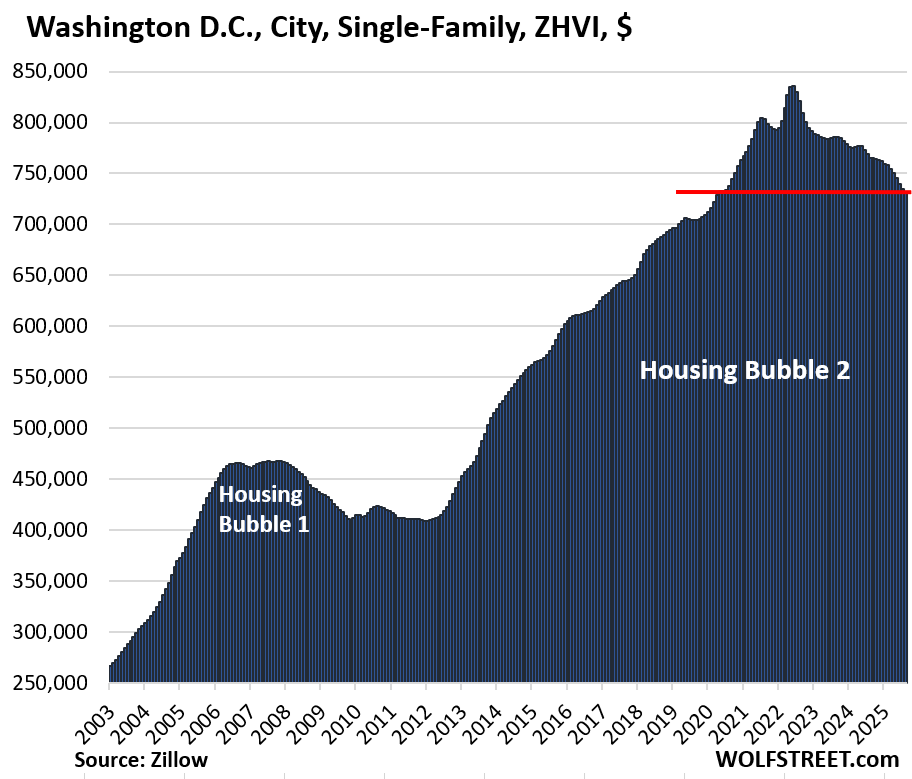
- Washington, DC: -12%
- Sarasota, FL: -11%
- Denver, CO: -10%
- Portland, OR: -10%
- Phoenix, AZ: -10%
- Naples, FL: -10%
- Hayward, CA: -10%
There are many other bigger cities where single-family home prices have declined but haven’t made the 10% cutoff, such as Los Angeles and San Diego (both -4% from the 2024 peak), San Antonio (-8%), Dallas (-6%), Fort Worth (-9%), San Jose (-5%), Atlanta (-5%), Memphis (-7%), Tampa (-6%), Seattle (-7%)…. Each monthly decline gets them closer to the double-digit zone.
In some other cities, prices of single-family homes have continued to rise or have flattened out.
Condo prices have been on the forefront, skidding faster in more cities than prices of single-family homes: Condo Prices Dropped by 12%-27% in these 25 Bigger Cities through August.
Entire pandemic price spike got wiped out in 4 of 14 cities. But in these four cities, the 2020-2022 price spike, though substantial, was much smaller than the price explosions in other cities. See charts below.
- San Francisco
- Oakland
- Washington, DC
- New Orleans.
Month-over-month, seasonally adjusted, single-family home prices declined in 13 of the 14 cities in August (exceptions: New Orleans, no change; Birmingham, +0.3%), topped off by:
- Oakland, CA: -1.3%
- Fort Myers, FL: -1.2%
- Sarasota, FL: -1.2%
- Naples, FL: -1.1%
- Cape Coral: -1.1%
- Hayward, CA: -1.1%
Year-over-year, prices declined in all 14 cities in August, topped off by:
- Fort Myers: -10.3%
- Oakland: -10.2%
- Cape Coral: -9.9%
- Sarasota: -8.9%
- Naples: -7.6%
- Hayward: -7.1%
- Austin: -6.8%
Methodology and data: These prices are seasonally adjusted three-month averages of single-family mid-tier homes in “cities” (not in Metropolitan Statistical Areas, which are much larger). All data here are from the Zillow Home Value Index (ZHVI), which is based on millions of data points in Zillow’s “Database of All Homes,” including from public records (tax data), MLS, brokerages, local Realtor Associations, real-estate agents, and households across the US. It includes pricing data for off-market deals and for-sale-by-owner deals. These are not median prices.
The 14 Cities with the biggest price declines:
The metrics in each table from left to right: price decline from the peak, month-over-month change (MoM), year-over-year change (YoY), and the remaining increase since January 2000 (since 2002 for Birmingham).
| Oakland, City, Single-Family Home Prices | |||
| From May 2022 peak | MoM | YoY | Since 2000 |
| -24% | -1.3% | -10.2% | 280% |
Another massive 1.3% month-to-month drop in prices of these mid-tier single-family homes, after -1.5% in July, -1.6% in June, -1.4% in May!
Back to May 2018, having wiped out the entire 24% price explosion in 2020-2022, plus some.
In the decade between mid-2012 and the peak in May 2022, prices had exploded by 236%, which was nuts.
| Austin, City, Single-Family Home Prices | |||
| From Jun 2022 peak | MoM | YoY | Since 2000 |
| -24% | -0.5% | -6.8% | 167% |
Retracing more than half of the 63% price explosion in 2020-2022, with prices back where they’d first been in May 2021.
| Cape Coral, City, Single-Family Home Prices | |||
| From Aug 2022 peak | MoM | YoY | Since 2000 |
| -19% | -1.1% | -9.9% | 217% |
Despite the big drop, prices are only back to late 2021, having backed out only the last nine months of the 76% price explosion from mid-2020 to mid-2022.
These kinds of housing charts are just incomprehensible, other than as a work of human mania driven by FOMO and free money.
| New Orleans, City, Single-Family Home Prices | |||
| From Jun 2022 peak | MoM | YoY | Since 2007 |
| -18% | 0.0% | -2.9% | 108% |
Back to September 2020, having undone nearly the entire price spike of 23% between mid-2020 and mid-2022.
| San Francisco, City, Single-Family Home Prices | |||
| From May 2022 peak | MoM | YoY | Since 2000 |
| -16% | -0.1% | -1.2% | 233% |
Back to where prices had first been in April 2018. The entire 2020-2022 price spike of 13%-plus-some has been reversed.
Prices had exploded in the six years through mid-2018, doubling from $700,000 in late 2012 to $1.40 million for a single-family mid-tier home. At the beginning of the pandemic, they were at $1.44 million. Over the following two years, prices spiked by “only” 14%. So the 16% price decline wiped out those gains, plus some.
| Birmingham, AL, City, Single-Family Home Prices | |||
| From Jul 2022 peak | MoM | YoY | Since 2002 |
| -15% | 0.3% | -3.7% | 32% |
From mid-2020 to mid-2022, prices spiked by 53%. Only a little more than one-third of that increase has now been backed out.
| Fort Myers, City, Single-Family Home Prices | |||
| From Aug 2022 peak | MoM | YoY | Since 2000 |
| -13% | -1.2% | -10.3% | 191% |
Lowest since February 2022. Prices had exploded by 62% in two years to mid-2022. Only the last five months of that explosion have been backed out so far.
| Washington D.C., Single-Family Home Prices | |||
| From Jun 2022 peak | MoM | YoY | Since 2000 |
| -12% | -0.5% | -4.4% | 272% |
Lowest since May 2020, having undone the entire 13% price spike from mid-2020 to mid-2022.
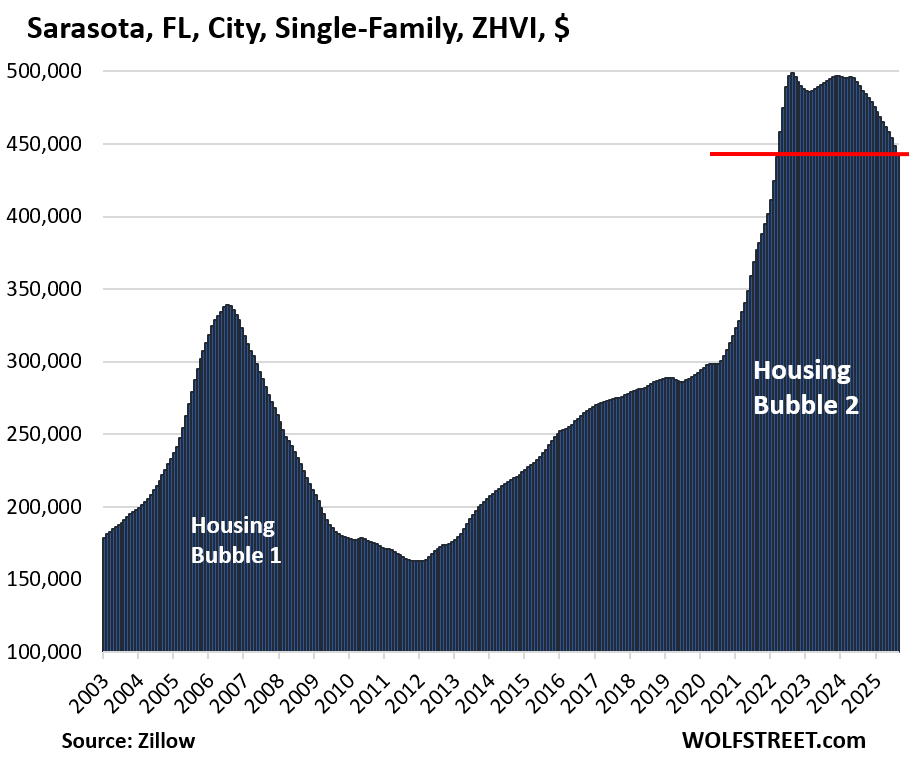
| Sarasota, FL, City, Single-Family Home Prices | |||
| From Aug 2022 peak | MoM | YoY | Since 2000 |
| -11% | -1.2% | -8.9% | 230% |
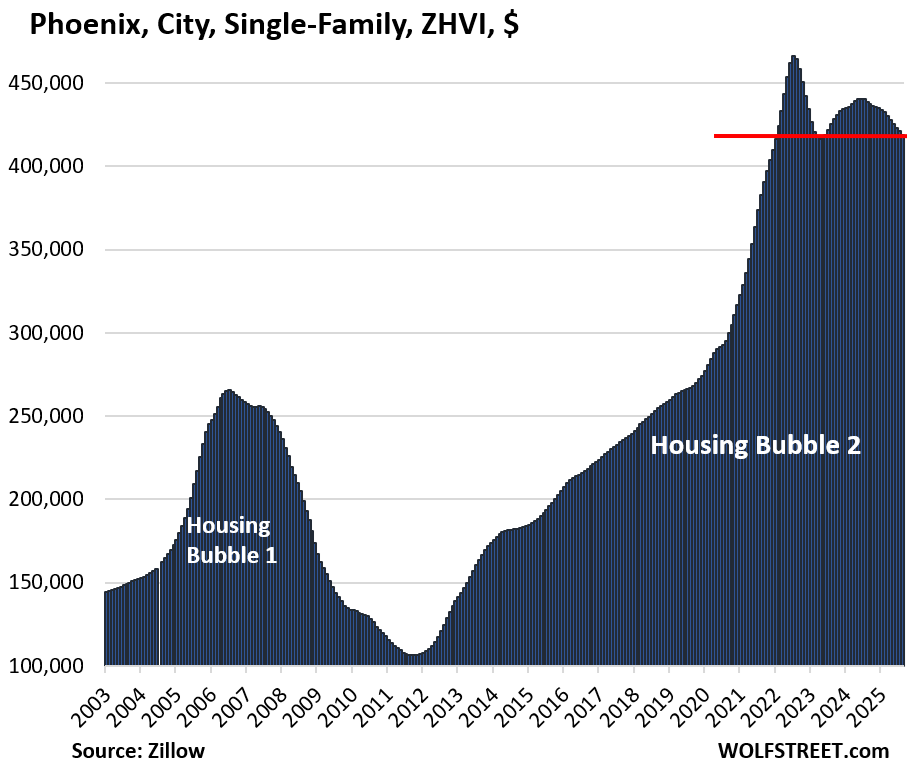
| Phoenix, City, Single-Family Home Prices | |||
| From Jul 2022 peak | MoM | YoY | Since 2000 |
| -10% | -0.4% | -4.5% | 249% |
Back to January 2022, having barely made a dent in the effects of the 60% two-year price explosion to mid-2022.
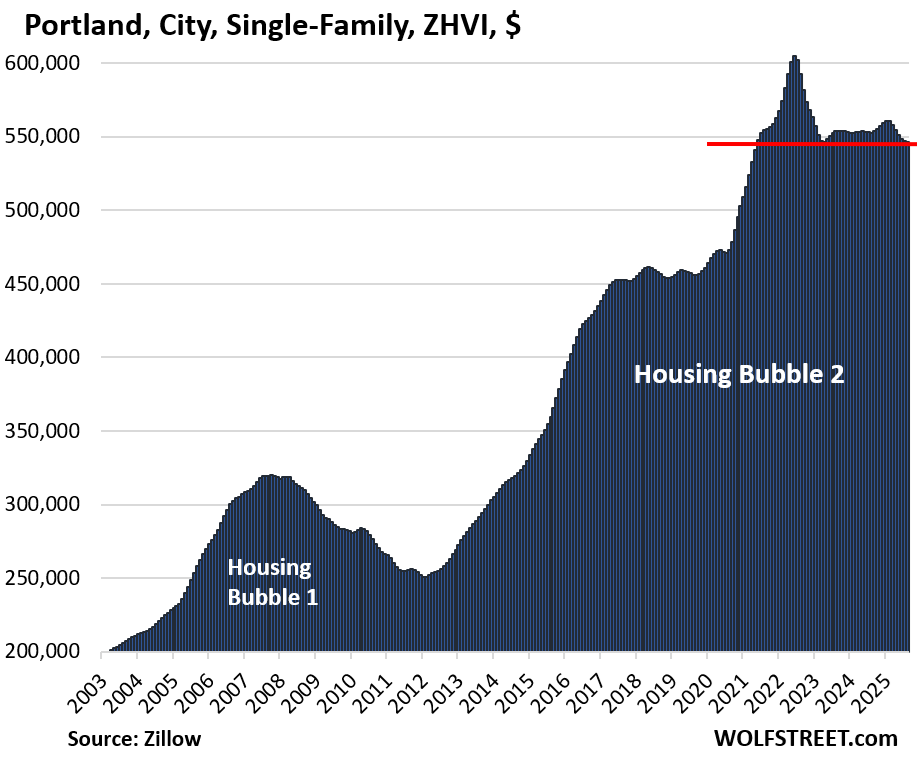
| Portland, City, Single-Family Home Prices | |||
| From May 2022 peak | MoM | YoY | Since 2000 |
| -10% | -0.1% | -1.1% | 222% |
Lowest since May 2021.
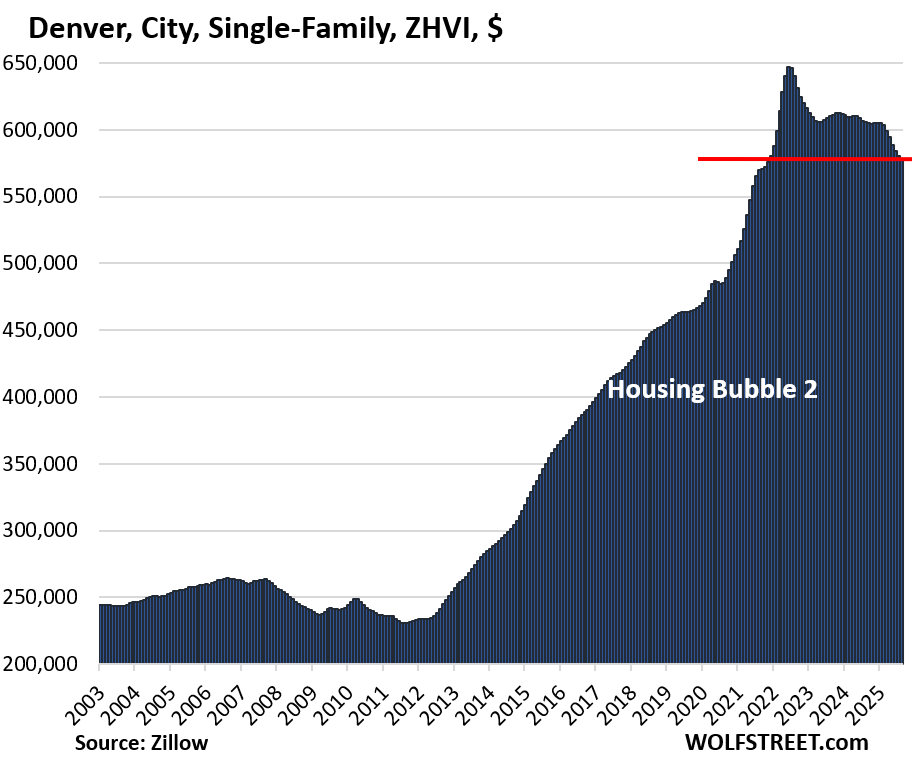
| Denver, City, Single-Family Home Prices | |||
| From Jun 2022 peak | MoM | YoY | Since 2000 |
| -10% | -0.3% | -4.5% | 212% |
Back to November 2021.
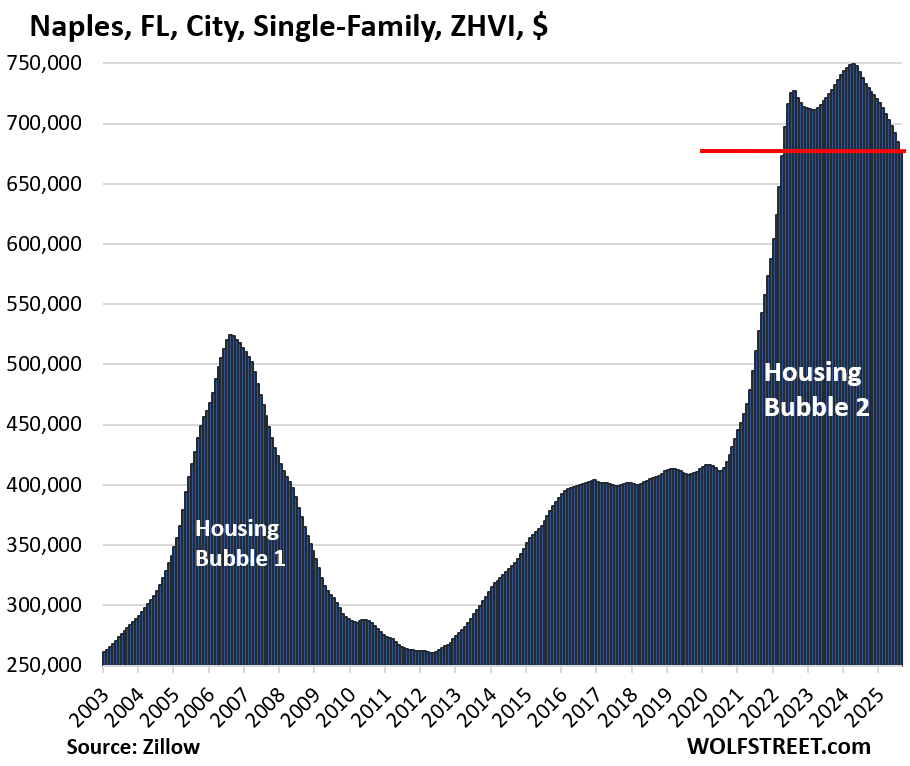
| Naples, City, Single-Family Home Prices | |||
| From Apr 2024 peak | MoM | YoY | Since 2000 |
| -10% | -1.1% | -7.6% | 249.6% |
Just the very tippy-top of the insane 76% two-year price explosion has been shaved off.
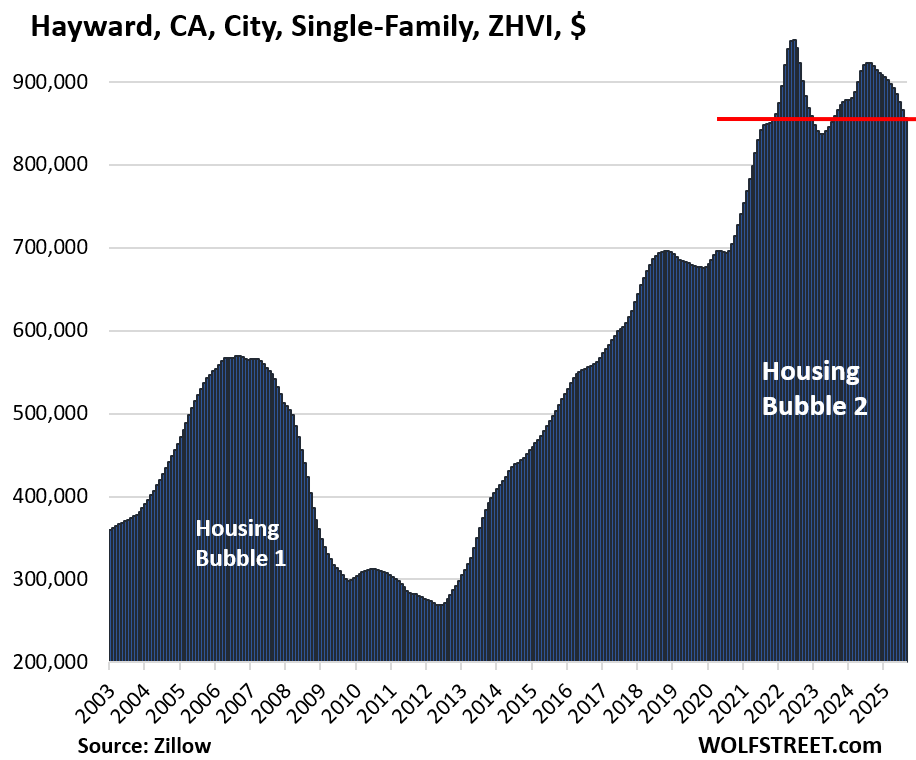
| Hayward, CA, City, Single-Family Home Prices | |||
| From Aug 2022 peak | MoM | YoY | Since 2000 |
| -10% | -1.1% | -7% | 276% |
Prices in this East Bay city had exploded by 35% in two years to mid-2022, and by nearly 300% in the 10 years from 2012 to 2022.
And in case you missed it: The Most Splendid Housing Bubbles in America, Aug 2025: Price Drops & Gains in 33 Large Expensive Metros. Overall US Home Prices Fell YoY
Enjoy reading WOLF STREET and want to support it? You can donate. I appreciate it immensely. Click on the mug to find out how:

![]()
It’s quite interesting to see Oakland and SF going back to 2016/2017 level…you talk to people from just a year or two ago, they would bet asteroid would hit us first before thinking about there’s possibility it can retrace back to pricing almost a decade ago. Looks like it’s not done yet, will be interesting to see what this will look like in the next couple of years.
Wonder if the people in NorCal learned their lesson yet? That level of hubris thinking is still rampant in SoCal, guess we’re behind compare to NorCal. Chino Hills or Irvine back to 2016/2017 pricing? Never….
I think people tend to forget that there were large demographics shifts that affected the rise and current fall of prices in some of these cities. AFAIK, SF had a net outflow of people during the pandemic, so it will see a larger decline as compared to a city in the IE, which most likely saw a large influx of people moving in due to cheaper COL.
CA Inland Empire ( RiverSide County for example ) would fall hard. It’s a matter of time. The income there does not support absolutely support the monthly mortgage outlay. One can think about paying top dollars for SFO as SFO being a pretty interesting and big city but I can’t think about anyone paying lots of money in IE which is in the middle of nowhere in the desert.
During last bubble, IE fell hard, I guess this time it’d fall harder.
I am in IE and there has been a ton of new housing put up here. Mostly in Hemet/winchester/san Jacinto/french valley/coachella/beaumont. lowest Price of new 3/2 1500 lennar home is now under $400.000 with incentives. IE will be hit hard, too many ghost homes out here. Also Riverside county has large nos of foreclosures in pipeline.
* IE = Inland Empire = area around the cities of Riverside and San Bernardino, in Southern California
Yeah IE has always been the canary in the coalmine, at least it did last time and shouldn’t be different this time.
Also, it already irks me when I see crapshack asking for a million in decent part of OC or LA, small tiny house, not renovated…etc. However, when I see that crap in Norco or Chino, I can’t help but mutter GTFO…well unless you want overpay in Chino and enjoy that year around cow dung smell…
The heavily populated parts of the IE aren’t middle of nowhere or desert. I was visiting a friend in Corona and my impression is that it was solidly middle class, urban/suburban, and had a similar vibe that you would find in much of suburban L.A county. It didn’t have a desert landscape. You would have to go out further to places like Victorville or Hesperia to be out in the desert.
LOL Corona is not Hemet. Corona median HH income = $106,438. Hemet median HH income = $59,966. Corona is directly on the border of Orange County – just inland from Yorba Linda. Hemet is out in the middle of the desert with no water and no infrastructure and nasty cookie-cutter developments as far as the eye can see. Try to drive on highway 74 from one side of Hemet to the other… 26 stop lights later (I just counted) let me know about your state of mind.
Looked at Lennar in IE. NOT TRUE. Anything close to the prices mentioned are in areas way out of the main areas like Temecula, Murrieta, and Winchester.
San Francisco saw a population decline of 10% and little to no recovery since.
Chinese would but a perfectly built mansion in Hillsborough and level it.
They would then build another mansion to Their liking.
Lots of foreign millionaires in the Bay Area.
That’s good. I hope they take over the city government. They’re pragmatic enough to clean up that city. I was fortunate to visit that city several time in the 1980’s and early 1990’s. It was a fun place. Yeah, had some weirdo’s, but was magical to me as an carefree young guy.
When I moved to California 2001, I went to SF and saw all these bums on Market St. Lots of bums and derelicts. I knew it changed and never cared for it afterwards. I visited it over the years and very depressing.
Would I buy something there if prices tanked like during the Financial Crisis of 2008? Sure would, but I’d be looking to support some conservative Asian guy for Mayor.
Thing is Oakland and SF had their covid level boom about 10 years early too.
In addition to larger macro trends, there are some other factors that might be specific to Oakland.
1. Oakland is struggling with crime, huge deficits, declining or absent basic services brought on by years of bad leadership and bad policies of ultra progressive politics.
2. In terms of buying property to rent out the laws have become extremely anti-landlord / pro tenant.
3. Lastly, a lot of new supply had just come online in downtown during COVID.
How do you explain Austin, Texas which has fallen just as hard?
(Paraphrasing Tim O’Toole) Texas is struggling from something similar to Oakland but in the other direction.
1. Texas is struggling with years of bad leadership and bad policies of ultra regressive politics.
2. Too many people rushed into Texas after seeing the price tag of the houses without understanding what the place is all about. Lot of people are wondering how to make an exit.
3. Lastly, a lot of new supply had just come online during COVID.
LOL.
That is part of a broader shift as SCOTUS made its support of “states rights” clear. As conservative states got way more conservative, people who didn’t want that lifestyle started to out migrate. On the flip side, people who did want the lifestyle migrated in.
@ Sandy,
Most people move for jobs or lower cost of living, some for family, climate, recreational amenities, or taxes, not many for politics.
The fastest growing states of the last 20 years in order are UT, ID, NV, TX, and AZ. Mountains or warmer climate, jobs, and low taxes would be the common denominators in that mix.
The slowest growing in reverse order are WV, IL, MI, LA, and MS. NY is the next state on the list. Rust belt with cold winter, or very poor deep south, or large high tax urban state are the common denominators, jobs being the obvious reason those states are not growing.
Austin has had Democratic mayors for the last 25+ years. So, regressives calling themselves progressive.
I am not familiar w Austin but maybe someone else can?
Tons of liberals moved to Austin, due to it being a tech center and its liberal, “keep Austin weird” vibe. But after moving there, these people found out Austin has terrible traffic, is not well run (another Dem city), and the state as a whole is much, much more conservative, so the Legislature passes conservative laws. Some of the people who didn’t really understand what it was like in Austin/Texas when they moved there are now moving out, word about Austin not being a liberal paradise got around so not many people moving in, and thus prices are dropping.
I think it’s the weather. Austin is HOT and HUMID. If you’re from CA, those two don’t go together. You get cool to comfortable and maybe humid along the coast, or hot and dry inland (where not that many people live.) Austin’s long summers are a shock to your system if you aren’t used to it.
You don’t feel politics in your daily life, but you do feel hot and humid in your daily life.
Yeah Austin is not the paradise people think it is….recently you can see all the Rogansphere comedians that followed him are having some major regret. Elephant Graveyard did a pretty funny video on the whole Comedy Mothership and Austin, gives you an idea what the supposed promiseland is all about…
30-year Austinite here (midwest transplant). I’m not sure we got y’alls liberals, if one judges by the spike in bro-dozers posing as pickup trucks that are now a big part of the terrible traffic. There have always been pickup trucks, of course, but even the weekend warriors used to have something that was a little closer to a tradesman’s workhorse than the luxo-barges now taking up two parking spaces at the grocery store. But maybe it was just a coincidence that those showed up around the same time as the as the reverse Grapes Of Wrath migration.
SF techies saw Austin and then AI beckoned those who realized there was nothing for a SF liberal in cowboy land.
Austin is regressing from a massive pandemic lockdown boom. The same kind of regression is happening in other such places, like Boise and Denver, as well as most of FL. Prices ran up more than 50% in a lot of these places, and now those run-ups are unwinding.
Austin is also probably the most overbuilt city in the country for luxury condos, we were there in May of this year and there are massive downtown condo towers being completed even now. There isn’t any intrinsic geographic limitation to housing supply there like there is in the Bay Area.
And some people probably didn’t understand how hot and humid the summers are.
Oakland is totally different. There was no lockdown boom, if anything, there were more people moving out during the lockdown. You can see from the chart, there wasn’t much of a bump in prices from the pandemic.
Oakland has had an epic crime and homeless encampment wave and very unstable municipal leadership post pandemic. One of the largest downtown employers, Kaiser, has advised employees to stay on campus during lunch because of crime. The city is suffering from the BLM crime hangover. In that way, what’s happening there is more akin to what happened in Portland. People are leaving because of crime and public disorder. These are places with a mild climate and beautiful scenery, but local leadership has totally dropped the ball on public safety. Very high taxes probably don’t help.
Try to imagine how you would feel if one of the largest downtown employers where you live told people to stay in the office over lunch because the streets aren’t safe.
Tim O’Toole,
Plus losing the A’s as well to sin city.
Also the Raiders, also the Ws to SF
@Wolf Am I right to assume that this data represents nominal prices (not adjusted for inflation)?
Thank you.
Just like other asset prices, such as the S&P 500 index.
Why don’t you ask that question when someone posts an S&P 500 figure or chart???
Duh
Thank you.
Right. So the price decrease is even worse than I thought. Take Austin, for example. The peak of 700k was in August 2022. Using BLS’ CPI calculator, that’s about 766k in today’s money, so the inflation adjusted decrease was over 30%. Wow.
Your reply is Exhibit A of why adjusting asset price-movements over short periods to inflation with cherry-picked dates is a goofball exercise.
Do I measure my dollars in terms of houses? OR My houses in terms of dollars?
How many gold bars is that? Is Bitcoin a store of wealth yet?
With changing rules and playing fields, the Anthem is still national (rather than notional).
So why aren’t the banks failing yet?
1. Because they’re not on the hook. The taxpayer guarantees the majority of residential mortgages via Fannie Mae, Freddie Mac, Ginnie Mae, FHA, VA…. That’s one of the biggest changes coming out of the financial crisis. Did you miss it?
2. So far, people are still making their mortgage payments, and default rates remain low.
3. Only 12 states are nonrecourse where borrowers can walk away from a purchase mortgage. The other states are full recourse, and if you default on the mortgage and try to walk away, the lender can get a deficiency judgment and hound you by going after your assets and garnish your wages. Not recommended. Better to stay in the home, keep making the mortgage payments, go on with your life, and quit looking on Zillow every day.
Melody Wright has spoken at length about extend and pretend strategies being used in residential mortgage, through her role as a “back office” mortgage processor. It turns out there are many people (hundreds of thousands to millions) who are *not* making their mortgage payments, and servicers have been monetarily incentivized to “defer” those loans once they hit 90+ days delinquent, through a variety of strategies. Once Oct 1 arrives, many of those programs will not be able to get away with the soft fraud anymore. We should see a huge wave of defaults begin very soon after Jan 1, 2026. It will be a *very* rough year for housing.
Nah, it’s called forbearance. It’s a classic tool to try to work out a loan so that the lender doesn’t have to take possession of the collateral. There were massive forbearance programs during Covid, but most have expired. Every natural disaster (wildfires, hurricanes, etc.) brings with it a new wave of forbearance. The FHA, which insures subprime low-down-payment mortgages (about 8 million mortgages, which hasn’t changed much over the years) always has a high default rate. But it also charges high fees. That stuff is just routine. And yes, the mortgage servicer (the bank) gets a fee for everything, from processing the monthly payments (such as 0.25% from each payment) to dealing with defaults for which the fees are higher. You’re citing a bunch of clickbait.
“Hundreds of thousands.”
OK.
What percentage is that?
If 65% of households own, say there’s 100 million households.
Maybe (conservatively) 1/3 have a mortgage, or about 22 million mortgages?
If 200,000 mortgages are not paying, it’s 1%.
What’s a crisis level? It reached 5-6.5% in the GFC (from a 1.4% base).
@Struggler
More data:
There are 40.1 million households in the USA without a lien. That includes single family residences, condos, etc. I consider those households to be the ones that “own” their homes, whatever other statistics might say.
There are currently 346,000 FHA mortgages in serious delinquency (90+ days delinquent, in foreclosure, or in bankruptcy). Who knows how many of the other GSEs and private mortgages are currently in the same boat.
The loan servicers, for the last several years, have been “auto-rolling” mortgages when the threshold of 90+ day delinquency has been reached. What this means is that they have been informing non-paying mortgage holders that their loan is being “auto-rolled” without requiring any action from the loan holder. There are mortgage holders out there that have not made a single full mortgage payment in about five years.
The numbers surrounding delinquency and default are murky, because they are designed to be murky. It could be 500,000 that should currently be in default, and it could be five million. Extend and pretend is a powerful force. Right now, we have no idea how many actual loans should be in default, but are not. That will all change as of Oct 1, and as of January 1, 2026 the *reported* defaults will begin to spike, and continue to spike, probably through at least the first half of 2026. Basically, the auto-roll will be limited to once every 18 months. Personally, I can’t wait to start seeing at least partial real data prints beginning in January next year. That said, I’m sure the banks, non-bank financial companies, and government will keep the full and honest data as murky as possible.
The biggest drops seem to be in cities with the biggest run-ups. Too bad Birmingham, AL, (a mid-tier single-family home for $130,000) is such a crappy place to live. ” Its violent crime rate – which includes instances of murder, manslaughter, rape, robbery and aggravated assault – was 1,682 per 100,000 residents. Its property crime rate – which includes burglary, larceny, and vehicle theft – was notably higher at 4,173 per 100,000 residents.” -Wikipedia. So you have a 1 in 59 chance of being subject to a violent crime, and a 1 in 24 chance of being subject to property crime. No thanks.
I am confused. If the crime rate is so high there, why hasn’t Our Great Leader sent in the military to patrol it?
Might want to check the murder rates on the FBI site.
With a little help, he may be able to get our troops to Birmingham a little sooner.
The FBI will soon purge crime rate statistics from the site, thus proving that there is no more crime.
Thank you for your attention to this matter.
Yah, but taxes are low! Lol
Low property taxes, pretty average income tax, but one of the highest sales tax rates in the country, a combined 10%.
@thurd2 crime in almost every city is concentrated in a few “bad areas”. When I was living in Sf in the early 90’s OVER 50% of the murders in the entire city one year happened either in the Alice Griffith aka “Double Rock”Housing project in Hunters Point or within two blocks of the project (that was full of gang members). I have a friend that lives in Birmingham, AL near the Inverness Country Club in an area with close to zero crime (but other places in town you don’t want to go to at night). When I drove to visit a friend at his parents nice house on the lake in Milwaukee when I was in Chicago for business years ago I drove through a schetchy area and his Mom got mad at him for letting me take the Google maps directions through the tough part of town.
I’ll echo this Chicago is bad, but pockety bad. Milwaukee is just bad all around, but the suburbs are totally safe.
Let’s send in the National Guard and clean things up. Is it possible that that’s the real answer for the housing shortage?
Let’s go Oakland! Lol
Maybe I’ll actually be able to afford a house to call my own finally. With rates starting to come down and prices continuing downward the market is finally looking approachable. Thank you Wolf.
The mortgage rates are going up after the fed rate cuts
Wolf, do you need a subscription to access this data? Personally interested in Jacksonville and Orlando. Thanks!
No, but you need to download it in spreadsheet format.
San Jose never drops surprisingly
RTGDFA.
Paragraph after the first list:
“There are many other bigger cities where single-family home prices have declined but haven’t made the 10% cutoff, such as Los Angeles and San Diego (both -4% from the 2024 peak), San Antonio (-8%), Dallas (-6%), Fort Worth (-9%), San Jose (-5%), Atlanta (-5%), Memphis (-7%), Tampa (-6%), Seattle (-7%)…. Each monthly decline gets them closer to the double-digit zone.“
Jeez, give him a break – – you didn’t bold it in the article for him so that it would stand out for him when he was skimming all that boring text …
Back in 2011, my parents and I visited a condo at Union City for sale. It was 1100 sq ft, with 2 bathrooms 2 bedroom. Asking price: 275K.
I was only a college student with ZERO experience about real estates. We didn’t know we have to bid for an offer in 2011.
If I was more mature, my parents would have retired in Bay Area.
Wolf, how likely would the prices of condo in union city falls back to 300k – 400k ?
Did you get any raises since 2011? If you’re working in the Bay Area, and you’re doing your job well, you should have. Maybe your pay doubled?
Back in 2011, my parents and I visited an opened condo at Union City. It was 1100 sq ft, with 2 bathrooms 2 bedroom. Asking price: 275K.
I was only a college student with ZERO experience about real estates. We didn’t know we have to bid for an offer in 2011. Our agent didn’t explain the details for us.
If I was more mature and know the bidding rules, my parents would have retired in Bay Area.
So Wolf, how likely would the prices of condo in union city falls back to 300k – 400k ?
A lot of people paid 2032 prices in those magical few free money months of 2022. Not a big deal if you stay put, painful if you need to sell at 2025- prices now.
Nice way to look at it. But I’m sure they’ll be thinking – “I won’t lose anything if I break even in 10 years”.
Many RE buyers lack a simple understanding of time value and opportunity cost.
@Bobber just like “most” people don’t buy a car as an investment “most” people don’t buy a home as an investment (or have any idea what TVM stands for) they buy since they need a place to live. The people like us (that read sites like Wolf’s) think about money and investments more than “most” people. P.S. Has anyone else noticed high sales dropping off Zillow? I just went to see what Zillow says the price of two different homes in Denver sold at the top of the market were down to and both “top of the market” sales from 2022.
Btw, really surprise to not see Boise, ID on the list at all, let alone top 10. With the huge run up and their local income, one would think they would fall quite hard and fast, but guess not…weird…
I’ve been following the Boise market for a few years as my husband and I have weighed renting vs. buying. Renting continues to win out. I hope Boise makes the single family list, eventually. Houses are taking longer to sell with more being removed and relisted, but still anything ‘nice’ between about $550-$700K (especially in Boise ‘proper’ and not outskirts) usually goes pending relatively quickly. Our rent for a 3 bedroom (1900 sq ft) townhouse is $2500. A neighboring unit just sold for $653,500 – so a mortgage payment with insurance and taxes may easily be $4500? Plus an HOA fee. It’s not difficult to stick with renting in that case. I was encouraged to see Boise on Wolf’s condo list at -14% though!
Boise SFH from peak: -7%
In that second paragraph, I only listed a sample of cities that didn’t yet qualify. There are many more, maybe 100 of my bigger-city list, including Boise.
Boise condos made it on my -12% to -27% condo list:
Condo Prices Dropped by 12%-27% in these 25 Bigger Cities through August
@Phoenix_Ikki I know that LOTS of people are moving to Boise from CA and many people are able to pay cash for nice homes in ID (after sellign their overpriced $1mm+ CA crapshacks.
So I’m curious when do y’all think the media narrative changes to the point realtors have to stop saying rates are dropping, by now before prices sky rocket next spring?
I have realtor friend who’s had a rough year, she works in the $1M+ market and was saying she thought a new expensive car would make her look more successful to clients and thus lead to more clients/more selling – on the rate cut news she bought a new $75-$125k SUV per Google (I don’t know the exact trim package) to be prepared for spring selling season because the market is gonna take off supposedly….
I feel like next summer, when mortgage rates are the same despite numerous rate cuts – the new slogan “buy now, before the recession (only thing likely to bring down the 10/30yr) drops rates” won’t have quite the same appeal.
Not saying a recession is coming, but I am saying it’s the only way realtors are likely to get the sub 5.5% mortgages they keep talking about.
hahahahahaha
least financially irresponsible american
There was the economic peak of America. You caught it!
Haha that’s hilarious…sounds like someone that will eventually go on Ramit’s show to explain why her monthly expense is at 80%+ on the CSP.
At least if she ever need to drive to a food bank she will probably have the nicest car in line…
I thought it was hype, but maybe they’re true believers. Housing prices to the moon. Haha.
Unless the majority of Americans are willing to return to a feudal system, prices still need to come down substantially so that wage earners can afford to purchase a home.
House builders are still building……..madness
Bring on the new supply! Lots of new supply is exactly what this overpriced screwed-up market needs.
Mortgage rates are coming way down rapidly and by big numbers. I cant believe what I have seen this week which is eminiscent of 2019. Dont get caught offside things are going to change very quickly.
R-gDp will decelerate in the 4th qtr. from Atlanta GDPnow’s current level. But inflation will remain uncomfortable for another couple of months.
The FED needs to ease monetary policy. Powell “if the US Federal Reserve cuts its benchmark rates ‘too aggressively,’ then it poses inflation risks in the US economy”.
The FED cannot cut rates too aggressively at this point. Monetary policy that impacts inflation works with a long lag effect.
Mortgage interest rates are headed up along with 10 year US Treasuries on which they are keyed from.
Sure they are.
Just like they were in 2023, 2024, 2025, and now 2026. The next boom is right around the corner.
The business of home builders is to build homes and this is exactly what they are doing
Not really. New homes have a built in advantage over existing homes. They likely still have the lots owned or under control and probably still bid out. So you might as well build
Huh?
I live on a golf course in Florida, and you can still buy a good house on the course for 200k. What’s not to like.
The gold or silver price is telling you something about inflation. It is not going away for long.
The prices of gold and silver are simply clearly telling you that those are just wildly speculative commodities and the biggest bubbles there are out there. The historical value of gold over hundreds of years is around $20 per ounce and anything about that is laughably speculative excess.
So are you saying that the gold miner, whose COST to dig up the ounce of gold I hypothetically want is maybe $1200, should only charge me 1/60th of that and just eat the other 59/60ths as “laughably speculative excess”?
It’s a whole new way to run a business.
Single biggest challenge in this current market cycle for this real estate broker is bending the Seller’s reality on price. Too many property owners continue to hear the COVID noise in their heads believing their property is worth 10x when it is actually worth 2x. Over shooting the runway out of the gate transfers instant equity from seller to buyer.
When the real bubble crash happens one has to wonder what will happen to municipal governments so dependent on property tax.
My suspicion is that they’re going to do very badly. And furthermore Scott Bessent is now on record that he won’t bail them out.
I am really glad I own gold and not municipal bonds or investment housing.
Maybe they’ll finally abandon property tax, limit increases to CPI, or something like a hybrid where you pay tax on the purchase price or something.
As it stands, they are basically taxing unrealized gains.
Property taxes are primary and principally for the services provided by the state in which your house resides, such as schools, fire, police, roads, libraries, and a myriad of other services. Property taxes will never be ‘abandoned’ at all for these services, obviously.
Historically, land owners were expected to support and fund municipal gov’t. That’s the justification for property taxes as explained by my city assessor.
Hmm, perhaps we should also go back to only letting land owners vote in muni elections. /s
I was always under the impression that renters paid the property taxes through their rent.
Are you saying that landlords actually don’t include their property taxes as costs when calculating how much to charge their tenants?
I had no idea that they were such generous souls.
jm,
That’s a misconception. Landlords can only charge the rents that renters are willing to pay — the rents that the market will bear.
If you bought a SFH in 2022 to rent out, the rent you can charge may be hundreds or even thousands of dollars below what your cash expenses are (mortgage, insurance, property taxes), not even including maintenance and repairs. Landlords like these are bleeding cash every month. No, renters don’t pay property taxes, and they don’t pay the mortgage and insurance and repairs. They pay rent, and the risk is of losing money is with the landlord.
Municipal governments, unlike state and the federal government, can always file for bankruptcy protection under US bankruptcy laws should that need ever arise.
Municipal governments must by authorized by their respective state in order to file for bankruptcy.
They’ll just raise the tax rates to compensate, and still recover the same amount of money. For the homeowners who haven’t lost their jobs, paying the same amount of taxes will be no big deal – the paper loss on the value of their house has no impact on them, and may even result in their homeowner’s insurance going down.
Jack, property taxes are used mainly to support public schools, most of which are already crap. I suppose they could get crappier, but probably not so much that anybody would notice. Roads get more potholes. But one thing we know for certain, salaries and benefits of municipal government workers will continue to go up.
Not necessarily.
That’s only true if the bond market doesn’t start getting nervous about these cities ability to pay. And they would, since property taxes are a good portion of a city’s income.
If one of the requirements for the bond market to refinance municipal bonds is to end pensions that’s what they’ll have to do. I suspect this will be a lot more common than you think. Pensions are one of the largest expenses for most cities.
Pow just came out and said stocks are “highly valued”. Hmmm…. Ok…..What about housing, Jay-Jay? Didn’t you see the elephant in the room, Jay?
Haha, just like clockwork….MSM (MSNBC) just posted this article…..oh no, better rush back in to buy now or we’re all going to miss out again….kudos for them trying so hard, still no cookies for them though..
“New home sales soar 20% in August to a three-year high”
Gawd, I despise these nasty inflation-mongering propagandists.
This is admittedly off-topic, but does anyone know what is going on with Ben Jones housing blog? It has not had a new article since 22/Aug and the comment section was disabled on 1/Sep. I hope he is doing well. If anyone has any reliable info, please post.
12:29 PM 9/24/2025
Dow 46,123.25 -169.53 -0.37%
S&P 500 6,633.23 -23.69 -0.36%
Nasdaq 22,486.16 -87.31 -0.39%
VIX 16.53 -0.11 -0.66%
Gold 3,753.00 -62.70 -1.64%
Oil 64.80 +1.39 2.19%
From a headline today at Marketwatch:
“I’m in dire straits.’ I’m 73 and my Florida home – once worth $1.3M – was hit by a hurricane and I can’t sell now. My Social Security is under $2K per month. Now what?”
Uh, lower the price. It will sell eventually if you lower the price enough. Some of these sellers seem to be braindead. It appears to be a fairly common affliction.
If the home owner can’t meet the mortgage and won’t or can’t sell, it is jingle mail time. But Florida is a recourse state, so he is screwed. Maybe he should have just rented. I know some people who sent jingle mail in California (a non-recourse state) during the last housing “crisis”. It was not a big deal in California because California is a non-recourse state but it did fk their credit score.
Unfortunately, appraisers working for lenders are often given insufficient time or inadequate compensation to spend the necessary time measuring local housing market trends.
Worse yet, many appraisers were never trained how to measure market changes.