The shocker for the 2nd month was the re-acceleration of inflation in core services, the biggie, accounting for 60% of overall CPI.
By Wolf Richter for WOLF STREET.
Core services move the needle. They include housing costs, medical care, health insurance, auto insurance, tenant’s insurance, subscriptions; telephone, internet, and wireless services; lodging, rental cars, airline fares, education, movies, sports events, club memberships, water, sewer, trash collection, motor vehicle maintenance and repair, etc. And that’s where inflation re-accelerated sharply for the second month in a row.
Core services accelerated to 4.5% annualized in July from June (+0.36% not annualized), the worst in six months, and the second month in a row of sharp increases, and it wasn’t housing costs that did it (blue in the chart).
The three-month core services CPI accelerated to 3.2%, also the second month in a row of acceleration (red).
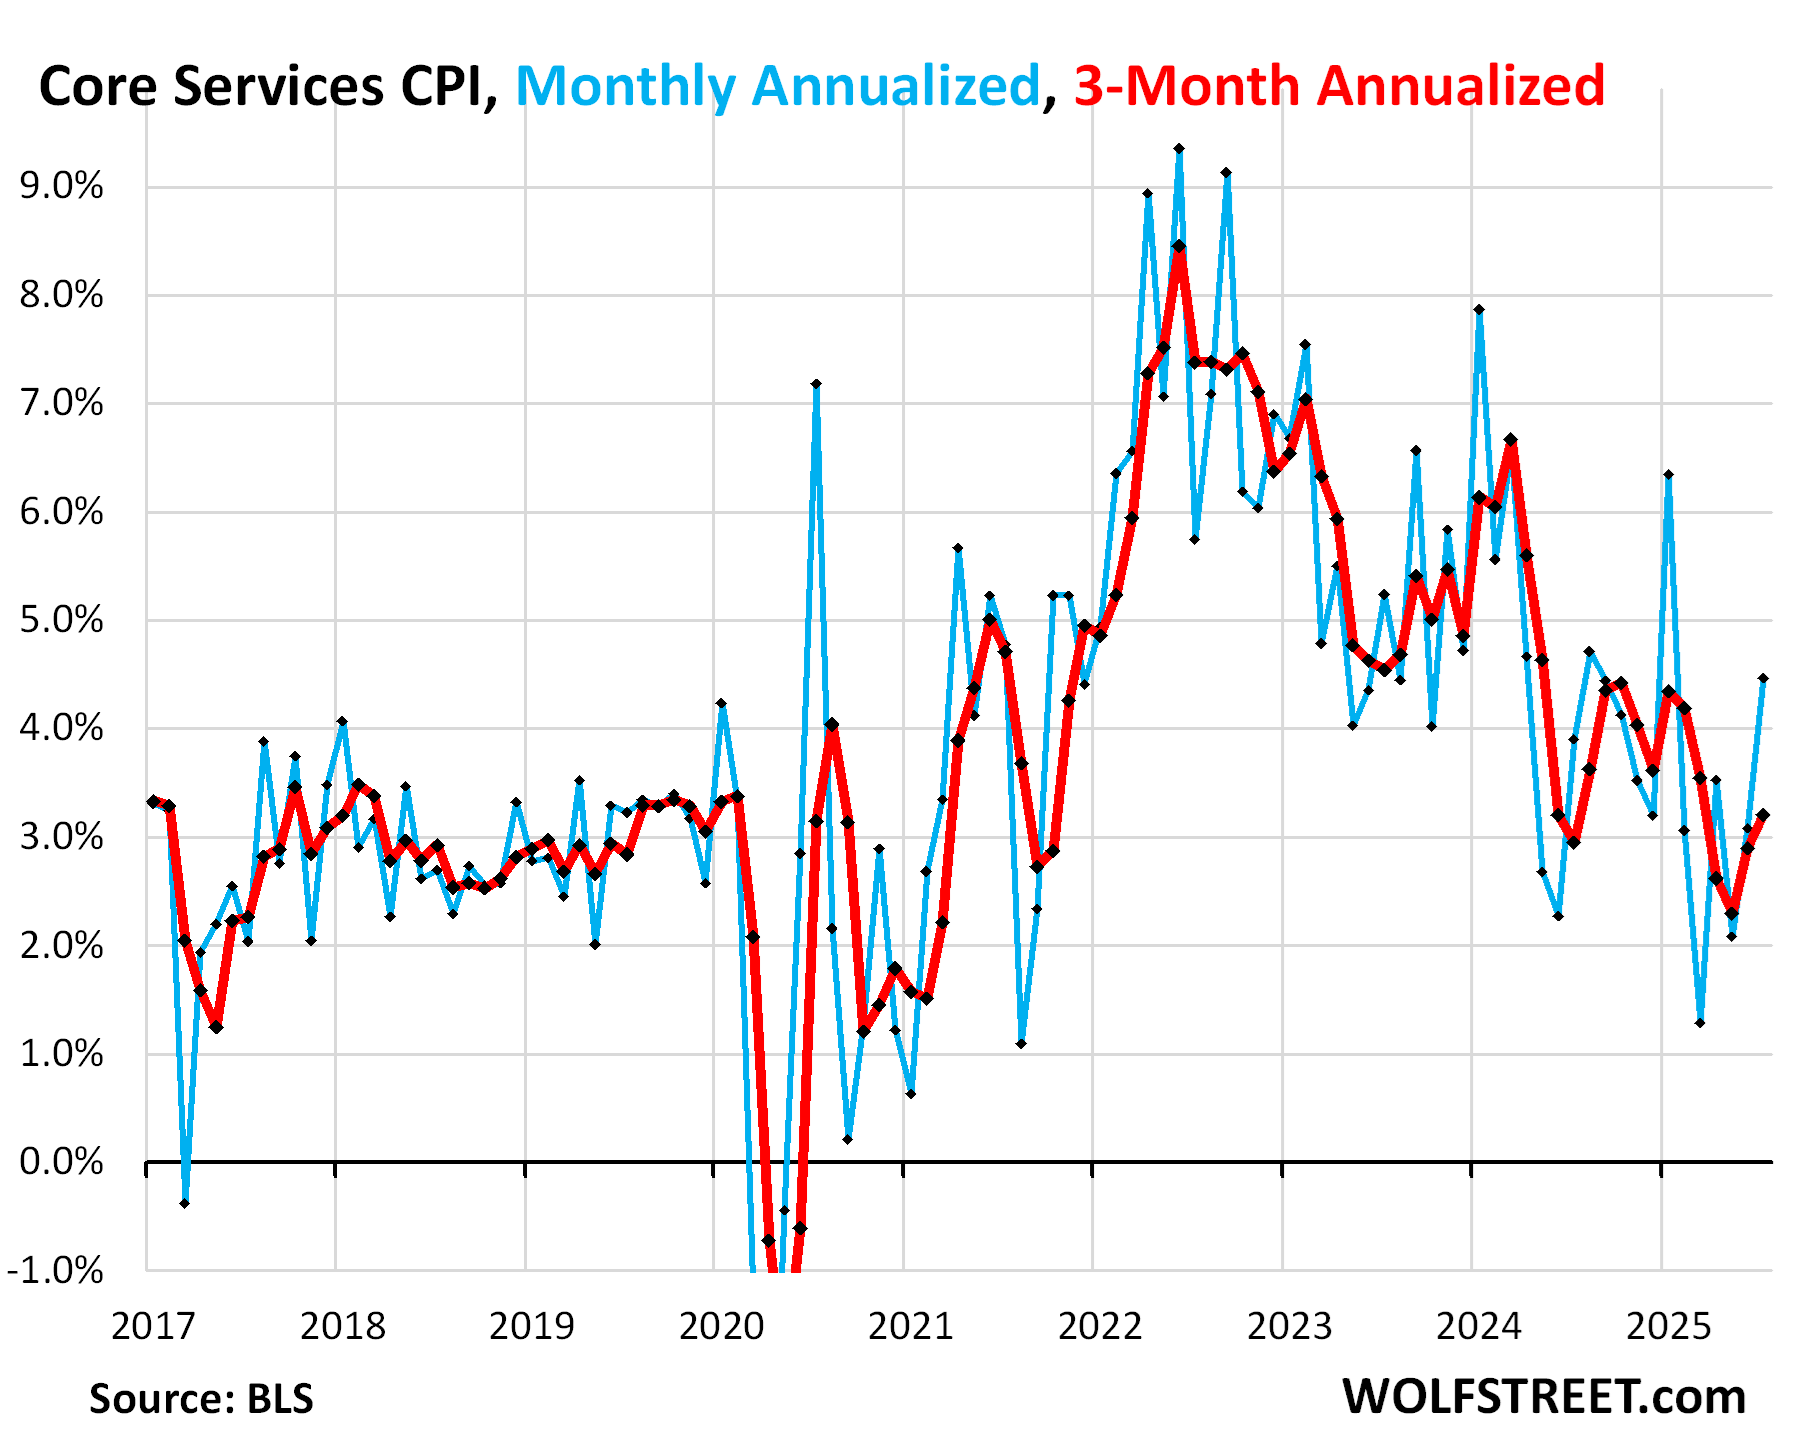
While everyone was busy searching with their magnifying glasses for signs that tariffs are getting pushed into consumer goods prices – there was a mix of price increases and price declines – it was in services where inflation took off again behind their backs, and services are the biggie.
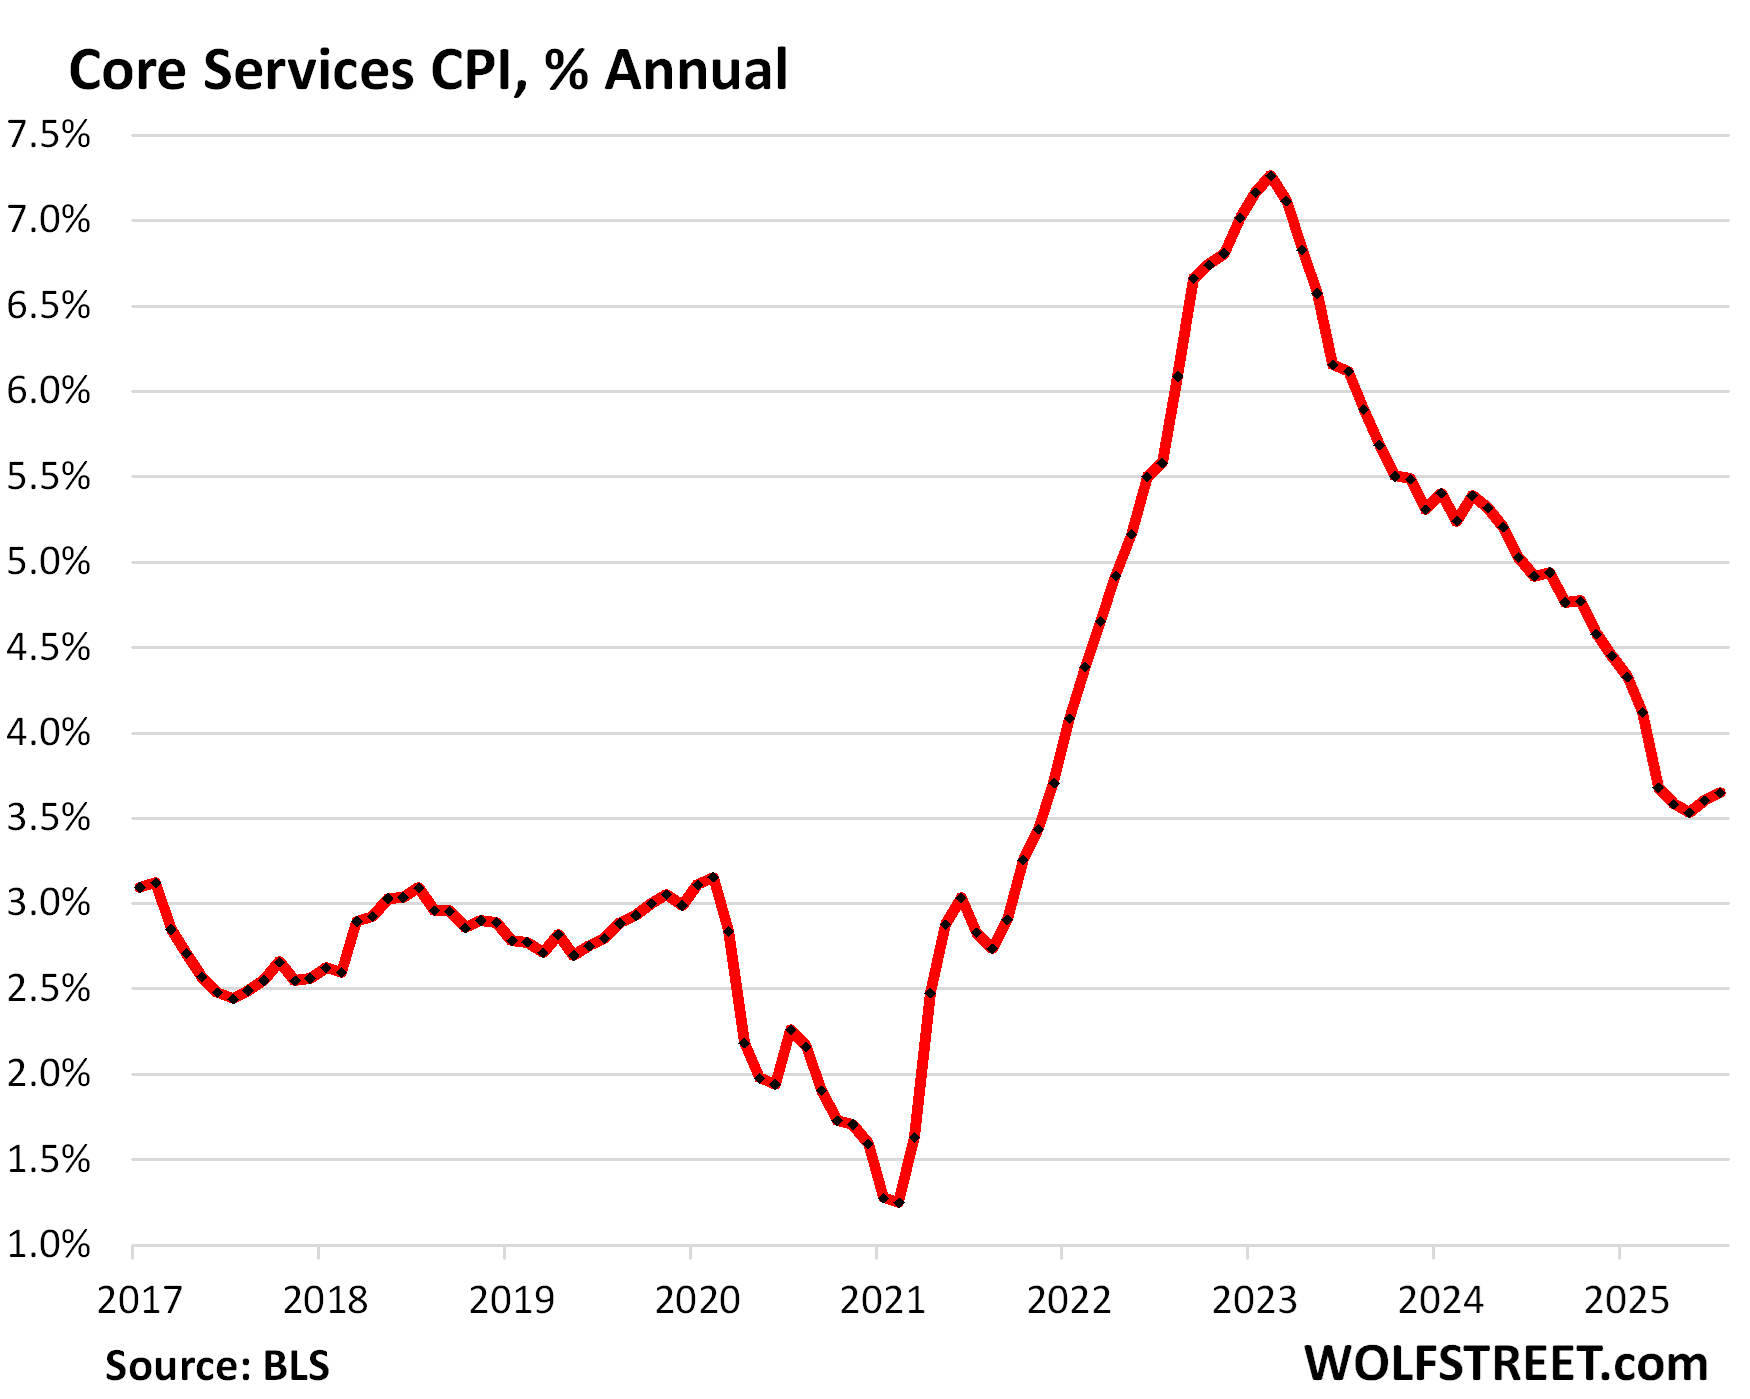
Year-over-year, core services accelerated to 3.65%, the second month in a row of acceleration.
In terms of goods, many of which are tariffed: New vehicle prices remained unchanged after declining for three months in a row. Prices of used vehicles, which are not imported and therefore not tariffed, continued to rise which they’ve been doing for a year. They’re big contributor to durable goods inflation. Apparel, footwear, and jewelry remained unchanged for the month and were down year-over-year. Household furnishings and supplies rose 0.7% for the month and by 2.4% year-over-year. Consumer electronics fell 1.4% for the month and by 5.9% year-over-year.
Food price dipped month-to-month, and gasoline prices fell.
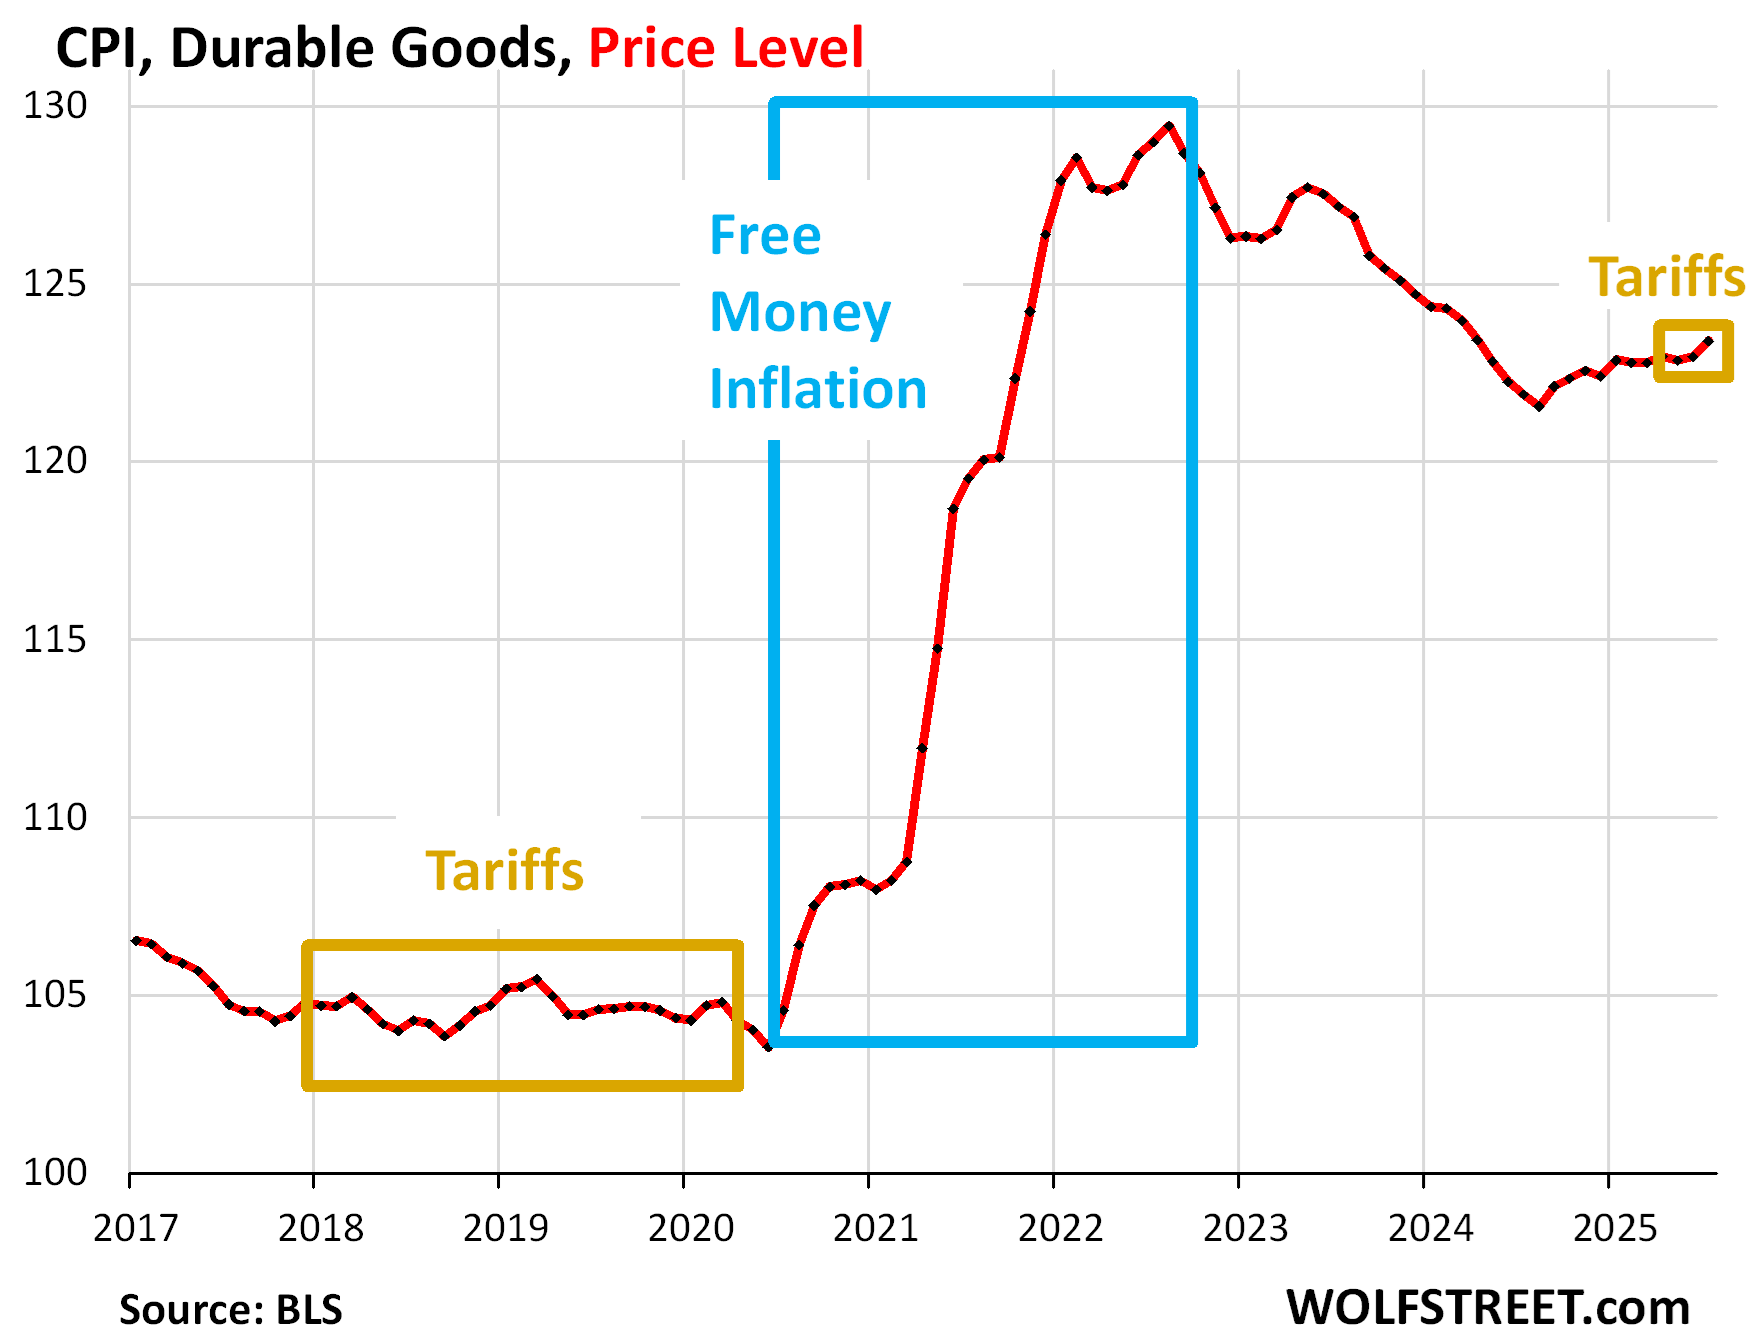
Durable goods prices rose by 0.36% (+4.5% annualized) in July from June, after remaining essentially unchanged in June and falling in May. Year-over-year, the CPI for durable goods rose by 1.2%.
The surge in used vehicle prices has been a big contributor to the price increases of durable goods.
| Major durable goods categories | MoM | YoY |
| Durable goods overall | 0.4% | 1.2% |
| New vehicles | 0.0% | 0.4% |
| Used vehicles | 0.5% | 4.8% |
| Household furnishings (furniture, appliances, floor coverings, tools) | 0.7% | 2.4% |
| Sporting goods (bicycles, equipment, etc.) | 0.4% | -1.3% |
| Information technology (computers, smartphones, etc.) | -1.4% | -5.9% |
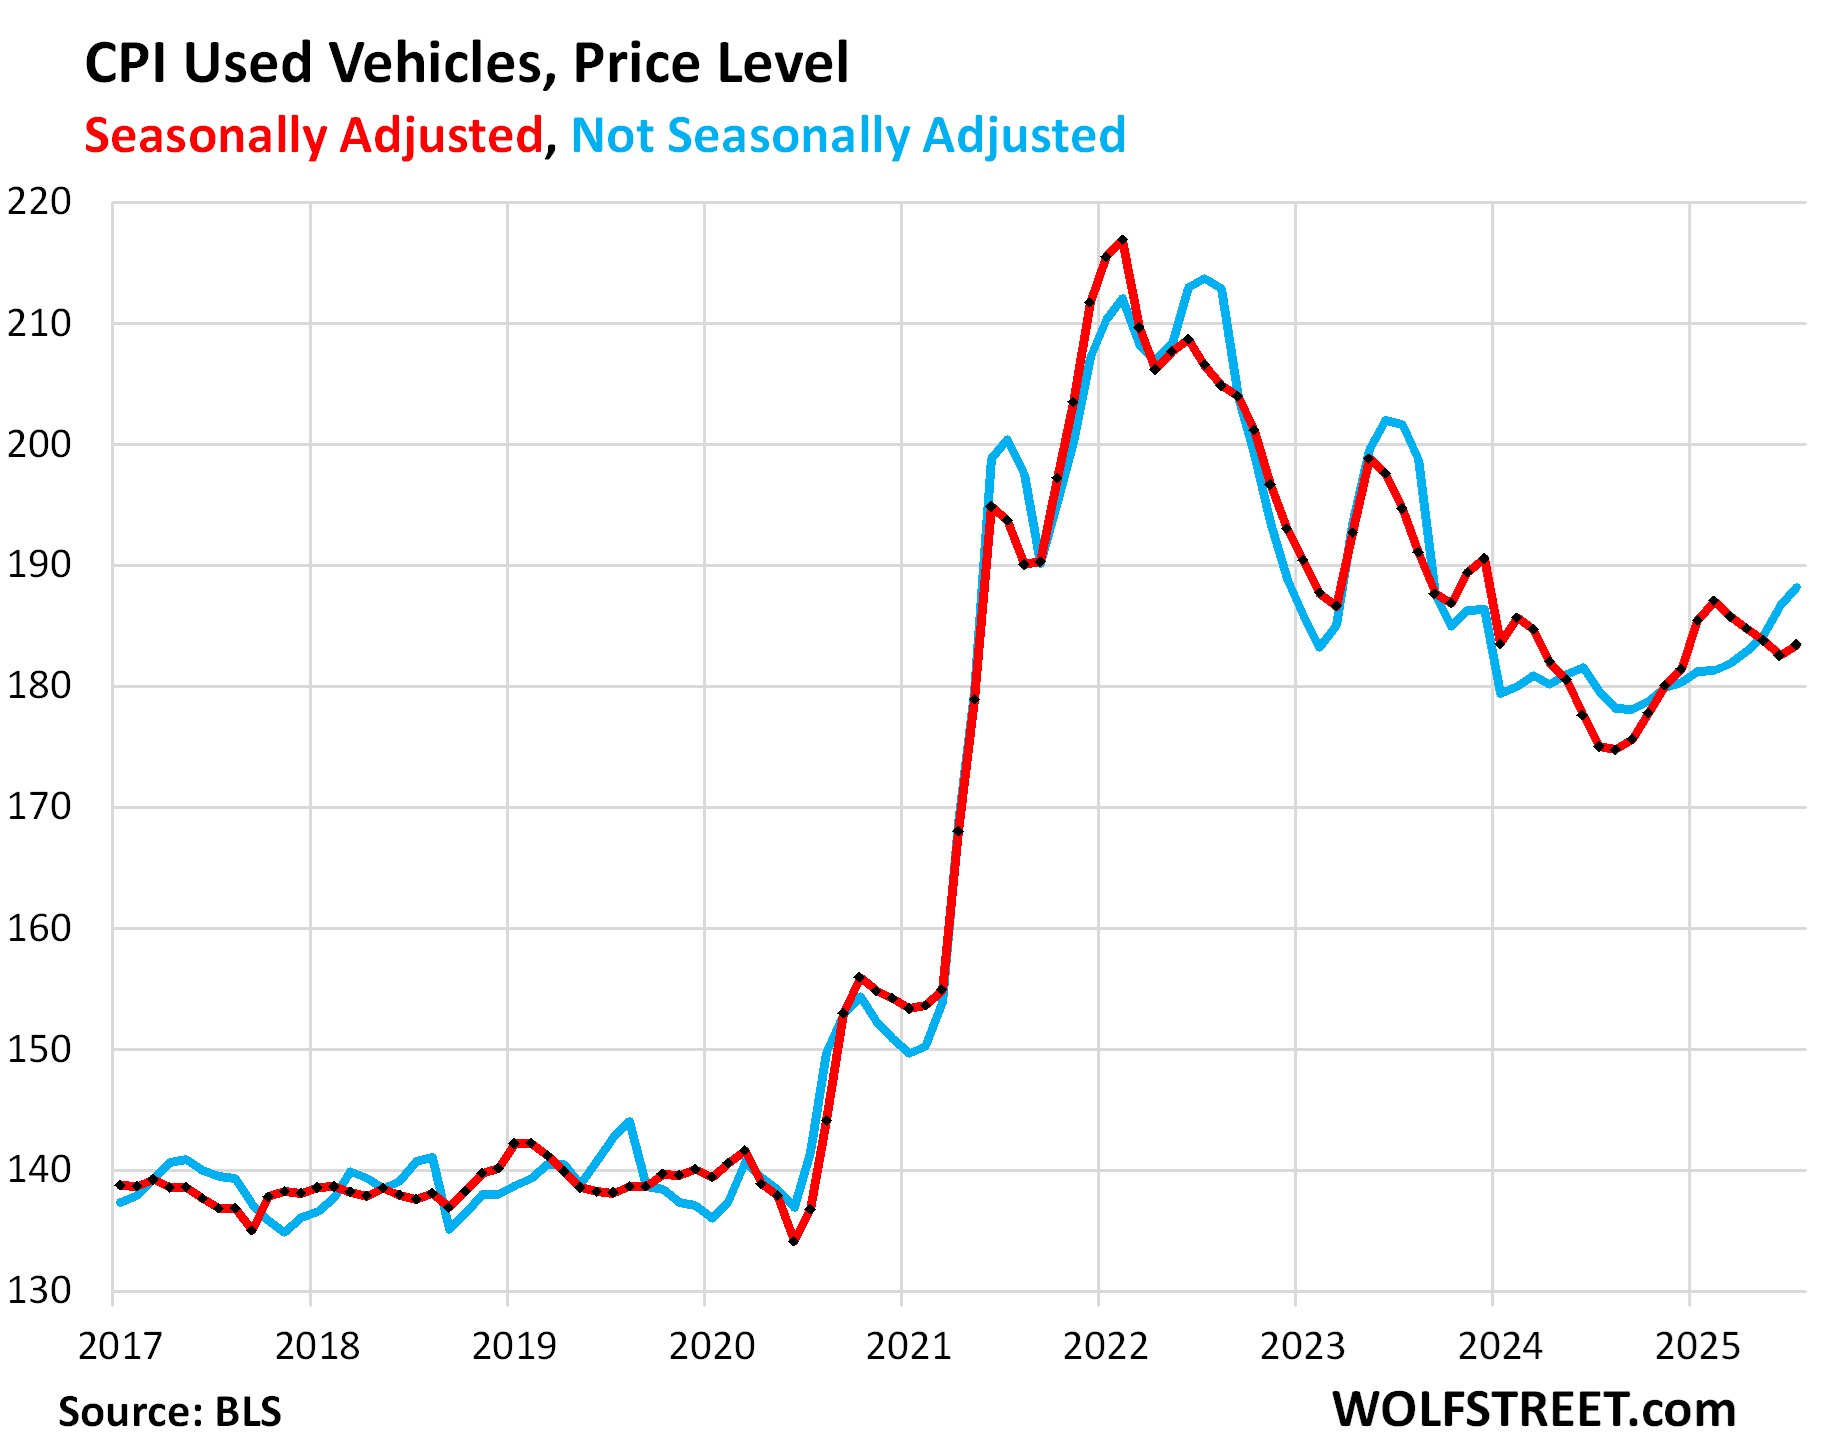
The durable goods CPI had spiked by 25% during the free-money era. Then in mid-2022, prices declined for two years through August 2024 (negative CPI). But from September on, prices began to inch up again.
This chart of the price index, not the percentage change, clarifies just how violently prices spiked during the free-money era, how they declined for two years, and how they’ve inched higher from the low point last August.
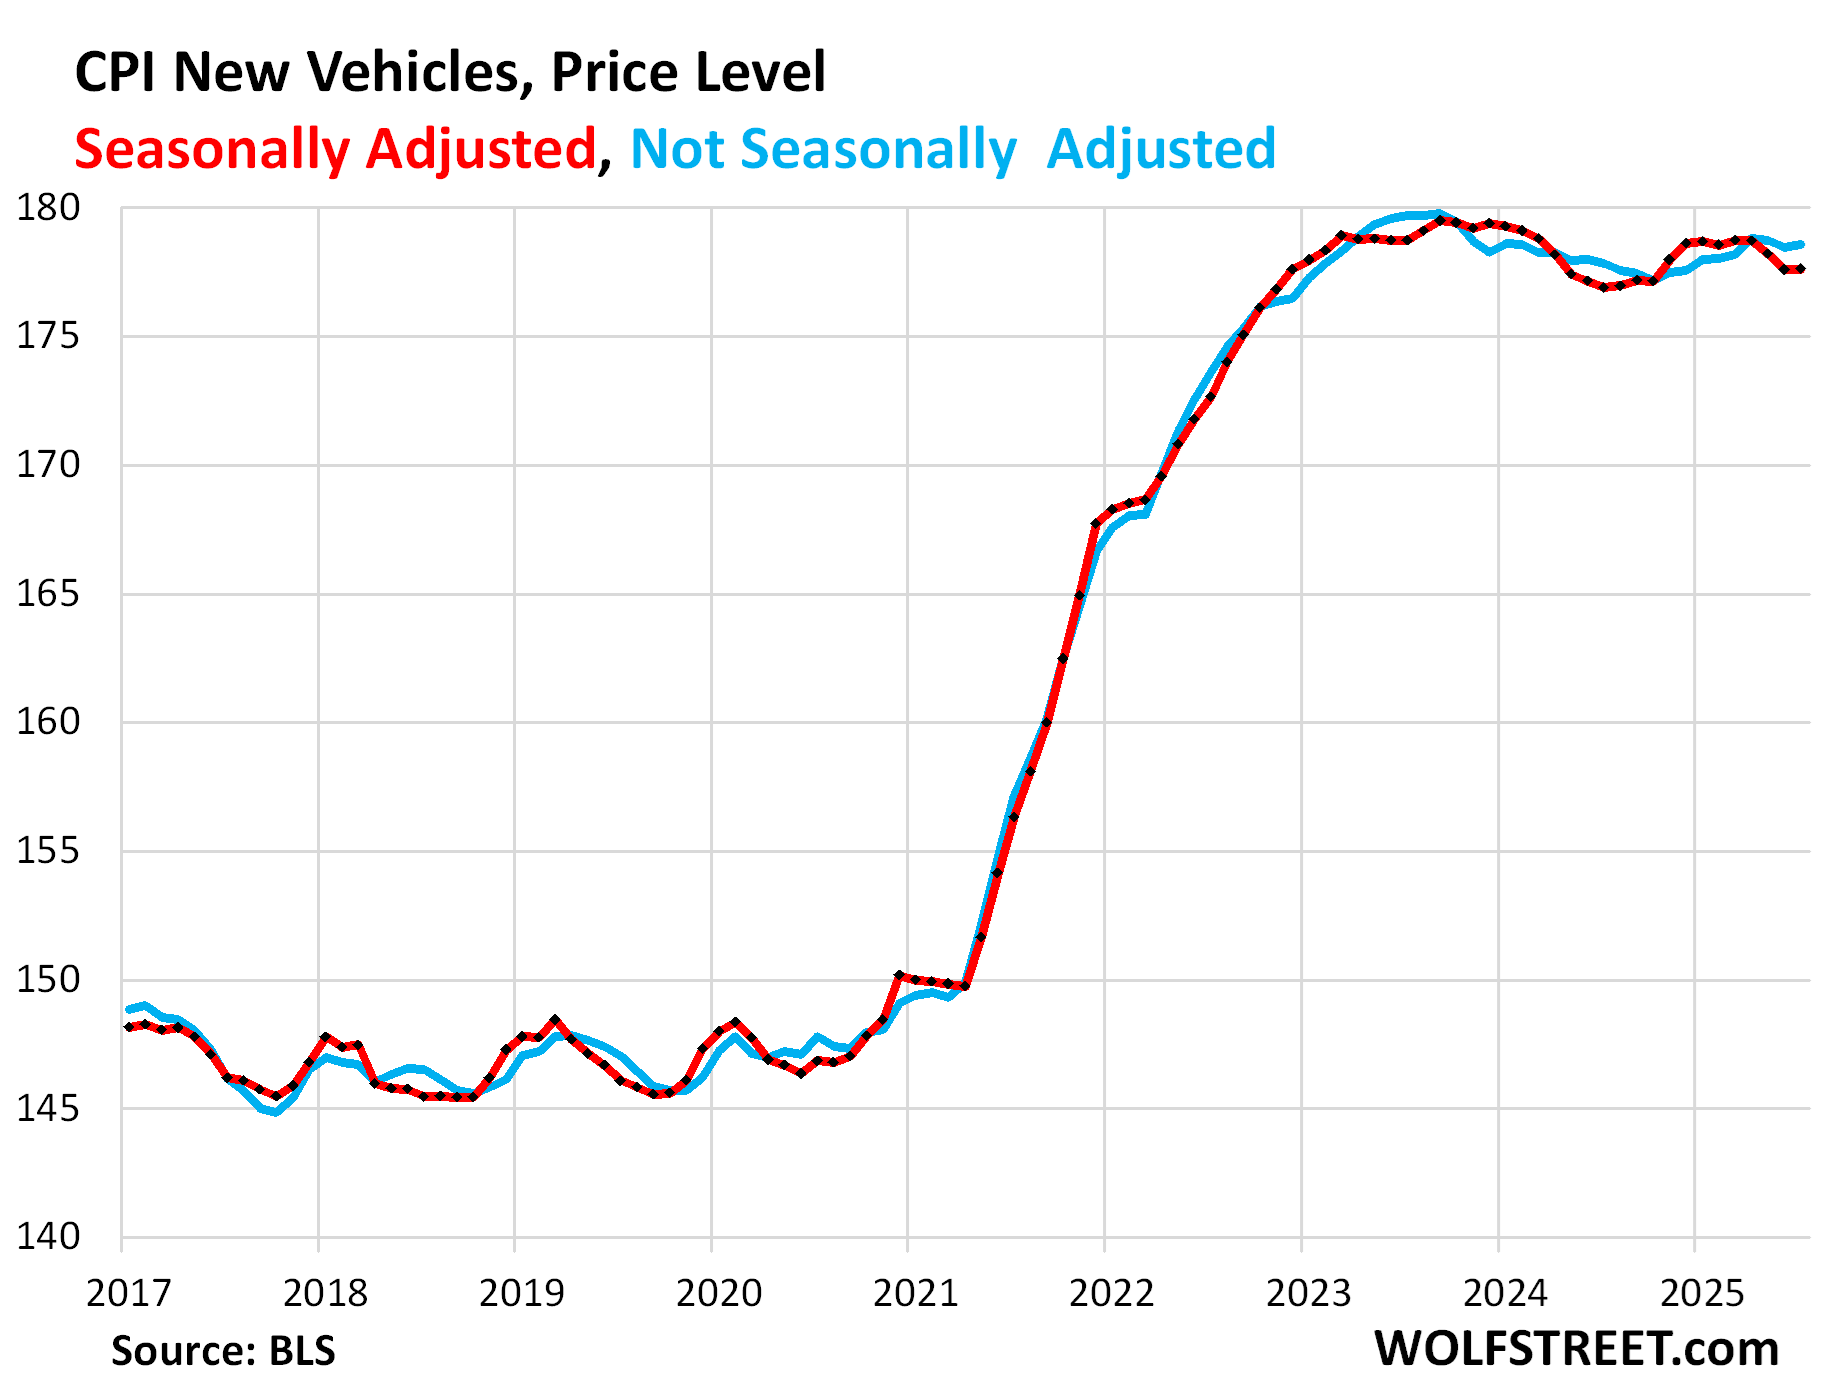
New vehicles CPI was unchanged in July from June, seasonally adjusted, and year-over-year was nearly unchanged (+0.4%).
The price level remains below where it had been in all of 2023 and in the first part of 2024.
The spike during the free-money era, which resulted in massive historic profits for automakers and dealers, drove prices to the economic limit beyond which higher prices kill demand, and prices cannot be raised without sacrificing sales, and automakers know it, and disclosed in their earnings warnings that they’re eating the tariffs. Meanwhile, they’ve started to work on shifting more production of vehicles and components to the US to mitigate the impact of tariffs – which is what tariffs are supposed to accomplish.
GM, which makes a large portion of its US-sold vehicles in Mexico, China, South Korea, and Canada, and moved much of its supply chains overseas, is among the hardest-hit. Tesla and Honda, whose vehicles are among those with the most US content, are among the least hit.
Used vehicle CPI has been rising since mid-2024, after the long drop from the historic spike.
In July, prices rose by 0.48% from June (+5.9% annualized), seasonally adjusted, after four months in a row of declines.
Not seasonally adjusted, the used vehicle CPI has increased steadily since mid-2024 (blue line).
Year-over-year, used vehicle prices rose by 4.8%, the seventh month in a row of year-over-year increases, and the biggest one yet.
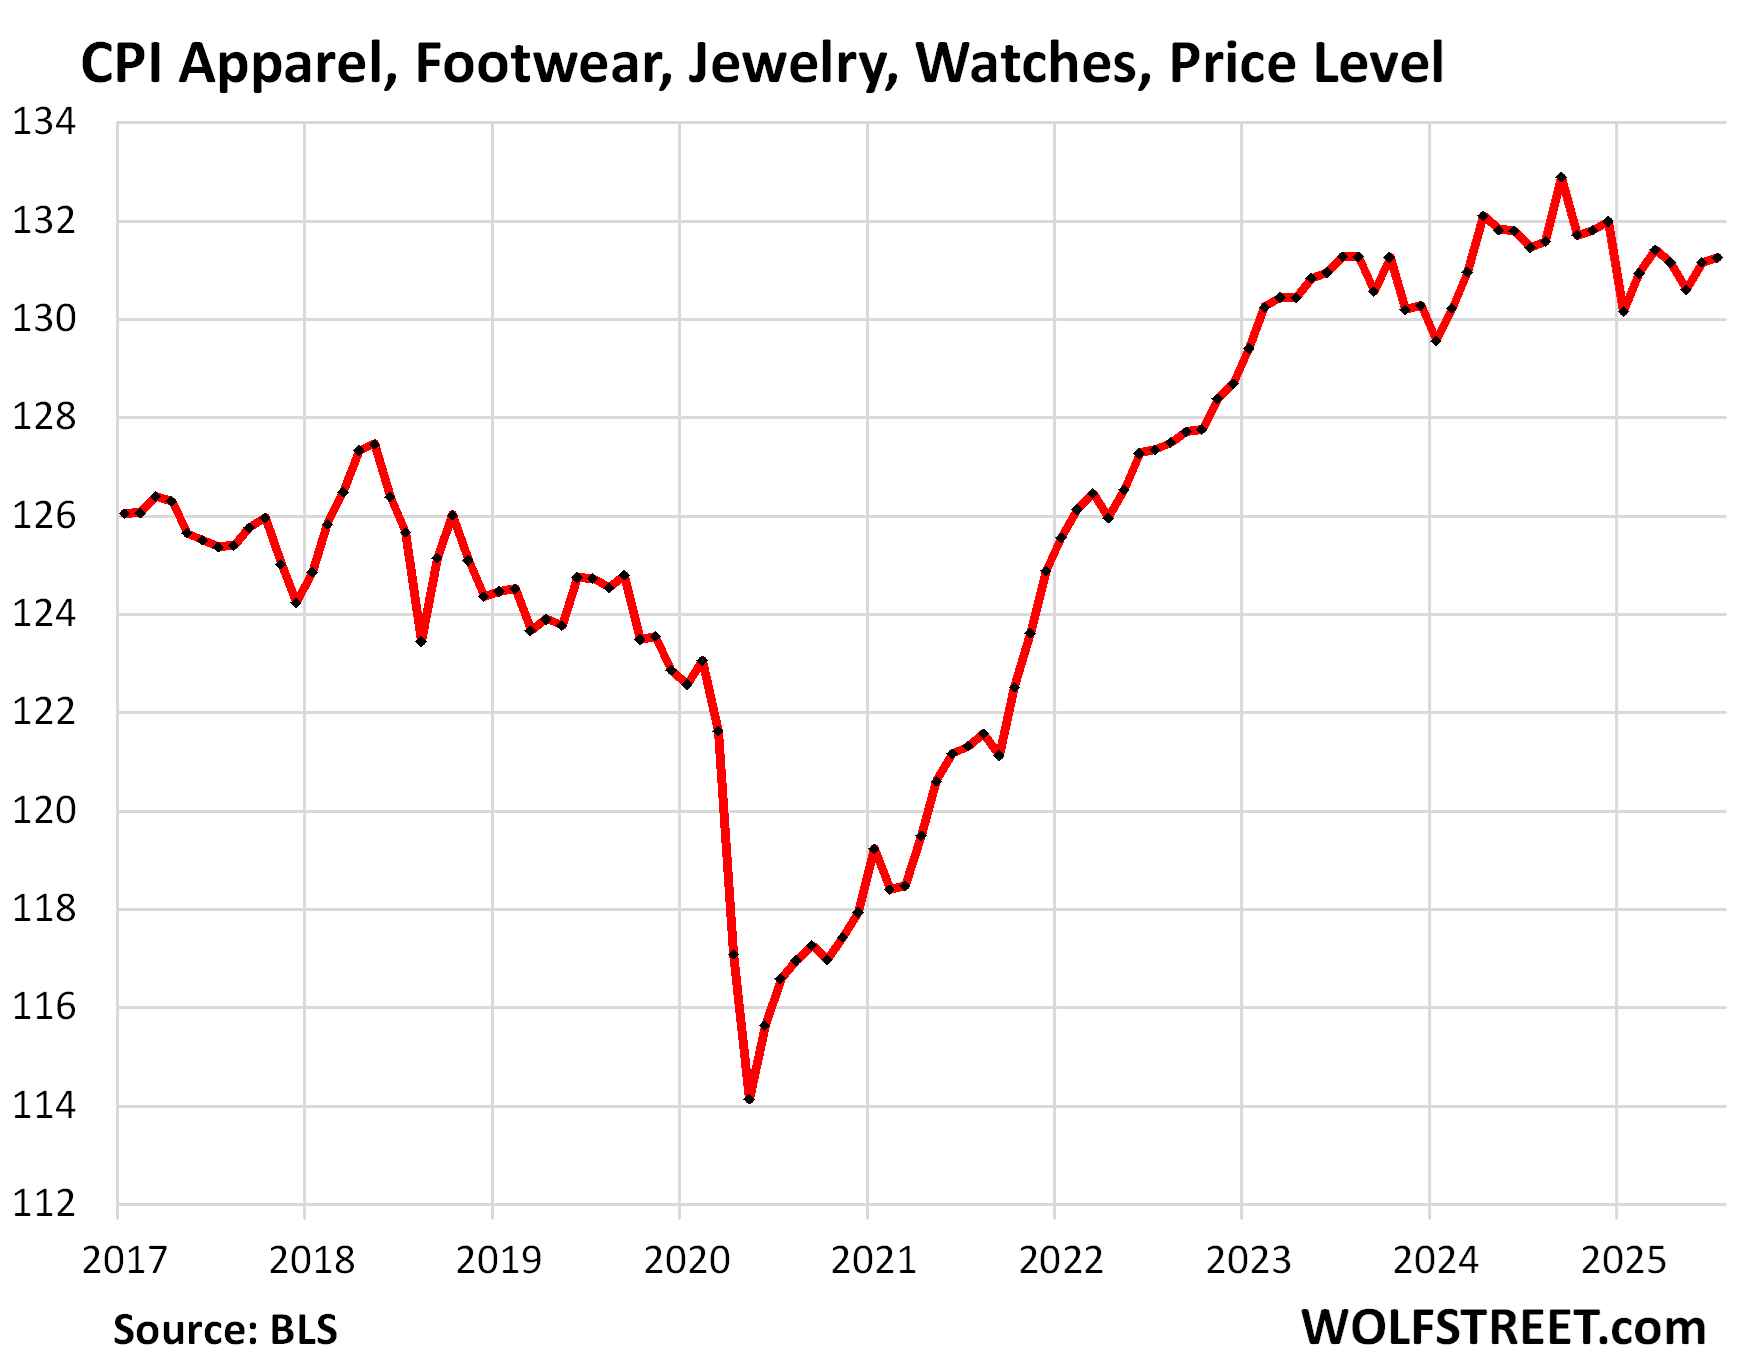
Apparel and footwear are largely imported and tariffed. The CPI for apparel and footwear inched up a hair by 0.07% month-to-month and was down 0.2% year-over-year.
The chart shows the price level (not the percentage change).
So far, companies have eaten the tariffs because prices are already high after the spike in 2020-2022, when consumers were willing to pay whatever, and retailers made record huge profits. But now the free money is gone, and consumers are ticked off about high prices and are not willing to pay whatever again. In this environment, if retailers raise prices, they lose sales.
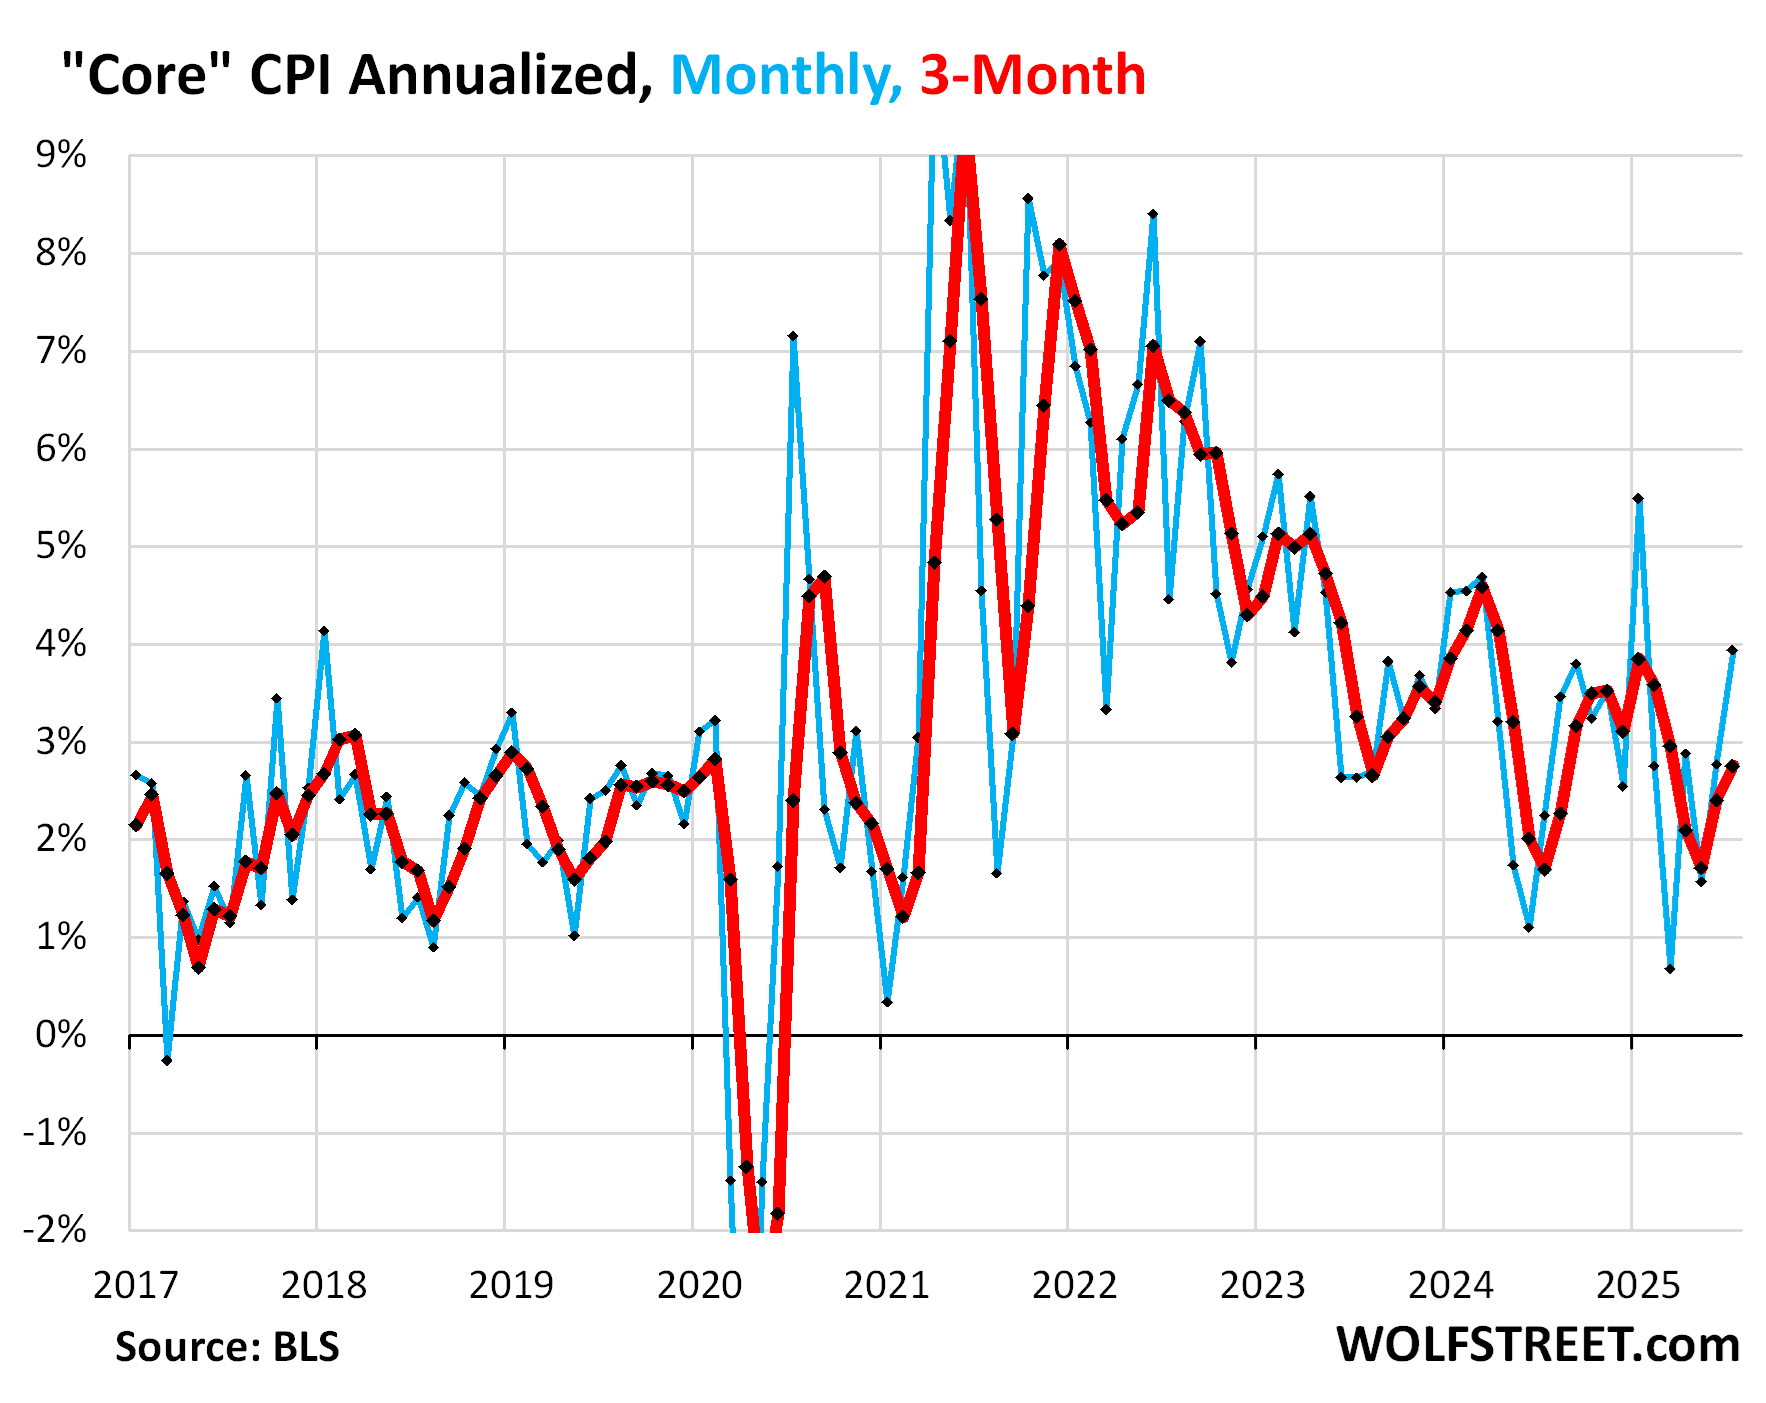
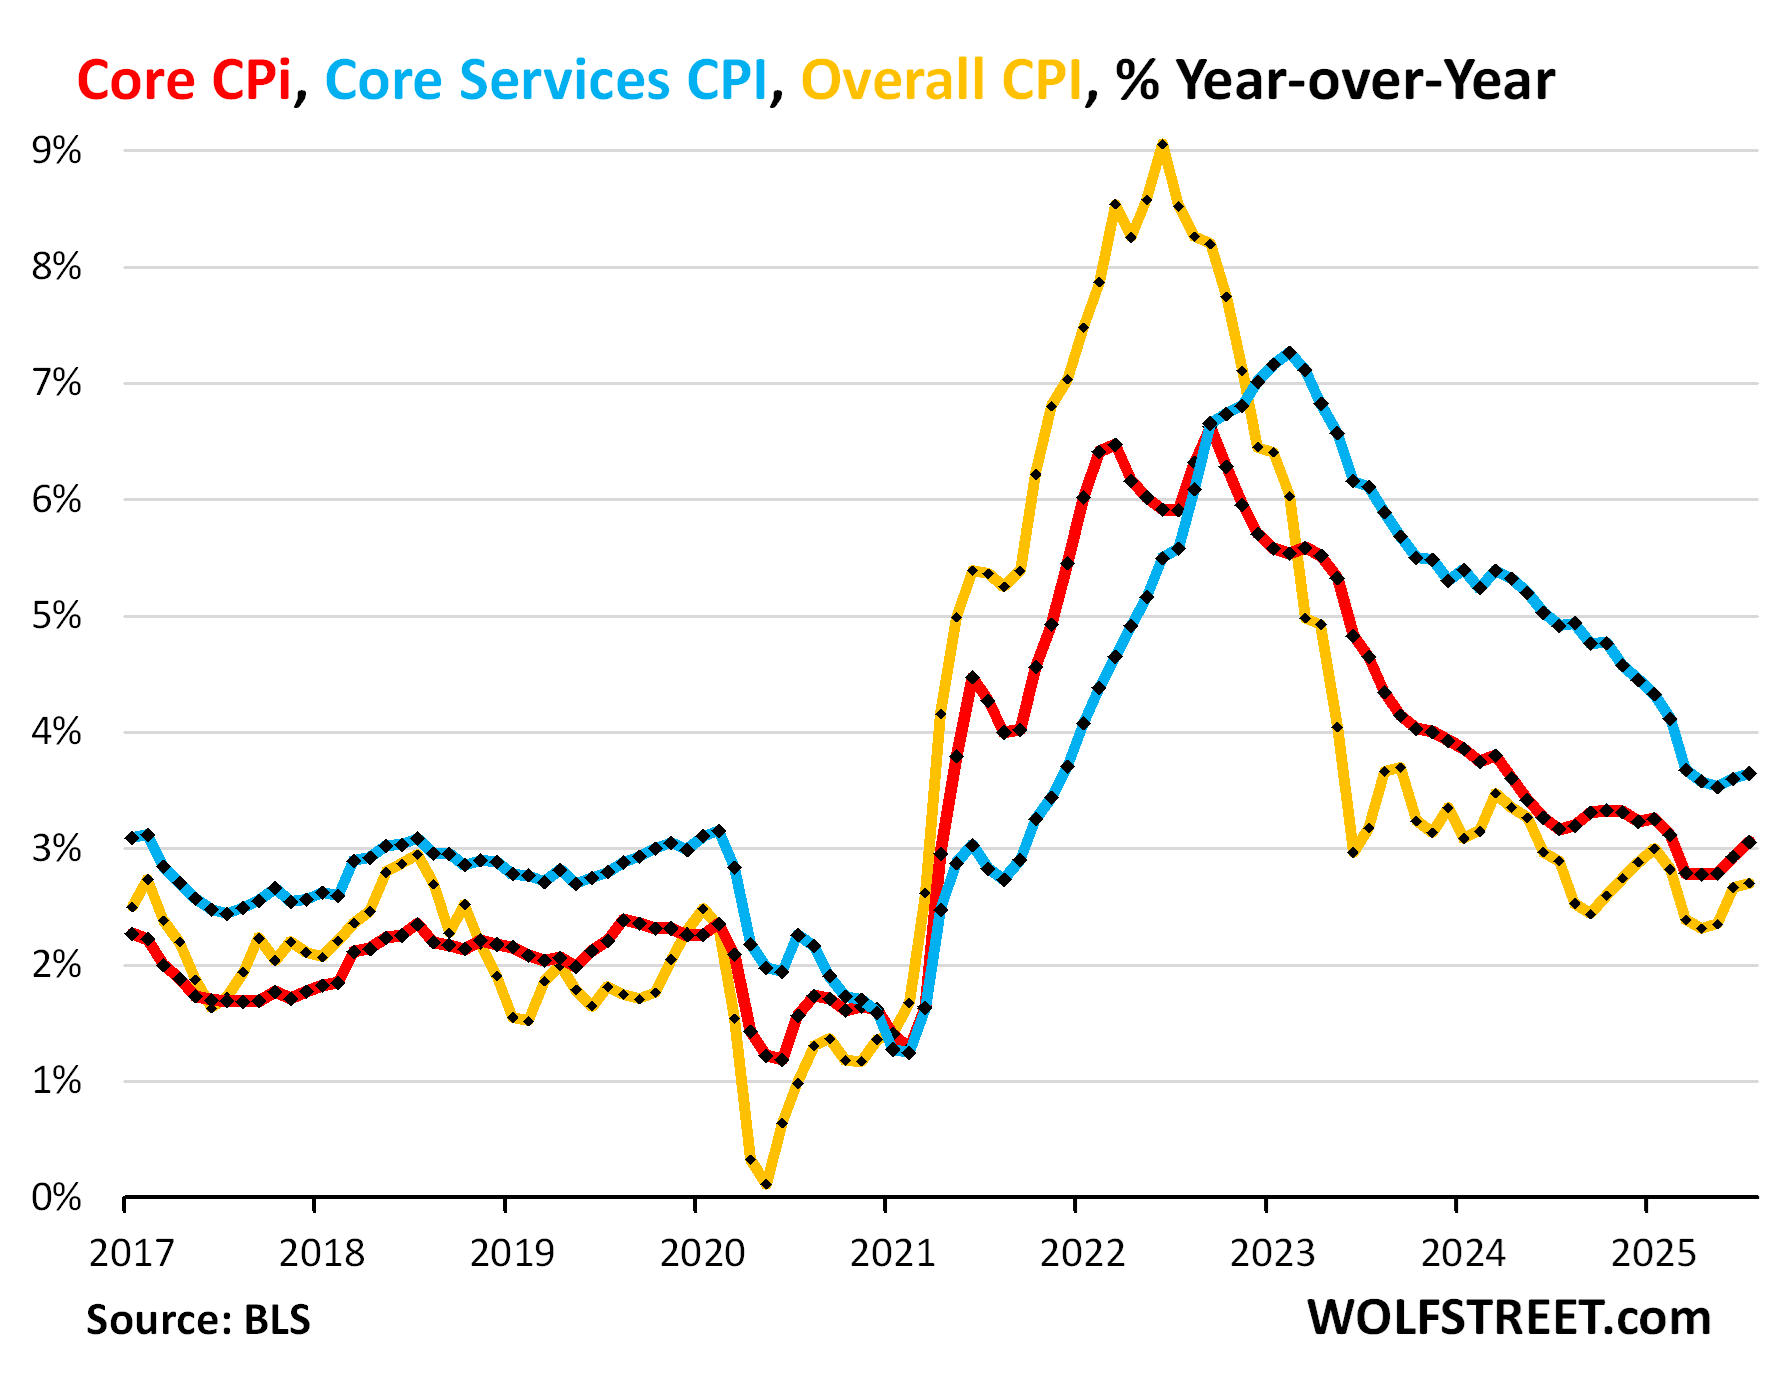
“Core” CPI, which excludes food and energy components to track underlying inflation, accelerated to +0.32% in July from June (+3.9% annualized), the worst in six months.
The driver was the core services CPI, which totally dominates the core CPI. Durable goods prices, which had been pushing down core CPI in the prior months, increased in July, instead of pushing down core CPI, and that made matters worse.
The 3-month “core” CPI accelerated to +2.8% annualized, the worst since March (red).
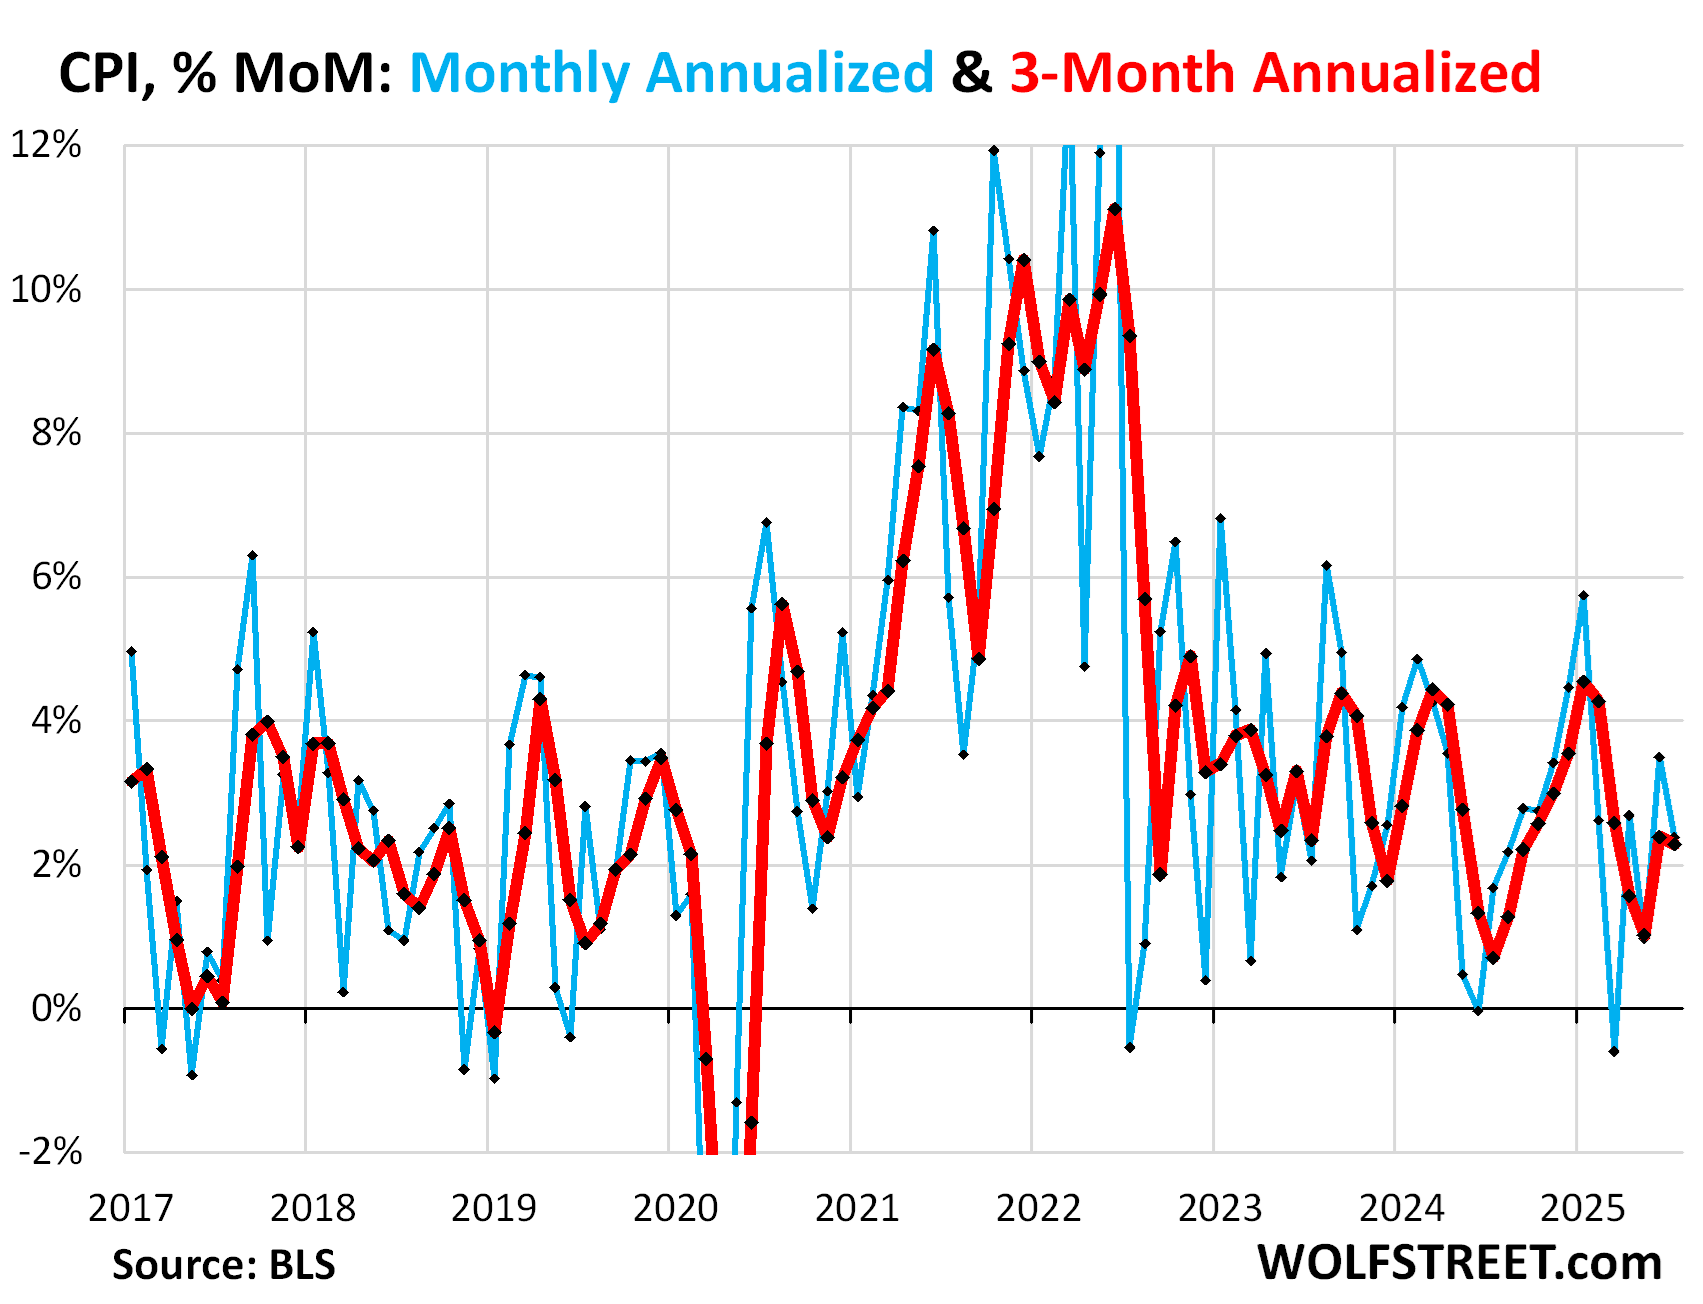
The overall CPI, which includes food and energy, rose by 0.20% (+2.4% annualized) in July from June.
Drivers behind this deceleration were the sharp month-to-month drop in energy prices and the drop in food prices.
The 3-month CPI rose by 2.3% annualized, a slight deceleration from June.
Year-over-year price changes:
- Overall CPI: +2.7% (gold), same as in the prior month, and both were the worst since February.
- Core CPI +3.1% (red), the third acceleration in a row and the worst since February.
- Core Services CPI: +3.65% (blue), the second acceleration in a row and the worst since March.
Housing components of core services.
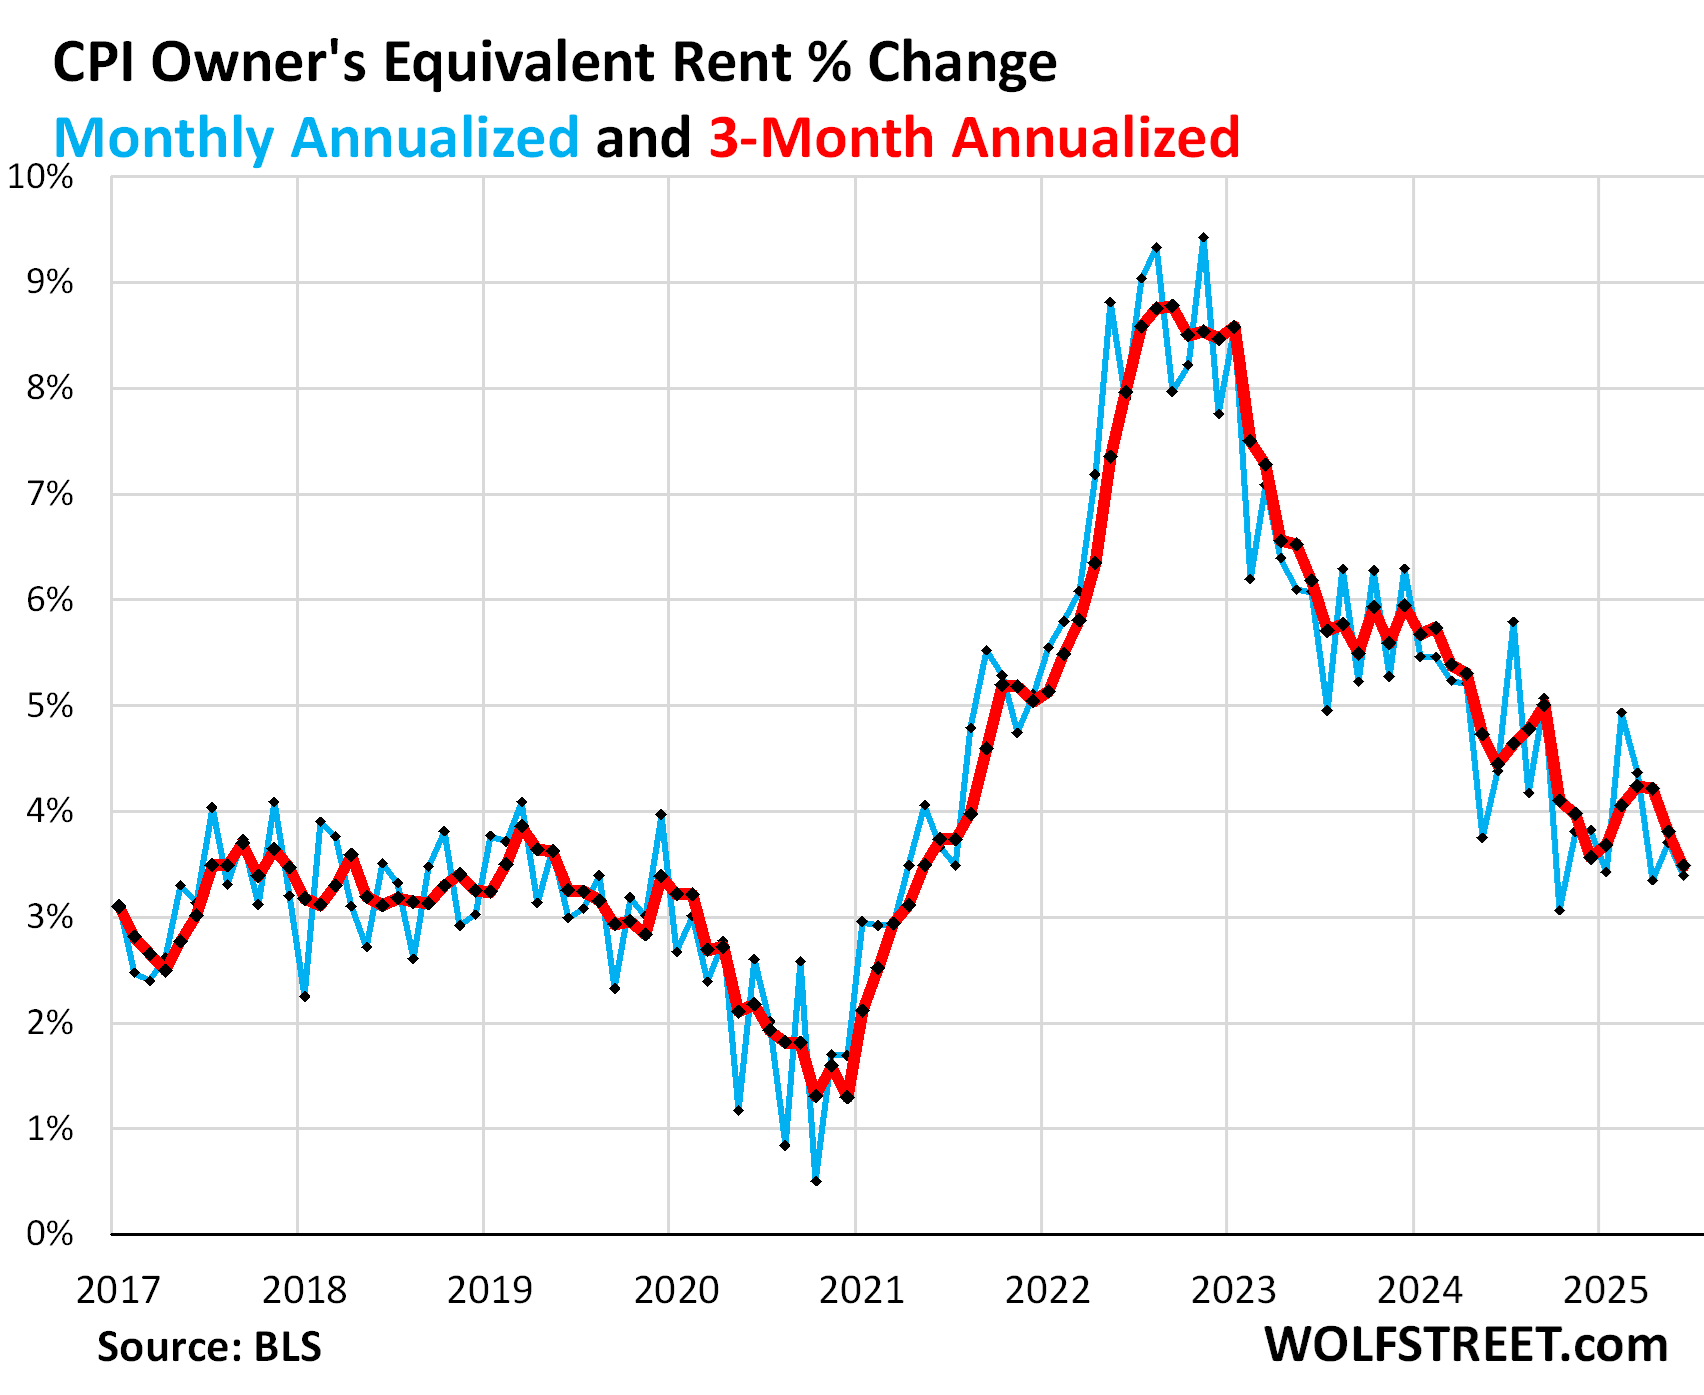
Owners’ Equivalent of Rent CPI decelerated to +0.28% (+3.4% annualized) in July from June.
The three-month average decelerated to +3.5% annualized.
OER indirectly reflects the expenses of homeownership: homeowners’ insurance, HOA fees, property taxes, and maintenance. It’s the only measure for those expenses in the CPI. It is based on what a large group of homeowners estimates their home would rent for, with the assumption that a homeowner would want to recoup their cost increases by raising the rent.
As a stand-in for homeowners’ expenses, OER accounts for 26.2% of overall CPI and estimates inflation of shelter as a service for homeowners.
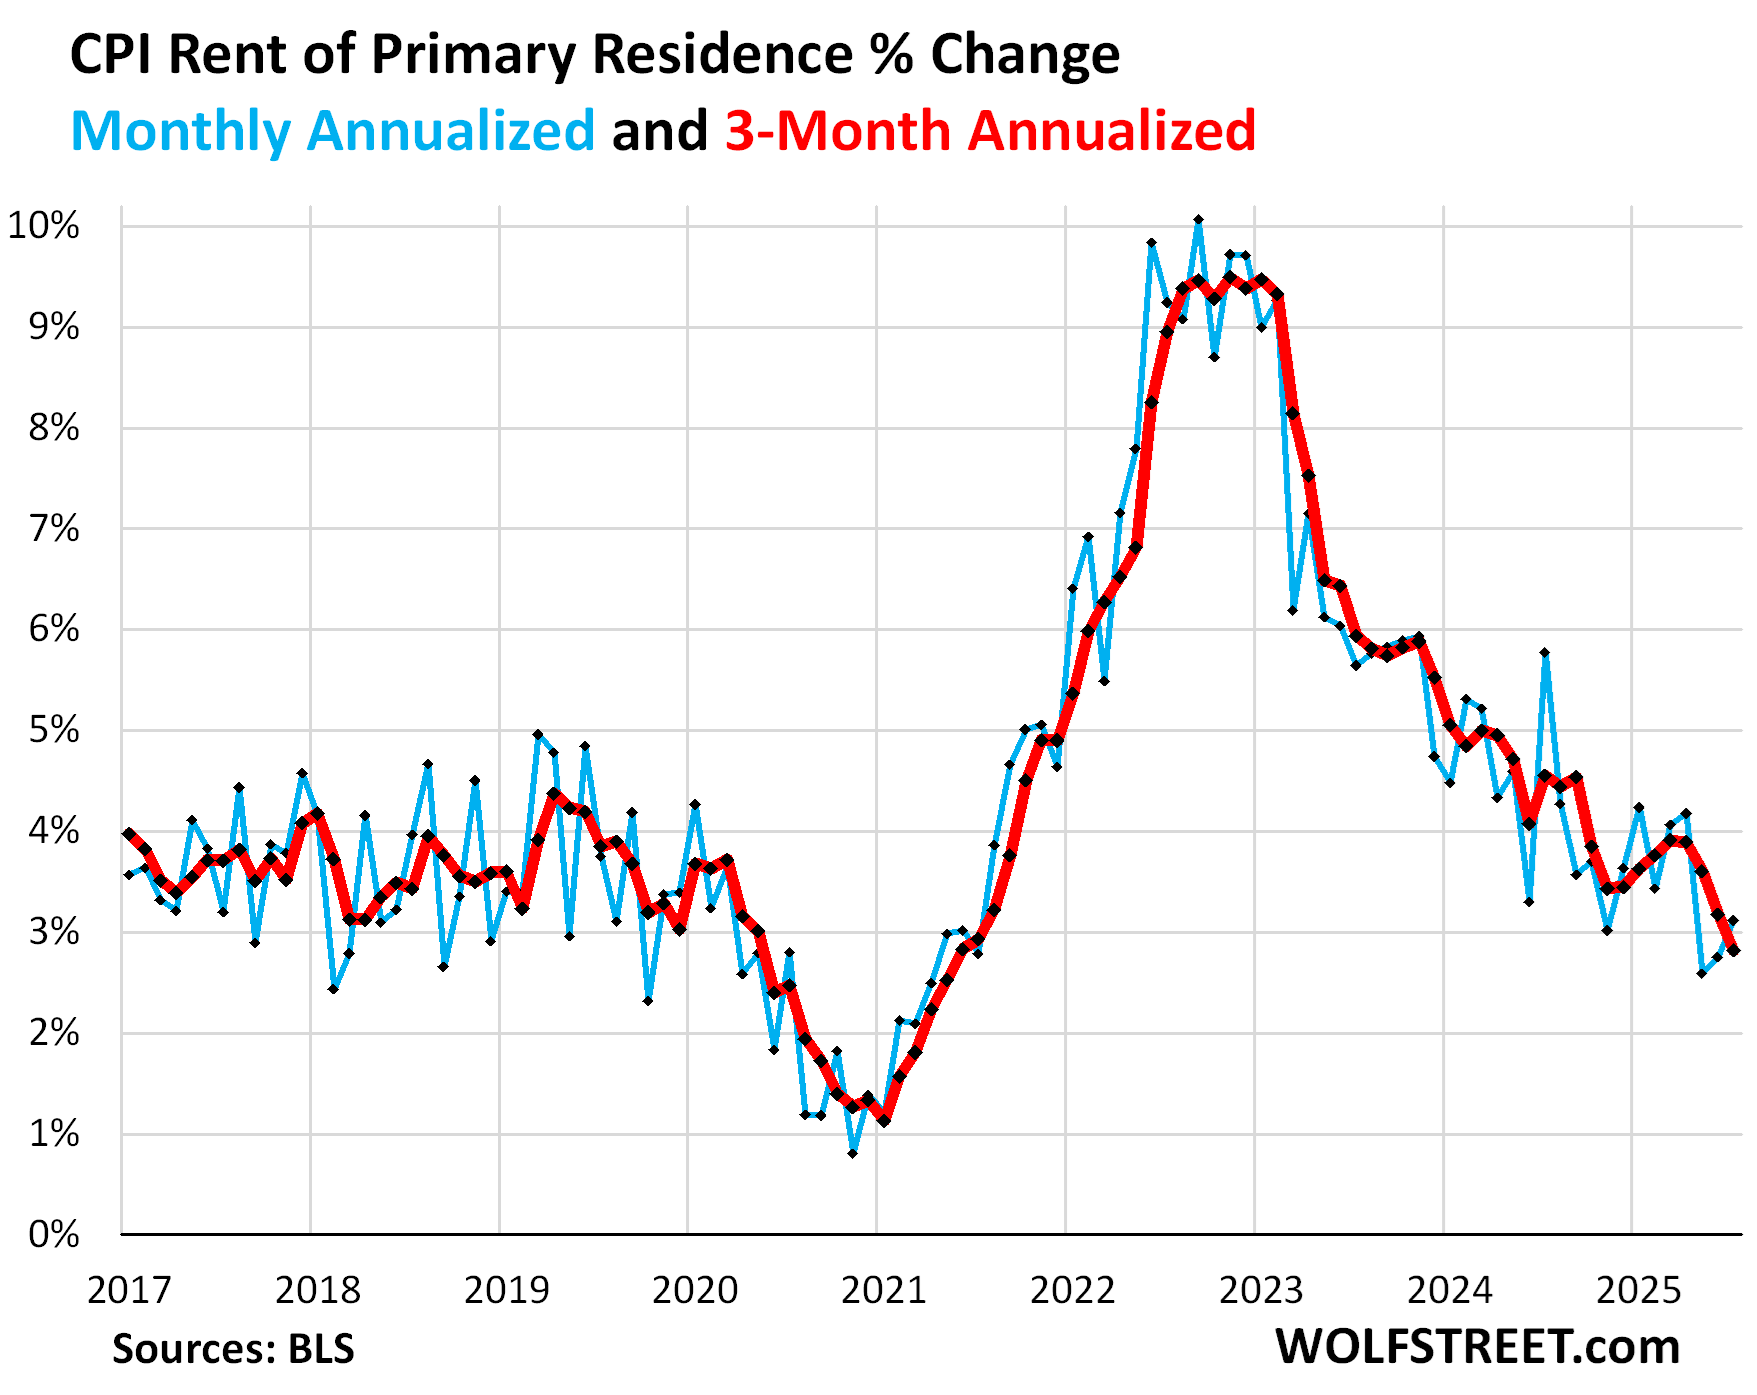
Rent of Primary Residence CPI accelerated a hair to +0.26% (+3.1% annualized) in July from June, the second acceleration in a row.
The 3-month rate continued to decelerate, to +2.8% annualized, the lowest since mid-2021.
Rents are no longer the driver of services inflation; the drivers of services inflation are now in other services.
Rent CPI accounts for 7.5% of overall CPI. It is based on rents that tenants actually paid, not on asking rents of advertised vacant units for rent. The survey follows the same large group of rental houses and apartments over time and tracks the rents that the current tenants, who come and go, pay in rent for these units.
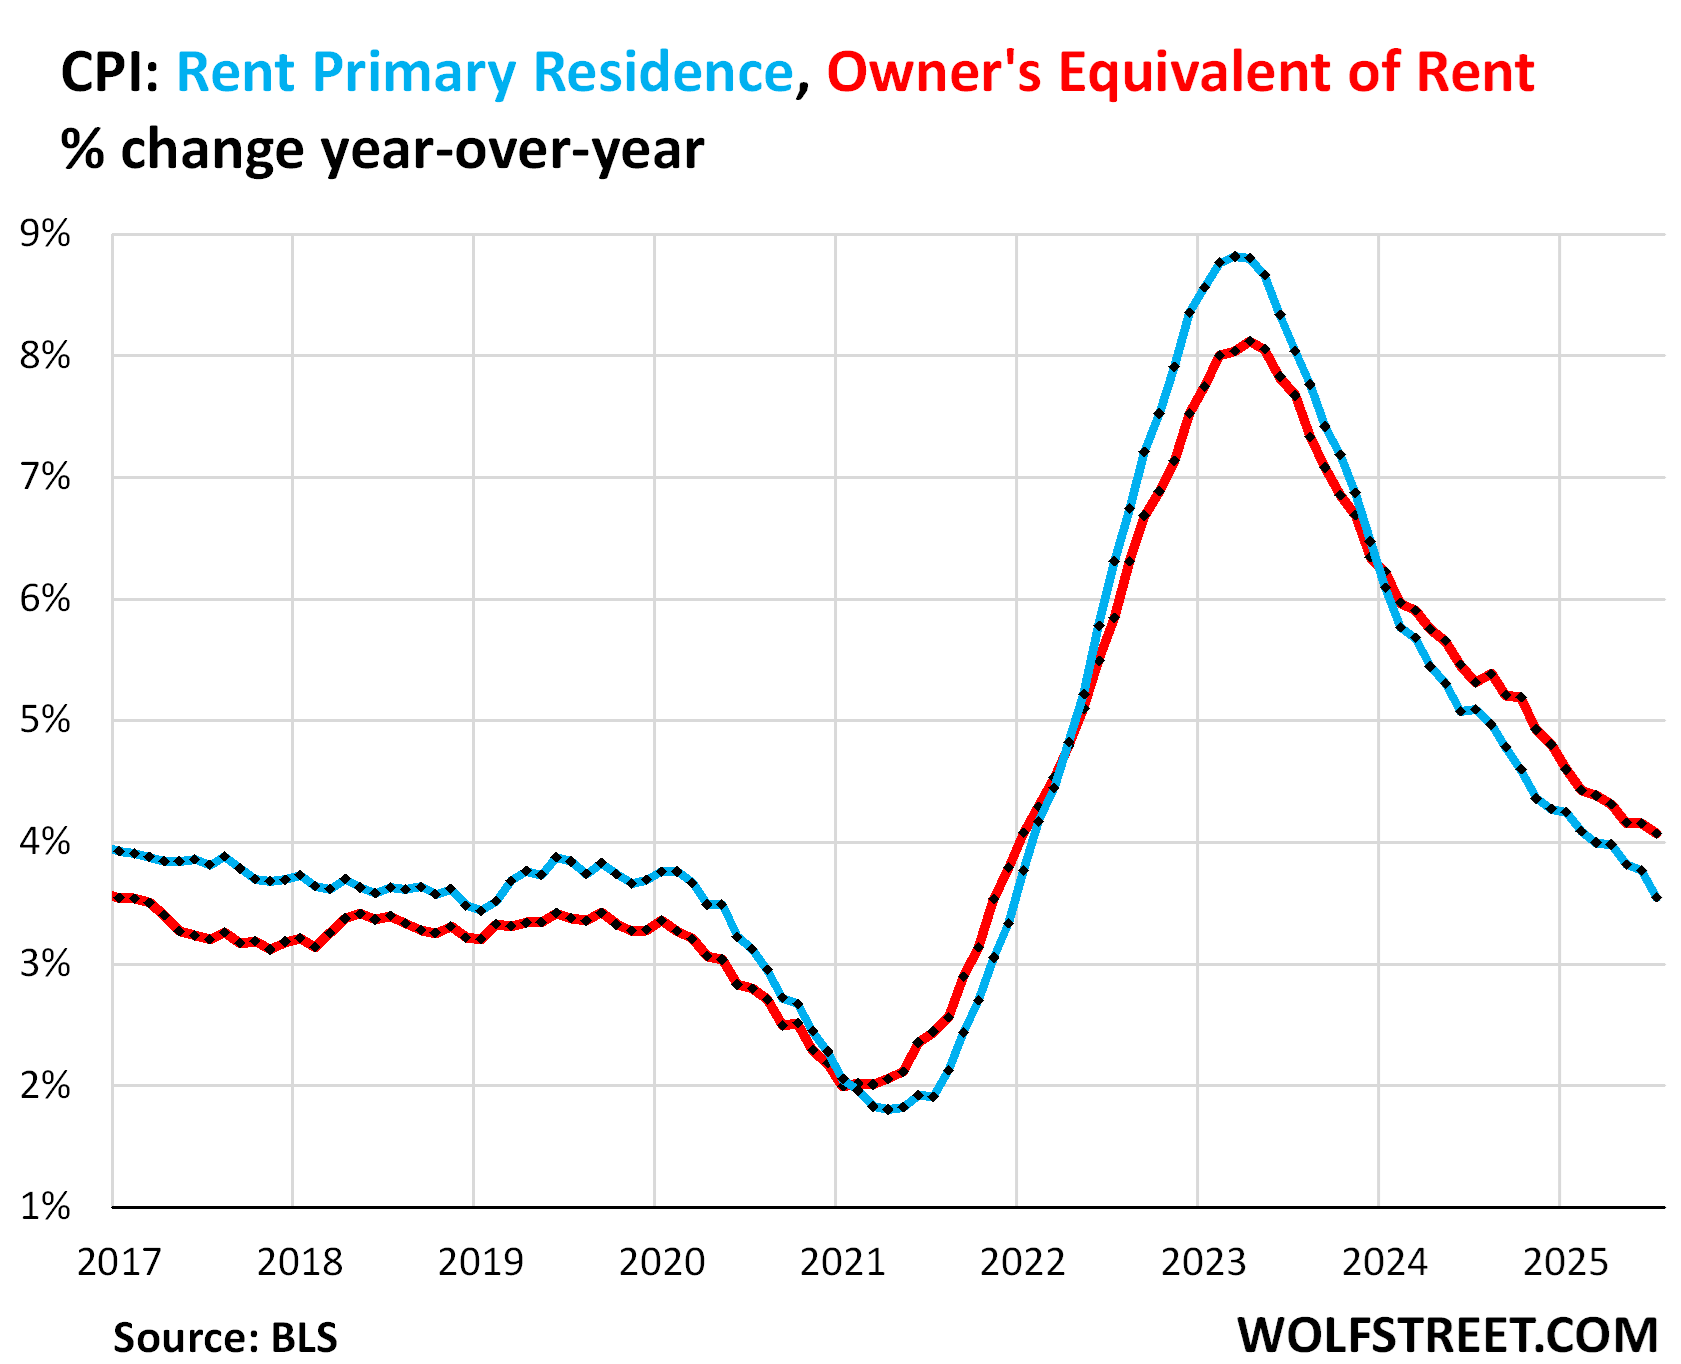
Year-over-year, OER rose by 4.1%, continuing the deceleration, but still substantially higher than before the pandemic (red in the chart below).
Rent CPI (blue in the chart below) rose by 3.5%, continuing the deceleration. It is now back in the range that prevailed before the pandemic.
The table below shows the major categories of “core services.” Combined, they accounted for over 60% of total CPI:
| Major Services ex. Energy Services | MoM | YoY |
| Core Services | 0.4% | 3.6% |
| Owner’s equivalent of rent | 0.3% | 4.1% |
| Rent of primary residence | 0.3% | 3.5% |
| Medical care services & insurance | 0.8% | 4.3% |
| Motor vehicle insurance | 0.1% | 5.3% |
| Education (tuition, childcare, school fees) | 0.4% | 3.5% |
| Admission, movies, concerts, sports events, club memberships | 0.7% | 4.4% |
| Other personal services (dry-cleaning, haircuts, legal services…) | 0.5% | 4.5% |
| Public transportation (airline fares, etc.) | 3.0% | 0.7% |
| Telephone & wireless services | -0.1% | -0.5% |
| Lodging away from home, incl Hotels, motels | -1.3% | -4.8% |
| Water, sewer, trash collection services | 0.4% | 5.3% |
| Motor vehicle maintenance & repair | 1.0% | 6.5% |
| Internet services | 0.0% | -2.4% |
| Video and audio services, cable, streaming | -0.3% | 2.2% |
| Pet services, including veterinary | 0.4% | 6.0% |
| Tenants’ & Household insurance | 1.0% | 5.8% |
| Car and truck rental | -2.9% | 0.7% |
| Postage & delivery services | 0.4% | 3.1% |
Food Inflation.
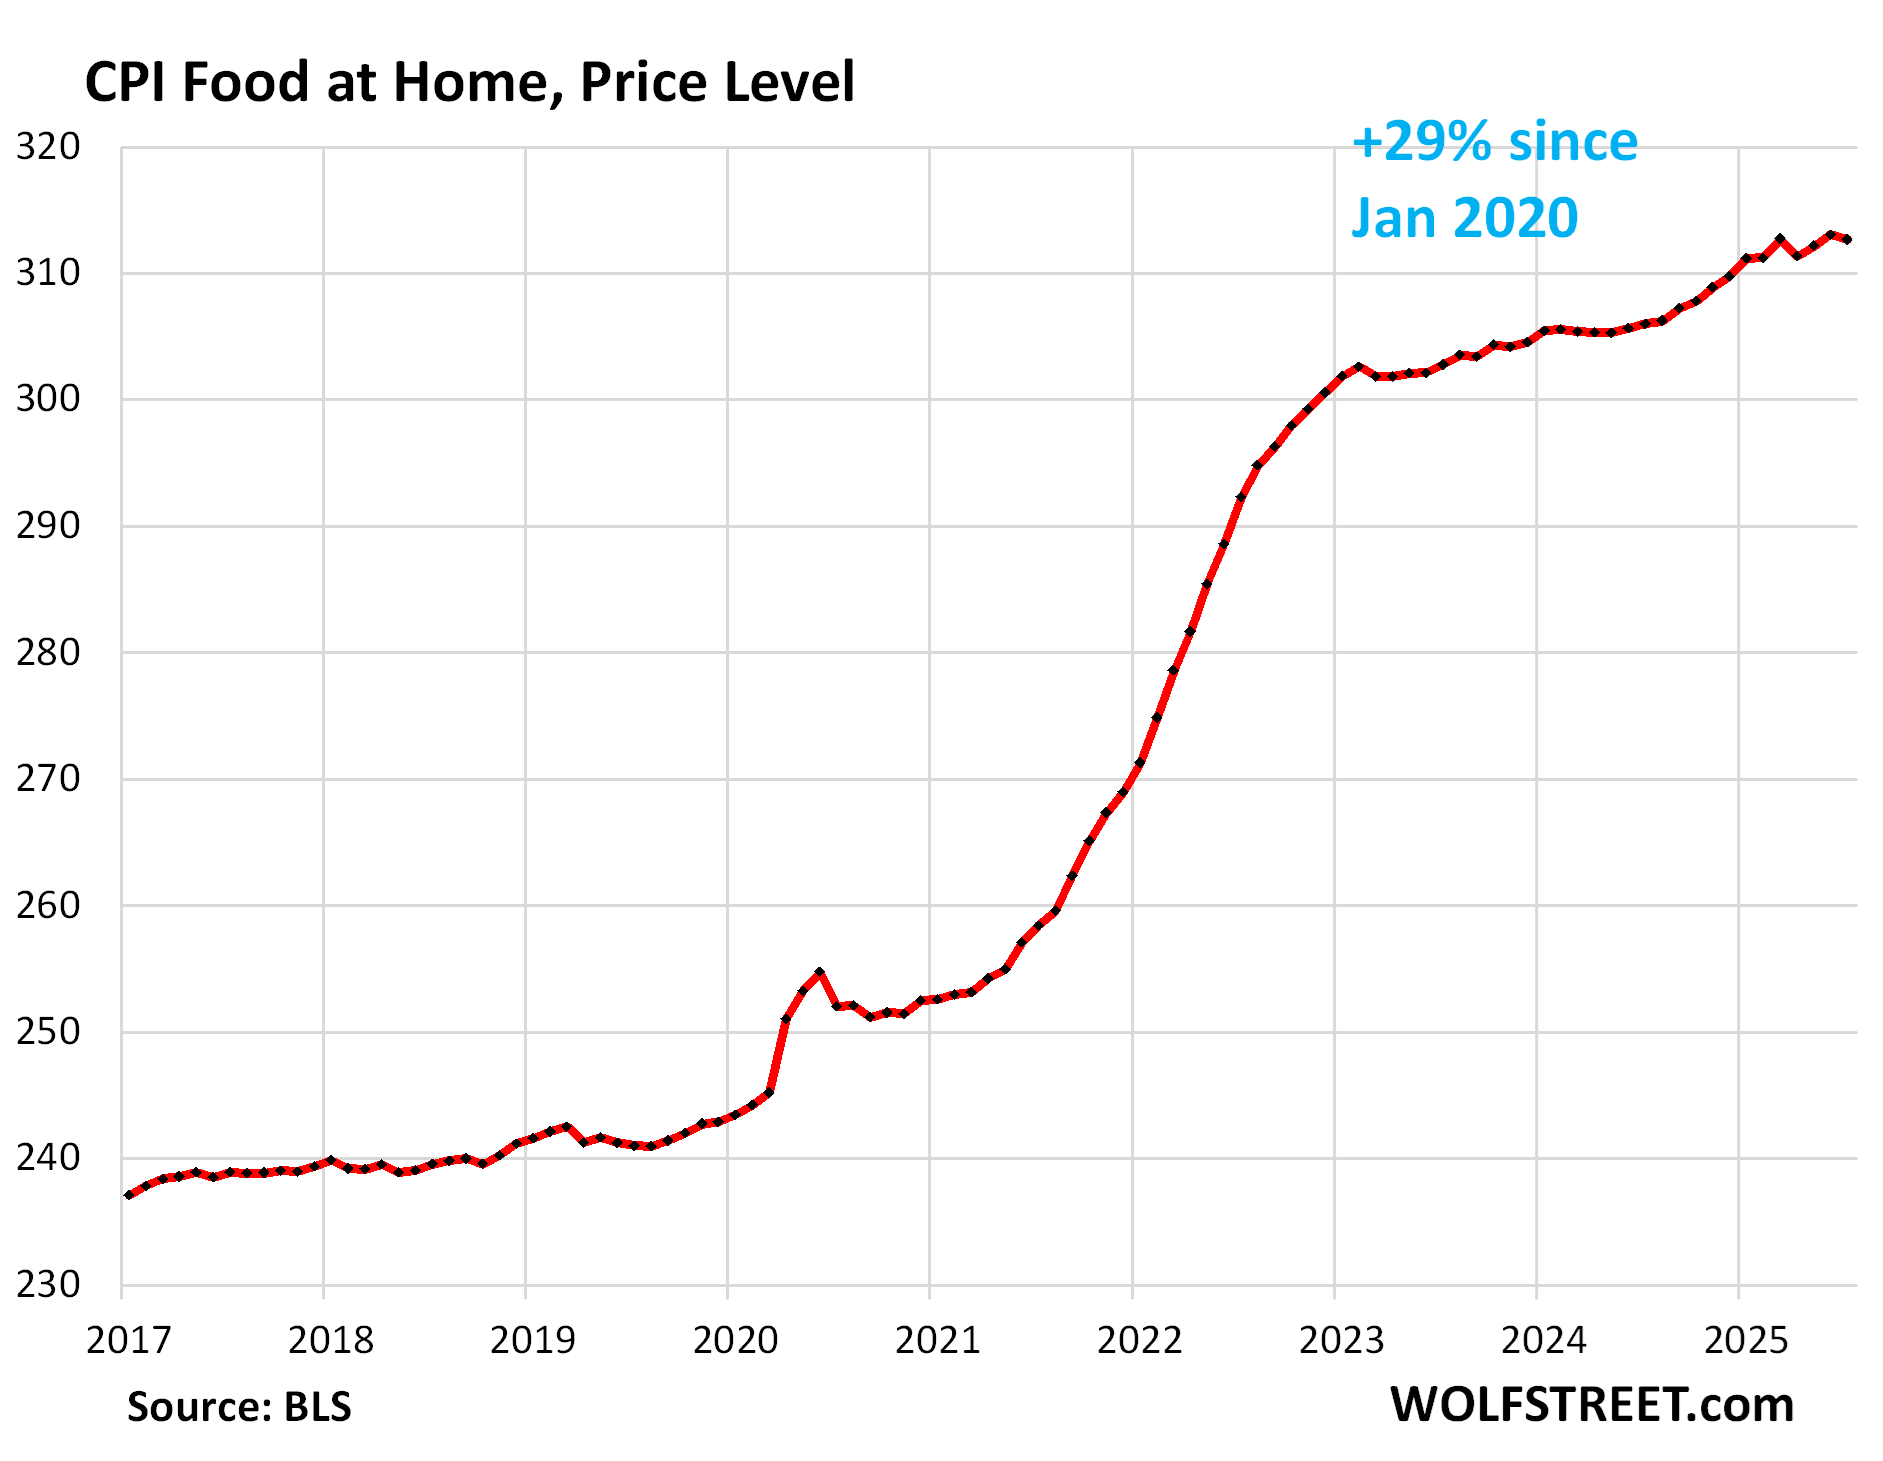
The CPI for “Food at home” dipped a hair (-0.1%) in July from June (-1.4% annualized), but rose 2.2% year-over-year.
Since January 2020, food prices have surged by 27%.
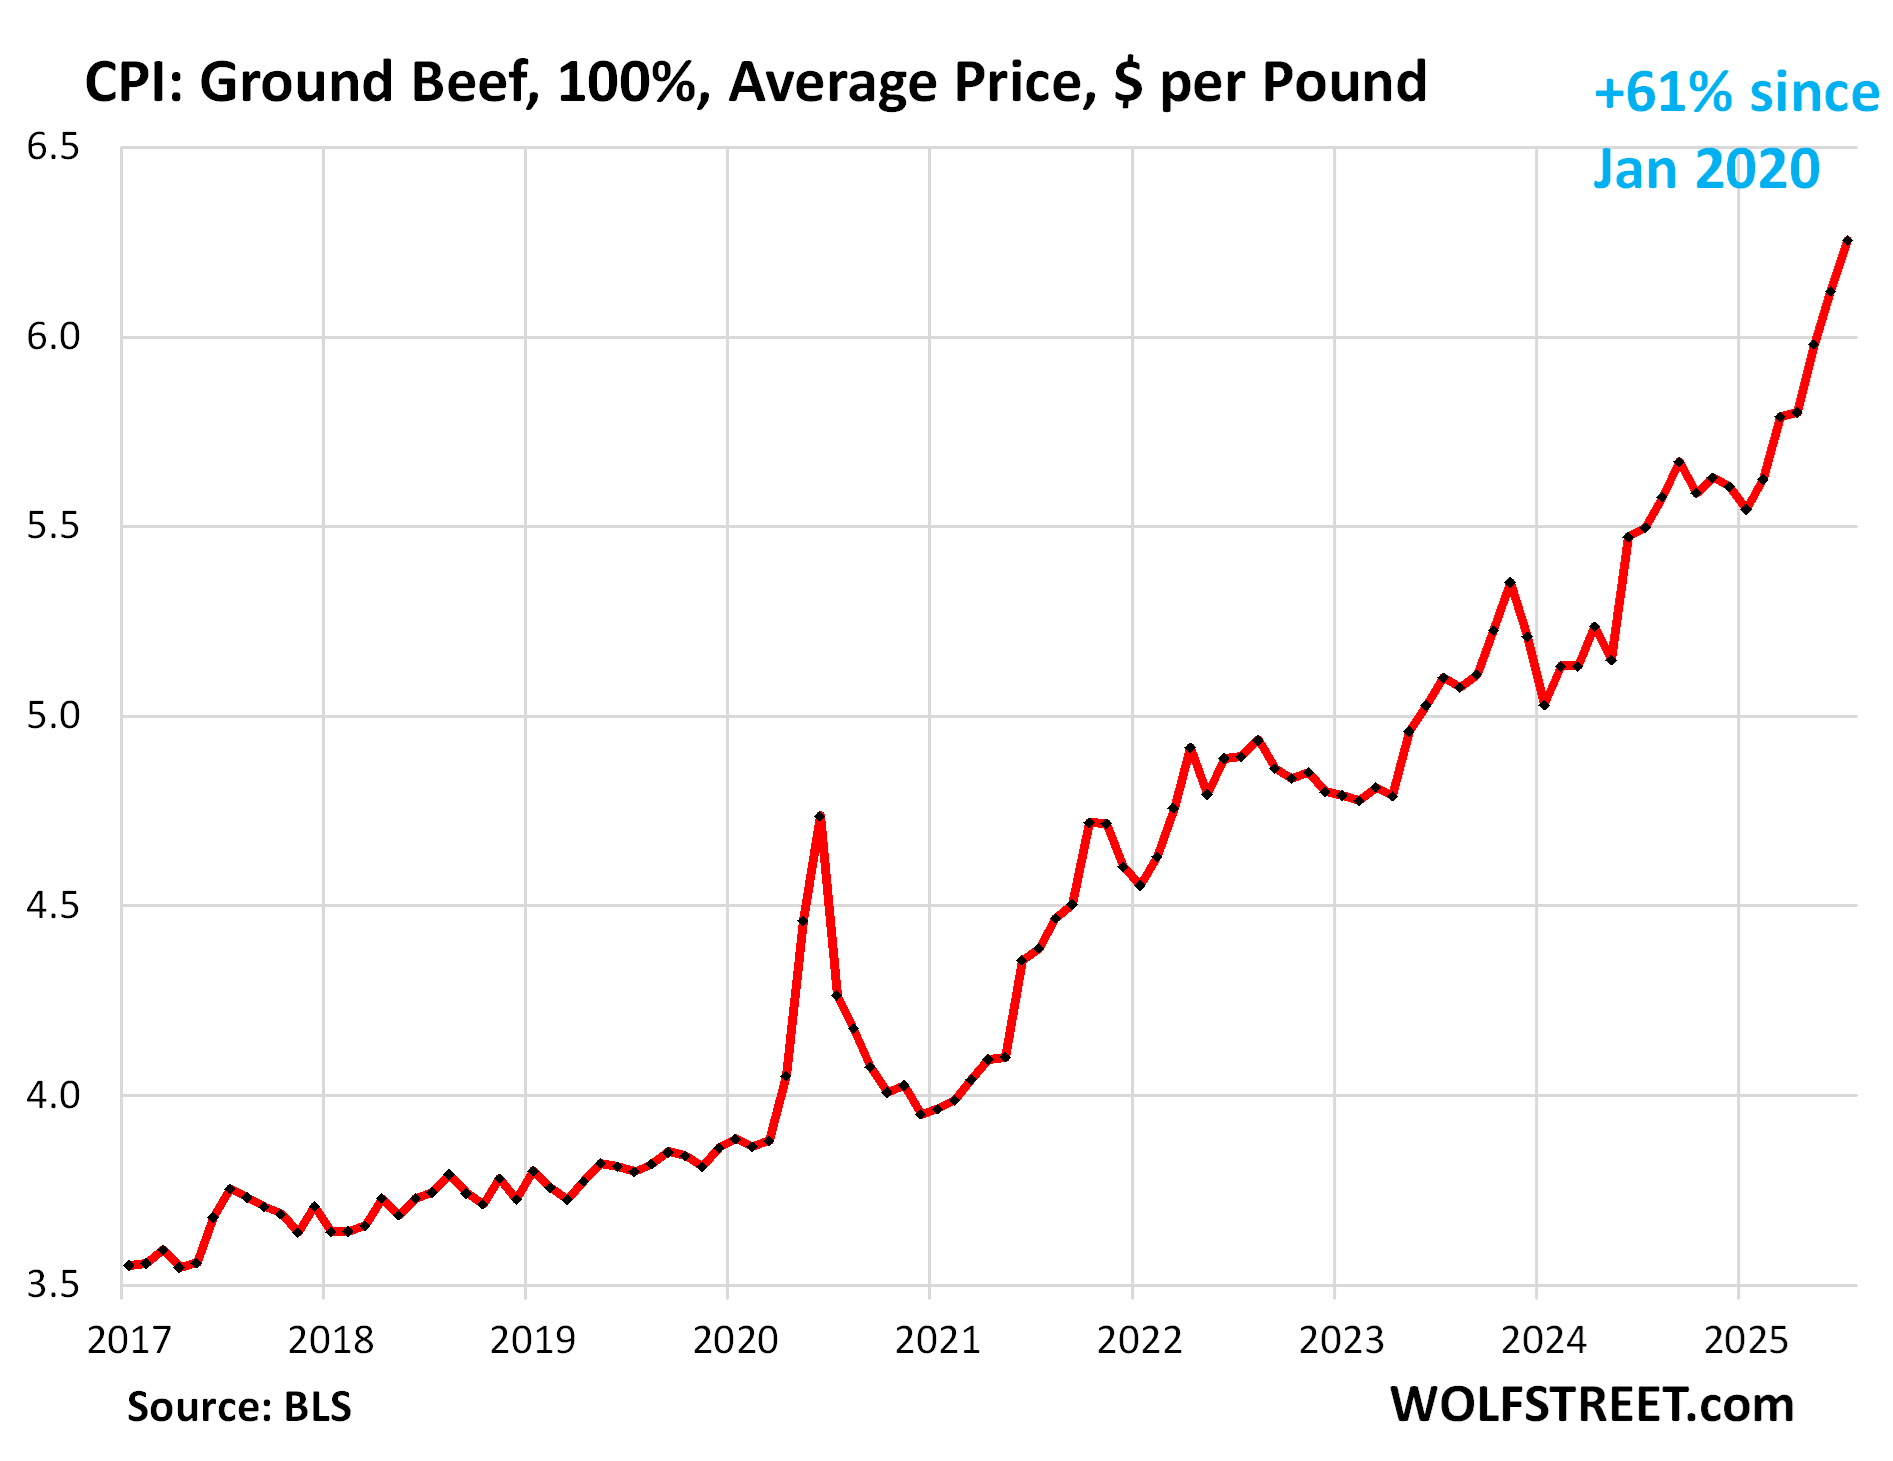
Beef has been a culprit for years and has become extremely expensive as US cattle herds have dropped for a slew of reasons to a 64-year low.
Overall beef prices spiked by 1.5% in July from June and by 11.3% year-over-year.
For example, the average price of a pound of ground beef spiked by 2.2% month-over-month (+29% annualized) and by 13.8% year-over-year, to $6.25.
Since January 2020, the average price of ground beef has spiked by 61%. This is a years-long issue:
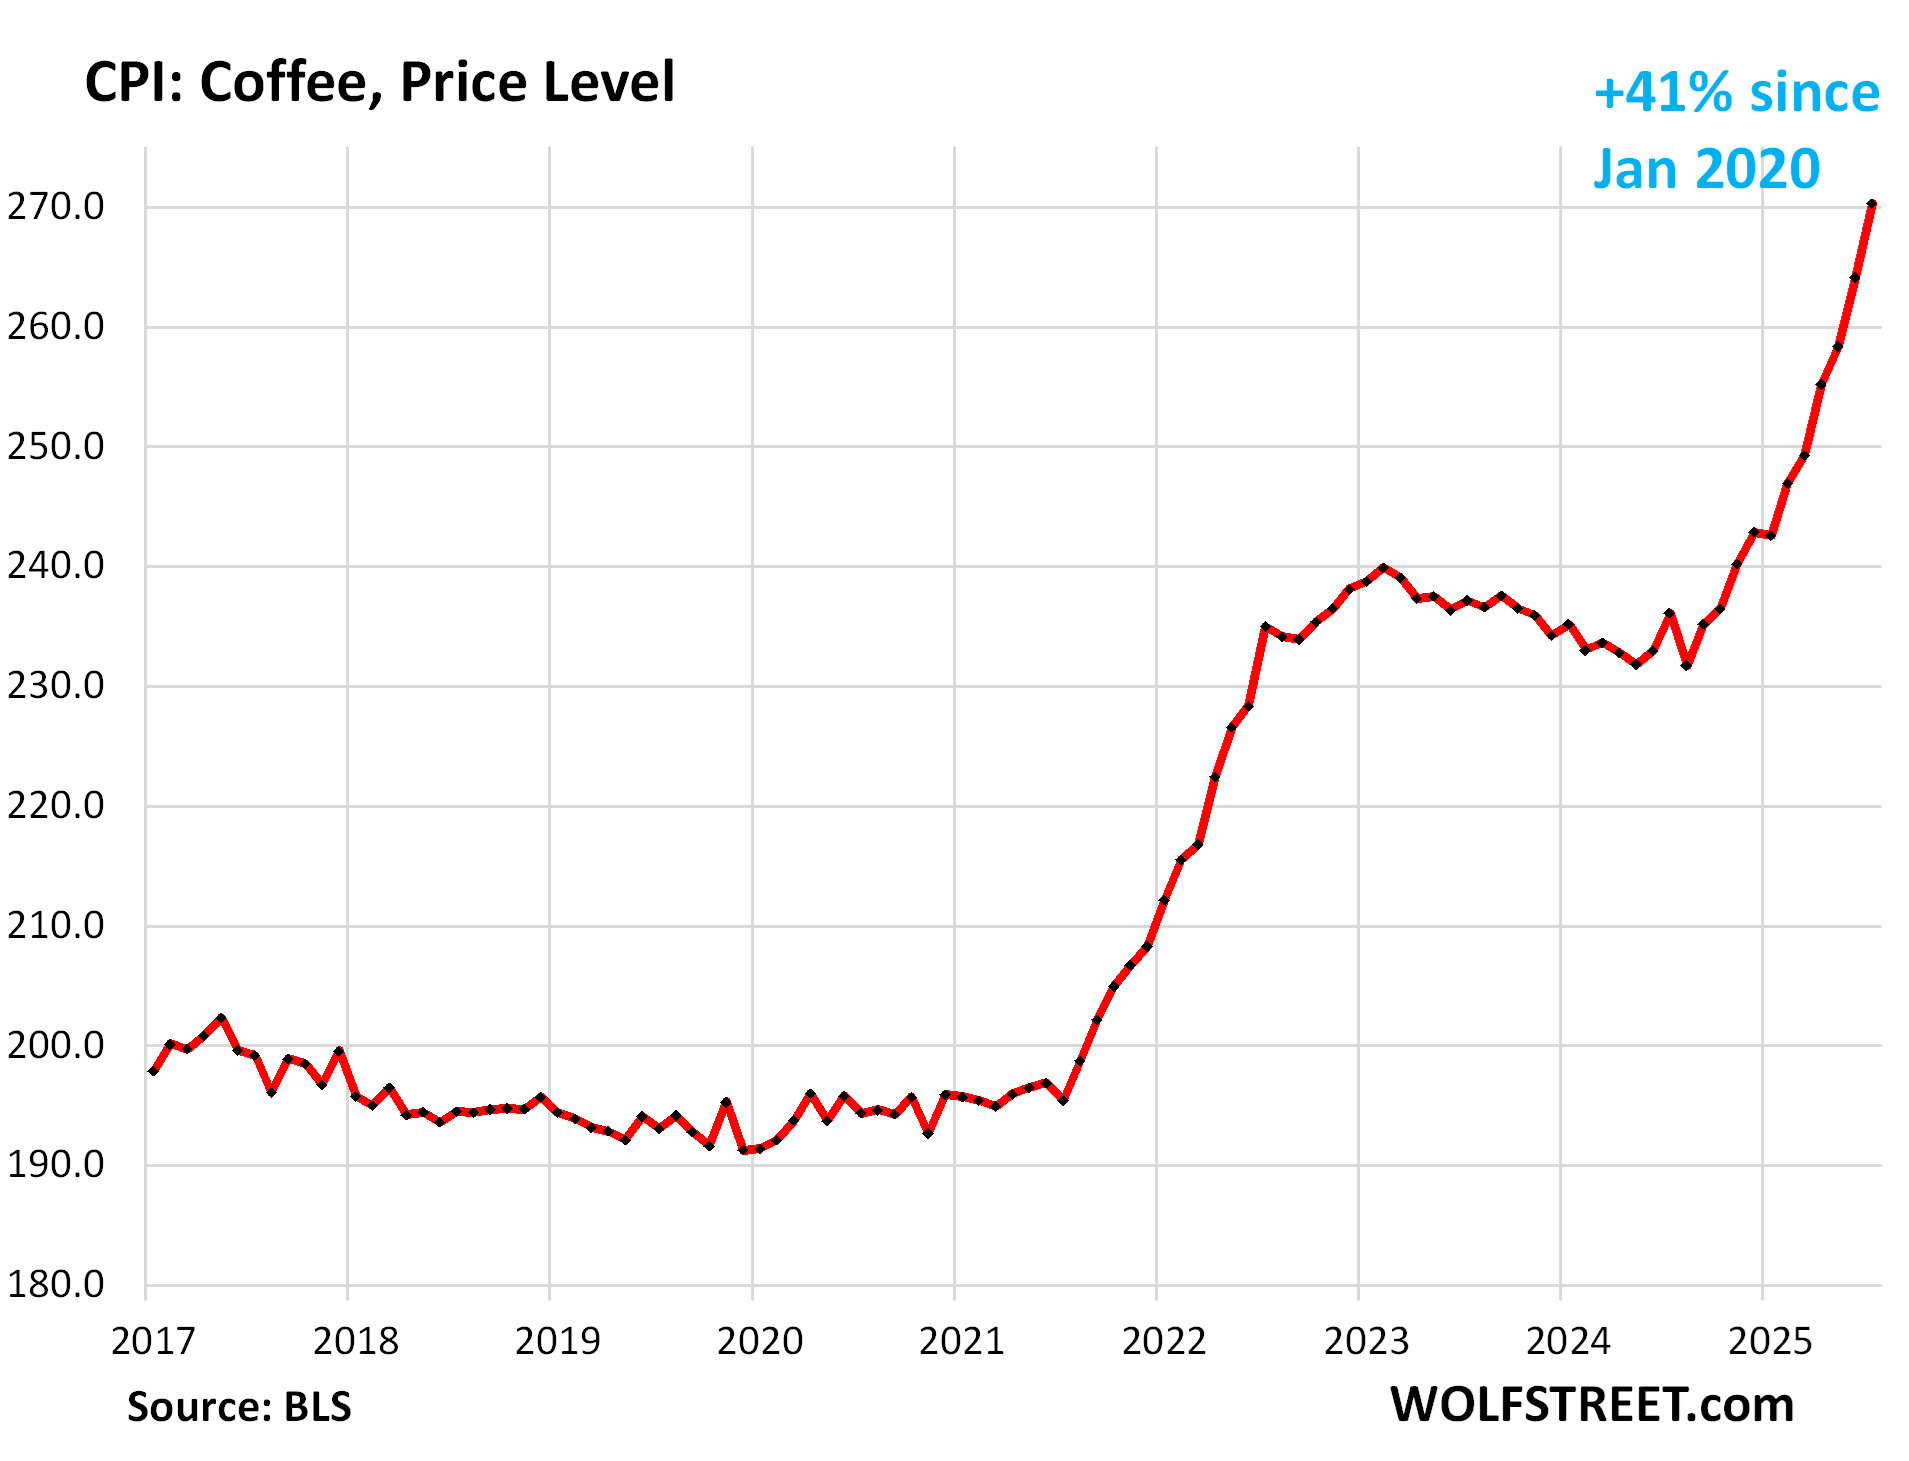
Coffee spiked by 2.3% for the month and by 14.5% year-over-year. Since mid-2021, when this price surge began, the CPI for coffee surged 41% following global commodity coffee prices:
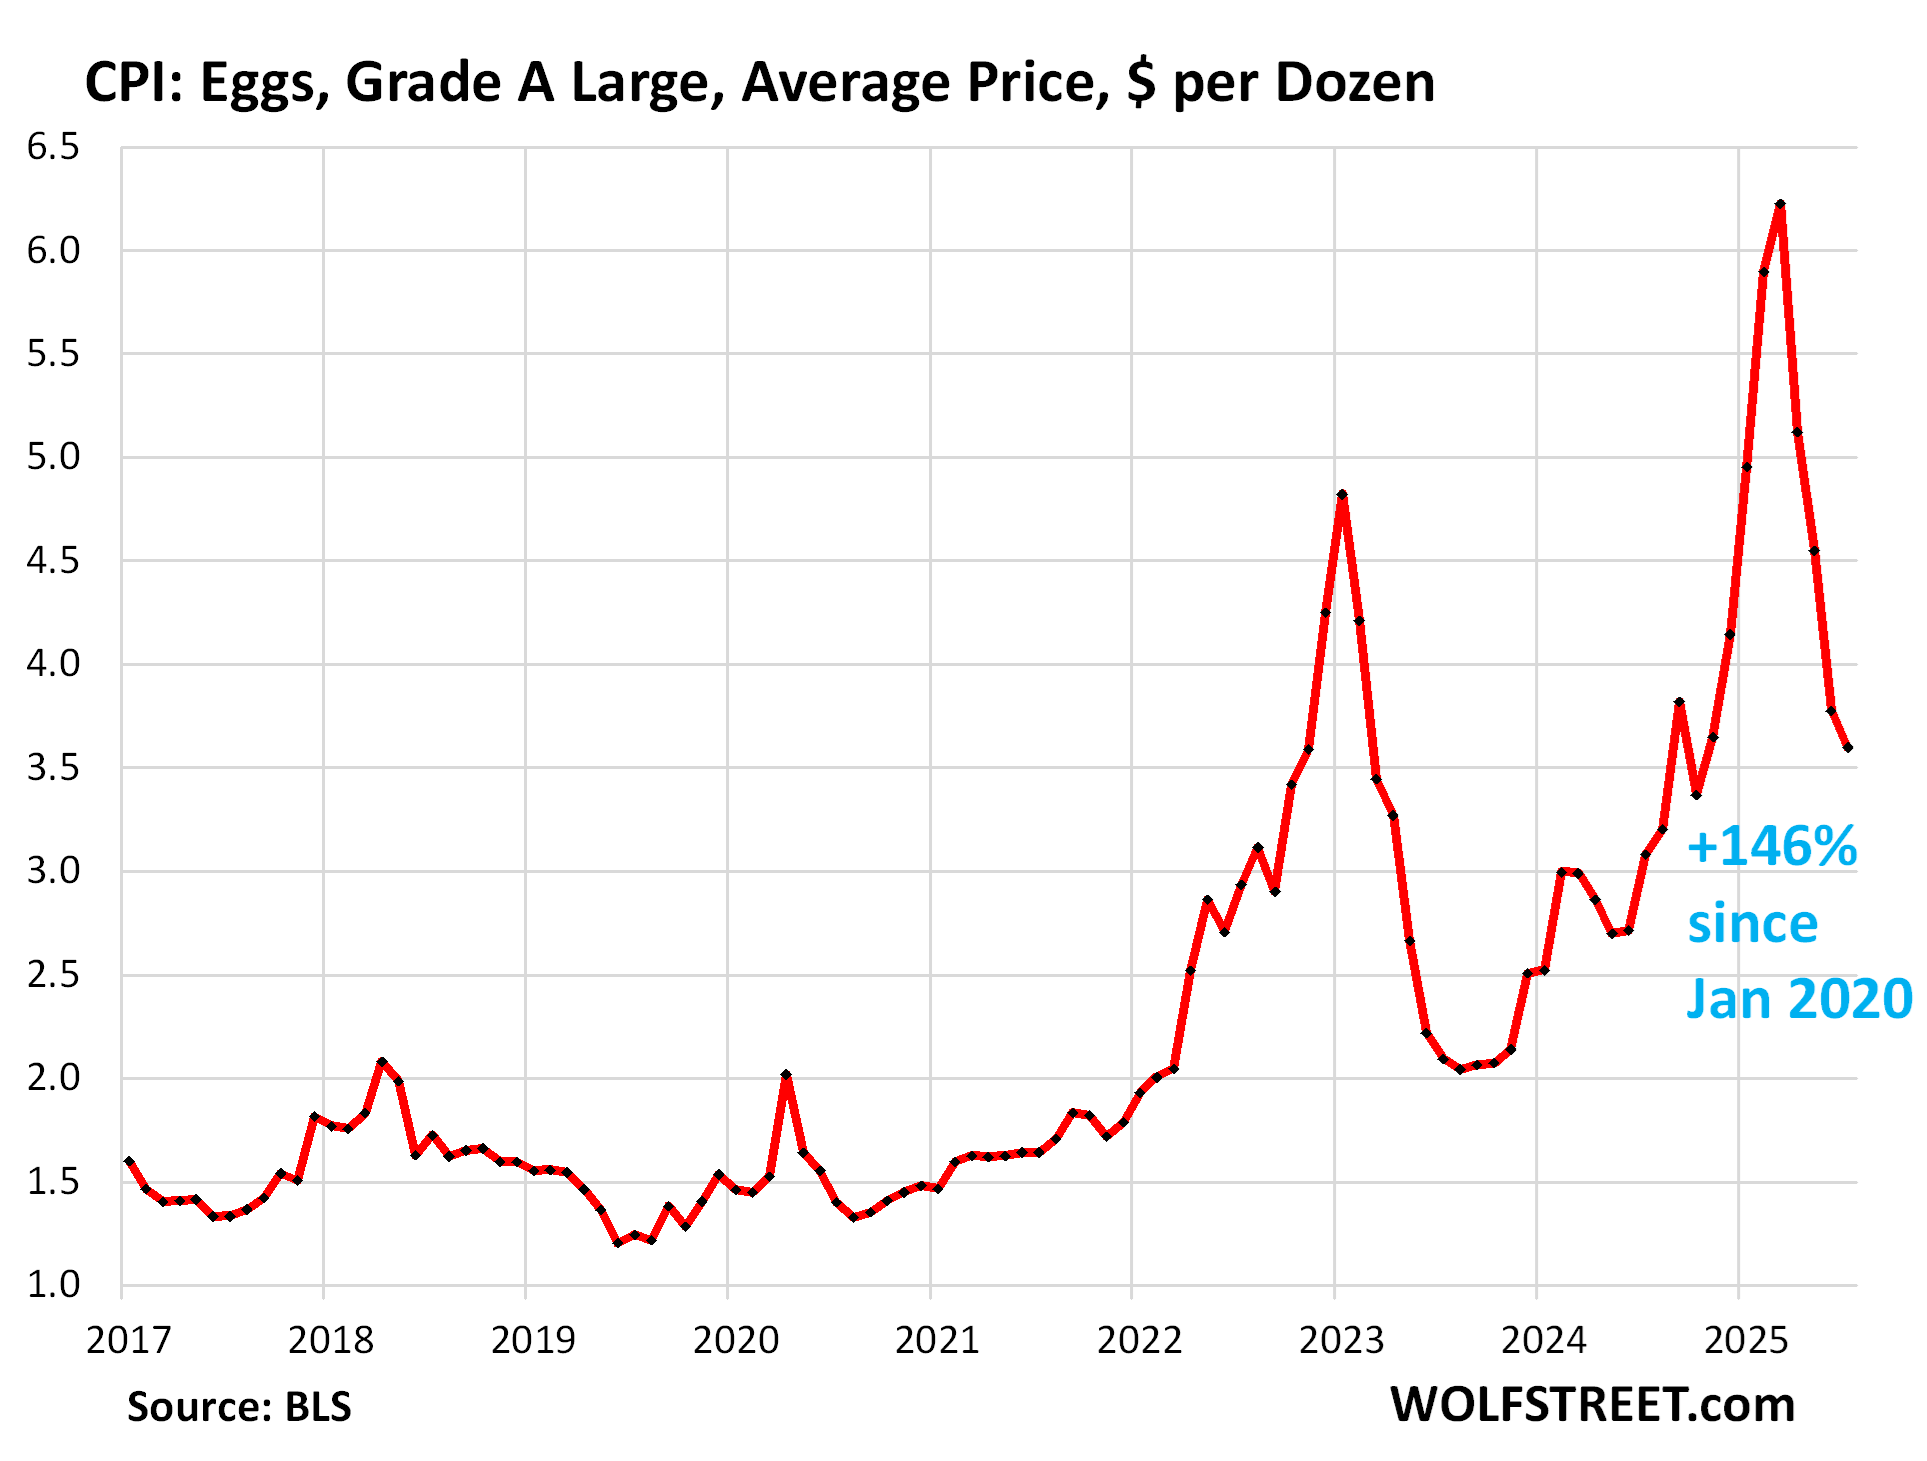
But egg prices continued to plunge for the fourth month in a row, as they unwind their avian-flu-driven price spike.
For example, the average price of a dozen Grade A large eggs dropped another 3.9% in July from June, to $3.60, bringing the four-month plunge to 42%.
But they’d spiked so much during the avian flu period through March that even after this four-month plunge, they’re still up 16.4% year-over-year and by 146% from January 2020:
| MoM | YoY | |
| Food at home | -0.1% | 2.2% |
| Cereals, breads, bakery products | -0.2% | 1.0% |
| Beef and veal | 1.5% | 11.3% |
| Pork | 0.5% | 1.1% |
| Poultry | -0.1% | 3.1% |
| Fish and seafood | 0.4% | 1.7% |
| Eggs | -3.9% | 16.4% |
| Dairy and related products | 0.7% | 1.5% |
| Fresh fruits | -1.4% | 1.3% |
| Fresh vegetables | 1.2% | -0.8% |
| Juices and nonalcoholic drinks | -1.3% | 1.5% |
| Coffee, tea, etc. | 1.2% | 8.6% |
| Fats and oils | -1.5% | -1.4% |
| Baby food & formula | 0.9% | -2.3% |
| Alcoholic beverages at home | 0.1% | -0.2% |
Energy.
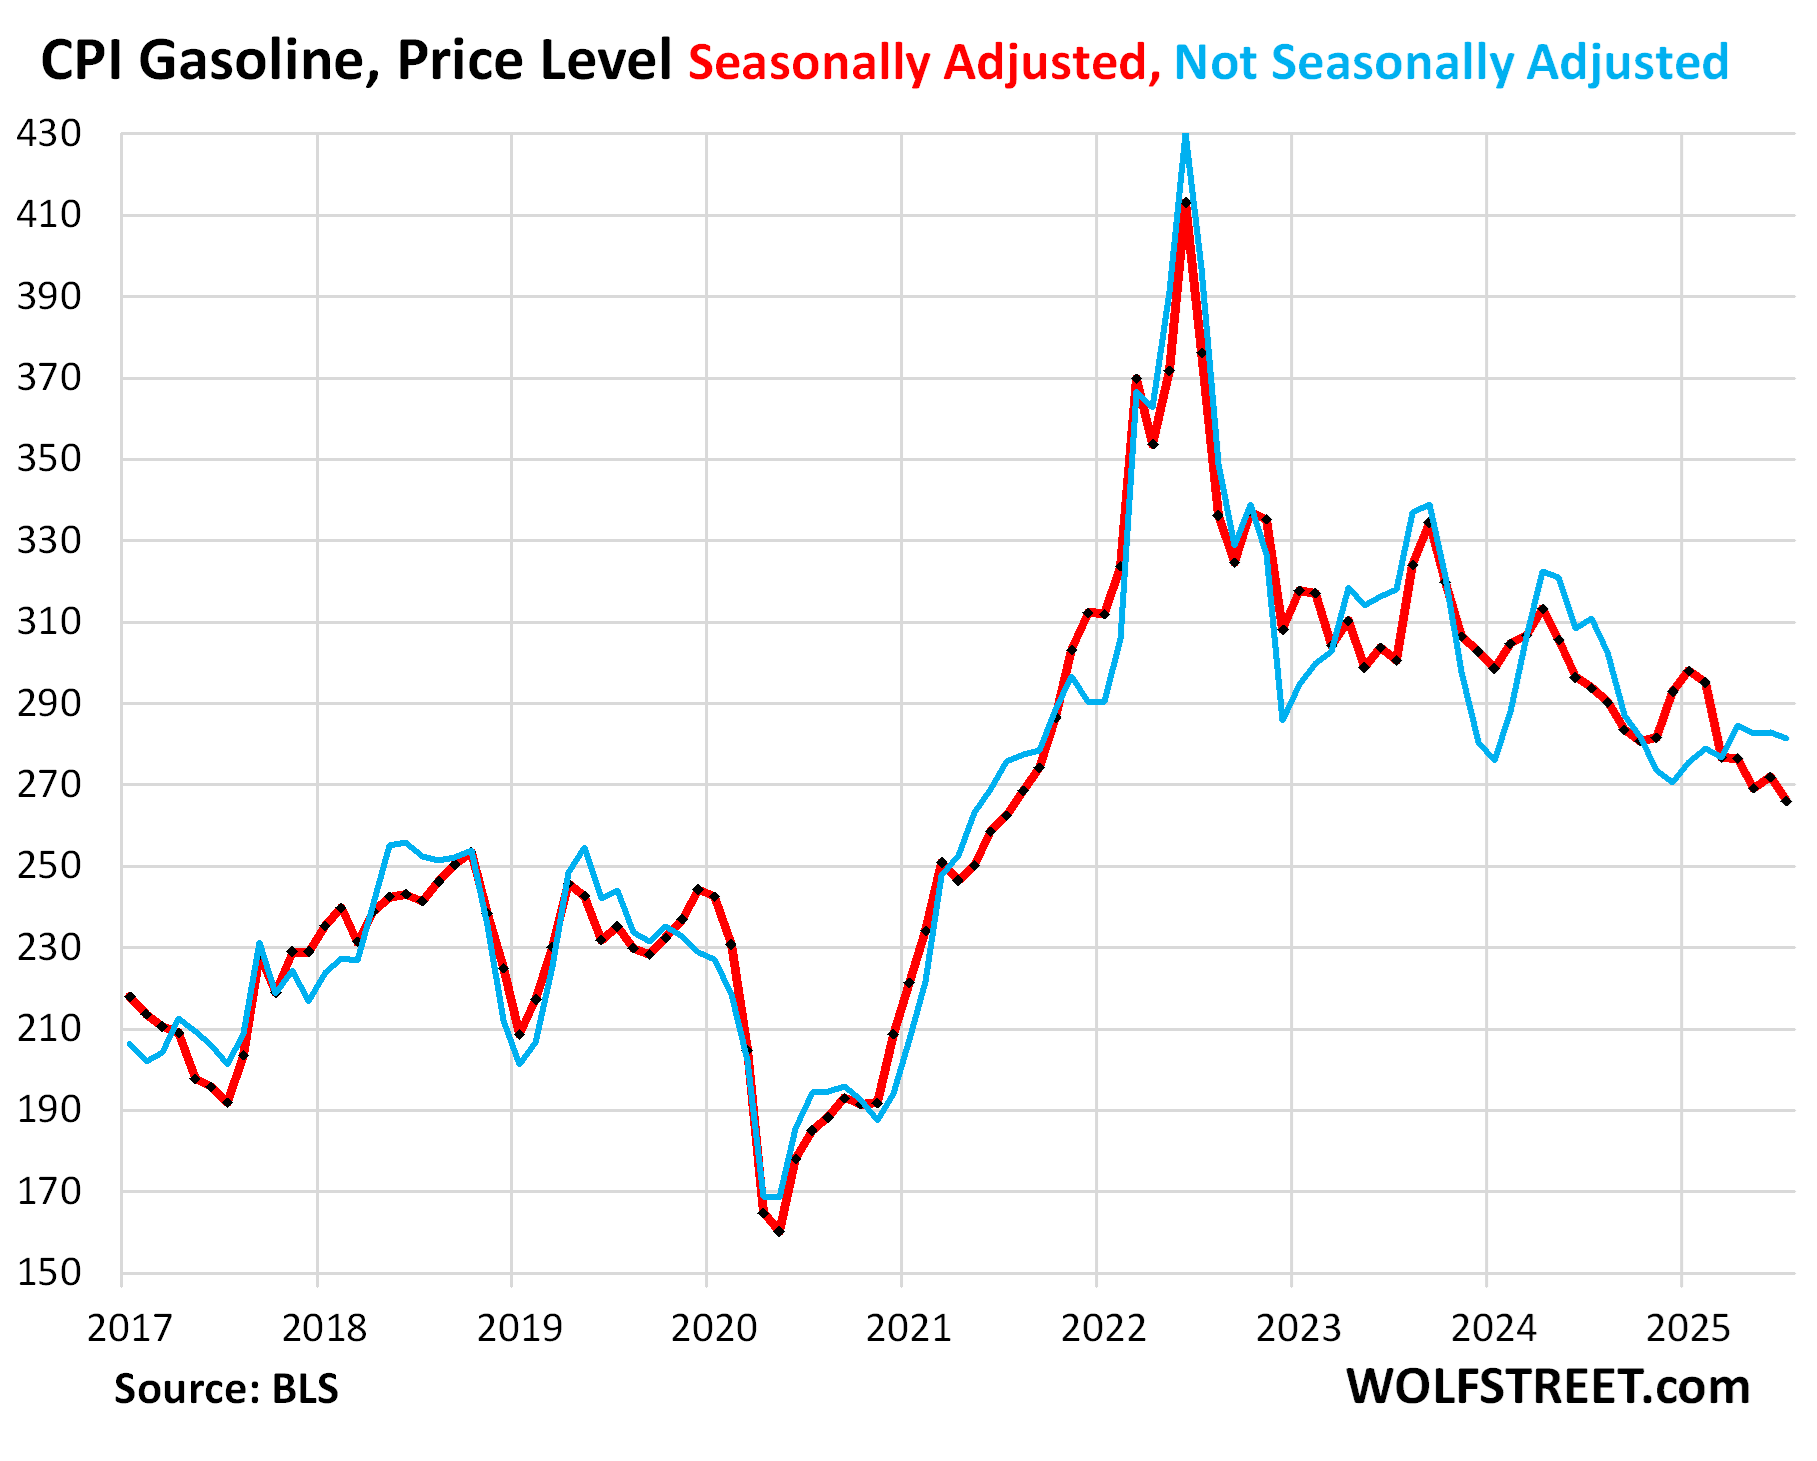
The CPI for gasoline fell by 2.2% in July from June, seasonally adjusted, to the lowest level since mid-2021.
Year-over-year, the gasoline index fell by 9.5%. Lower oil prices are the driver. Gasoline makes up about half of the overall energy CPI.
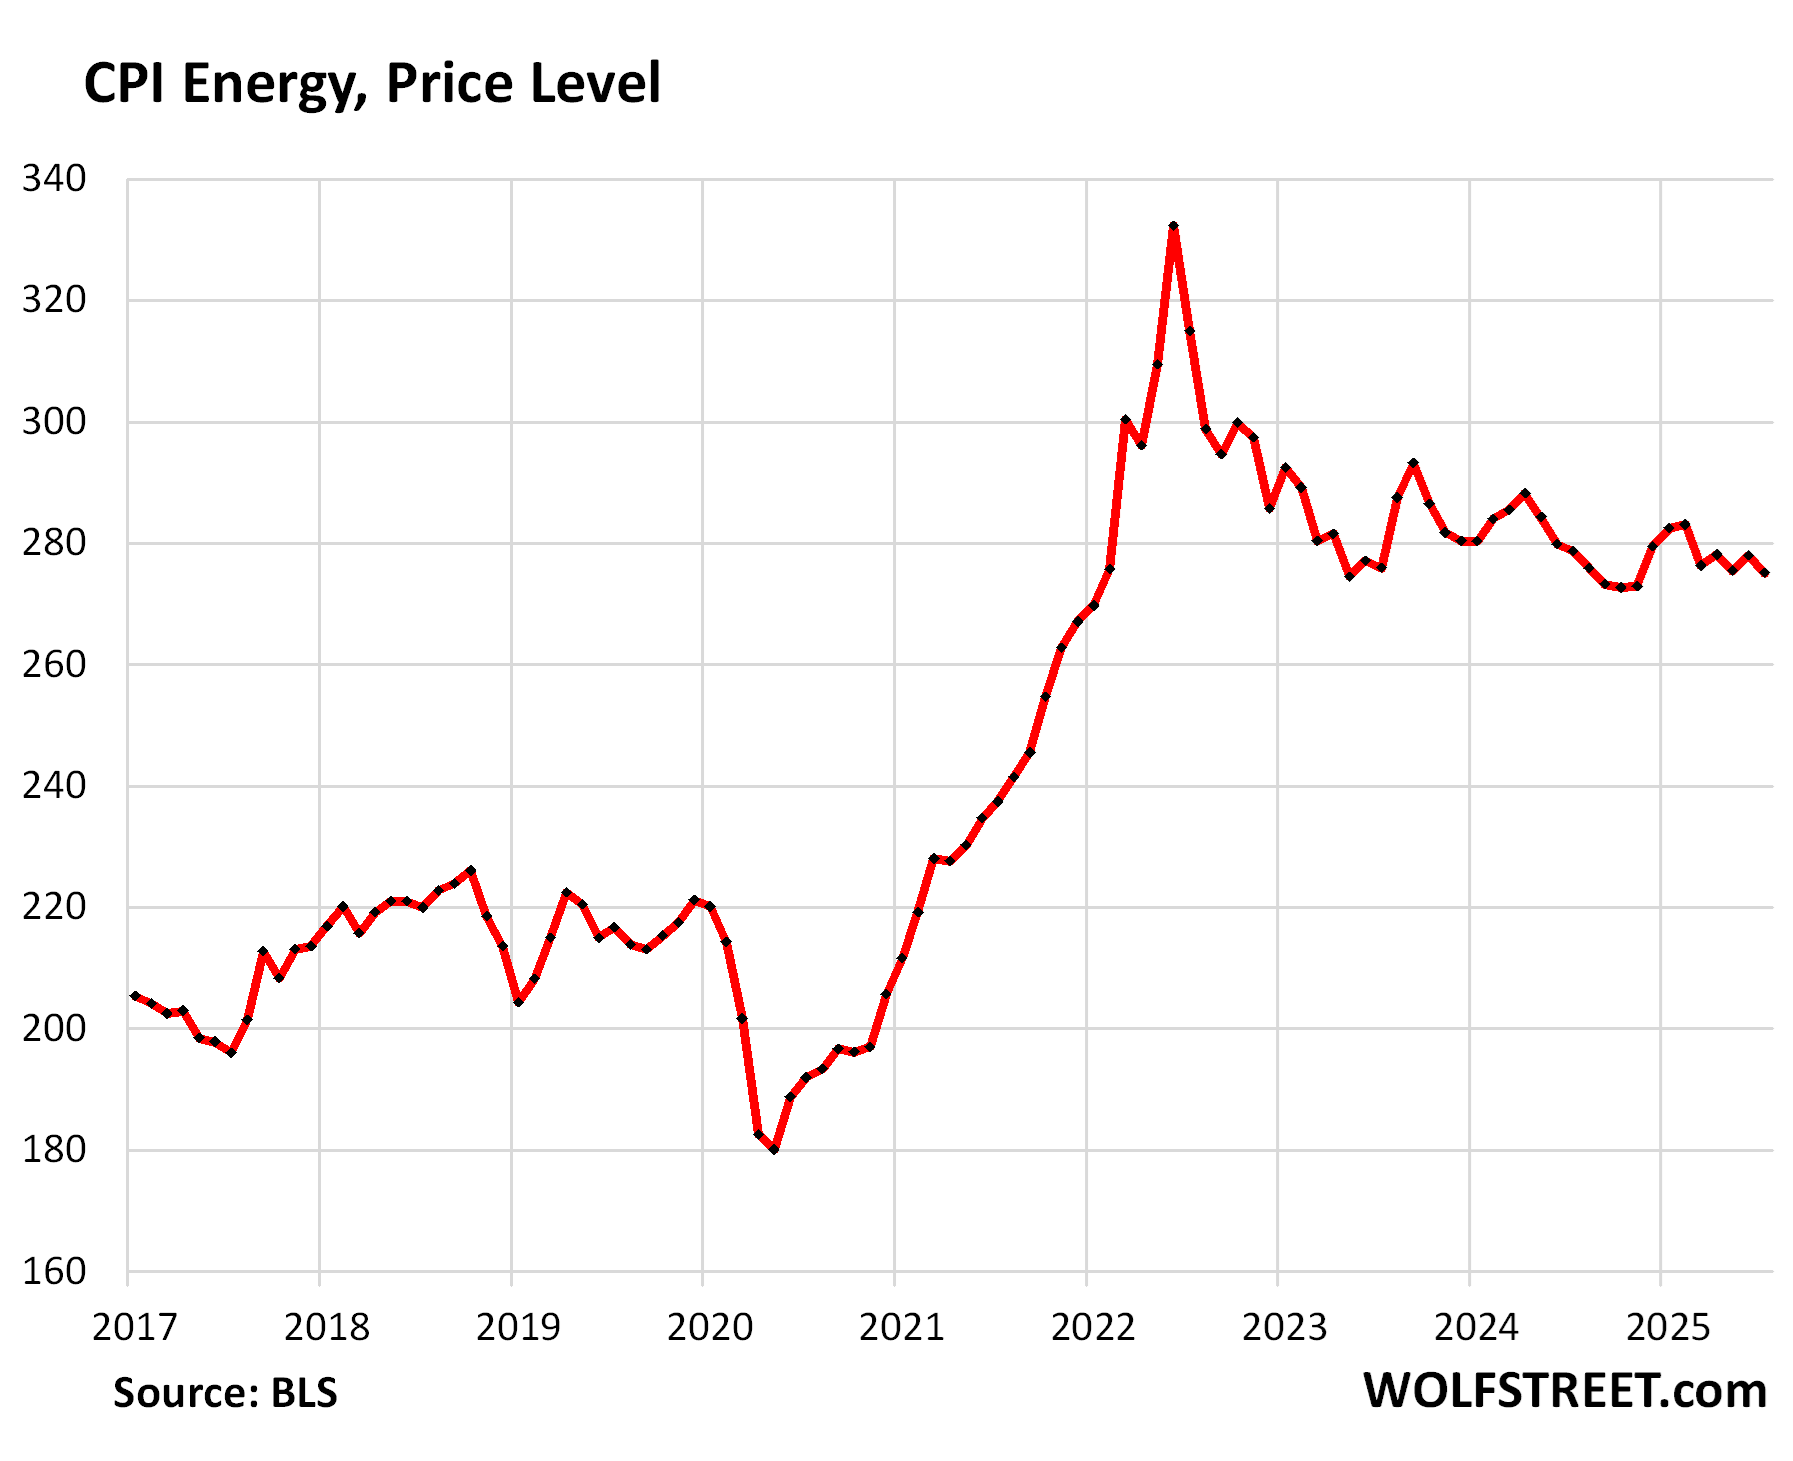
The CPI for energy overall fell by 1.1% month-to-month and by 1.6% year-over-year.
Despite the ups and downs, the index has essentially been flat for two years, but at much higher levels than before the pandemic.
| CPI for Energy, by Category | MoM | YoY |
| Overall Energy CPI | -1.1% | -1.6% |
| Gasoline | -2.2% | -9.5% |
| Electricity service | -0.1% | 5.5% |
| Utility natural gas to home | -0.9% | 13.8% |
| Heating oil, propane, kerosene, firewood | 1.0% | -2.1% |
Enjoy reading WOLF STREET and want to support it? You can donate. I appreciate it immensely. Click on the mug to find out how:

![]()
Great job Herr Wolf …as usual!
Long term bonds responding as expected.
Fascinating to watch the longer term yields today- Wall Street cheering more free money coming soon; and long term yields saying “You just wait!”.
Wolf,
There is so much info packed into this one post, it really would be worthwhile to break it out into 2 or more posts.
Frequently there a just a handful of “monthly monsters” that account for a lot of the monthly/annual inflation – but that valuable info tends to get lost in mega-posts.
Standalone posts focusing on/analyzing the monthly/annual monsters would be very, very helpful.
(The monster post-pandemic has mostly – though not always – been housing. This is particularly the case when a multi-year view is taken – another idea for standalone posts…and since inflation victims remain multi-year pissed, I think a longer term inflation view/analysis is legitimate and would be of great interest)
Who is it that keeps harping on the danger of services inflation? And continues to be correct?
Our beloved Mr Wolf.
What danger/nightmare…CNBC headlines “S&P 500, Nasdaq both notch record close as inflation report gives Fed green light to cut rates”…thanks CNBC for all your help…not.
Powell has held out as long as he could. I think there will be sufficient pressure brought to bear on Powell and the voting members to extract a 50-basis point cut in the September meeting.
They will of-course mention the recent jobs report as a reason for doing this and call it as a pre-emptive strike against a possible downturn.
They will also say future cuts will be data-driven hiding the fact that the September cut was not data-driven.
Correct me if I’m wrong but doesn’t the start of rate cuts historically signals the start of a recession? What is Wall Street so eager about
Why is inflation in services spiking ? Any thoughts ? Pricing power since consumer goods can always be sourced from low cost destinations (with tariffs maybe inflation will show here too but there are alternatives) ?
The cost of doing business, especially the insurance and legal/compliance costs are skyrocketing. That is percolating through everything. At least from personal experience.
I’m a small business owner and expenses on everything are forcing my hand- not just business expenses but my household expenses since I pay myself out of the business. Electricity is way up since last year. Rent is up. Equipment and supplies are up. At home, insurance is bonkers. Food is bonkers. Cars are bonkers. The pressure to raise prices is real, but I stall as long as possible because I hate doing it.
Realizing this can be considered antidotal, I am in the same boat. I keep very good books and had to raise prices recently. It was untenable to not due to services inflation. Across the board in a little over a year and a half, money flow is paying a third less of my debits.
My Wolf Street media mogul empire pays for a lot of services. Every single one of them has risen substantially. Until about and through 2020, there were very few and only small increases. Then in 2021, the dike broke, and now every service hikes prices at least once a year. If the increase is 5%, I’m lucky. I got a bunch of double-digit increases. I have services that downgraded their offering, and to maintain what I had I have to buy this new extra fancy package that comes with other stuff I don’t need. I kicked out one service provider because I could, but the others I cannot really shop around because that’s too difficult and time-consuming (such as moving the server to a different data center). So I eat the price increases. This is why services inflation is so hard to contain – and it hasn’t been contained.
Utility natgas to the home nearly +14% yoy, yet Henry Hub can’t even get above $3/mmBTU.
The underlying commodity is deflationary, but the SERVICE to provide it to your home keeps getting more expensive.
Thanks to the Utility Commissioners who give their permission to boost rates because utilities are experiencing the impacts of inflation (wages and their costs for materials), the main product they buy however is seemingly the issue…
Passing on the costs of data center buildout to ratepayers.
Electricity is going to see big demand. A still mill takes 100 megawatts. The biggest oil refineries in the United States are 500-megawatt level. You don’t build dozens of those but We’re building dozens of data centers right now of gigawatt-scale—gigawatt scale, never mind 500-megawatt scale—data centers.
To produce energy for one gigawatt datacenter it would require 45 to 75 square miles of solar panels, and if you did it with windmills it would take 260 to 360 square miles. I mean, we obviously have land but I can’t think of any city that would like to see a 50-mile solar farm outside the city .
That’s why these data centers will be powered by cheap and abundant natural gas.
Where do those estimates of land use come from? I’d like to read up on that.
My solar setup produces approximately 18 W per 1 sqft of real estate. You can get slightly more efficient panels now. Also, depending on latitude and location you can increase the density by stacking at a greater angle.
5280’x5280′ (1 sq mile) = 27,878,400 sq ft.
501,811,200 W per square mi or roughly 2 square miles per Gigawatt.
Storage is still the issue.
If you own the rights to your own dirt, go geothermal. Sink the cost now. Fossil prices will go to zero for sure, after there is no more to burn.
(” You can get it cheaper across the street? When I’m out of salmon, I charge ONE dollar a pound.”)
I always say: “we’ll run out of clean air to breathe before we run out of fossil fuels to burn.”
Easily.
If cockroaches knew how to burn fossil fuel when we make the place uninhabitable for large mammals, there is enough fossil fuel to do in the insects, too…..maybe everything if there is something around to tend the fires.
We have carry around O2 machines, I’m seeing more carry around cooling machines, so carry around air filtration systems will soon be made (if they aren’t already).
It’s called entrepreneurship…….find a need and fill it (or create one).
Careful Wolf you’re sounding like a green pinko Californian with that comment. Your genius stable leader wants to burn, baby, burn.
Utilities are almost always monopolies just about everywhere in the country.
I’ve never been a conspiracy theorist, but it’s pretty clear the “asset class” has full hold of MSM in both parties. All of the sudden 4.2% unemployment that’s pacing our increasing dependency ratio, lower immigration is a catastrophe. And inflation is “on target” despite upward trends in the sticky parts over the past 3 years.
Energy kinda saving the day. One time relief though, as Brent can’t really go lower (rig count is already trending down).
I don’t care to debate if current policy is good/bad, but its is inflationary (either transient or permanent): Lower net immigration, large deficits, a weakening dollar (as a import country).
The bond market is acting as it should at least. There are some adults left that aren’t addicted to quick fixes.
Evan,
You don’t have to be a a “theorist” when it’s as plain as the nose on your face. There have been numerous comments here about the massive increases in insurance. The MSM touts “climate change”. I’ve never heard regulatory capture described as climate change but whatever works, right?
“According to AM Best, property casualty insurers made a record $169 billion in profit in
2024—even as they raised prices and pushed for laws to avoid paying more claims, all
while claiming the industry was in trouble.1
The $169 billion profit amounted to a 90% increase from the previous year and a 333%
increase from 2022.”
This. Insurers just whisper climate change to commissioners and all their hikes are approved.
Biggest scam ever!
We got homes in Rocky Mountains and the Great Lake region. I am seeing the worst droughts I can remember out west and we are very afraid of fires back in the Great Lakes I am getting flooding. Chub and AIG pulled out of my neighborhood out west. 15 years ago our summers were in the mid 70s now we have weeks at a time in 90s in the mountains. Sure seems like something is changing. I am in the process of downsizing properties. I am capitalist to the core! I believe the capitalist insurance companies that are de risking to avoid value at risk. This climate change is real and in our face.
I enjoy watching sports on television. It seems that the biggest spenders for commercials during broadcast sporting events in the USA are the insurance companies.
The English Premier League football starts this Friday. There, bookmakers are the biggest advertisers. Many team’s players have bookie’s logos on their jerseys.
George Orwell wrote in Nineteen Eighty-Four, “Films, football, beer, and above all, gambling filled up the horizon of their minds.”
Same as it ever was.
Online betting company Bet365 was founded in England in 2000 by Denise Coates, the daughter of a bookmaker’s family.
Multi-billion profits have made her one of England’s richest women.
Her family owns their local football club.
The NFL and MLB packages seem ridiculously expensive.
I remember they were a bit high but now it’s robbery.
If that’s your thing, phew. Cha Ching!
Insurance companies are essentially bookmakers.
So basically same as UK.
Lol, I used to tell climate deniers it doesn’t matter whether you believe in the science or not, the insurance company does because they have to write the checks.
Now that they wrote a lot of checks, the deniers are claiming “regulatory capture”. LMAO.
Deniers decided they’d rather believe dipshits and liars over the smartest of us to drive their obsolete SUVs and oversized trucks, got played, and now we all have to pay nosebleed insurance rates. But heaven forbid you ask them to admit that they were wrong and change their minds. That’s communism!
Lol, all those increased premiums are going straight to insurance companies record (doubled) profits in the past couple years. They’re using you and other useful gullibles and laughing all the way to the bank.
How does that explain the insane spike in my auto insurance rates over the past few years? Something doesn’t add up.
@Mellow Ruse, auto insurance rates have gone up because the average value of a car on the road and car repair costs have gone up.
Insurance is a surprisingly straightforward business, it’s basically a hedge fund for disaster volatility with a lot of math and statistics. Volatility goes up, prices go up (home insurance, severe weather/disasters). Average value goes up, prices go up (car/home).
The reason you saw so many insurers fail in FL is because they were using low risk models and got caught lacking. Other insurers saw this and adjusted. This also means that when they have a good year, their profits skyrocket, making them look like crooks.
Raw profit figures also fall in the “lies, damn lies, and statistics” category for click bait headlines. Look at ROIC% over a three or five year period for real information.
With slowing population growth (from lower birth rates and lower immigration levels, both legal & illegal), the labor market no longer needs to add as many jobs to hold the unemployment rate steady. Jerome Powell explained this during July’s press conference.
But Wall St sees a NFP report below +100K jobs and screams “WE NEED RATE CUTS!”
Wall Street wakes up and screams WE NEED RATE CUTS before they even get out of bed.
…got out of bed, or waking after passing out on the money bar?
may we all find a better day.
They write it in cursive into the bowl during the morning pee. Haha
It is really incredible. The entire media apparatus, political left and right, are on board with creating horrible inflation and stealing from savers in order to maintain high asset prices. I’ve never seen anything like it.
Their ability to outright lie (tariffs are showing up in inflation, inflation easing, data supports a September rate cut, etc. etc.) in order to support their position is unmatched.
The last thing the Fed wants is to cut rates and see long-yields go up again. They’ll end up with real egg on their faces if that happens, as I suspect it will.
It’s because both parties are funded by the billionaire and hundred millionaire asset holders, and the crooked politicians are getting rich beyond words themselves.
Why has nobody bothered to ask how “public servants” who entered CONgress with net worths of less than $100k end up multi-millionaires with net worths in the mid to upper 8 digits?
The American people are being taken for a ride, and it’s accelerating.
I hear they’re draining a swamp to build a ballroom.
That IS a DAMNED good one! 4hens…and sadly/sickly true…..that a pun on “foreigns”?
TSonder305 💯💯💯
I think I see what Bessent wants to do.
There is pressure to lower short term rates which the Fed can directly control without QT or QE. The Fed can’t directly control long term rates without QE (ie creating a scarcity by buying LT bonds similar to what they did with MBS’s). That scarcity drove down mortgage rates (and LT treasuries.
The longer term rates are the problem. Per Wolf, the Treasury is offering fewer long term treasury bonds for sale which is effectively driving up demand (higher bond prices, lower yields) using scarcity.
The Treasury won’t offer many long term bonds so the people and bond vigilantes just won’t buy when the rates are too low.
The bond vigilantes become powerless due to the Treasury not caring since unlike in the 80’s, the government is being funded with TBills. The Treasury has the power to drive down long term bond rates by just not offering them.
The US becomes like a typical corporation which cares about quarterly results(1,2, 3 month) more than long term 5,10,30 year results.
Does this make sense? I don’t understand enough to determine any repercussions.
Like they say, “I’m not saying it’s true, I’m just ASKING if it may be”
Kinda like “Do you still beat your wife?….just asking”
Anyone else think Wolf may get a shortage of his upper 50% data to play with in his articles soon?….just asking.
Brent is European crude. What you want to look at is WTI, which is currently at approximate parity (5.6x) with Henry Hub natgas on an energy-equivalent basis.
When the price of oil is significantly higher than 5.6x the price of natural gas, then the market is signaling a potential shortage.
What are you talking about?
WTI is trading at $62/bbl.
Henry Hub is currently at $2.8/MBTU.
Using your 5.6x ratio, 2.8×5.6 = $15.68. That’s not approximate parity with 62/bbl. Instead, natural gas is ~1/4th the price of oil on an energy basis.
Thank You Wolfmeister.
Prost ! 🍻
It was not a great CPI report. Every category went up except for energy, whose 1.1% drop offset all the other categories, yet headline CPI still increased by 0.2%.
TTM Core PCE will likely be around 2.9-3.0%, almost a full percentage point above target, and drifting above the sticky ~2.7% level it’s settled at since May 2024.
Yet the cheerleading financial media spun it as “not as bad as feared,” sending the NASDAQ up another 1% today.
I don’t know how any reasonable central banker who isn’t beholden to politics and/or Wall St can say with a straight face it’s time for more rate cuts.
Greenspan and Shiller are having a press conference at 6:30 am Tomorrow. Watch for the briefcase
Reuters headline, “Stocks rally, oil prices drop after modest US inflation data solidifies Fed rate cut expectations”. Interesting
Just need the “free money from tariffs” to start flowing now and everything will be back to normal
/s
I blow off most of the Trump-said stuff in the headlines. And I’m not taking the tariff rebates stuff seriously either. But if they do come to pass, and free money arrives once again in households across the US, all bets are off in terms of price spikes. Free money is toxic. It turns brains to mush. We went through that in 2020 and 2021.
Lest we ever forget that this massive inflation was STARTED by this admin back in 2020. This guy is a massive money-printer.
Well technically it was to fix the frozen markets.
It’s documented in the book trillionaire dollar triage
Handouts are a classic economist tactic going back to antiquity. It’s on page 23 section b of the playbook.
sufferin – I have requested it repeatedly at the library, but the first time I was told it was in the ‘restricted stacks’, and the second that it had been removed from the collection because, if read, it might show the nation in an ‘unfavorable’ light…
may we all find a better day.
You may find an alternative view watching thecon dot TV
The moment the inflation stops the music stops….
To kill inflation they’d need to allow unemployment to go up modestly and the economy to slow, but everyone wants to pass that problem to the next guy.
More like 2021…
Dustoff, they moved it to the locked old ammo bunkers with all the other threats to National Security, like old nerve gasses, anthrax, smallpox, the more radioactive nuclear waste, some unstable old nuke warheads, the Tom Paine books, etc, etc and lately maybe a few brown or black people and some civil servants with a “failure to communicate”.
The “tariff rebates” will go to the mega rich families in the form of lower income taxes; with inflationary budget deficits remaining the same or increasing. The rich will then buy up all assets at current prices.
We are still going through it, and it’s denouement is close at hand. What’s coming can’t be stopped.
Its not a conspiracy when its broadcasted in headlines on CNBC
S&P 500 hits new record as CPI report gives Fed green light to cut rates: Live updates
And even better.
Trump threatens Fed chair Powell with ‘major lawsuit,’ demands interest rate cut
Yes, that CNBC headline is another example of the unbelievably delusional ZIRP zeitgeist that continues among various agenda-driven factions and some parts of the media. This group of regular readers here is very thankful for Wolf’s ongoing coverage of this topic, accurately sourcing and aggregating the relevant data, then packaging it in a logical, unbiased presentation. Meanwhile, where is our new generation of bond vigilantes?
And this just in from Reuters: “Investors double down on September Fed cut after CPI.” Really???
That’s to juice the ingrained FOMO reflex that gamblers(I meant investors!) have been conditioned with over the last 30 years.
They’re just around the corner…
Waiting.
Didn’t you read the WS piece about the 30 year and the 10 yr bond issuance being replaced by T Bills. The vigilantes are souring on the long bonds.
Wait a minute. That piece also said that the Fed would be shedding its longer-term notes and bonds, and its MBS, and replace them with T-bills. The market (the bond vigilantes) will have to absorb $3-4 trillion of those. So they’re trying to get some balance. Everyone wants the Fed to reduce its balance sheet because reserves end up being so expensive for the deficit/taxpayer that would normally get the Fed’s profits, and now there are losses.
Actually when rates drop the long bonds should gain value.
When rates rise they get destroyed. So bond holders from before 2022 will just be making up ground.
Think of someone holding a 50 basis pt bond from the Bernanke years 🤣
they have a bucket for their tears beside their bed
lol threaten the lawyer with a lawsuit.
That’s like threatening a fish you’ll throw it in water.
Please list Trump’s policy changes toward North Korea. None. The sanctions he’s lifted on Russia? None. Compare the number of military actions he’s ordered versus Biden. Has he talked about freer trade, closer ties with China? No. My opinion of him isn’t high, and he certainly blows hot and cold, but it takes serious spin to paint his policies as favorable to the nations you list.
* military actions toward Iran
It makes you wonder which president put an entire race of people in concentration camps by Executive Order…
Could you maybe phrase that comment differently? I, and possibly others (although I know I’m not the brightest bulb here) have some difficulty understanding it. But I do come here to learn.
Much thanks.
So some people decide to go to target to get their kids some school supplies and get wasted in the parking lot…an aggrieved vax patient wants revenge on the CDC, CEO wasted in broad daylight, cutting basic food security for veterans via snap programs, deficits out the eyeballs and debt ridden empire….government is the great teacher to the plebes…empires last about 250 years…the USA got lucky it had 2 oceans protecting it and largest economy by 1900….
“the USA got lucky it had 2 oceans protecting it……”
That’s probably what the Indians thought.
Economics is an exact science. It’s just that the Ph.Ds. graduated with a minor in mathematics / statistics, instead of a minor in accounting.
The distributed lag effect of money flows are more or less mathematical constants. Friedman and Schwartz proved this. September should be the peak in the price level, reported in October, a market inflection point.
Economics has nothing to do with science let alone exact science and was best described by George H. W. Bush as “VooDoo Economics” where witch doctors were more accurate and reliable.
I was an Econ major (easiest A’s). You could still focus on “political economy” in those days.
I used to tease my quant- prof’s: “If your model can ever predict my behavior I’ll randomize it just to #$%@ with your head….
Economics isn’t about predictions, but about understanding how economies function (production, distribution, and consumption of goods and services); how their participants (companies, workers, households, governments, etc.) behave; etc. etc. Then how to analyze economies in detail to come up with data that describe that economy (from GDP and unemployment rates on down).
TRYING to understand…TRYING to analyze……..
The map is not the territory….the model is not the actual thing…..
It’s just a best EFFORT……a Practice……like the practice of medicine….
You are just a “writing head”….talking heads get paid more, especially if they look sexy……..
Pretty bleached blonde with law degree (stage presence) is big bucks.
Money supply is rising again and inflation of prices is a monetary event at its root cause. All other things being equal (fiscal policy etc) then more price increases are surely ahead of us. Above the pantomime “2% target”.
You contradict yourself saying “exact science” and “more or less”. Economics is a science with some basic rules but it’s about people and people are squishy so economics is squishy.
There are also hundreds of variables and huge lag which greatly compicates any attempts at control.
I think the Atlanta and Cleveland FEDs are doing a good job forecasting.
Then why aren’t Friedman and Schwartz’s constants in the International SI units? (the 2019 ones, not the older set)…..they may be there, I’m not sure, as I never studied Econ.
Wow, there must be a lot of grumpy folks with 15% inflation in coffee… I have a strong addiction to Peet’s beans, which I can only get every few months on account of being outside the country. I’m sure it’s going through the roof now, so will need to find an adequate substitute soon.
I couldn’t down Peet’s if it was free.
That’s not coffee that torture!
😆
8 O’clock whole bean original – the best
Been stocking up
Safeway Signature Select- $8.99 for 12 oz……makes up to 180 cups…..I’m savoring some of it’s fine caffeine effect right now.
One of our two National Drugs….other being etOH….BOOZE!
An upper and a downer.
Another thing I like is we celebrate our country’s birth with guns, explosives, and alcohol….same for a New Year here.
Too bad the stars on the flag will get replaced with corporate logos…..we will keep all the other stuff if possible, though……
Alcohol consumption is plunging in the US, Wine County is suffering. Wineries are shutting down, craft brewers are going through a big shakeout. It’s tough out there in alcohol land.
…an industry that seems to have always had an invulnerability to fashion, zeitgeist, or buyer’s strikes, even weathering the U.S.’s legislative Prohibition experiment and later agreement by its distilled spirits segment to eschew that newfangled electronic-broadcast advertising for several decades (until those uppity kids in the wine, beer, and spiked-soda interests gulped too-many shares of a ‘suddenly’-declining market). Given humanity’s centuries of undeniable affection for the production of myriad forms of potable ethanol, who woulda EVER thought?
may we all find a better day.
may we all find a better day.
I got around coffee inflation by sleeping with the coffee farmer’s daughter.
Wolf….what likely impact would FR increases in interest rates have on service sectors inflation? Granted, a lotta assumptions built into any answer.
Services inflation is VERY hard to contain once it takes off, which is why the Fed fears it.
Got it.
I’ll take that to mean very hard to contain once in motion with the tools at the disposal of the FR. Kinda where I was headed (if that is the gist) – stuff like mass cattle deaths, building collapses (i.e., new state laws on the cost side), hurricanes, supply chain perturbations, etc.
The very worst kind of inflation abhorrent to the Federal Reserve is wage inflation which is what happened in the 1970s and nearly impossible to stop once it is ignited.
Huh? Just shut down the factory and go belly up or move to the lowest bidders already starving.
Dick Fuld is a very rich man. LEH lost $800 billion. He did not rich earning inflated wages.
Financial innovation has plateaued.
Respectfully disagree Spencer.
There is no limit to how many derivatives one can take……and there are plenty of other financial instruments that can be invented….anywhere there is something to bet on.
You have little imagination which is probably why you don’t currently run an investment bank.
Thanks Wolf. Awesome. “The shocker” phase had me chuckling. As, the Fed, politicians, etc, are intentionality & failingly focused on MOM % rate; so they can then apply the wrong policies. Meanwhile, in the real world, consumers, corporations, institutions, charities, focus on “their cost-price vs income, today”. Cost on food, energy, and services are up by ~30%. So the real world will raise wages or prices, if they can, or be forced to make other adjustments. Income inequality graph indicates the income-class reactions and strategies: such as: who is raising wages/prices vs those making adjustments; and also the ‘who and why’ that demands/loves more and more government deficit and debt; or the central bank initiatives. And as taxes are mostly excluded from inflation, its noteworthy that this too is a “price inflation”; and long term, if ~25% of taxpayers pay ~70%/90% of the taxes, we know which groups are headed for de-incoming; fleecing; as they are not covering the combo of inflation plus taxes plus risk rate returns.
IMO: The high level of: greed, incompetence, gas lighting, fiduciary fail, corruption, are extrordinary. What were missing is adults in the room, or legislated political accountability. Salvageable? Too late? IDK
How well is this data understood by the FED? Markets pricing in a 90%+ chance of a rate cut that seems to have no business taking place.
Trump obviously doesn’t understand how the FED works, begging for an interest rate cut so people can “buy homes”, without realizing they don’t control long-term rates, and cutting will likely increase mortgage rates since inflation is hot.
This report was terrible, but the market responds positively. How long can we drink the kool-aid?
What makes you think he doesn’t understand that a fed rate cut would drive long term rates up?
Trump loves having a villain, and right now he’s got that.
I don’t think he cares – in the short run.
Higher long-run interest rates (they’re actually mid-level when looked at from historical highs/lows) are a product of Fed interest rate increases 2022 & 2023 (the largest percentage increases since 1981) instituted to combat what was originally thought to be temporary inflation. The Fed initiated FFR cuts starting Sep 2024 – 50 basis points and 25 basis points each in Nov and Dec ’24. No cuts since then.
Wolf has pointed out that mortgage rates are driven by multiple variables including Fed FFR, bond market dynamics, inflation/expectations (to include growth instigated wage inflation). I add this only because the discussion seems to zoom in on the housing market all the time.
My sense is that Trump’s immediate concern is reducing the cost of Federal debt servicing payments. In his mind, this buys time for increased GDP growth rates (hence higher tax returns if one believes in the Laffer Curve). Secondly, it is his mindset that a lower cost of capital is critical to all these huge “deals” he’s been lining up with various countries and companies since coming into office.
Wolf noted that there needed to be coordination between the FR (monetary policy) and Treasury (fiscal policy) as a shift from long-term to lower interest short term debt is effected for servicing some of the debt. He also noted the high risks in this strategy.
The FR has been reducing its balance sheet for a while now – to meet its 2% inflation mandate/target. Undoing some of the damage it caused through QEs, ZIRP/NIRP, etc.
Gov’t fiscal policy (spending) has been out of control for decades. The gov’t is entrenched in a huge political struggle over spending. Anyone who has seen those battles from the inside (I saw it from a DoD angle) knows that it is cut-throat among competing interests at the Congressional, lobbyist/corporate, foreign influence, etc., levels. Drunken sailors on permanent shore leave. Another arm of the Trump strategy includes DOGE cuts, rescissions, restoration of traditional Congressional budgeting processes (i.e., ending baseline budgeting).
Will the Trump strategy work? I dunno. Adding to national debt to reduce it? Controlling Congressional excess? I doubt it. Congress is a steaming mess. Too many folks grifting off the entire colossus.
I love how you question the fed.
They invented most of the things. And England showed us the rest.
“This report was terrible, but the market responds positively. How long can we drink the kool-aid?”
Until finances start to bury people. I’ve lost nearly 50% of my annual income in the past few months. I’ve fully checked out on spending anything other than on the cheapest food and gas money. Glad I didn’t buy a house with my covid inflated wages. I’m making less hourly than I was at the end of 2020. Went through and sold off every material possession in the last year. Saw the writing on the wall and believed it. Know a few more people in the trucking world losing their shirts. 3 of them are weeks away from declaring bankruptcy. Trucking has often been the canary in the coal mine. And it’s a bloodbath right now.
I can’t believe I’m working for a place that cheats me out of several hundred dollars each paycheck and barely breaking 23 dollars an hour with no OT for 65-75 hours a week running hazmat. But I can’t get anything else. Seriously considering going to the oilfields and being homeless again living out of the truck.
Said I’d never work for a place that shorted your paycheck. Said I’d never work non-hourly again. Said I’d never go back to sleeping in a truck. Never say never I guess.
Once the job markt goes to crap all this sugar high free money nonsense will come to an end. Glad I got some money back quickly for all my junk before the boat started sinking. I’d hate to be selling used cars, toys, and motorcycles in a severe recession.
Best of luck to you and the country Trucker.
As for folks not paying you what was agreed upon/owed,well would leave em but first cost em a bundle with some sort of monkey wrench on way out the door
I can’t tell if the markets “pricing it in” is to encourage retail investors aka bagholders to jump in so the big boys can unload their overpriced NVDA and TSLA stonks or if it’s to try to force the Fed’s hand.
The problem is, the Fed knows that premature rate cuts can lead to the 10 year going up, which they don’t want. That’ll require more short term issuance games by the Treasury, which ultimately is a risky endeavor.
So they’re going to have to decide whether they want to displease Wall Street or tarnish their legacies.
Hey Wolf, WHAT IF you were suddenly nominated to take over the BLS and report cost of living changes every month? How would you change things? (If you actually decide to answer this question, do a blog post instead please!)
Personally I think CPI is inadequate/broken but I have no idea how to fix it.
Thank God I don’t have that job.
Don’t buy the political attempts to discredit the statistics. It’s pure Lysenkoism, designed to make the politician the only person you feel you can trust and use the power of the state to punish dissenters.
And that’s a very dangerous place for an electorate to be.
I call this the Avocado economy. Tariff or no tariff, there are no more Mexican Avocados in my store. There have been California avocados, which are more expensive to grow, and consumers won’t pay $3 for a $1 avocado. If the store tries to raise prices that much they end up with guacamole. The last time I went to the store, no Ca Avo, no Mex Avo, the Avo’s are from Peru. Can’t imagine the shipping costs, but it seems as though the main market suppliers of Avos are either shutting down, or this is pass through selling, or they are putting Peru stickers on Ca and Mex avocados. Probably no bureaucratic oversight this is an administration of smoke and mirrors, bribery and corruption. If they can’t control the flow of pass thru avocados the price of illegal merchandise will undercut legitimate markets. Perhaps a bit more complicated for car makers but they can smuggle in components as well. They need to control inventory, so you want a car you order it and wait. Then cross your fingers that the computer board assembled in some off market sweat shop doesn’t malfunction.
Purchased at Costco: 1 bag of 6 big Haas avocados $9.99 at the SF store two weeks ago, not sure where they’re from. They had lots of them. They also had organic Haas avocados, which I didn’t buy.
I now see them online Costco Instacart for $9.07.
Went through my receipts:
Paid $11.99 on May 17, 2025, so the price plunged since May.
Paid $9.99 on Nov 9, 2024. So now prices are back to November.
Paid $8.99 on Sep 7, 2024.
Paid $7.99 on Apr 13, 2024.
Paid $6.99 before then. I was already shocked by the price increase each time. That’s when prices spiked.
Did some checking with the California Avocado Commission. Their price tables show producer prices peaked in March 2025 at $1.87 per pound. By May, they were down to $1.49 per pound, latest data available. In 2024, the price peak was August at $1.67 per pound. In 2023 and through January 2024, they were in range of $0.80 to $0.95 per pound. So wholesale prices spiked by 100% between 2023 and 2024, and retail prices followed, and you didn’t complain, and now that tariffs are putting downward pressure on avocado prices again 🤣, you blame the tariffs???
Your Avocado-economy theory is ridiculous BS. Did the tariffs give you brain fog? They’re getting blamed for everything these days.
I prefer the Haas Avocados I get from the tree at the side of my house near the kitchen and can pick the size I want anytime I want and the price never changes – it is FREE each and every time regardless as to how many I want that day. They are great with French dressing.
I’d love that! Enjoy!
We used to have a 15 acre avocado ranch in Fallbrook, CA with 15 acres of avocado trees, but the problem was that Calavo which controlled all distribution of avocados in SoCal only paid 2 cents per pound for them which wasn’t enough to pay the water bill.
There was another commenter here who had an avocado farm in Southern California. They produced avocado oil and artisanal avocado-oil-based soaps, if I remember right. They had several hundred trees. But had trouble getting enough water for them, and started cutting them down. They sold the farm (ca. 2015) and moved to the Far North somewhere, maybe some town in Washington. It all boils down to water, in California.
“I can pick the size I want anytime I want and the price never changes – it is FREE”
Yeah, here in Northern Minnesota we have the same thing, I can pick the size icicle’s I want anytime I want and the price never changes – they’re FREE
There are ever bearing varieties, most of them aren’t. Avo’s don’t can well, freeze or dehydrate. Mex has a different growing season, and Peru. There is a labor issue on Ca avo’s. Avo’s are hard to pick. ICE has scared workers away. Water rates are higher, but not that much. I believe that growers have not been replacing old trees. 1.49 a pound wholesale? that probably retails out at $3, which is where prices should be, if not for local and imported sources. used to see side of the road vendors, not so much, but wait for it (hot avo’s, or stolen fruit). the avo economy is very fluid. NY prices $1 to $2.5, thats not bad. the restaurant chains might have a problem here, they are less flexible. the economy here has changed tariffs or no tariffs
Ouch. That could lead to another disappearance.
I love that you have receipts for your groceries going back over a year.
Yeah, that is kinda weird, but then so is swimming in the Bay without a wetsuit….and in any case, you still aren’t as far out of the box as me…hell, I’m not even sure where it is anymore.
We started doing this in 2021 when prices began to spike. I throw them out after a while, but I do keep them for at least a year.
I absolutely hate hate hate inflation. Inflation = companies jack up prices or reduce package size to fatten up their profit margins to obscene levels, as we have seen. We fight it where we can, including by shifting lots of grocery purchases to online, and to bulk where we can.
FYI, I bought avocados in-store at Costco in Colorado Springs this week for 6.99 for 6. They were labeled large Peruvian but were slightly smaller than the previous avocados I purchased last month for 9.99.
Everyone throws away (as far as I know, I never eat them) the avocado “nut”….which is the embryo and where the best nutrition usually is, like other nuts.
Wonder how hard it is to grind them up and eat the powder….and if its good for you like other nuts?
Somebody must have already done it……avocado flour or something?
Google it, lol
Time for me to head to Costco again, LOL. I’m so ready for $6.99 avos again. I’ll report back what I found, either this weekend or next weekend.
So I did. Not much there at Google at all.
But some work is being done on eating them, though…but mostly looking for possible drugs (as that is the key to getting most ALL research grants in capitalist land).
Have a hunch they are currently too expensive to process….for any use, per Mr Market. But maybe with some clever advertising…?
EX; https://pubmed.ncbi.nlm.nih.gov/37293187/
Google AI says this right at the top — that’s why I asked you to Google it, because Google’s infallible AI is kind of funny:
“While some potential benefits of avocado seeds have been suggested by animal and test-tube studies, there’s a lack of human-based research to confirm safety or effectiveness. The California Avocado Commission advises against eating avocado seeds due to the presence of potentially harmful compounds like tannins and cyanide-releasing substances. While small amounts might not cause problems, it’s generally recommended to stick to the nutrient-rich flesh of the avocado“
Google’s AI (or any AI is only as good as it’s programming……obviously nobody found the NIH stuff I did ( at least 1 or 200 research efforts and papers done) and put it in….”AI” sure didn’t, so maybe it’s not as “I” as they say?
The now ancient and almost forgotten “GIGO” (computer saying) has been forgotten in all the AI advertising hype and excitement, I think.
I thought inflation was cured and we would get a home price crash…LOL!…wait for it….next year?
Govt should sharply lower interest rates and borrow in 3 month maturity bill .Forget inflation and yield curve and enjoy.
This is the new thinking
Whatever interest rate the Federal Reserve sets for overnight borrowing has nothing to do with the interest rate on 3-month US Treasures which have a yield (interest rate) set by the bond markets.
Might be a good time to start a vehicle mechanic shop.
Wolf, if we cut your CPI chart from Jan25 and attached to Dec2019, nothing would look alarming. And yet Fed funds rate was only 2-2.5% back then (going from memory). There’s an argument for cutting, no?
No.
You’re looking at this in a vacuum without accounting for the massive increase in Federal debt, plus the massive increase of the Federal Reserve’s balance sheet. Add in current QT and MBS rolloff for good measure.
The game you’re referring to ended over half a decade ago.
There is a massive DECLINE in the Federal Reserve’s balance sheet and that has been ongoing due to QT over the past several years.
Yup just ignore the massive price increases for 3 years and then accept that the old 2-3% range of inflation is more like 3-4% now which is only a 30-50% increase over the previous trend…. Did I mention that’s after 3 years of massive price hikes.
Cuts are coming but it’s growth worries not inflation confidence that’ll be the motivator for the Fed
Yes. It’s like a guy who plans to gain no more than 1 pound a month, gains 30 in one month after gorging on Christmas-time pies, and then says “Well, I can’t lose weigh (deflation) because that would be bad, so I’ll ignore the 30 I gained and try to go back to gaining 1 pound a month.”
*annualized* CPI (to be clear)
I read that the Fed’s inflation mandate is “zero per centum.” Meanwhile, the Fed’s “dual mandate” is price stability and max. employment. I don’t know where that “2% inflation target” came from, but using the rule of 72 (72/2)=36 years to halve the purchasing power of your fiat dollars ($).
Question: What are the consequences – to the Fed – of exceeding their “zero per centum” inflation mandate, and “two per centum” target? We all know what the consequences are at our level as spenders and savers.
From: Fed Balance Sheet QT: -$19 Billion in July, -$2.32 Trillion from Peak, to $6.64 Trillion
by Wolf Richter • Aug 7, 2025
Fed balance sheet total: $6.64T
U.S. Treas. securities: $4.20T – direct debt monetization
MBS: $2.12T – “saving” the housing market and economy thrice since the GFC
A couple more questions: Didn’t the Fed say at one time that they would zero out their balance sheet? I guess they’re working on balance sheet normalization, but it seems unlikely that they’ll ever get to zero. Is it legal for the Fed to purchase MBS?
Couldn’t the Fed (aka U.S. Gosplan) and the FFR be replaced by the U.S. Treas. 2 yr. note yield? They certainly haven’t done the U.S. economy and those not holding assets any favors. Just the opposite, in fact. Central planning always fails.
Finally, an opinion: If the Fed tries to cut the FFR (short-term rates) in a fiscally dominant, inflationary environment – like now – then that would only result in rising long-term rates, such as the U.S. 10 yr., 30 yr. bonds. The Bond Vigilantes, and not the Fed, still control long bond yields. Reference: September, 2024 right before the November Presidential election.
Of course Congress is worser with a $37T national debt while the reckless spending continues. And yet “we the people” keep voting for more of the same. Did I get that right?
“Didn’t the Fed say at one time that they would zero out their balance sheet?”
Never said that. The Fed’s balance sheet was NEVER zero, and will NEVER be zero.
It might go as low as $5.8 trillion, which was my calculation in March 2024. And a couple of weeks ago, Waller, who is running for the Fed chairman job, said exactly the same thing.
Read this, it explains why:
https://wolfstreet.com/2024/03/23/the-feds-liabilities-how-far-can-qt-go-whats-the-lowest-possible-level-of-the-balance-sheet-without-blowing-stuff-up/
Thanks. I really needed all that explained to me again……..must be the TDS….I fear it’s gonna do me in……hopefully it’s just Alzheimers.
Have to practice that crying in my pillow like a man advice.
Where did you read “zero”? I’ve never seen it.
” so as
to promote effectively the goals of maximum employment, stable
prices, and moderate long-term interest rates. ø”
This is mildly OT, but it’s surprising hard to find an answer. How do these tariffs actually work? All the commentary I’m finding suggests:
Example, iphone $599 retail cost without tariff. With tariffs of 145%, it’ll be $1467.55.
Surely that’s not the method applied?
Personally, I would have thought the tariff gets applied to the cost of the import, which will be a fraction (often a small one) of the eventual retail cost. But every commentary source seems to be applying it to the full retail cost. Am I misunderstanding?
Those sources are wrong – whether through ignorance or malice, they’re just wrong. Your last paragraph is correct; appropriately simplified, but directionally correct.
Read some of these for background: https://wolfstreet.com/tag/tariffs/
Yes, most of them are wrong and WR has explained it beautifully in many of his articles.
An object sold for $10 by WMT is purchased for $1 form China. A 10% tarriff is $0.10 on WMT purchase price of $10 from China for example.
Yes, but there’s not nearly that kind of difference between wholesale and retail prices on most all imported goods which makes your example somewhat meaningless.
There is on T-shirts. Cost of manufacture in Bangladesh v retail price in the US. Some retailers will sell the T-shirts for $20, others for $10. If you buy a 10-pack, maybe $6. But the costs of making them in Bangladesh, priced by the thousands, is around $1-2.
After the GFC ’10-’11 the fast gas place was selling T shirts 4/$10….then it went to 3/$10. Guess they were off color and a bit on the cheap side…not like Penny’s t-shirts, which were $5-$6. Larges were hard to find, but I walked a lot then, and over time I bet I bought 20-25….am still using them.
I remember my mom almost crying, saying, “You are 30 years old, you aren’t going to wear only jeans and t-shirts the rest of your life are you?
Answer:Yep
T-Shirts have gone up like everything. Walmart and Costco are the cheapest place to buy plain t-shirts. They have gone up to $5-6 per shirt. They are fairly hefty.
I have been wearing them since my teens and I am now over 60. I only wear t-shirts with pockets so when I’m working around the house/car/bike I have a place for loose screws and bolts that is handy. When I’m walking the dog, I carry a few dog treats. I ignore the critics since t-shirts are so functional.
To appease my biggest critic, my wife, I upgrade to a polo or button down if we go out. No need for loose screws or dog treats then.
The tariff is applied to the WHOLESALE PRICE when a good enters the US and not to the final retail sales price.
Is shipping cost tariffed?
I must be sadistic, but I really do enjoy watching the stock market go up daily and valuations go from absurd to even more absurd. Microsoft at 14 time sales… yes please! Nvidia at 30 time sales….Moar! And just the hope of rate cuts sends markets into an ever hotter orgasmic frenzy. Between this and real estate rolling over, there are going to be some life-changing opportunities in the near future.
People are saying, here and elsewhere, that it’s not a mania or bubble because there are only 3500 stocks (versus 5000 before), that people auto-invest through 401Ks, and whatever else.
I personally don’t agree. The Buffet indicator is at 212%. Schiller PE at nearly 39. PE at nearly 30. Auto-investment is not causing this. It’s the retail mania that no one can lose. It’s confidence that the government will jump in to “fix” whatever problem appears with the economy. If you believe the government will swoop in to fix any problems, then there is no risk.
That’s how people are investing. No one is saying “You know, I don’t want to buy stocks at these valuations.” Instead they’re saying “Stocks will almost definitely be higher in 2 years, so there’s no downside!”
No one is considering a decade or more of flat or declining prices as a possibility, and acting accordingly. I don’t know how or when it ends.
Just like the Big Man changed the name to the Gulf of America, he better officially change the name of this country to ‘The Inflation States of America’, or maybe ‘Inflation Nation of America’.
This crap is getting old.
Why is it called federal reserve if the banks are not required to have reserves? Doesn’t it need a new name now?
But they have $3.3 trillion in reserves.
There are nearly $3.5 trillion in what used to be called EXCESS reserves of the banks in their accounts inside the Federal Reserve on which they earn interest by keeping them there and not lending them out.
The remuneration of interbank demand deposits by the FED is higher than most banks’ NIMs.
How about that 3 month pause on China tariffs? Almost like someone whispered: 50 % tariffs heading into back- to- school next month, then back to cold weather apparel and footwear in two-three months?
It also gives lots of time to front run the tariff on toys for Xmas.
Some will say TACO, but it could also just be learning on the job.
Our current POTUS, similarly or exactly the same as SO many previous understands what it takes to receive the appropriate ”CAMPAIGN CONTRIBUTIONS”…
How else can WE, in this case WE the ”WORKERS” We, understand the billions or now trillions of profits of ”other countries” that have certainly occurred since, and perhaps earlier than the Clintonians made it almost a casual affair, AT OUR expense???
Not sure at all, but seems like only one foreigner, part of the ”bag man” of that era and effort, ever was jailed.
Holy shit Wolf. That was comprehensive. Thank you for the work.
What drops out of your analysis for me is core CPI.
This measure of the true cost of living (which is absent the short term fluctuations of food and energy costs) is increasing and concerning. It reflects better the cost the average American is seeing because changes in it are baked on to a longer time line than month to month.
Makes no sense that the Fed would want to lower interest rates in the setting of a rise in this metric….unless QT is turned up.
Each Trillion off the Fed balance sheet raises interest rates by .25 percent per Powell.
If Reg Q ceilings were reimposed, it would lower long term intererst rates by percentage points.
US deficit grows to $291 billion in July…
Kind over average that out with the surplus in June. Maybe do a three-month average.
It went up 20% so $60B +/-
(Reuters) -The U.S. government’s budget deficit grew nearly 20% in July to $291 billion despite a nearly $21 billion jump in customs duty collections from President Donald Trump’s tariffs, with outlays growing faster than receipts, the Treasury Department said on Tuesday.
The deficit for July was up 19%, or $47 billion, from July 2024. Receipts for the month grew 2%, or $8 billion, to $338 billion, while outlays jumped 10%, or $56 billion, to $630 billion, a record high for the month.
‘The world is not going to trust our data’: Trump’s BLS pick sparks alarm…
People never liked the truth anyways.
Core CPI has always been the important number for inflation. While the MSM-driven equity markets jumped on today’s headline CPI number, the adults in the room drove long-term bonds higher, as higher inflation looms. A near 4% annualized core CPI suggests higher inflation now and in the pipeline.
I used to like to look at the jobs report, until the fiasco of the last one. Now I will look at the revisions and ignore the initial number, hoping the revisions reflect reality, at least a little.
Trump and Bessent continue to push for lower rates from the Fed. But as we know, lowering short-term rates in the face of rising inflation will lead to higher long-term rates, a point often discussed on this website but beyond the mini-brains of the current administration. Trump could would be better off with fewer lapdogs. It is not in his best interests to have an administration full of yes-men.
Whose is responsible for that?
They should just delay the reporting, like they have always done for other data time series.
Some countries, such as Canada, report GDP monthly and also by province, which is a huge mess, and then they report quarterly, which is cleaner because it contains more data and fewer squiggles. Annual GDP figures are the most accurate – but even they are revised for years as more data is collected. You gain accuracy by waiting with the report. But what you lose by waiting is the short-term feedback you want for your decision-making.
So that’s why we use monthly and even weekly data — but we have to understand that they’re just preliminary estimates. But the morons in the media and social media misrepresent these preliminary estimates (such as the “advance estimate,” as the BEA calls it of GDP) as gospel, and then come up with political conspiracy BS when they’re revised.
“But the morons in the media and social media misrepresent these preliminary estimates as gospel, and then come up with political conspiracy BS when they’re revised.”
This. And we all know who one of those morons on social media happens to be 🤣
Great charts, Wolf. You’re performing a valuable public service. Your articles are the most interesting and important of anyone in finance or economics that I follow, and I follow a lot of them. Is there any way I could help you with this. I’m retired and have the time. I check your emails every single day.
YES JK,,,
As someone similarly situated, etc., I can recommend only what I actually do, which is support Wolf’s efforts by sending him cash or at least MOs every year.
IMVHO, his work is the best I have ever found, including searching a LOT…
totally agree
We know Services inflation has been hot last 2 years. It never went away in last 2-3 years. Trend stayed same or went up. Everybody wants higher wages in services in order to survive.
Real Question is:
Will FED will follow its inflation mandate? Last Press Conference, Powell sounded like he intends to do. But he is just 1 vote out of 12. After July Jobs report, Many in that gang already soiled their diapers . Bowmen now asking for 3 cuts. Puppet Waller asking same. Kugler replacement is also asking. Bullard who is now one of the contenders is asking for 100 BP cut. So I guess Musalem will toe the line.
So when they are so predetermined, do you really want to have high hope?
Good luck..
I don’t follow this board that closely..but if it is tilting as you say, things look bad for inflation, for the US$ and for US bonds,
Remember the old saying: a camel is a horse designed by a committee.
But the camel has turned out to be a very good solution for the environment and use it was designed for.
I guess the question is whether the “cut now” people actually meant it.
It’s like when Congressmen vote for something for appearances that they don’t really want to pass, but can do so because they know it’ll fail anyway.
Could these people be trying to suck up without actually having to deal with the consequences of those proposed actions?
Thanks Wolf! Remember, a hungry, un-caffeinated man is an angry man!
Raise those rates Mr. Powell!!!!
LOL!
And here we are with a terrible CPI print and the markets are sky rocketing and all the media is saying cuts are coming.
We truly live in the worst timeline.
I agree. Moreover, it seems like the average intelligence and cognitive dissonance among the general populace is shocking. The same people that where mad as hell about calls to lower interest rates by Biden are now silent when Trump makes that same calls.
Humanity has truly devolved.
You could say that the stock market is discounting the distant future.
Saw an interesting vid the other day with Jim Rickards. He was talking about Modern Monetary Theory – how those who espoused it thought the government could spend AS MUCH as their hearts desired, and print, print, print without any consequences. Like a person with a credit card spending gazillions of dollars without a care in the world. Jim said, (something like) “Sure, fine and dandy, until the people start to sense something isn’t right and start to buy real assets – anything but the dollar.” So yeah, good luck with MMT. It was fun while the roller coaster ride lasted. Goodbye, MMT!
Why risk cognitive dissonance on reading Kelton, Mosler, Wray, or other MMT advocates to see what they actually say about real resource limitations when you can just regurgitate a quick inaccurate gaslighting misrepresentation that appeals to confirmation bias?
Hi Wolf, this data does look bad but you don’t believe there will be a pullback in the next reports? I am definitely getting flashbacks to 2024 where Core CPI YoY wasn’t budging at 3.2% yet the Fed still cut rates because it worried about unemployment (it exceeded their median forecast by 0.2% I believe). However, the unemployment rate today isn’t exceeding their last median projection, yet people are still predicting an almost 100% chance of rate cuts. I don’t even know how cutting rates will help with anything anymore, is unemployment going up actually due to these high rates or due to other factors (federal workforce downsizing, cyclical layoffs, immigration, etc.), I think the Fed will cut rates unfortunately however (because it’s independence is clearly compromised), and I think only a (not soft) recession or stagflation are the only options left.
LoL, this stub is pretty wack. I think 25 cut in Sept, and another 25 in Dec. But it won’t save real estate.
The CPI print will get worse, but the slowdown in the economy will get worse. Stagflation will be apparent next year.
The real question is how international trade will work out, but so far TACO has been an exceptional win for some people.
But how does corporate America keep having a rising stock price when they have to eat inflation and tariffs in profit margins?
What breaks first? I dunno.
Kinda like the Mad Hatter’s tea party….move down, clean cups…
..only it’s reorganize, merge, spin-off, change laws, sue and counter sue, more bribes, corruption, cops, drones, cameras, new financial instruments, more shell companies……nobody not of the ruling class will ever figure it out……you’ll just see more rich and many more poor.
Maybe even real castles?….for sure lotsa big beautiful WALLS……some to keep people IN, and some to keep people OUT.
The lucky ones will work in the Big House and have IEDs implanted in their heads.
I know some still believe in king dollar. Good for you, but more and more are looking for something with long term value.
Perhaps they are going short, because long would not work?
T Bill and chill will put you in the poor house. All these deals will not happen until long after he and his crew are gone.
Any predictions on the SS cola for next year?
Wolf’s biggest nightmare – another MAJOR FINANCIAL site has this story posted today –
“ Wholesale prices post biggest surge in three years, PPI shows, in sign of tariff-related inflation.”
I guess we could blame the inflation on the boogeyman: That might work.
🤣 these braindead morons and their goofball watercarrier.
1. It was the services PPI that exploded, while the finished goods PPI decelerated.
2. The PPI tracks prices that companies charge other companies, not consumers. And yes, companies are paying the tariffs, $28 billion in July alone, companies paid that, and I made a big deal out of that here, and they’re trying to pass those tariffs on to each other, as they share the meal of eating the tariffs. But that’s NOT consumer prices.
Your moronic article doesn’t understand those two points? And you fell for it??? Use your brain!
Article coming with a beautiful chart of the exploding services PPI.
Great call Wolf
apparently some get it…
Chicago Fed president Austan Goolsbee cautioned Wednesday that if there are more inflation reports that show prices for services are rising, like the CPI report earlier this week, that would be concerning.
“Services are not tied to the tariffs,” he said. “Everyone is hoping that’s just a blip. There’s noise in the data. If you start to get multiple months where the components suggest that the impact of tariff inflation is not staying in its lane, that would be more of a concern.”
Imagine the inflation had they not streamlined our apparel to only last for 7 washes?
Get ready for some serious services inflation due to the scam insurance companies are inflicting on homeowners across the country. Because they lost so much money in California and Florida and NC recently these home insurance parisites are passing on all their losses to people who live far away from the hurricanes, wildfires, tornados and floods. They need their money from them. So I and neighbors near me in Maryland, who have none of these perils have to pay up. They have been circulating drones over our houses inspecting roofs and demanding roof replacements when they are not needed. If you don’t replace the roof look for your premiums to go up 40% or have your policy cancelled. They are also sending crooked home inspectors to your house before renewing your policy. They are looking for reasons to raise your premiums. I got a letter the other day to set up a home inspection. All of these tactics are designed for one purpose and one purpose only. To get more money out of your pocket so they can improve their bottom line.
I wonder if the insurance companies are losing their shirts with their required reserves.
Too many CMBS’ perhaps? Too many LT Treasury Bonds purchased before 2022? They have to make up the money somewhere to pay the high(IMHO) executive bonuses and to show shareholders they are making a large profit.
Yesterday’s core CPI was hot, and today’s PPI is through the roof. Inflation is heating up. While I like most of what Trump does, I hope he does not come out with more idiotic comments like inflation is in check and the Fed needs to reduce interest rates. Trump should read Wolf Street and the comments. Nobody gives a rat’s azs about the Kennedy Center or the Smithsonian or a new ball room for the White House. He should quit wasting his time on that stuff.
Resume tbe $50B monthly QT.
Please.
They can go to $40 billion (from currently about $20 billion) by just selling MBS outright to top off the $35 billion a month cap they already have in place.
As I think you know, I disfavor selling loans that are now starting to perform at a higher level especially at a loss.
Absorbing excess liquidity thru the Treasury market is the way to go!