Where they spend has changed dramatically, with only two winners that gained share among the retailer categories. The rest lost share, some are getting wiped out.
By Wolf Richter for WOLF STREET.
Consumers spent $8.5 trillion over the past 12 months at brick-and-mortar and online retailers to purchase goods, from shoes and groceries to RVs. In June alone, they spent $720 billion. But how are consumers divvying up these trillions among the retailers? And how has it changed over the past 10 years?
The big winner is ecommerce, whose sales soared by 212% over the 10-year period. As a result, its share nearly doubled to 17.2% of total retail sales over the past 12 months through June, up from 8.9% in 2015, gaining 8.2 percentage points in share in 10 years; and up from a share of 5.4% in 2003, when retailers were still brushing off ecommerce as a threat to their brick-and-mortar business. Over the past 10 years, ecommerce became the #2 retailer category behind motor-vehicle and parts dealers, up from #5 in 2015 (dotted red line in the chart).
The only other winner: restaurants and bars (“food services and drinking places”). Sales soared by 88% over the 10-year period, causing the share to increase by 1.8 percentage points, to 13.5% over the past 12 months through June, up from a share of 11.6% in 2015, bypassing food and beverage stores and general merchandise stores to become the #3 retailer category. All other major categories lost share to ecommerce.
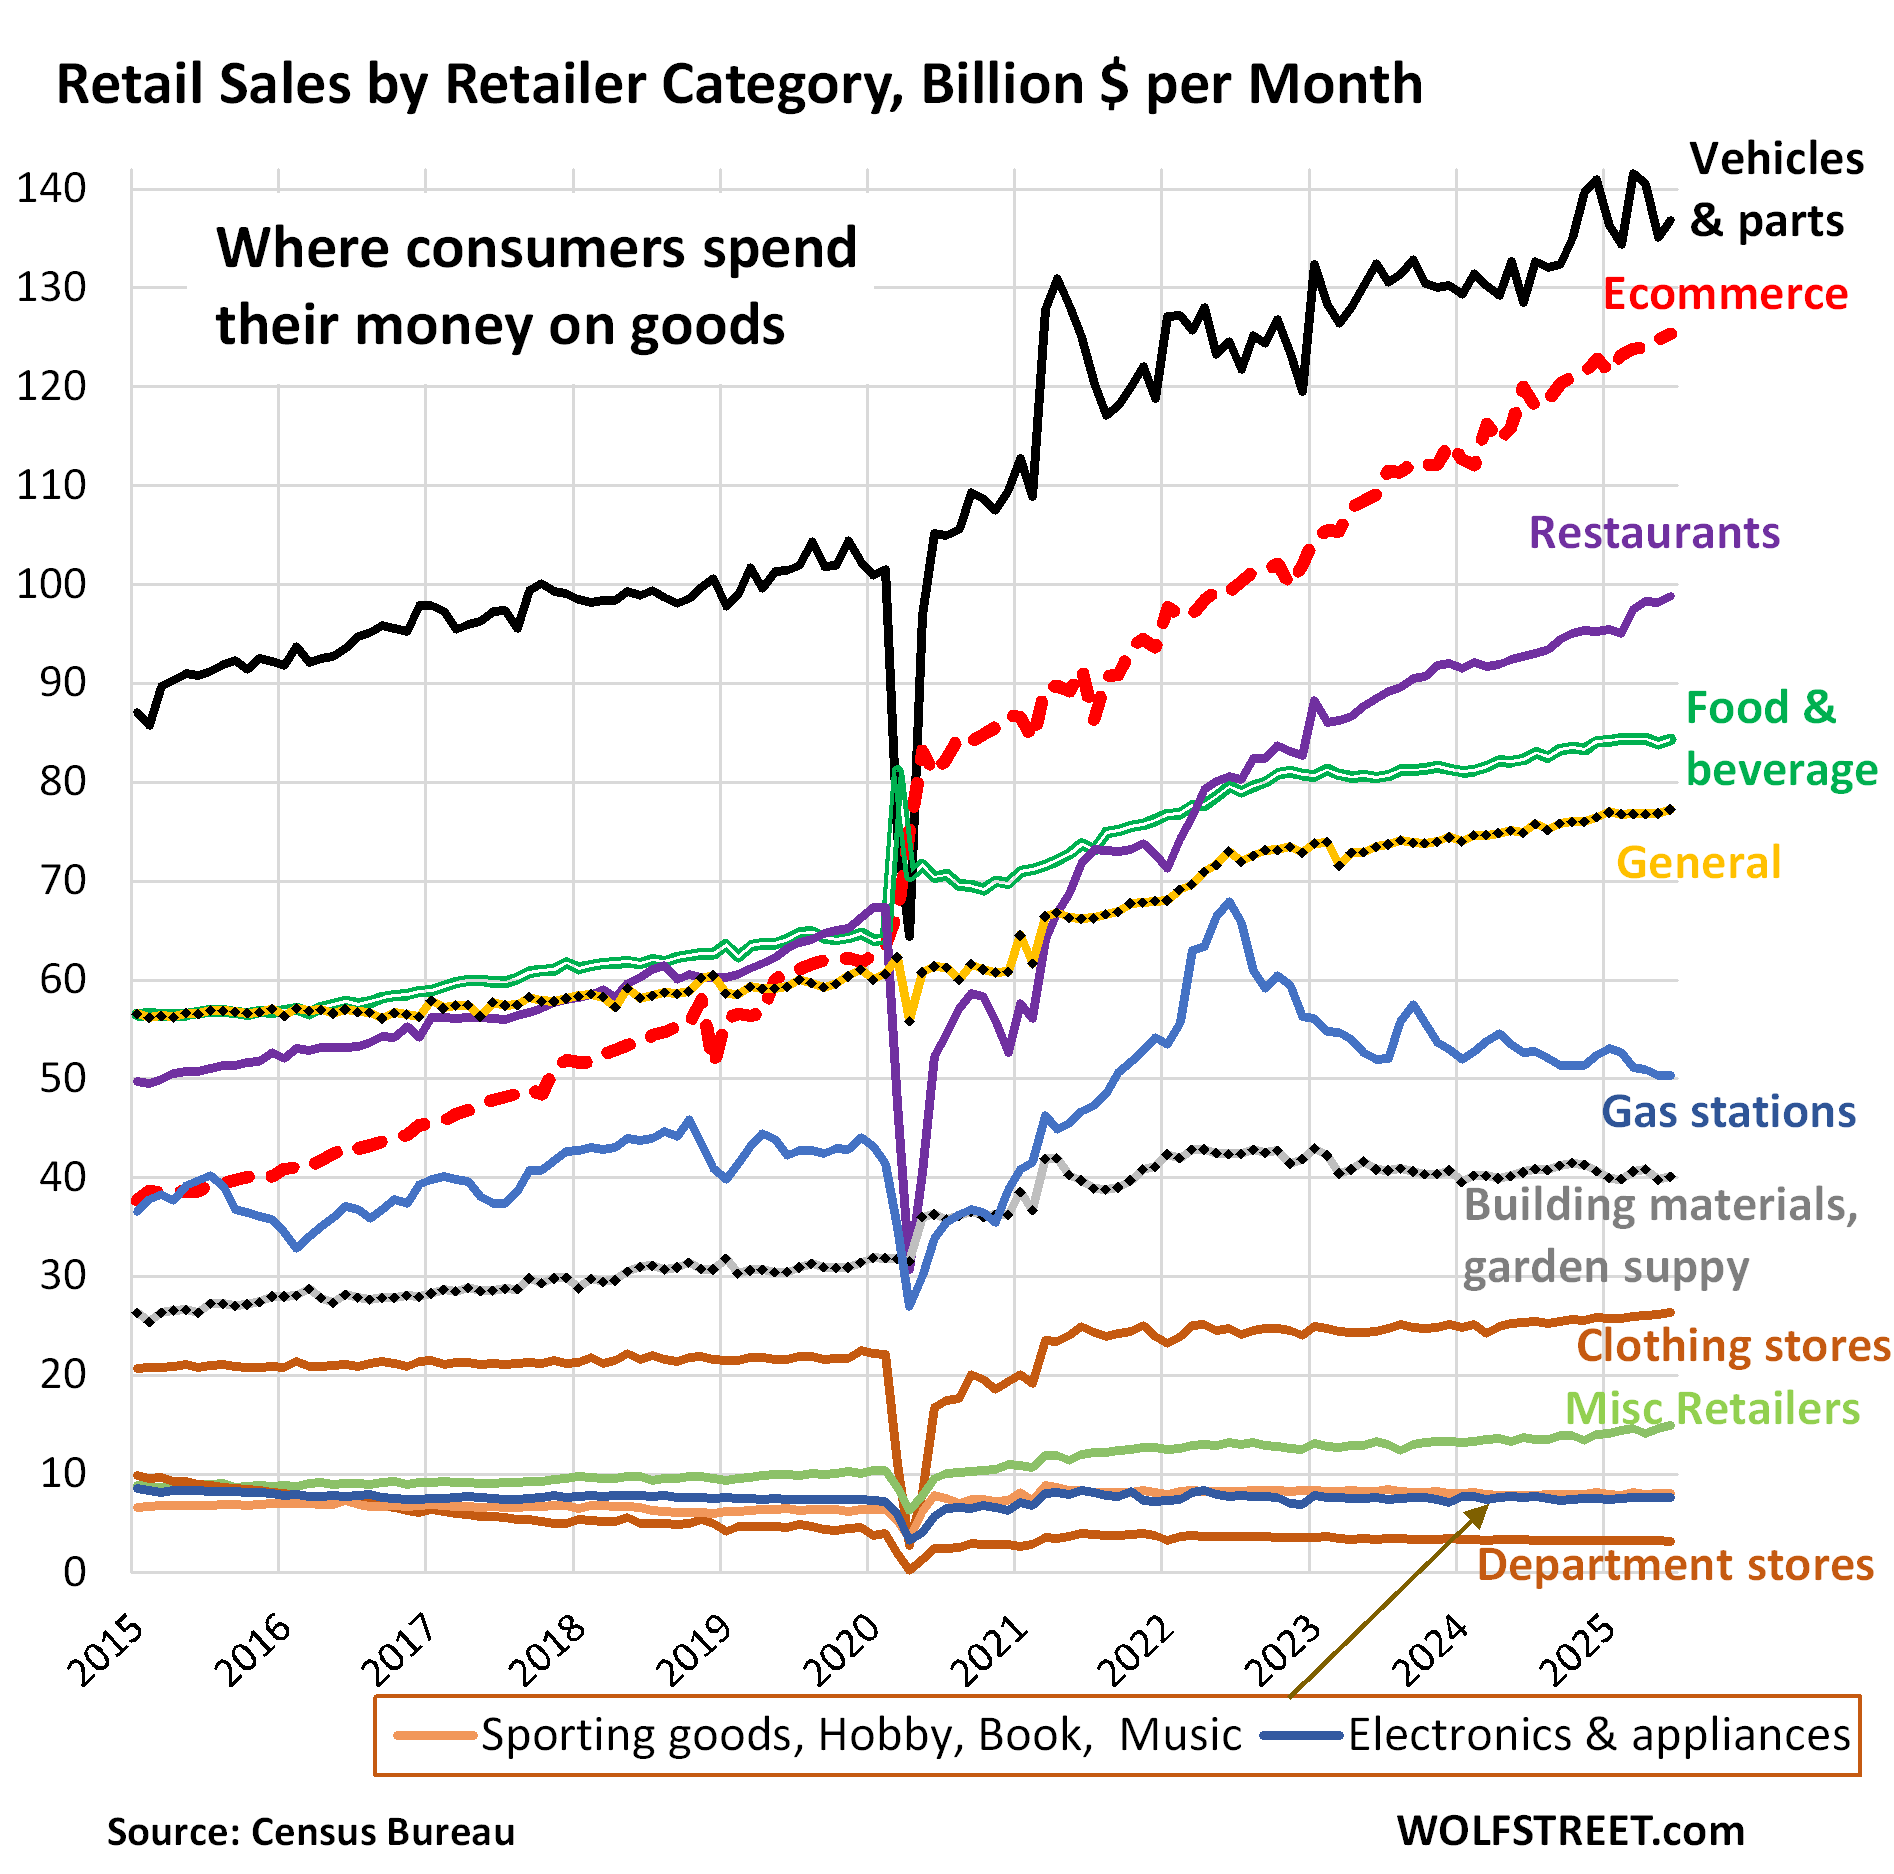
Over this 10-year period, total retail sales have increased by 63%. For retailers to maintain their share, their sales would have had to also increase by 63%. If sales increased by less than 63%, they lost share. If sales increased by more than 63%, they gained share.
Only two major categories increased their sales by more than 63% and gained share: ecommerce and restaurants and bars. They are eating everyone’s lunch, so to speak. Their gains are the result of big structural changes in how Americans spend their money and what they spend it on.
The #1 category is still motor vehicles and parts dealers (black line in the chart above). They sell new and used vehicles, recreational vehicles, motorcycles, ATVs, other motor vehicles, boats, tires, and parts. Over those 10 years, their sales rose by 51%, but that was less than the 63% increase of total retail sales, and so their share dropped to 19.2%, from 20.7% in 2025 (top black line in the chart above).
Those top three – motor vehicle and parts dealers, ecommerce, and restaurants and bars – accounted for half (50%) of total retail sales over the past 12 months through June, up from a share of 41% in 2015.
Sales at restaurants & bars, the #3 category (purple in the chart above), increased by 88% since 2015, while overall retail sales increased by only 63%. They blew by food and beverage stores in 2019.
During the pandemic, many restaurants were shut down, and sales collapsed, while grocery store sales spiked as people couldn’t eat out anymore. But then the restaurant industry re-opened more vibrant than ever and left food and beverage stores in the dust.
Restaurants benefited from the post-pandemic “revenge spending,” when people wanted to get out of the house and have “experiences,” and this trend, despite predictions that it would fizzle in 2023, has continued full force, as consumers are in the mood to splurge, and have the money to do so, with record high earnings and historically low unemployment.
Food and beverage stores dropped to #4 (double green line in the chart above), as their sales increased by 48% since 2015, while overall retail sales increased by 63%.
In 2015, they were #2. They were bypassed by ecommerce during the lockdown and by restaurants and bars in 2022.

General merchandise stores and ecommerce ate their homework. Food and beverage stores lost sales to general merchandise stores that also sell food, such as Walmart (now the largest grocery seller). They also lost sales to ecommerce, including to online-only food retailers. And they lost sales to restaurants.
General merchandise stores dropped to #5 now, from #3 in 2015, and their share declined to 10.7% now, from 13.0% in 2015. Over those 10 years, their sales increased by only 35%, while total retail sales increased by 63%.
These brick-and-mortar stores lost a large part of their nonfood sales to ecommerce retailers (such as Amazon), or shifted sales to their own ecommerce channels (such as Walmart, now one of the largest ecommerce retailers in the US). Part of the brick-and-mortar stores’ loss of sales to ecommerce of their nonfood items was covered up by their increased food sales, at the expense of grocery stores.
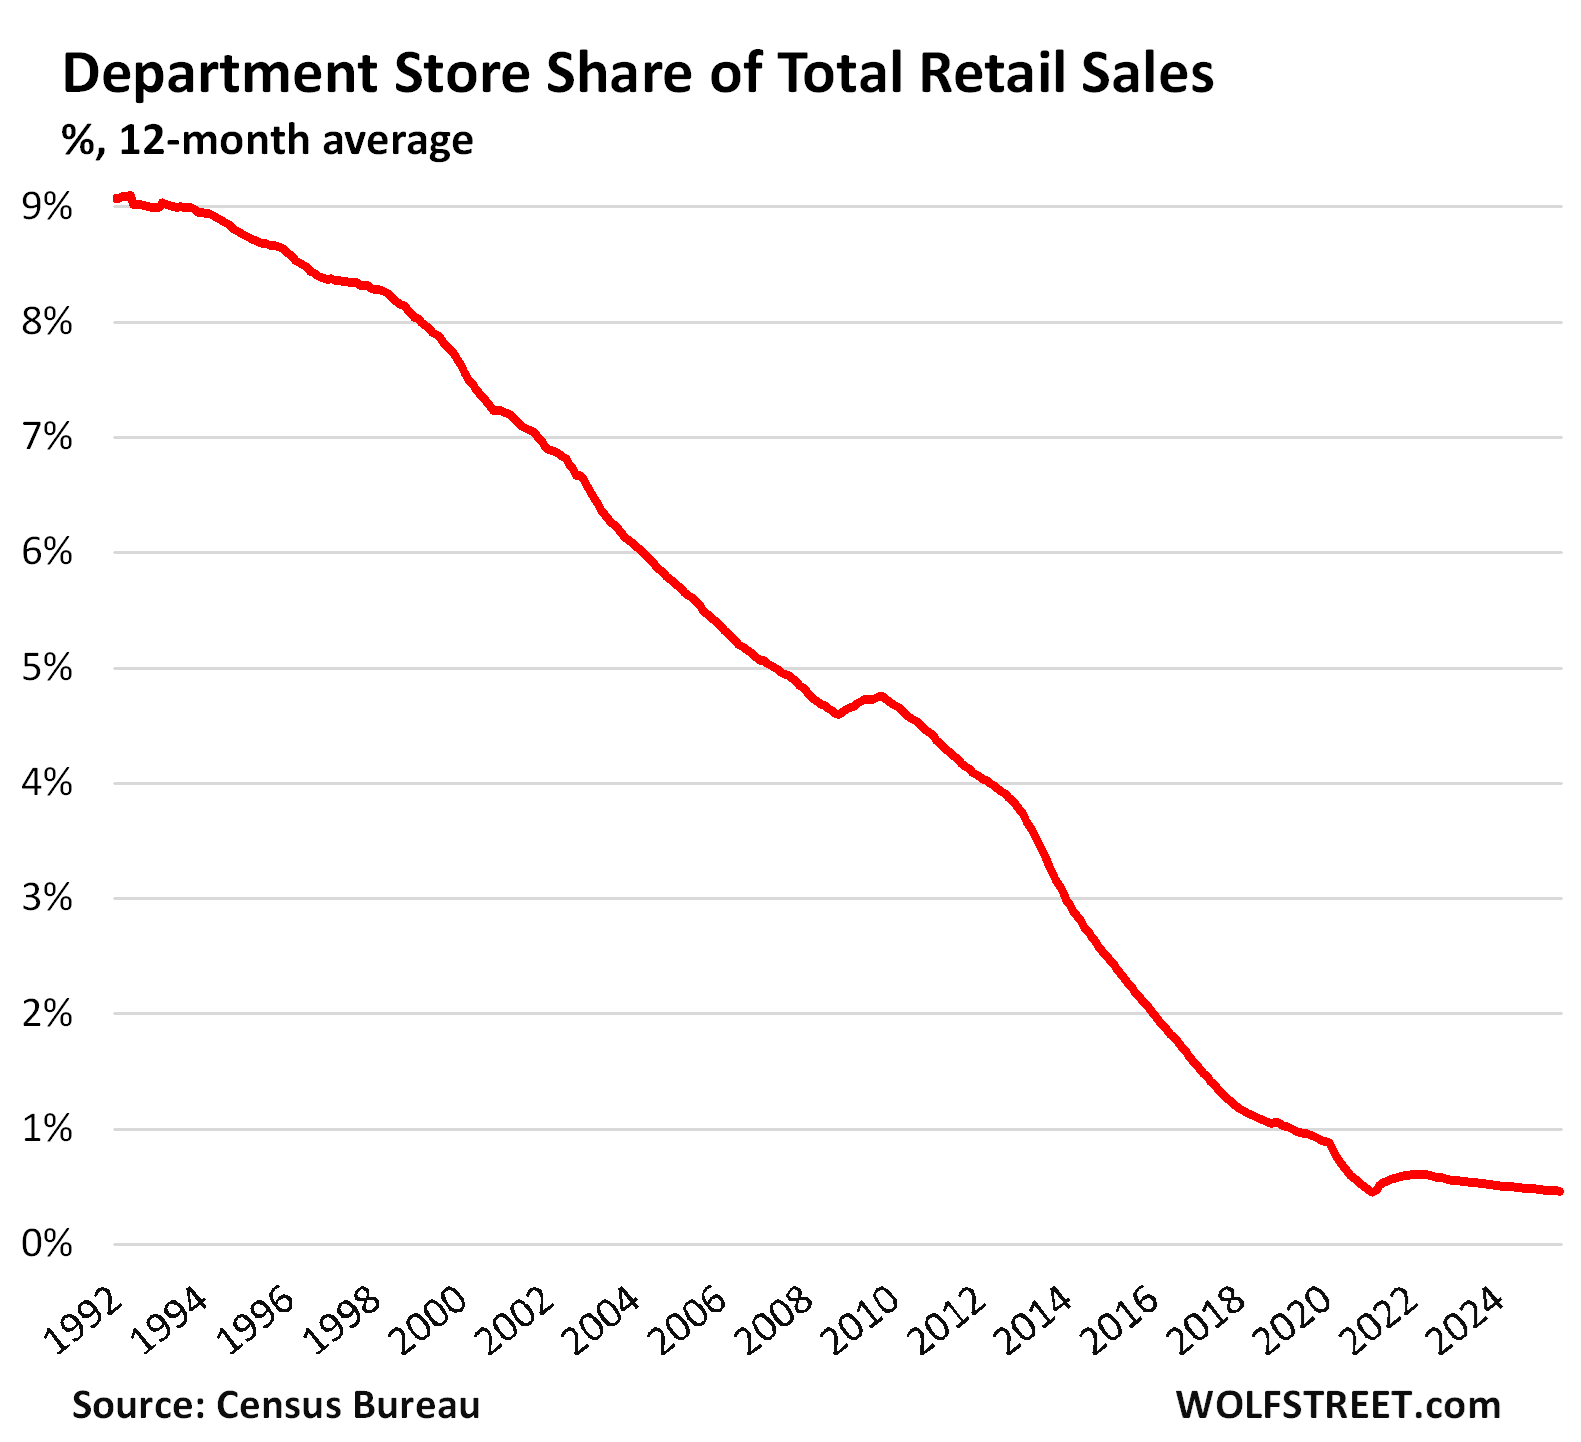
Department stores were once the iconic way in which Americans shopped. Their slow demise started quietly in 2001 when their sales began their relentless decline.
Ecommerce brought about a structural change in how Americans shopped, and it pulled the rug out from under department stores (brown line at the very bottom of the first chart).
Here is the long-term sales performance of brick-and-mortar department stores. This does not include the ecommerce sales of the few remaining department store chains, only their brick-and-mortar sales:
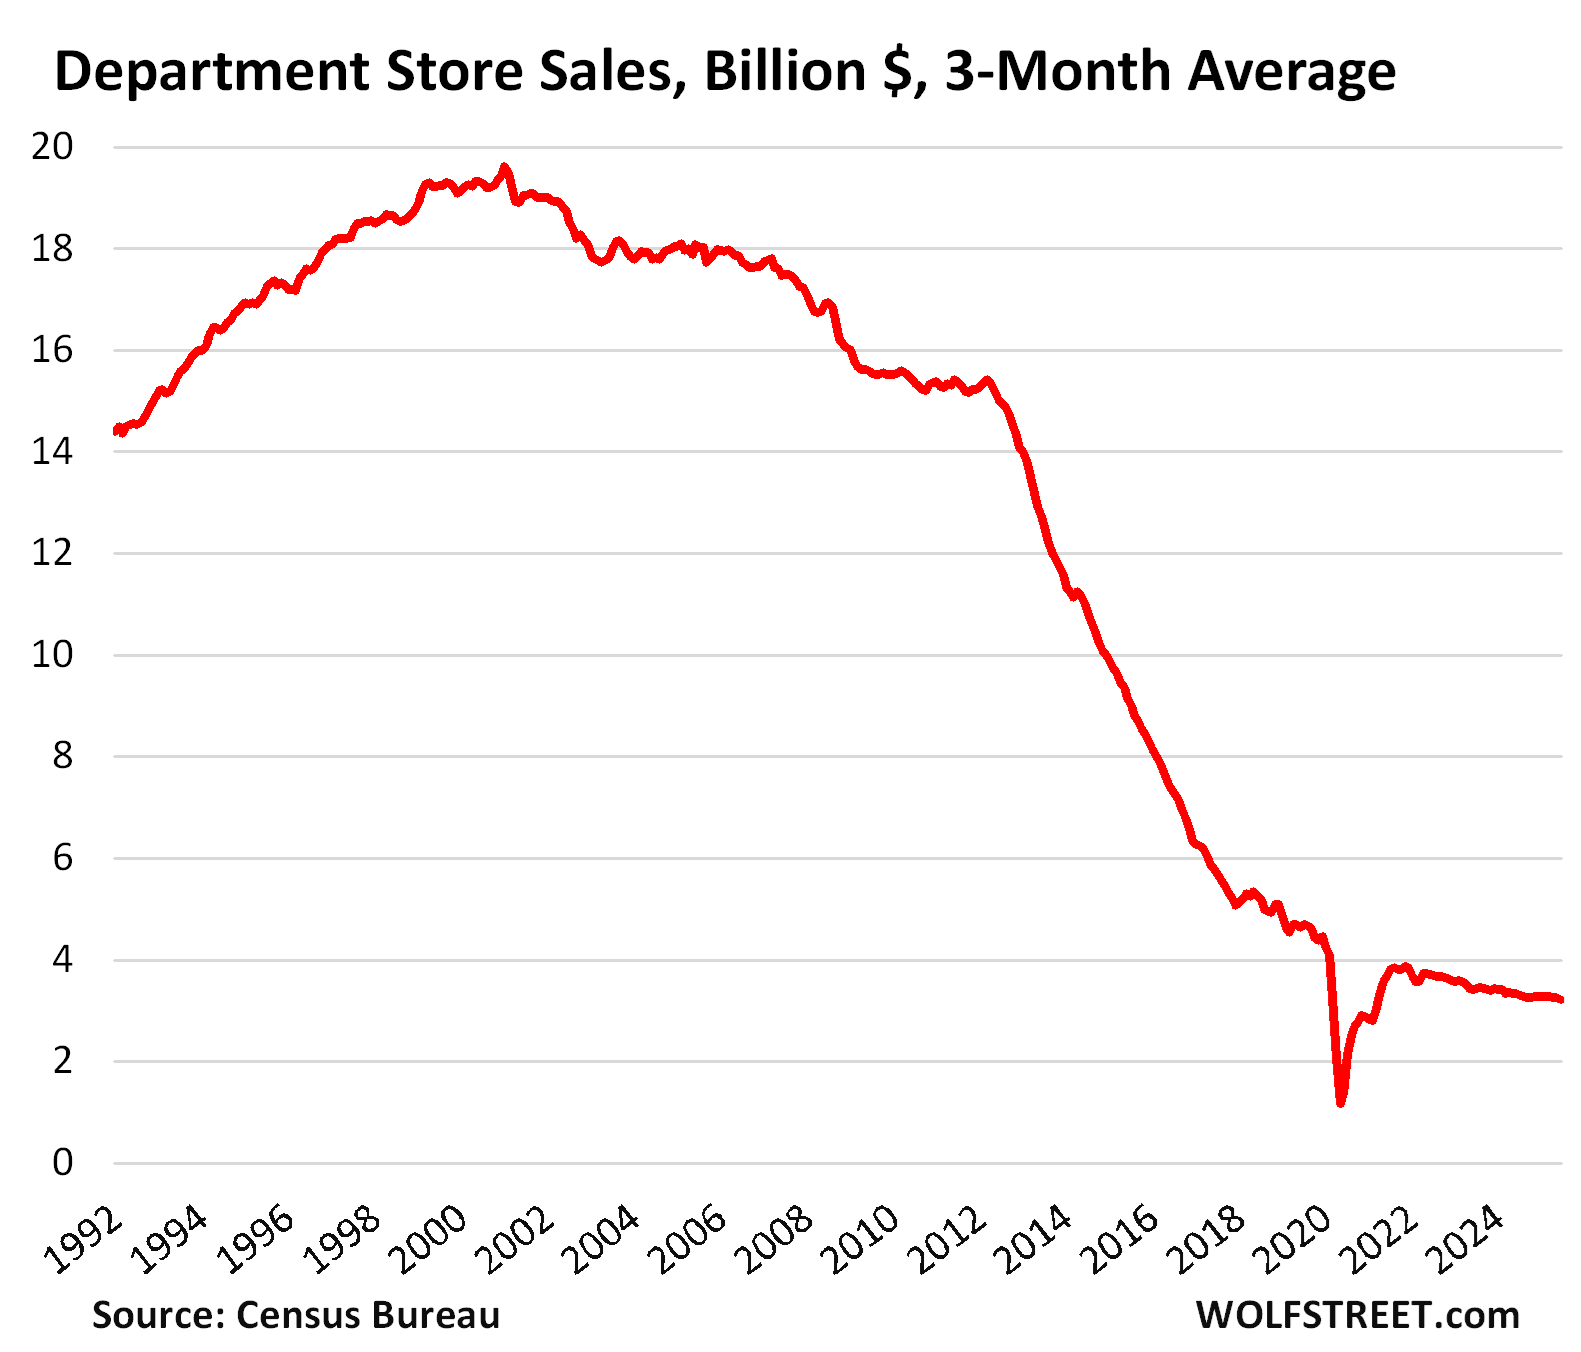
In 1992, department stores had a share of over 9% of total retail sales. By 2004, their share was down to 5.4%. By 2015, their share was down to 2.0%. Now their share is down to 0.46%. They really don’t matter anymore.
As this shift occurred, countless independent department stores, regional chains, and national chains were liquidated in bankruptcy court, while the few surviving chains closed thousands of stores. Since 2016, WOLF STREET’s Brick-and-Mortar Meltdown has documented the fate of many of these department stores along with other brick-and-mortar stores.
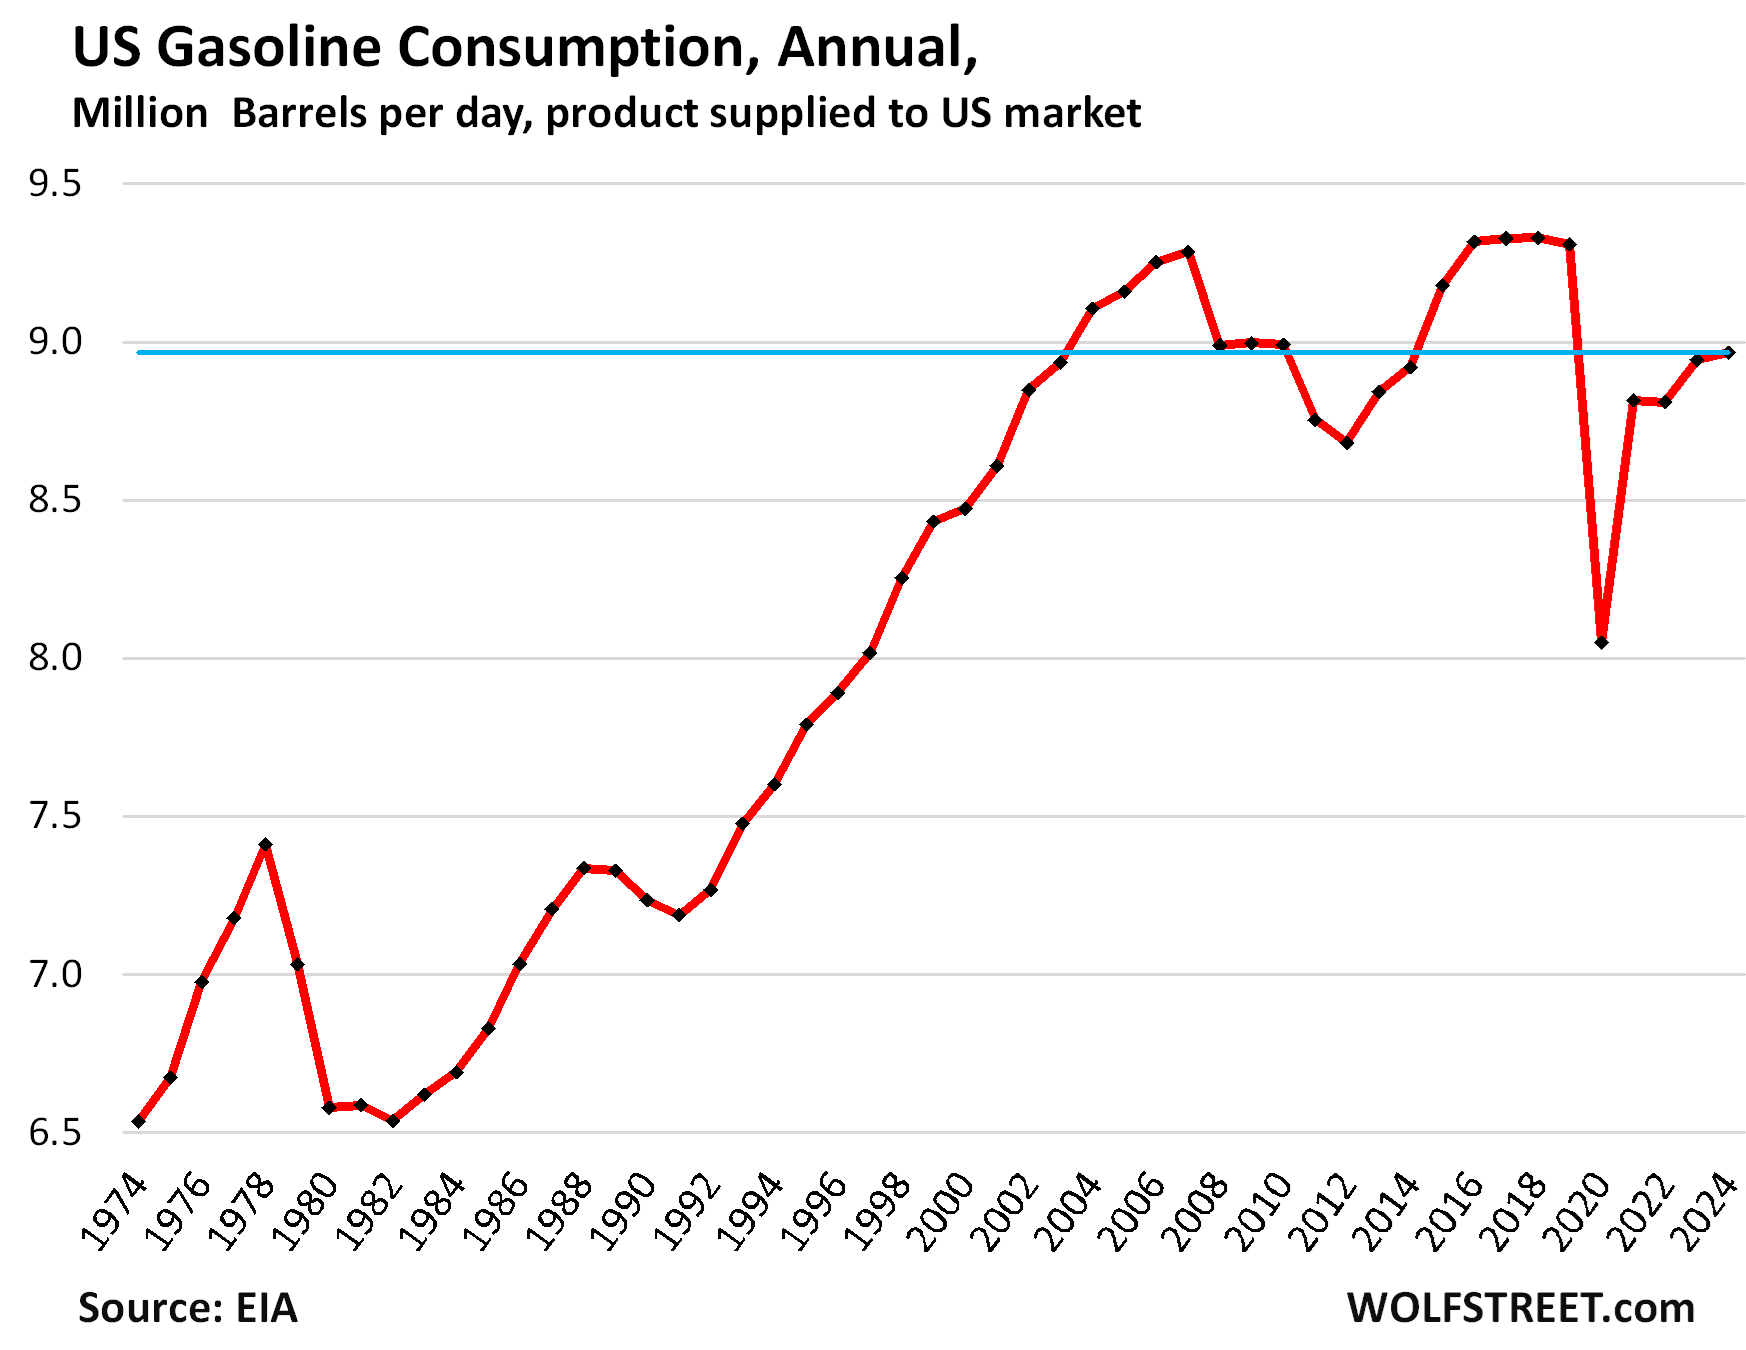
The share of gas station sales, the #6 category, dropped to 7.3% over the past 12 months, from 8.6% in 2015, largely driven by the price of gasoline (blue line in the middle, first chart).
But there is also the long-term issue that gasoline consumption per capita has been declining for over 20 years, as a result of fewer miles driven per capita, and ever more fuel-efficient vehicles (including now increasingly EVs).
In 2024, gasoline consumption in the US was 3.9% below the 2018 peak and 3.4% below the prior peak in 2007, and about where it had been in 2003 (details and charts are here):
In case you missed it: My Thoughts about those June Retail Sales
Enjoy reading WOLF STREET and want to support it? You can donate. I appreciate it immensely. Click on the mug to find out how:

![]()
Just curious – if someone orders bags of garden soil (or any other inexpensive bulky item that is impractical to ship) online at Home Depot or Lowe’s website with a same day store pickup, is this attributed to e-commerce or brick&mortar in the category?
Most people would still buy those at Home Depot or Lowe’s, they are just using a website as a convenience tool to make sure they have their stuff reserved for them for when they come to the store, or because they want to use an online coupon or to save some legwork on searching small items in a store.
I guess, my question here is if this is truly a shift from b&m to e-commerce, or if it is just an added convenience, by had it not been offered by retailers, customers would’ve still shopped in store?
This also somewhat “explains” why car dealers are going strong – because they are not too much affected by e-commerce (except for Tesla or whatever new models like Carvana/Vroom exist)
When you buy online and pay online, it’s ecommerce. It doesn’t matter how the product gets inside your house. Whether someone delivers it, or whether you pick it up at a locker or at a store doesn’t matter.
The delivery business is a service and belongs to the transportation industry, not retail. By picking it up yourself, all you’re doing is taking share away from a transportation service provider.
“This also somewhat “explains” why car dealers are going strong”
No, they’re not going that strong. They lost share in 10 years, their share dropped to 19.2% now from 20.7% 10 years ago, as the article points out. Some EV makers and used vehicles dealers are doing brisk business online. But the state franchise laws still protect franchised dealers from their own automakers selling online directly to consumers.
So when people order groceries to pick up, that gets put into the e-commerce category? That’s fine, but obviously a huge chunk of that green line has now been shifted to the red line, so that kind of alters the original perception of grocery buying being lower than restaurant buying and e-commerce, right?
Under the second chart, there is this paragraph:
“General merchandise stores and ecommerce ate their homework. Food and beverage stores lost sales to general merchandise stores that also sell food, such as Walmart (now the largest grocery seller). They also lost sales to ecommerce, including to online-only food retailers. And they lost sales to restaurants.”
So if Walmart, Target, Lowes etc etc swapped in store sales for online sales doesn’t that kind of remove some of the “punch” of this e commerce statistic?
I know target is something like 20% online sales now. That’s the little part of their parking lot where their minions have done your shopping and pop it in your trunk.
I like to do my own shopping for the free exercise. Cuz I don’t want to be a blob of fat.
Wolf,
Is there more data available to break down e-commerce into categories? We would clear up some confusion here, and perhaps also find interesting data as to what people are buying more of online, and what people are cutting back on.
The Census Bureau releases its complete ecommerce data only on a quarterly basis – so this monthly data here is called “advanced” = preliminary data.
In 2020, Census started showing some “experimental” details by ecommerce product category, going back to 2019. It now goes back to 2018. But this data is incomplete, has gaps (where data doesn’t “meet publication quality”), has a lot of variability (noise), and is late (Q2 data won’t show up until some time in August).
So I’d have to use this data with lots of caveats. And some categories I couldn’t chart because of the gaps.
I covered that quarterly by-category data when it was first introduced in 2020, and maybe in 2021 a few times, but not many people read it. So I stopped.
Here is one of the articles that I could easily find. But there are more. There should be one for Q4 2020, published in early 2021, but I couldn’t find it easily.
Scroll down to get to the by-category data:
https://wolfstreet.com/2020/11/19/pandemic-ecommerce-sales-jumped-37-in-q3-after-44-spike-in-q2-blistering-growth-rates-by-product-category/
Here is one of the charts in that article — so this is ecommerce sales by category (not brick-and-mortar):
In terms of your: “what people are buying more of online, and what people are cutting back on”: the quarterly experimental by-category ecommerce data is too variable (noisy) to allow you to come to that kind of conclusion. It might look like they cut back on furniture in one quarter, and then splurged in the next quarter, because the figures jump up and down, but that’s not the case in reality. Consumer spending doesn’t turn on a dime like that. It’s just data noise, and there is a lot of noise in that quarterly experimental by-category ecommerce data.
If enough people are interested, I might do it again. The data quality has improved some, and they extended it going back by another year now to 2018. Maybe once a year, or once every five years, LOL
I worked commission sales in a major luxury department store from 1983 to 2015, and made a good if not great living at it. My experience mirrors the Department Stores Graph above perfectly. Sales just kept steadily rising up into the early 2000s; we then inexorably went from flying to driving to running to walking to crawling in the next two decades, and, no matter what alternate, rationalizing explanation someone might have for you, it was 90% ecommerce driven.
Disagree somewhat. I assert that a sizable drop in luxury department store sales was also due to the younger generations who have little interest or ability to partake of that lifestyle. Yes, ecommerce has played a role, but there is also a demographic piece that was involved.
I would add that there was also a societal shift with malls: how many videos on-line are there of near-riots or other violence taking place at malls? Yes, this is a super rare, but they become viral and get people thinking. Add to that the declining quality of people working at malls, lack of inventory, and so on and it’s like “why leave my house to go shopping when the mall may be dangerous, they probably don’t have what I want, and I can do it from the convenience of my home? So it is not just the “pull” of e-commerce, it is also the “push” of a much crappier society.
“a much crappier society”
Meh, I’ve been around for awhile and don’t see it. I do see a lot more viral videos of people doing crappy stuff. But that is just increasing awareness. I see it as the death spiral of malls: ecommerce has a bigger selection, so less sales and profits by mall retailers, mall retailers cut back to their most profitable items and reduce labor costs, people increasingly can’t find what they want and reduce shopping, making ecommerce even more valuable spiraling down, the mall owner can’t rent space and loses income and profits, reducing maintenance and security guards. The place looks shabbier, theft and violence increases, people use ecommerce even more. And around the toilet bowl it goes…
I think you’re spot on here. It’s both this and e-commerce. Hard to say how much with malls in particular. But I bet you this – in every single city in the country, it was always the malls built in the 60’s and 70’s that were once in the ‘it’ part of town that were the first to become the ‘no-go’ zones. Got one in Tampa and another in J-ville that immediately come to mind. Both got shuttered not long after the GFCI.
AGHM….vis J-Ville Mall…is it possible the demise was due to the advent of the very large Town Center complex of shops, restaurants, etc.?
My college roomate made great money as an undergrad working at Nordstrom part time in the early 80’s (so much that they flew him to talk to other part time salespeople out of state to talk about about how he created a strong customer base by writing personal letters to his good customers). E Commerce is a big reason for the drop but as as @Mike R. says most kids today are not interested in what Nordstrom, Nieman Marcus and Macys are selling. My college age son was just commenting that he thinks even less guys under 30 today can tie a tie than drive a manual transmission and that there are probably more certified SCUBA divers under 30 than guys that can tie a bow tie (I taught my son “and” daughter to tie a bow tie in High School and I still wear the Robert Talbott self tie bow tie my roommate got me with his employee discount 40+ years ago to black tie events that seem to come up every year ow two)
The scuba hobby is struggling too. It’s expensive all around. It can be hundreds of dollars a day to get a few hours in the water.
Everytime I try to use a mall, the stores never have good selection. It ends up being a waste of time. They in part did it to themselves with poor selection.
A few things changed in the 2000s. A) Business casual dress. B) Strip-searches at airports. C) Stores’ focus on politics instead of service. I was a super loyal Nordstrom’s customer for decades until they shoved their politics in my face.
Wolf – great article on the continuing evolution of ‘Main Street’ ‘Murica! Thanks again for your creation and bartending of this most-excellent establishment!
may we all find a better day.
Yeah, that WAS REALLY good data…and a good article, too…timely….I didn’t need too much of it explained, though….
FN transport (and shelter from patrons and other articles) rackets……
“Bartender”…that’s a good one Dustoff….sure beats my “adult day care center”……..Why didn’t the guy who is so afraid he’s just gonna stay home get a little more “establishment” help though?….or at least a “you haven’t seen NOTHING yet”…..my usual input, and why I’m grumbling at a table in the far corner….but by choice.
Still nice hangout.
Topmost, 10 yr chart is very interesting and useful. Long term data tends to reveal important trends that frequently get lost in the weeds of short term data.
One unfortunate factor, ….
I deleted your post because it was just too much BS piled into one heap.
But I will shoot down ALL of it by telling you that ecommerce = retail sales of GOODS online, and does NOT include the sale of services, such as lodging, rental cars, plane tickets, reservations, subscriptions, insurance, etc., and does NOT include online B2B sales, etc.
Ecommerce = retail sales of goods only. Nothing else.
Like it. The Reply.
Yeah, me too. Small heaps of BS are ok? Probably depends on type of BS more.
Re: “ The rest lost share, some are getting wiped out.”
I recently stumbled on the topic of elevator strikes, and have been pondering AI implementation, as a metaphor.
“The Elevator Strikes were a series of labor strikes that took place from the 1920s to the 1960s across the United States”.
As a first step, it’s easy to understand the impact the internet had on department stores, and commerce, in terms of efficiency. Consumers were easily influenced by lower online prices, and cared less and less about retail sales spaces and people.
After twenty years of infrastructure buildout and conditioning — the pandemic forced dominate global adoption of online interactions — accelerating the cord cutting — not too different from smartphone adoption and the extinction of phones with cords.
Back to elevators, even though elevator operators became extinct — elevators essentially serve the exact purpose one hundred years later, moving up and down, ferrying people and stuff in between floors of buildings.
Now, with AI, and post pandemic dynamics, including fewer people in buildings — I think there’s a curious concern unfolding about an epic societal transformation related to technological transformation.
In a weird perspective, the extinction of elevator operators is evolving towards the extinction (decline) of office space and hence people in tall buildings — and without expanding this too far, the function of buildings and cities are undergoing a transformation that will be supercharged by AI.
I think that process will eventually mimic the elevator strikes, as people are forced to adopt new ways of living, that seem alien (as many people lose jobs to automation).
As with the elevator timeline, that process of change took multi-decades, but more than likely, we’re dealing with multi-years.
The evolution of commerce and consumer spending will undoubtedly be connected to efficient supply chains that have fewer people in the loop — which brings me the primary question:
How do the monkeys, squirrels and drunken sailors make money and drive spending, in a continuous parabolic upward spike — especially if a tsunami of jobs are headed to extinction?
The US employs far more people today than it did in the 1960s, the beginning of the electronic technology revolution. How did that happen?
I’ll find a better day all right…
Nothing better than to wait around for a better day. But with e- commerce, instead of meeting my new bride at the bar, now I can go online and order one. Not sure she will provide a ” better day”.
But looking for a date/bride online is NOT part of ecommerce. Ecommerce = retail sales of goods online.
But if that date/bride online is a bot? I realize the “personality” might be a subscription, software-as-a-service, but ….
So much for corporations eating the tariffs hahahaha
Bitcoin is now what 120k?… So much for that right ….
That whole study — link deleted — is ignorant bullshit because Amazon uses “dynamic pricing,” where prices change all the time, based on numerous factors, including who is looking at it, what data is in the browsing history, Amazon account history, etc.
So when I delete my browsing history, then google around for product X to create a new browsing history, then click on product X sold by other vendors, and then log into Amazon to look for it on Amazon, I get a lower price than my wife looking for product X from her computer at her office. That’s how dynamic pricing works, and they’re all using it, from airlines to Walmart. And a study that says that Amazon raised prices compared to Walmart is BY DEFINITION bullshit designed to be eaten by ignorant morons, and it has succeeded in that regard.
I had no idea I could delete my browser history and get a lower price… Thanks Wolf. I love this site.
The trick is to delete your browsing history, then search for the product — for example: cheap Levis — all over the place and wildly click around, and you’ll see different prices. Click on the cheapest prices. Then stop for a while, go have a beer or read two chapters of Big Like, then resume. This creates a new browsing history of you searching for the best deal, indicating that whoever wants to make the sale, needs to give you the best deal.
Eventually buy from a legit place that has the lowest price. Results may vary.
Amazon and others also know you by your IP address, so you could use a VPN, which gives you a different IP address each time. They can also use “browser fingerprinting” to identify you even after you delete the browsing history and use a VPN. That’s much harder to disguise. Regardless, if you shop online, you have to try to get the best deal.
If you’re married to Amazon, you’re going to pay for the privilege.
Department stores data makes no sense.
Only Kohl’s has like $3B revenue per quarter with 30% being online, so the rest $2.1B is brick and mortar.
$8B per year, only Kohl’s!
It does make sense. All sales charts are monthly sales. So multiply by 12 to get close to annual sales. Total department store sales over the past 12 months = $40 billion.
Department stores are narrowly defined by store type, not by brand.
There are only a handful of department store chains left, all of them have shifted a big portion of their business to ecommerce as a survival strategy because that’s what is doing well. Macy’s and Nordstrom have been over 1/3 ecommerce for many years.
Also outlet stores and discount stores from department store brands are NOT department stores.
“Small format” stores from department store brands are NOT department stores.
Other businesses that department store brands have, such as restaurants, are not included in department store sales. For example, 13% of Macy’s total revenues are from “other” which is primarily restaurants.
Fees that department stores earn, such as on branded credit cards, are also not part of department store sales. For example, 4% of Macy’s total revenues are from fees, including credit card revenues and its media channel.
So you take ecommerce (33%), fees (4%), and restaurants and other (13%) out of Macy’s revenues, and what’s left is 50% of Macy’s total revenues that may be department store sales.
(I’m using Macy’s because I’m a lot more familiar with it than Kohl’s and have followed it for many years).
Kohls is a sinking ship.
Best to run and not walk from that one.
Some Fund will buy it and extort value till it’s dead.
I see that Kohl’s has entered the meme-stock universe.
In 2006,the CEO of BP predicted the gasoline volumes have peaked and would gradually decline in the coming years…
Americans are addicted to cars. Literally. Nothing else can explain how an entire country can continue to spend what we do on private transportations.
And of course, this addiction is well understood by the automakers and all downstream players.
If Americans stopped buying these overpriced, pimp mobiles enmass, automakers would start providing cheaper, more economical (but still comfortable by any reasonable standard). And many would go out of business as the entire industry is bloated.
This will happen one day when things implode, but until then, happy motoring.
Americans are addicted to buying new cars. Not many of us out there that are passionate about keeping 10-20 year old cars on the road.
That’s why cars aren’t as reliable as they used to be – the manufacturers know they don’t need to be. Why build an engine to last 200-300k miles when you know the original buyer will probably trade it in before 100k? Computer-aided part design and materials engineering is also a factor since you can more precisely design parts to last 100k miles without over-engineering them.
The vast majority of today’s auto engines will easily go 200,000+ miles with normal maintenance.
Speaking for Hondas which is mainly what I work on… 15 years ago you could get a 4-cyl 2.4L Accord or CRV and yes it would reliably make it to 200k with regular maintenance. You might need brakes and suspension along the way, but catastrophic engine failure was unheard of.
These days you get their new 1.5T engine and a host of issues with those same cars. Oil dilution due to thinner piston rings, carbon buildup on the valves from direct injection, and evenmhead gasket failures are commonly reported on various car forums.
Used to be you could run a CRV with no oil and the engine would still crank. And issues like these were unheard of with Honda’s older (pre-turbo) engines.
Short, I have to agree that Honda has made some real errors in engine fuel management recently.
My friend, who has a medical laser repair business, has had older Odyssey vans go to 400K +miles with on;y timing belt replacements and oil changes.
My last Hyundai Santa Fe was given to my daughter with 180,000 on it and she now has over 200,000 with no issues. I did the last timing belt at 120,000.
There are lots of really good cars out there that can easily go to 200,000 with normal maintenance. Honda has crapped in their nest. Remember their transmission failures of 20+ years ago? Huge numbers failed early in their life.
Anthony,
You’re right, the early/mid 2000s were no walk in the park for Honda either… both from the transmission issues and catastrophic lower ball-joint failure.
But their V6 sure can last a long time as long as you do that timing belt service every 100k.
I’ve now gotten two Hondas from ~50k to 200k miles… first was an Acura 3.2 TL (J32A1) which was sadly totaled shortly after that milestone, and my current RDX (K23A1) has 202k and change. I expect to get at minimum another 10 years and 200k miles out of this vehicle, and ideally I’ll surpass half a million miles before even considering a replacement.
Frequent fluid changes are key – I do them much more frequently than what Honda’s maintenance schedule suggests. New cars don’t even have a maintenance schedule!
@Mike R. Americans are not “addicted” to cars and I would say that only a small percentage of America is like me and gives a crap about cars (my son estimates that less than half the young men his age even know what kind of engine is in their car). Public Transit is not time efficient for most people. Google says it will take me 1/2 hour to drive to downtown SF but “just over” a full hour if I take public transit. If I drive to Bolinas in Marin it will take about an hour and a half, If I take public transit Google says it will take almost 4 hours.
I am part of a declining interest in older cars(4×4’s in my case) and that and tools were me monies go beyond food ect.(necessities).
Everything else have well stocked up on and have close to lifetime supplies including foot gear/clothes/ammo/hunting-fishing gear ect.
We suddenly find the fountain of youth might need to reconsider but otherwise covered.
I have a dumb phone(makes and recives calls/all I need) and just changed service and saved about 60%,am always looking to find a less expensive goods services but will pay for quality,in long run I find saves monies.
” Nothing else can explain how an entire country can continue to spend what we do on private transportations.”
I disagree. It’s explained easily by the fact that a commute will be either 3x-5x longer or twice as expensive by mass transit (or both).
Americans generally have neither the time nor money (nor both) to turn that into a viable option. Riding mass-transit to work would have to be your full time hobby.
America is a big, desolate, mostly-empty place. Mass transit doesn’t work when nobody else is going where you want to go, in the way you need to get there. “Economical” crapboxes and low-end electric cars just aren’t durable enough to stand up to the 50+ mile each-way commute you get forced into when the 9 lords who own all the property in your city decide they would rather have the low-quality “luxury” apartments they’re constantly building sit empty and rot rather than lower the price of rent by even a single dollar. Even if you do happen to live in the city, it doesn’t do you any good. They tore down all the businesses to be replaced with apartments – so your choices are now a long drive or e-commerce if you actually want to buy anything. So city planning, zoning, and regulation are all big contributors to why owning a car is a 100% necessity for all people in America.
But sure, you should never, ever buy your car new. The problem with that in the US we’ve chosen to let the cost of used cars be artificially inflated by insider sources like Kelly Blue Book – a publication put out by auto-makers with the explicit goal of tricking you into buying a new car, with their extreme new-car markups.
I agree with that. Most people I’ve spoken to who drive shitty commutes (whether because they’re long distance or because they have to sit in traffic) do so because they don’t have a choice.
If they could drive to a train station, sit down, and zone out for an hour, they’d be thrilled to do that.
What they don’t want is to replace a 1:10 drive with a 2:40 minute series of trains and buses.
All of the components in the first graph can be and are purchased under the category “ecommerce” except gas stations, and maybe restaurants and bars, although many get restaurant food delivered by ordering it on-line. Even some cars can be bought on-line, e.g., Tesla, Carvana. Maybe a better delineation would be “stuff you can buy at home without moving your lazy a&% to a store” and “stuff where you have to go to a store to buy it”.
It’s interesting that department stores such as Kohls, Macy’s, Dilliards, etc., which mainly sell clothing, are losing market share, but discounters like TJMax and Marshalls and Ross, etc., which also primarily sell clothing, are doing great.
Their stuff is heavily discounted over the mall store prices. My wife used to shop at Marshall’s.
We don’t know from the data here if they’re doing “great” in terms of share.
At Walmart, what is doing “great” are food sales and ecommerce. The rest of their aisles, including clothing, have been in stagnation or decline and have lost lots of share. Walmart also has a separate advertising business that is doing well (just like Amazon has), but that’s not part of retail at all.
I just looked up TJX’s annual revenues. There was a lot of growth during the pandemic. But their fiscal 2025 revenues were up only 3.7% year-over-year. So that’s not “great.”
I was taking more of an investment perspective. TJX stock market cap is now $139B and is near an all-time high. It’s valued at over 2x revenue, with net profit margin around 4-5%. So investors seem to think TJX is doing great.
Compare that to Kohls which is valued at only $1B – $2B even though they have 1100 large stores.
The investment valuation differences are stunning within the store retail category. I have a hard time reconciling that difference.
Because “investing” today has very little to do with the quality of a business or its income stream. I wouldn’t read much into that.
What Walmart has done very well is convince the upper middle and upper classes that its a great place to order from online.
The same people who wouldn’t deign to step into a Walmart store have no issue ordering from Walmart.com, and they deliver basically as fast as Amazon. The partnership with American Express, where Amex provides free Walmart+ with its high-end Platinum card, also helped.
Analysts are warning that even the lower rise isn’t supported by the business’ fundamentals.
‘What has Kohl’s done to earn this acceleration? Nothing at all,’ Neil Saunders, a retail expert at GlobalData, told DailyMail.com. ‘The company’s strategy and fundamentals are no different today than they were yesterday or the week before.’
Before Tuesday’s rise, Kohl’s share price has been battered in 2025.
Problems started for the company in March, when executives lowered the year’s sales forecast. Top bosses at the company predicted a five to seven percent decline in yearly sales.
I ran across this, a few days ago, but an interesting dynamic:
According to a 2025 report from the National Restaurant Association, 75% of restaurant traffic is now takeout, which includes pickup and drive-thru orders.
Data also suggests that 58% of all foodservice orders are placed for carryout or delivery.
That’s definitely a pandemic thing, with people wanting fast convenience, versus making a food outing into an event, where an extra layer of service, slows down gulping food.
Maybe some of what we see happening with food service and e-commerce is a rising wave of lazy and spoiled people, who can’t take time to heat up something in a microwave, or spend time in a store — the greater efficiency is to have a nose buried in a smartphone, shopping for dopamine.
Several categories overlap, for the drunken sailors, like instant food delivery, via drones or robotics or deliveries by slugs in cars — the last mile problem is obviously a distribution barrier — and perhaps, like the shift from video stores, to streaming, we’ll see an explosion of delivery activity, where drunken sailors will gladly pay a fee to have ongoing meal deliveries, and their AI agent will know what they need 24×7 — drone ports will busy coordinating meal prep slobs with delivery slobs, and everyone wins, except the unused microwaves.
I’d need to see the breakdown of that 75% to know how useful it is.
I suspect places like McDonald’s were largely take out even prior to the changes of the past few years.
At restaurants that were previously mostly sit down, I suspect it’s a combination of poor service and laziness.
That original article said the 75%, comes from all restaurants ???
This expands on evolving behavior from younger drunken sailors:
“A booming new trend sweeping TikTok involves staying in bed for extended periods—not to sleep, but to do passive activities like eating snacks, watching TV, and scrolling through devices. The fad has been dubbed “bed rotting.”
I think that trend will evolve, to bed-bound zombies, whose primary function will be ordering services.
That of course, will eventually result in the ultimate species— the
Eloi, found in HG Wells Time Machine, who were serviced by the Morlocks (early investors in Amazon).
Interesting. My go-to watering hole seems to have a decent number of delivery services coming in to get food. I suspect a lot of it is business travelers in hotels. Also, it’s beneficial for seniors with mobility issues.
That chart in many ways reflects my own purchasing habits (though I drive far less than most, so I suspect my auto and gas station costs are uncharacteristically low). I am among the older cohort for whom the pandemic finally made e-commerce a reality (beyond books — I was already ordering those online) and now I find myself looking there first to see if savings are possible, especially for non-perishable consumables that can be purchased in bulk.
I think it is remarkable how profound the impact of COVID was. It forced people to get out of their routines and find new ways of accomplishing things. People found they could do almost everything online. The service sector naturally blew up and malls and offices began a long collapse.
AI is about to change pricing, with implications for corporate profits.
It’s possible some of the runup in corporate profit margins since about 2010 was due to analytics. AI might be the next step-change in perfect pricing.
“Delta is using AI-priced tickets to charge the most you’ll accept”
Companies — the airlines on the forefront — have been using automated (now called “AI”) “dynamic pricing” for over two decades, where prices change by the minute and by whoever looks at them, based on what the vendor knows about them, what’s in their browsing history, where they are (expensive ZIP code?), etc., to get the highest possible price you’re willing to pay.
The article is just a bunch of clickbait, and I deleted the link.
Google: dynamic pricing.
Amazon also seems to do dynamic pricing. I checked the price of an item a few times in the same day, and when I checked again to buy it later in the same day, Amazon had raised the price. It is possible it was just bad luck for me, but more likely Amazon was tracking me and figured I wanted it and would pay the higher price.
No, not bad luck.
If I order the same product twice on Amazon, the price goes up and stays there.
Same with airlines.
search your preferred airline
then google search a one way ticket then a return one way ticket. Shocking price differences.
Yes, dynamic pricing has been around for a while. The question is whether AI will allow for a step change in its effectiveness.
Corporate profits after tax started to soar after about the year 2000, were briefly interrupted by the financial crisis, then hit a new gear around 2020.
Was all of that dynamic pricing? Do changes in the technology of dynamic pricing explain where the slope of profit growth seems to change?
I’m interested in questions like those.
Guess I’m not meant to comment on your site, Ill read your content instead. Thanks wolf.
I understand that you’re trying to be funny sometimes, or mostly, or always, but it still has to make some kind of sense here. Say something that make sense and is on topic, and it’ll fly. It can be funny, no problem, but it has to make sense.
I had some rather negative responses a while back when i suggested Trump could rid us of cap gains on a primary residence….well….this will, IMO, unleash a tsunami of homes onto the market. All that cash will go somewhere….T-Bills and Ecommerce? Covid helicopter money in spades?
“WASHINGTON (Reuters) -U.S. President Donald Trump said on Tuesday his administration is considering removing taxes on capital gains on home sales.
“If the Fed would lower the rates, we wouldn’t even have to do that,” Trump told reporters in the Oval Office. “But we are thinking about no tax on capital gains on houses.”
Profits from the sale of homes, like other assets, are now subject to capital gains taxes, although there are large deductions for sales of primary residences.
Republican Representative Marjorie Taylor Greene interpreted Trump’s comments as a show of support for a bill she’s proposed called the No Tax on Home Sales Act, which would eliminate the federal capital gains tax on the sale of primary residences.”
When will people finally stop posting this endless “Trump said” stuff? He says a gazillion things every single hour of every day. Keep it to yourself and take it like a man by crying into your pillow.
Trump throws out a lot of bullshlt to see how it will fly. He knows what he really wants, but if he can get a better deal by baffling with bullshlt, he will.
I don’t see Congress going along with this, even if Trump wants it.
Even if implemented, it wouldn’t do a damn thing to help the housing market. It would just be a generous and undeserved gift to people who bought their houses 40 years ago.
As I posted in another article last week, if you bought a $350,000 house in Mountainview in 1986, and put $500,000 of capital improvements into it, your basis is $850,000. If you sell it for $4 million today, you pay taxes on $2,650,000 ($4 million – $850,000 – the $500,000 exemption for married people). That homeowner can afford to pay the 30% or whatever it’ll be on that taxable gain.
Now THAT, is REAL professional bartender advice. Dustoff is right.
@TSonder305,
1) What one can afford, and what is fair are two different things.
2) What if your example seller wants to move to another house in Mountainview? He/she now has less purchasing power thanks to the subtraction of taxes, and couldn’t even buy a comparable house next door.
3) Have you accounted for the >50% inflation since 1986? Most of that gain is not “real”. Why pay tax on inflation?
You see it’s more complicated that your example.
People already get a significant break on cap gains for selling a house, as long as you’ve lived there 2 out of the last 5 years. In my eyes this would only incentivize house flipping.
Money alone sets the World in motion -Publilius Syrus 42 B.C.
It’s been fascinating watching Ukraine drone advancement and the impact of game changing strategies.
And, as another example of an industry going through massive change, the food service industry is mutating into something different:
“ The US Dark Kitchens/Ghost Kitchens/Cloud Kitchens market size was valued at US$ 98.28 billion in 2025 and is expected to reach US$ 2,915.48 billion by 2032, grow at a compound annual growth rate (CAGR) of 62.3% from 2025 to 2032. Dark kitchens, also known as ghost kitchens or cloud kitchens, are delivery-only kitchens with no dine-in facility that prepare food specifically for online food delivery platforms”
Total rethink in terms of location and foot traffic and apparently a younger generation that’s eager to adopt new ways to consume — as these ghost kitchens menu- engineer with AI …. Hmmmm
A lot of the science fiction future that’s exploding in front of us, doesn’t mention how these young folks will be building cash flow — maybe working in ghost kitchens, chopping onions?
Memories of GameStop’s meme stock return as anguished chain Kohl’s sees sudden 105% Wall Street pop
Wall Street was surprised today by a rise that reminded investors of 2021’s meme-stock frenzy.
Kohl’s — the beleaguered big-box chain experiencing a years-long sales slump, major CEO drama, and multiple store closures — just saw a 105 percent stock jump.
In early day trading, the stock, which has been trading around $9 for weeks, reached over $19. The surge has since cooled, with shares now up above $14.
Off topic but I assume any Fed news is relevant.
My respect for El Erian just took a hit.
He is saying Powell should resign to “protect the Fed’s independence’ ???
If the Fed chair resigns because the Pres is whining, this obviously reduces the Fed’s independence. El Erian seems reasonably proficient in English, so maybe he has a private understanding of ‘independent’
The idea of Trump getting his hands on the Fed, and presumably getting yet another ‘yes man’ to carry even part of of his desire for a 3 (three) percent rate cut is guaranteed to create a real bond and dollar crisis.
After seeing that headline, I tried to strike El Erian off my list of people I would ever pay attention to but then discovered that I’d already struck him off that list years ago.
Along with his very weird partner, Gross, the first “Bond King”, and also the second one at Double Tree…..financial media never came up with a third, that I heard of.
El Erian is a clown, like all professors. They know nothing of the real world.
I thought making the kind of wealth (hard earned money as Gross’ partner) these guys do IS your definition of the REAL WORLD?
He is worth 10x the Ducks.