The job creation machine is running at a decent pace, unemployment is historically low, but it’s not evenly spread across all industries.
By Wolf Richter for WOLF STREET.
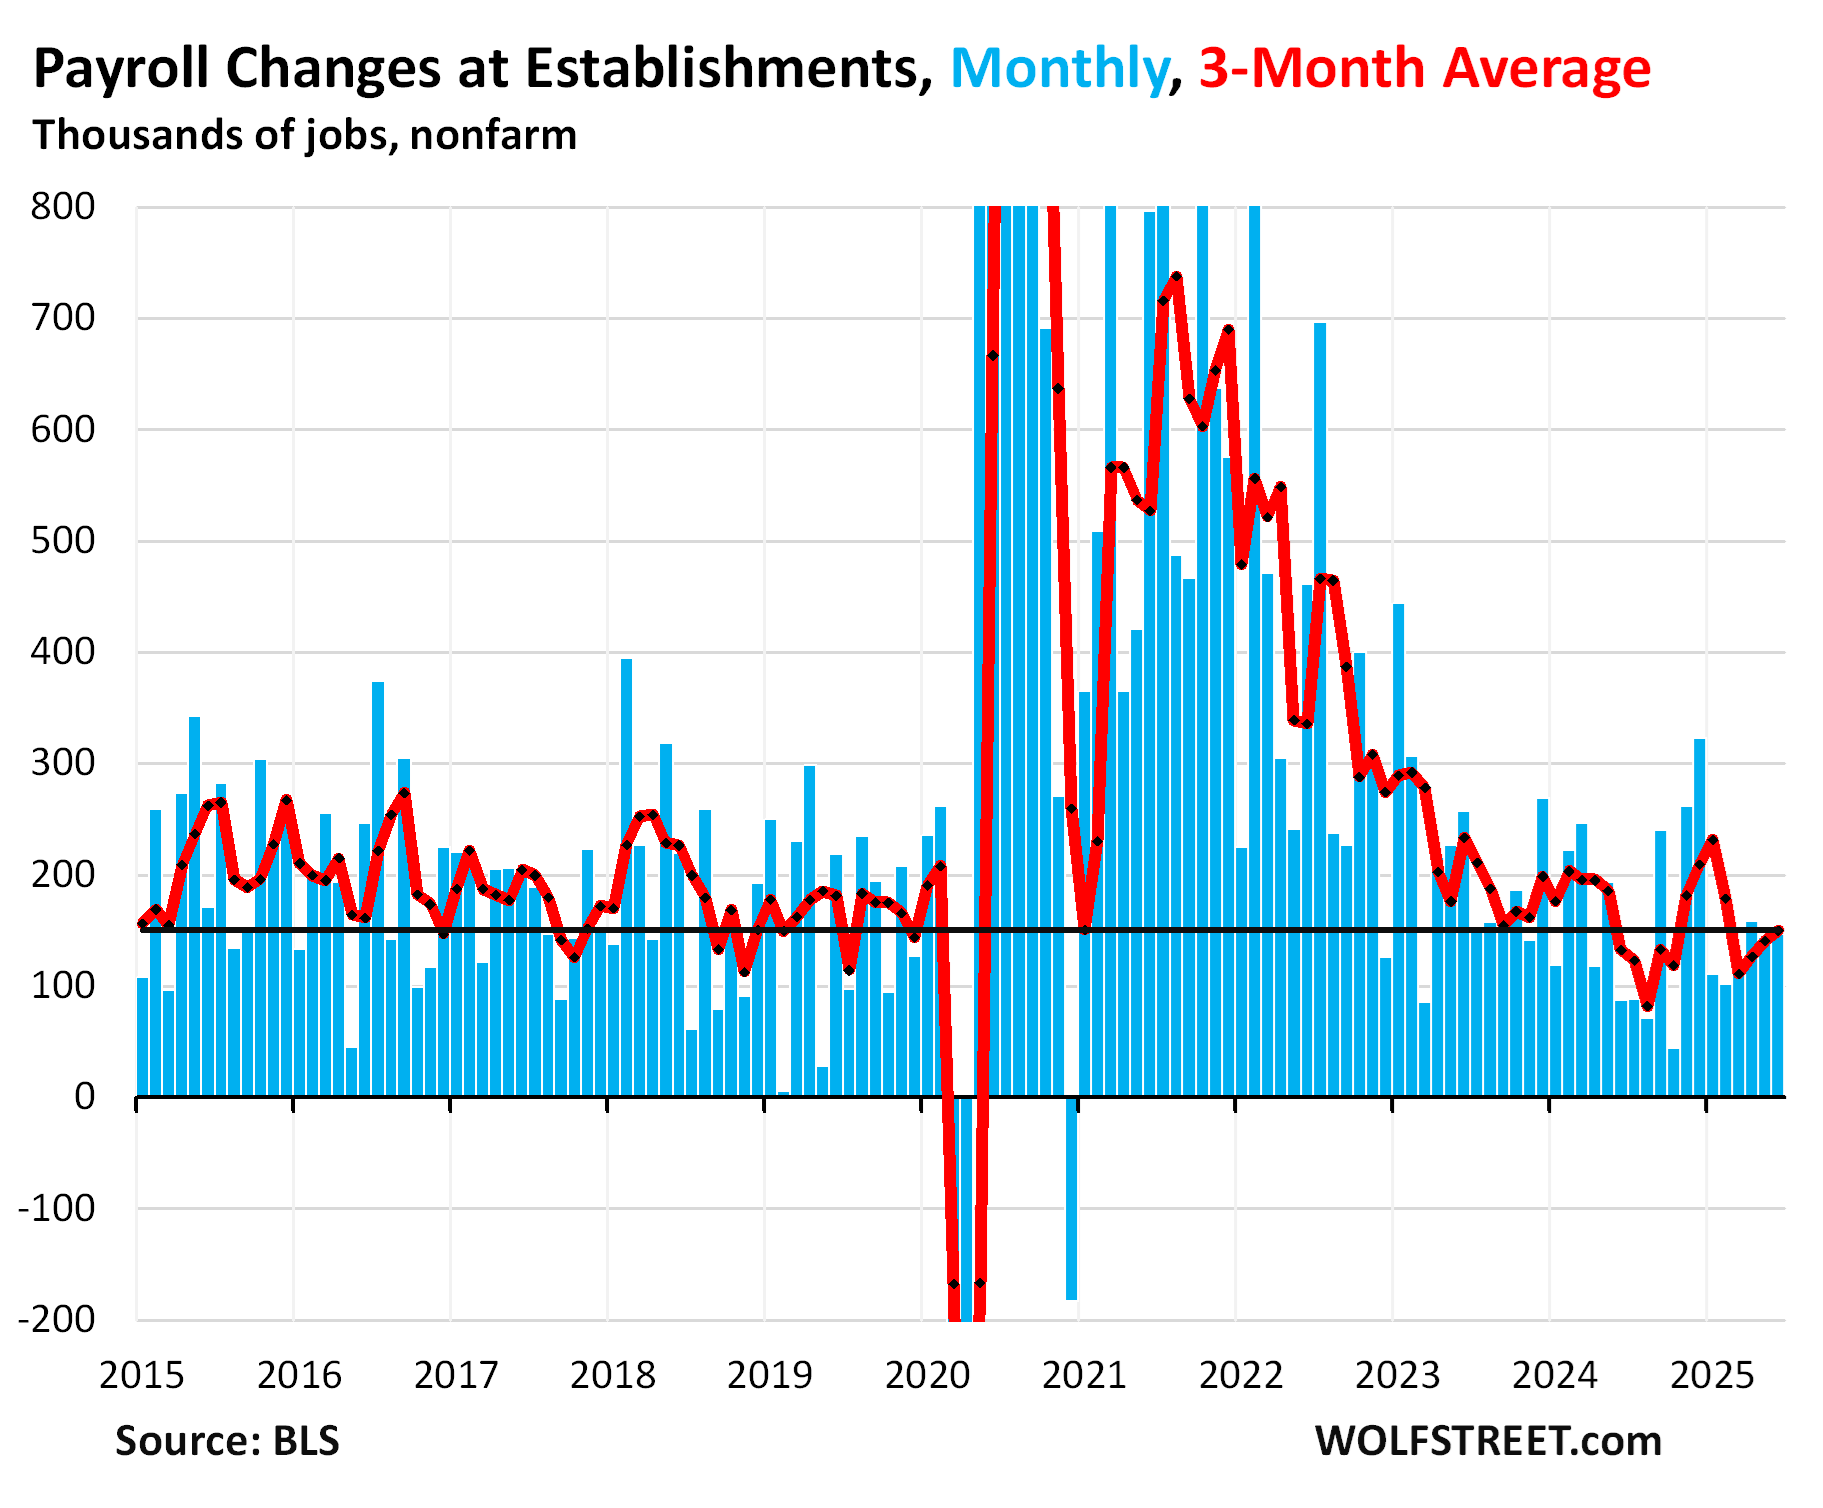
Total nonfarm payrolls rose by 147,000 in June, to 159.6 million. The prior two months were revised higher, as per the Bureau of Labor Statistics today. The low point was in October 2024 at 44,000 jobs created, followed by two very strong months in November and December, that helped squash the Fed’s urge for further rate cuts (blue in the chart).
The three-month average, which irons out some of the month-to-month squiggles and includes the revisions, rose by 150,000, the third month in a row of acceleration. The low point was in August 2024 at 84,000 jobs created, upon which the Fed cut its policy rates by 50 basis points in September (red line in the chart).
The increases of 147,000 new jobs in June and of 150,000 in the three-month average are near the 12-month average increase of 151,000 and are fine. The job creation machine is running at a decent pace. In a moment, we’ll look at jobs by major industry with charts to see how employment evolved over time; there are winners and losers, for sure.
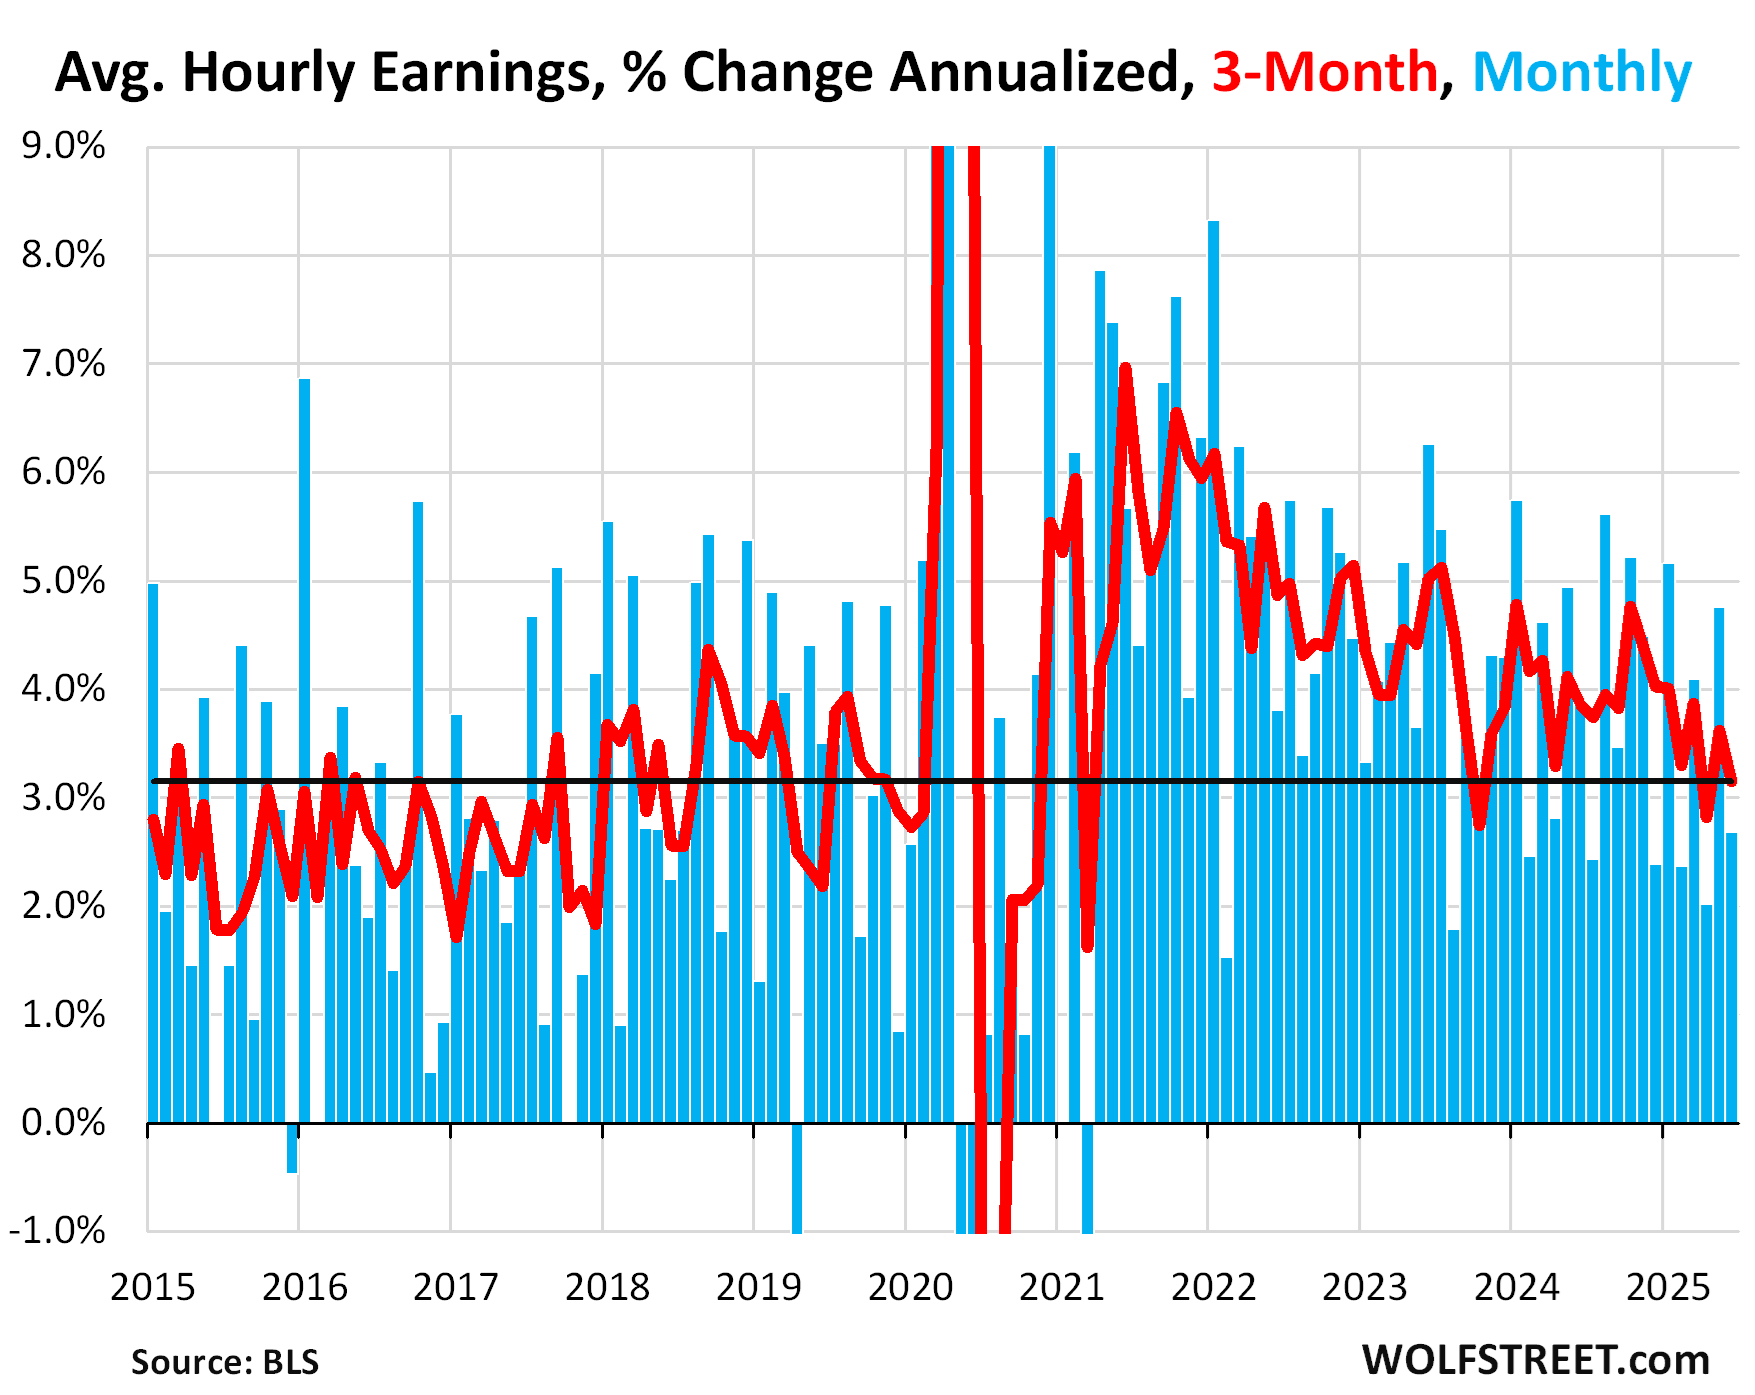
Average hourly earnings rose by 0.22% in June from May (+2.7% annualized), after the 0.39% jump in May.
The three-month average growth decelerated to +3.1% annualized.
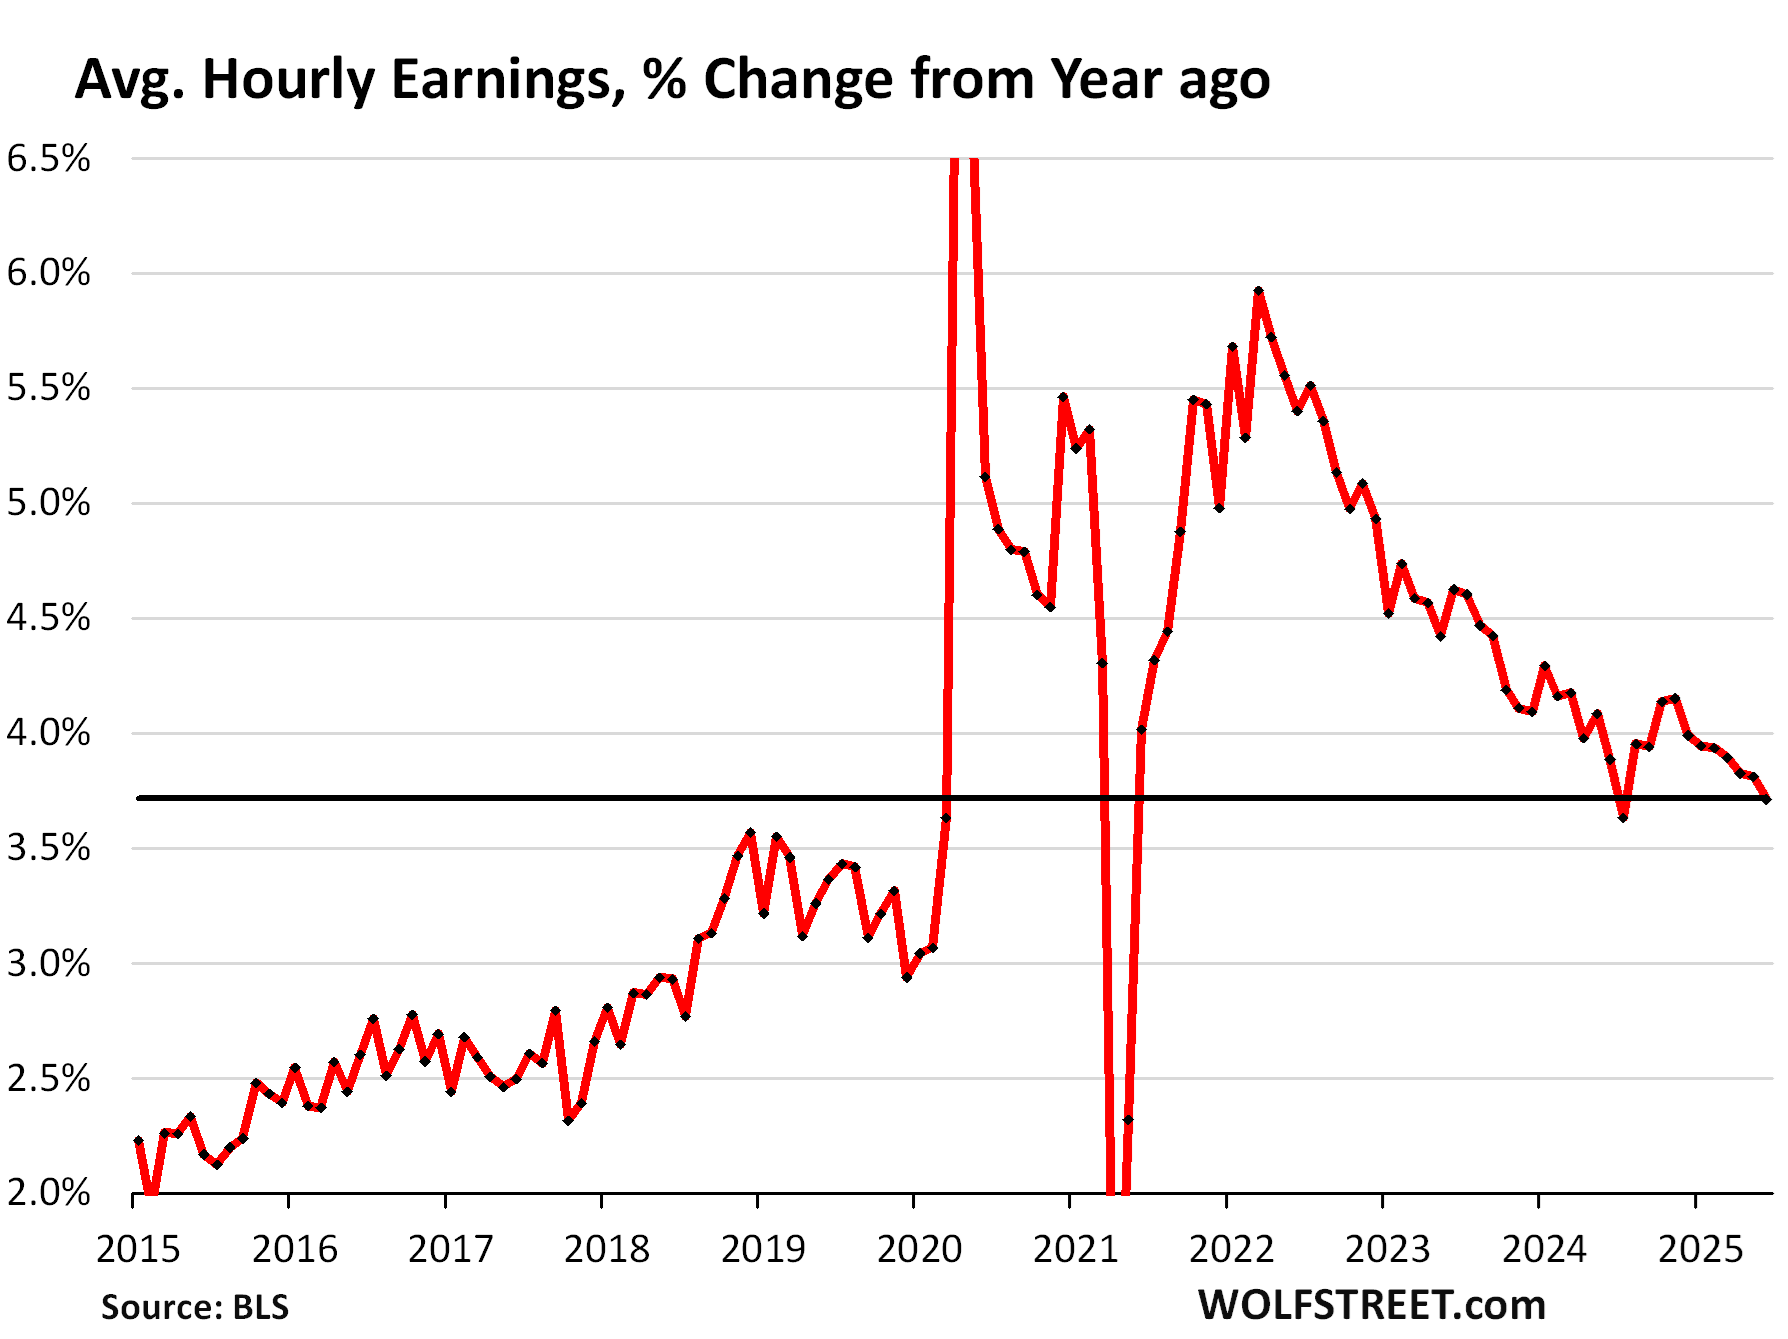
Year-over-year, average hourly earnings rose by 3.7% in June, a deceleration from May, and still well above the wage growth before the pandemic.
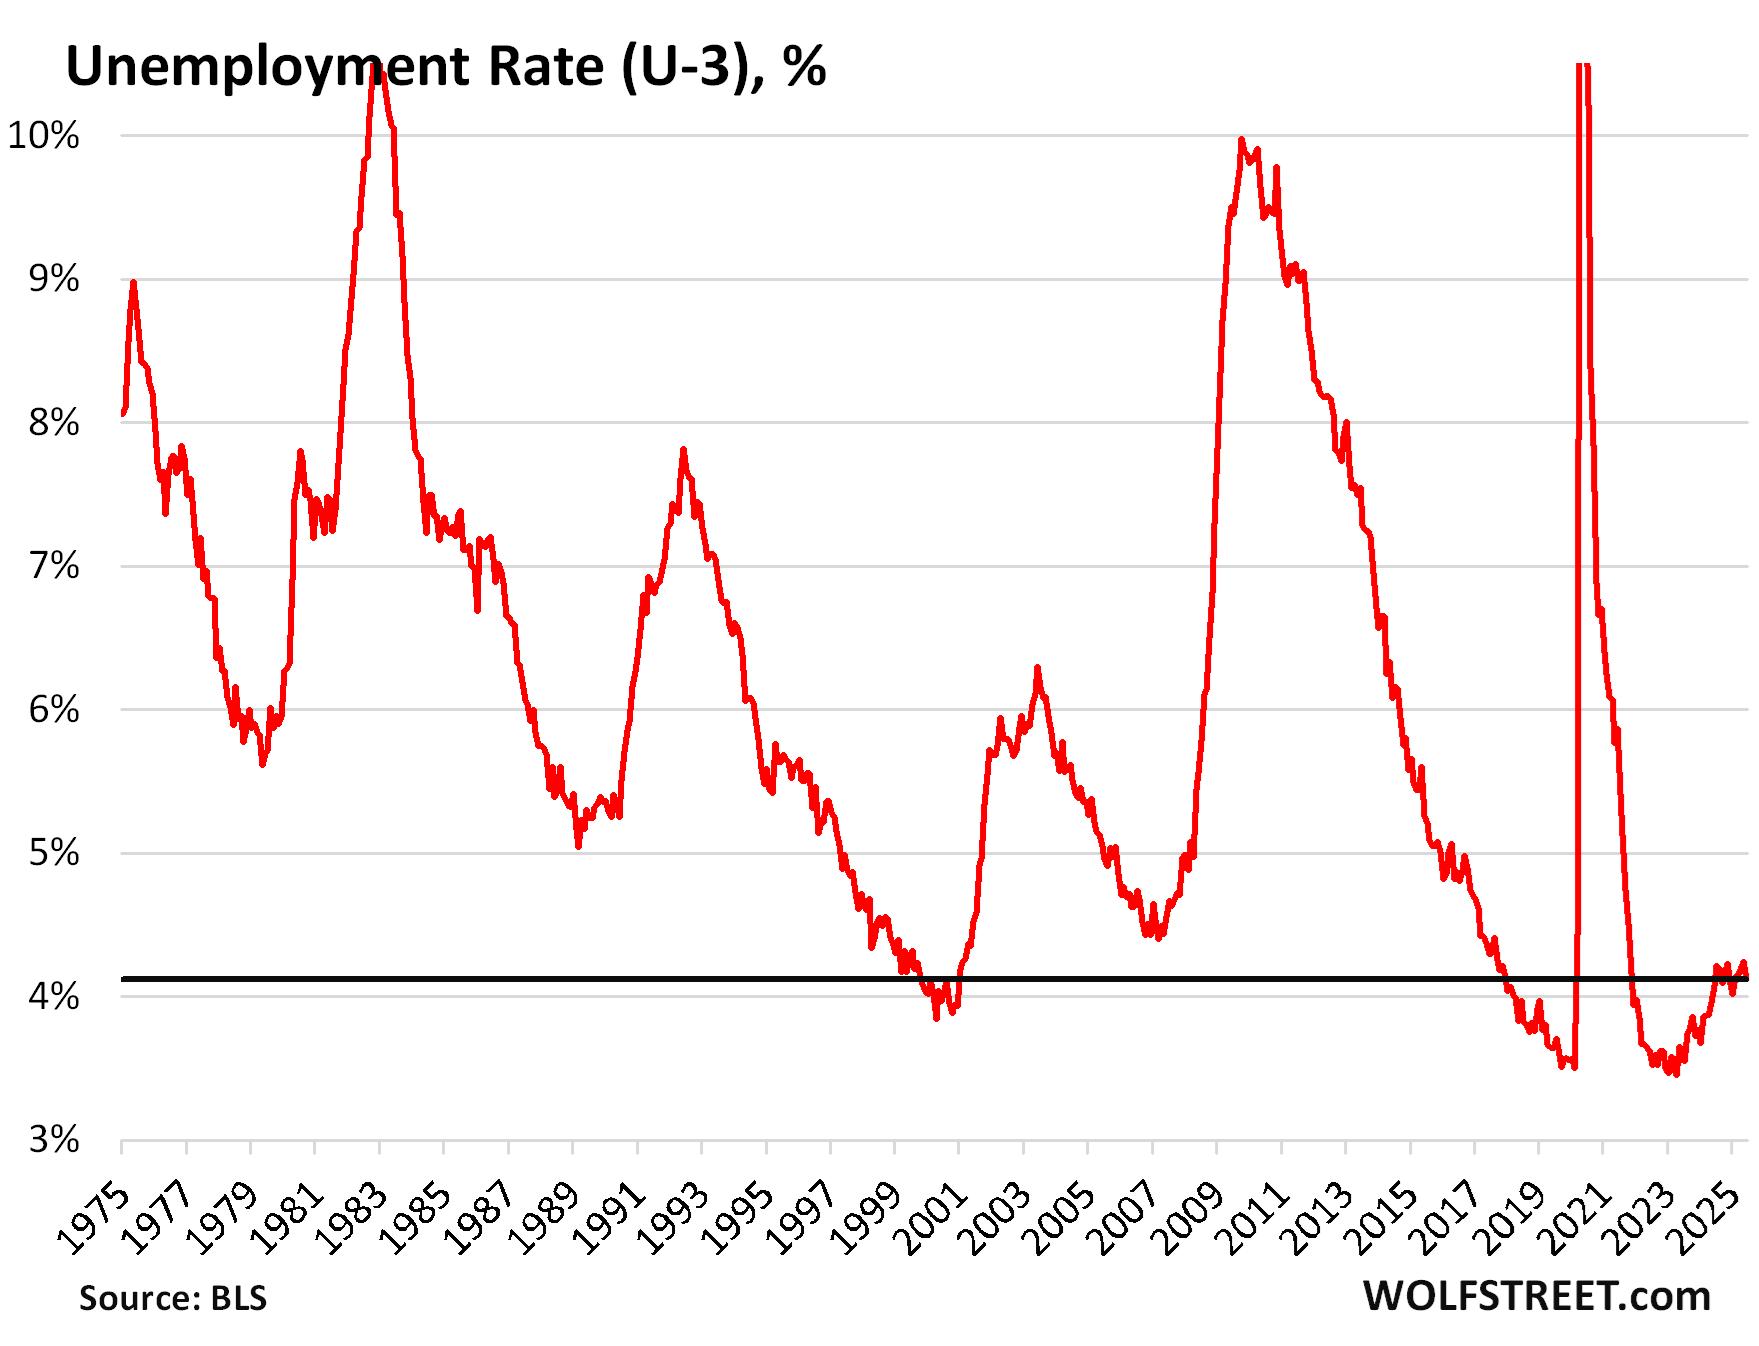
Unemployment fell by 222,000 in June to 7.01 million people who were actively looking for a job during the survey period.
The headline unemployment rate (U-3) declined to 4.1% in June. For the past 13 months, the unemployment rate has stabilized at the historically low range of 4.0% to 4.2%.
The unemployment rate reflects the number of unemployed people who are actively looking for a job (7.01 million) divided by the labor force (people working or looking for a job, 170.4 million). The rate dipped to 4.1% in June because the number of unemployed people fell and because the labor force dipped.
This unemployment rate of 4.1% points at a solid balanced labor market. The Fed’s median projections of the unemployment rate have been ratcheting higher, at the June meeting to 4.5% for the end of 2025. The actual unemployment rates over the past 12 months of 4.0% to 4.2% have been undershooting the Fed’s projections.
Jobs by Major Industry over time.
The jobs in each industry are defined by work location. The surveys are sent to employer facilities. The primary activity at that facility determines the industry category. For example, a worker at an Amazon fulfillment center would be under “transportation and warehousing,” not “retail.” It’s not the company that matters, but the work being done at that specific location.
The industry categories here are in order of the size of their employment. Some industry categories are very broad, and therefore have a very large number of employees, such as “Professional and business services,” while others are narrower and therefore have far fewer employees, such as “Manufacturing,” which includes only employees at manufacturing plants.
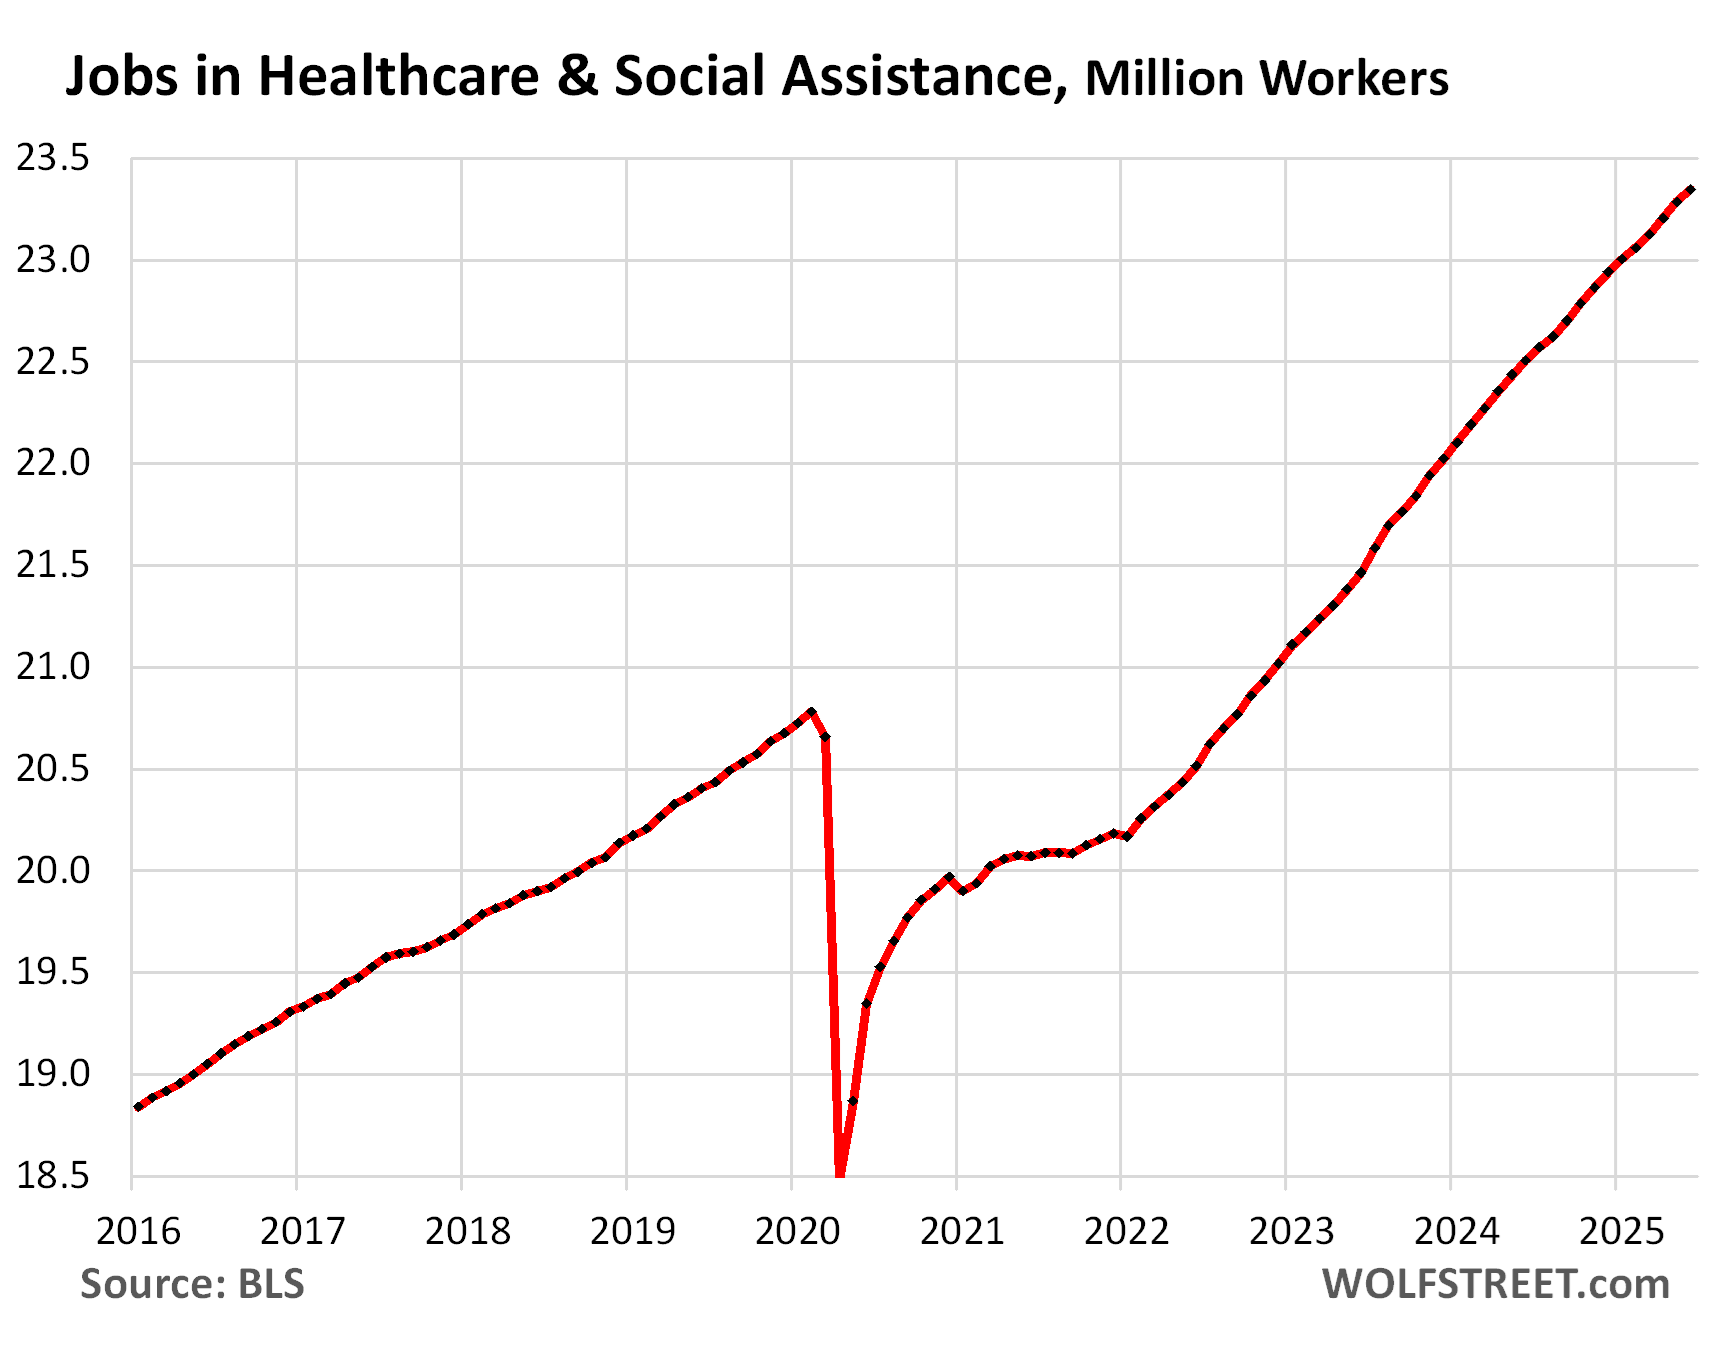
Healthcare and social assistance:
- Total employment: 23.34 million, new high
- 3-month average growth: +73,000
State and local governments: A large part of employment here is in education, from preschool to state universities, and in healthcare. First responders and law enforcement are also large components.
- Total employment: 22.75 million
- 3-month average growth: +50,000
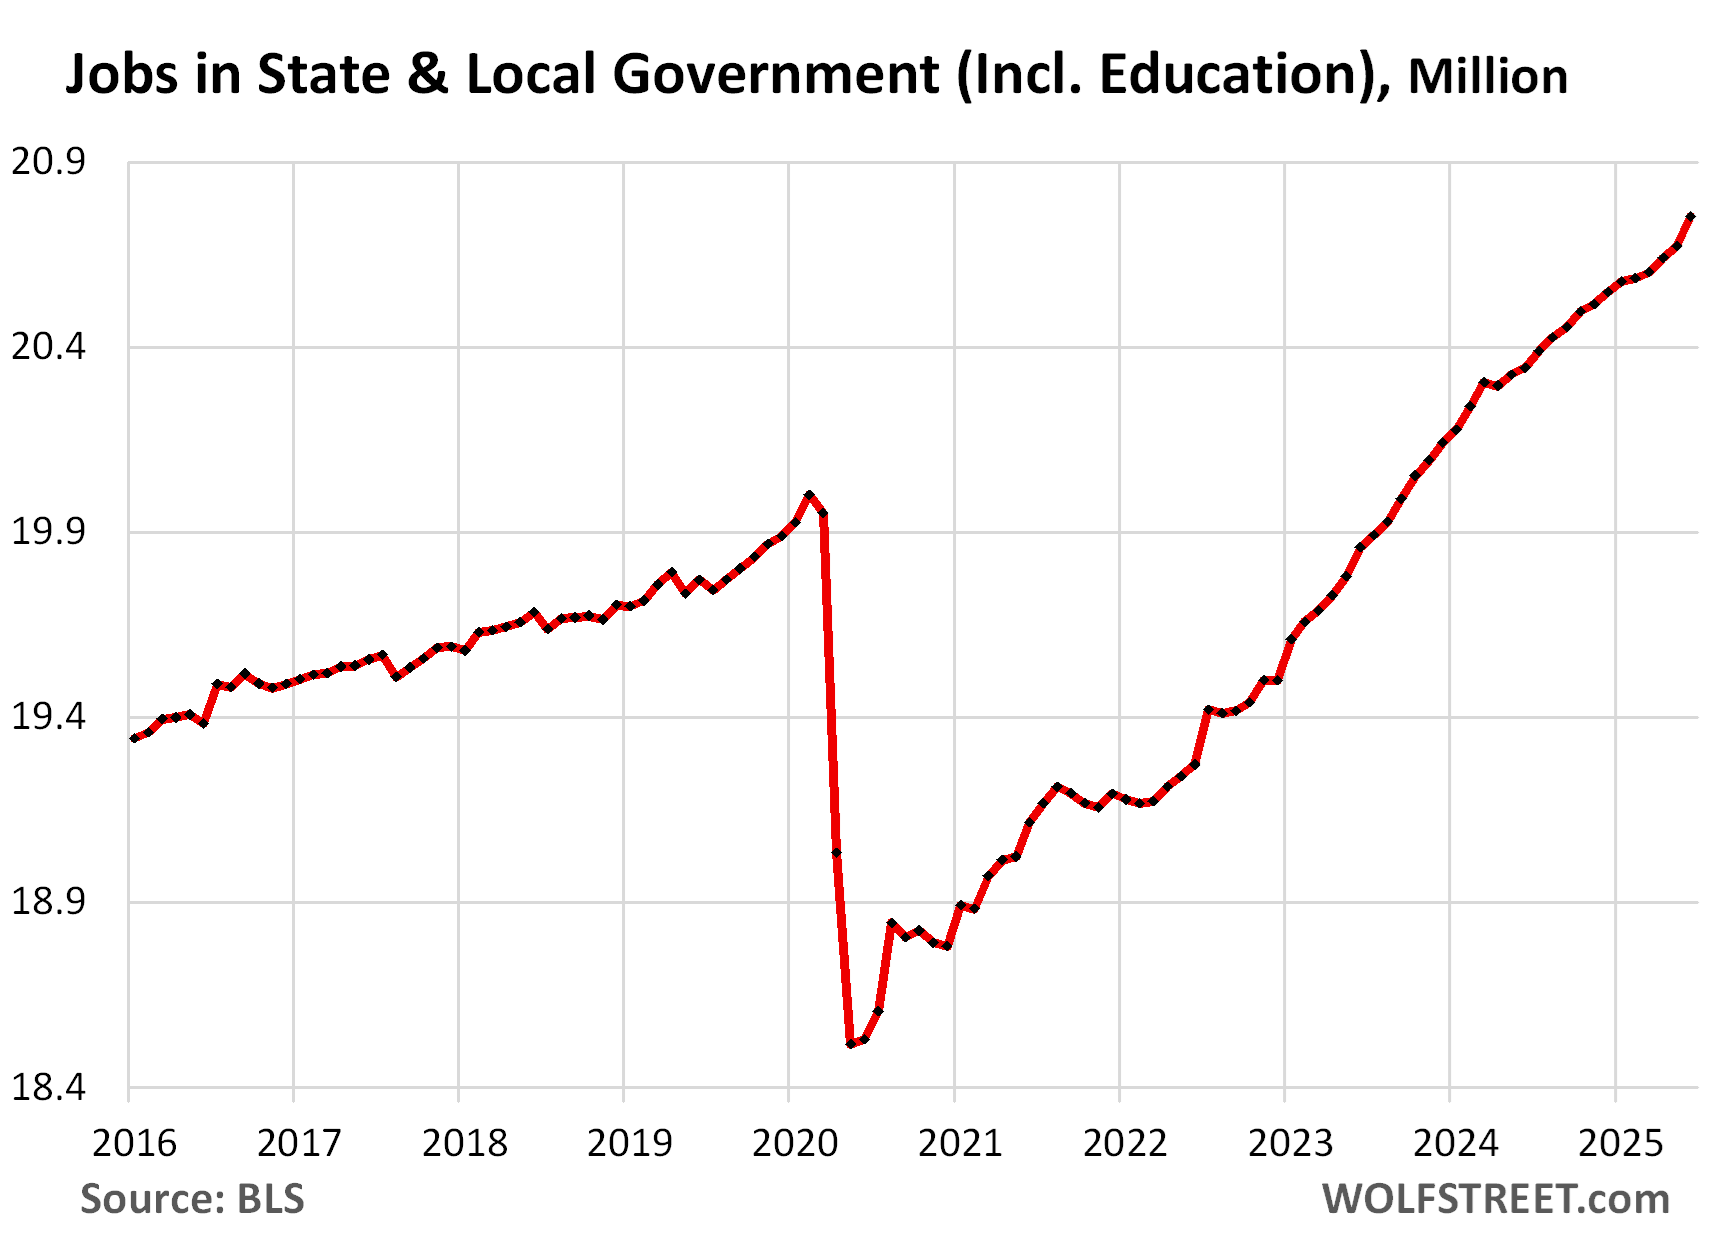
State and local government jobs in relationship to total nonfarm payrolls: Governments tend not to lay off their teachers, college professors, police officers, and firefighters during a recession. So when private employment collapsed in 2020 during the lockdown, while governments retained their employees, the share of government employment to total nonfarm payrolls briefly spiked.
In June, the share rose to 13%, but that was still far lower than in the decades before the pandemic.

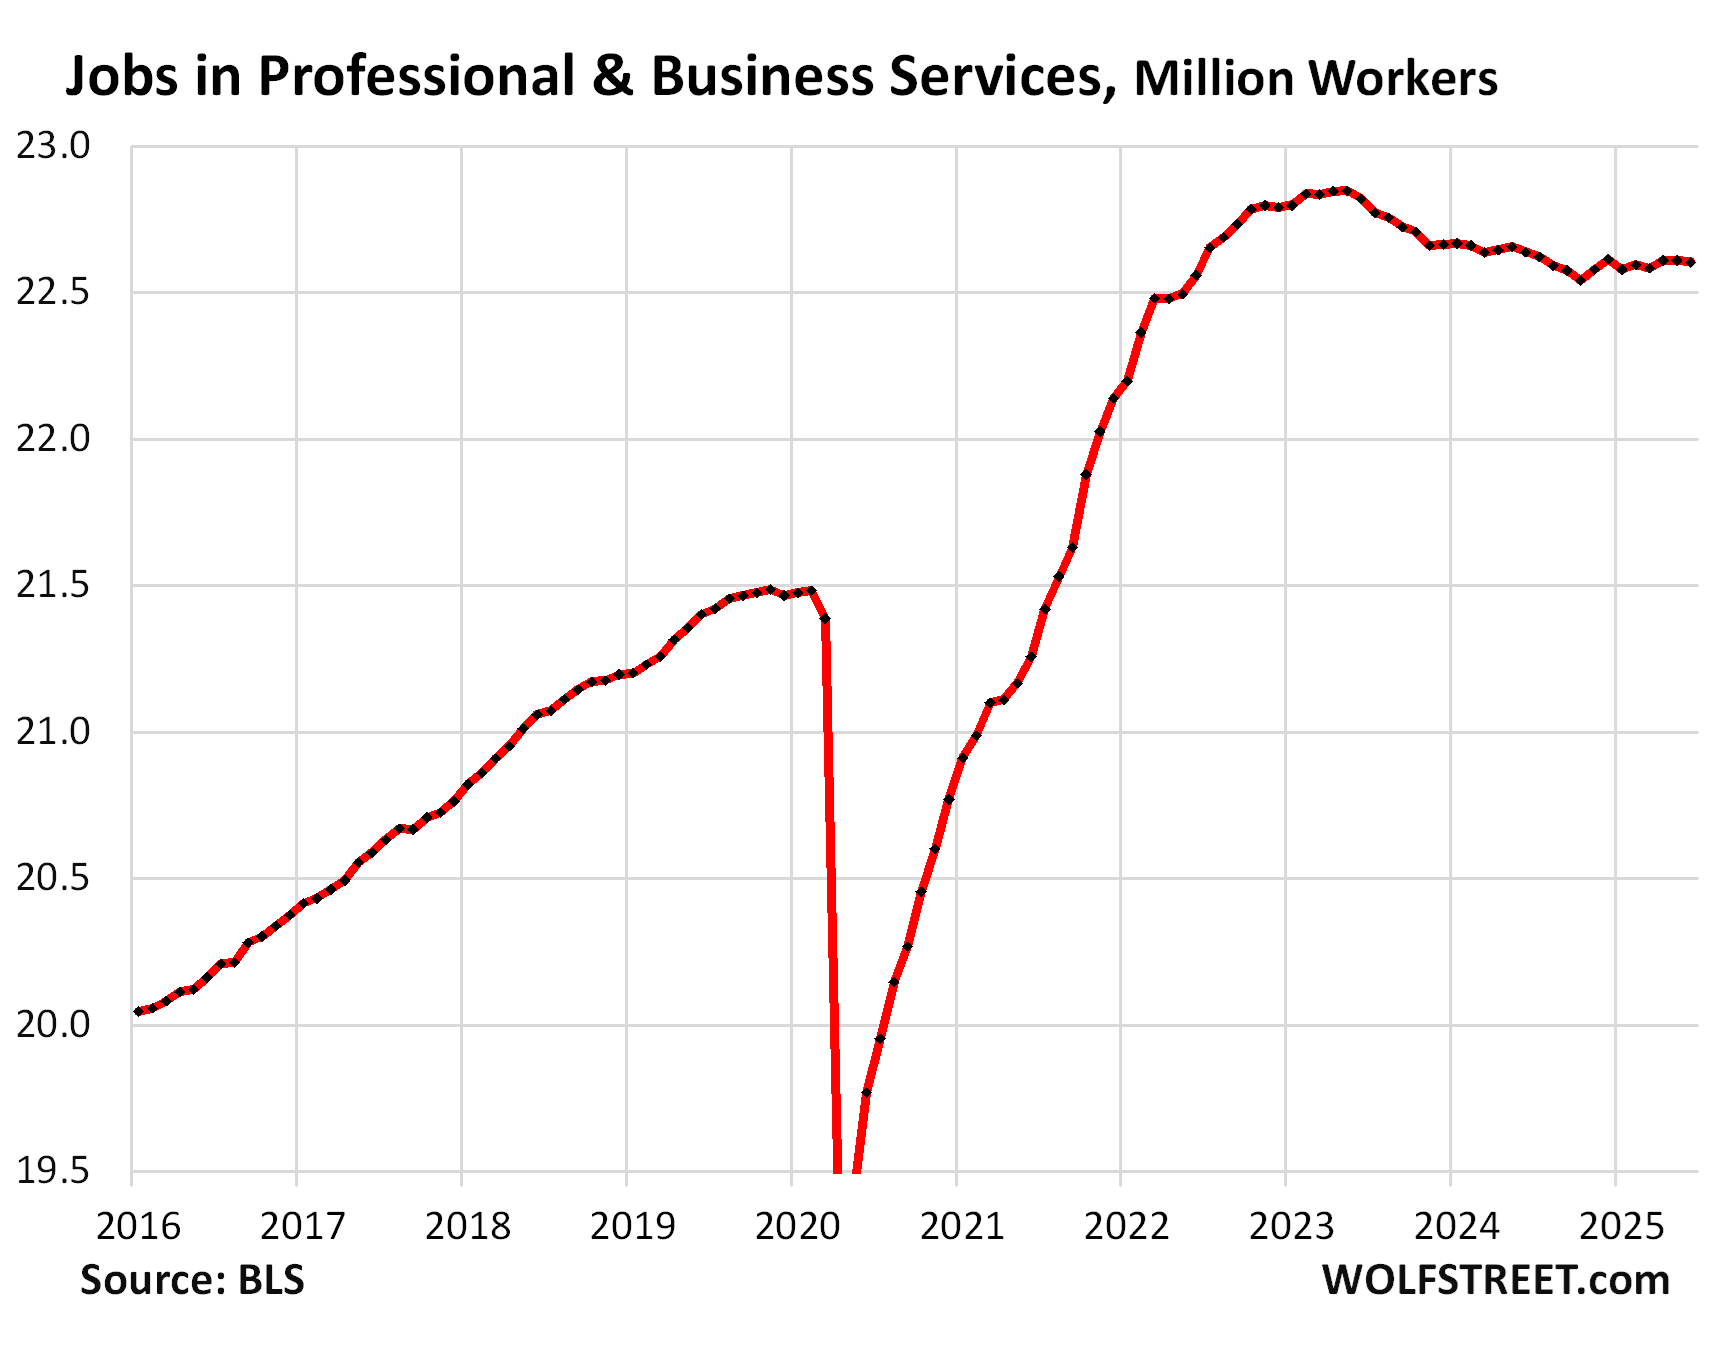
Professional and business services: includes facilities whose employees work primarily in Professional, Scientific, and Technical Services; Management of Companies and Enterprises; Administrative and Support, and Waste Management and Remediation Services.
It includes jobs in tech and social media.
The explosion of employment in 2021 and 2022 turned out to be a bout of massive over-hiring. Companies then came to their senses and began shedding the excess they’d added over those years. Those efforts apparently bottomed out in October 2024, and since then employment has wobbled higher.
- Total employment: 22.6 million
- 3-month average growth: +7,000
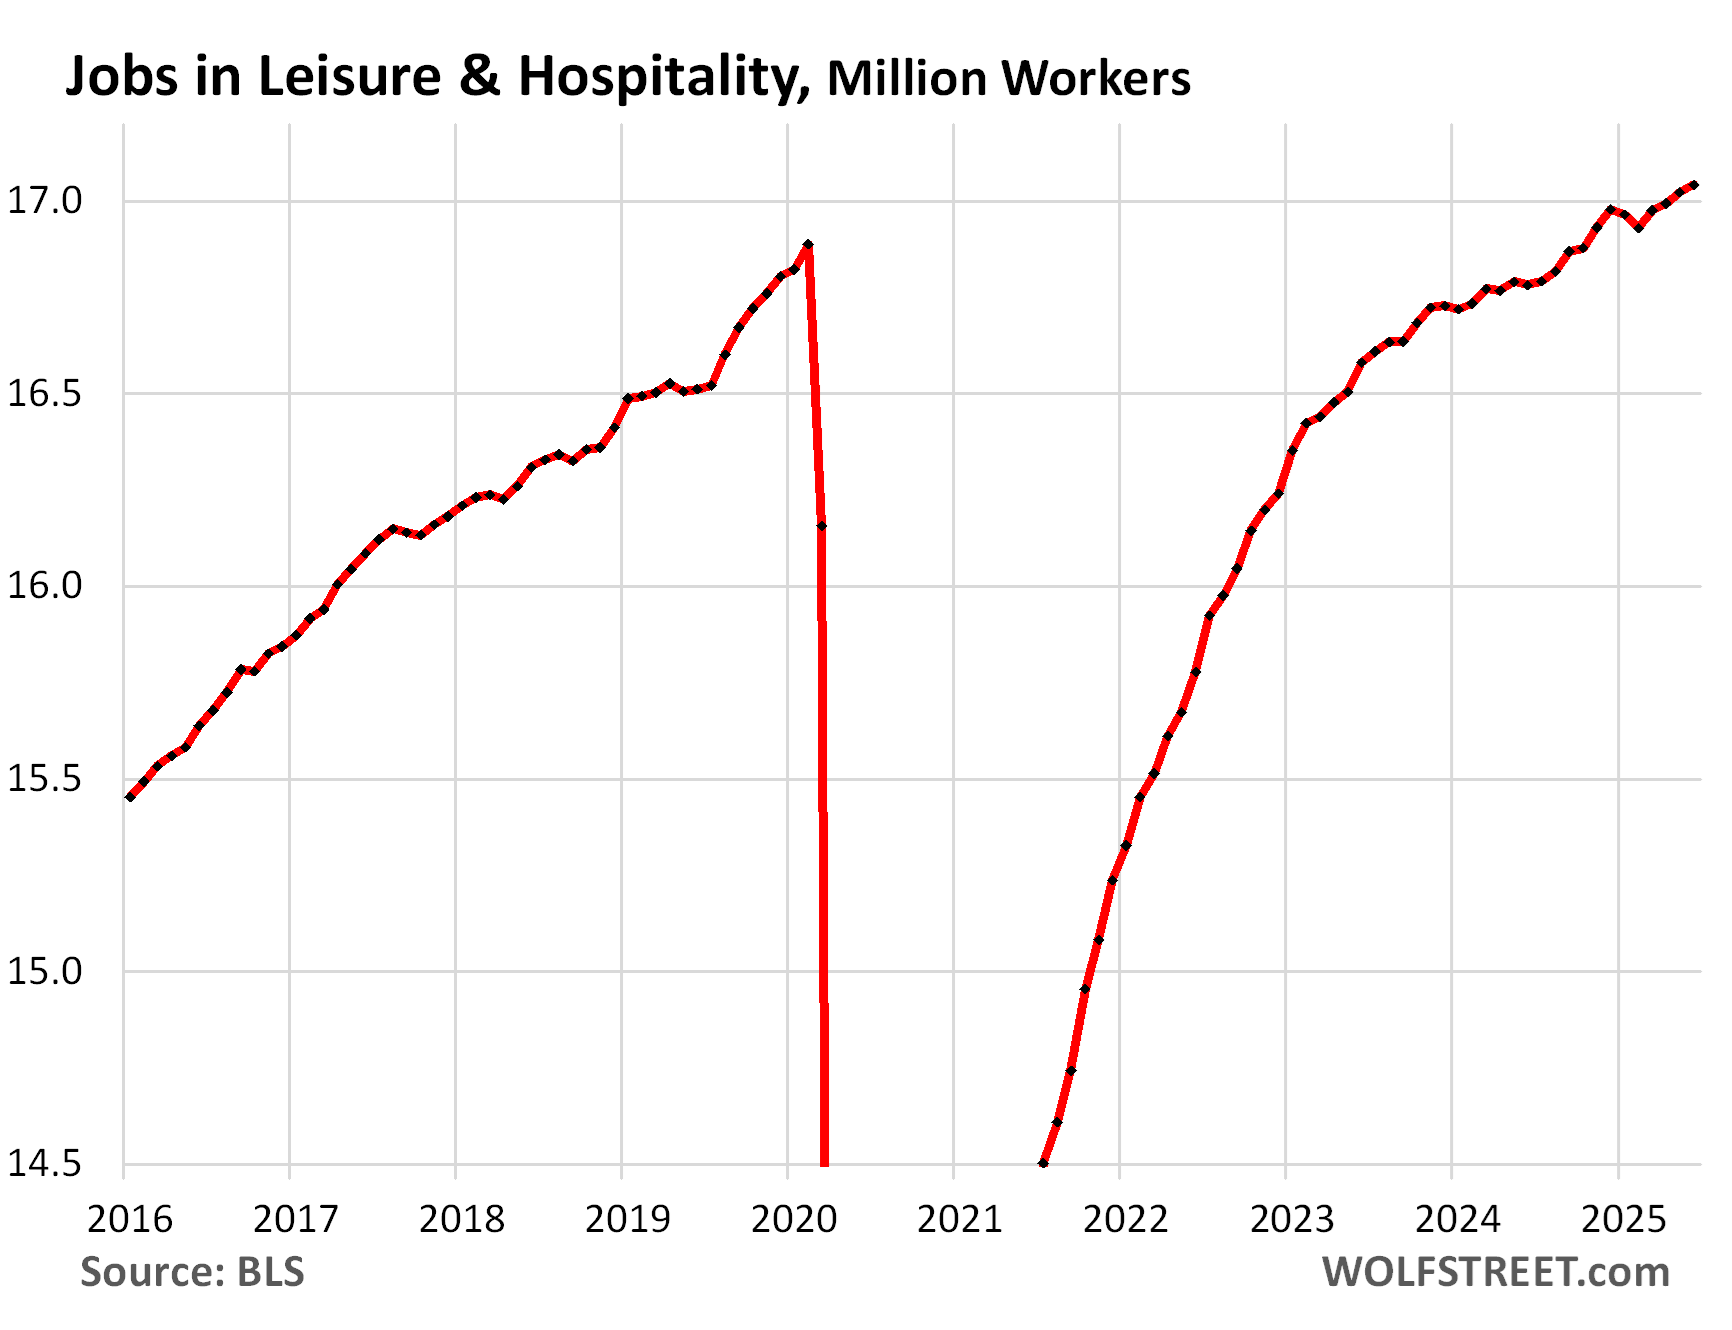
Leisure and hospitality – restaurants, lodging, resorts, etc. After getting essentially shut down during the lockdowns, the industry’s employment has fully recovered but is only marginally higher than it was five years ago:
- Total employment: 17.0 million, new record.
- 3-month average growth: +22,000
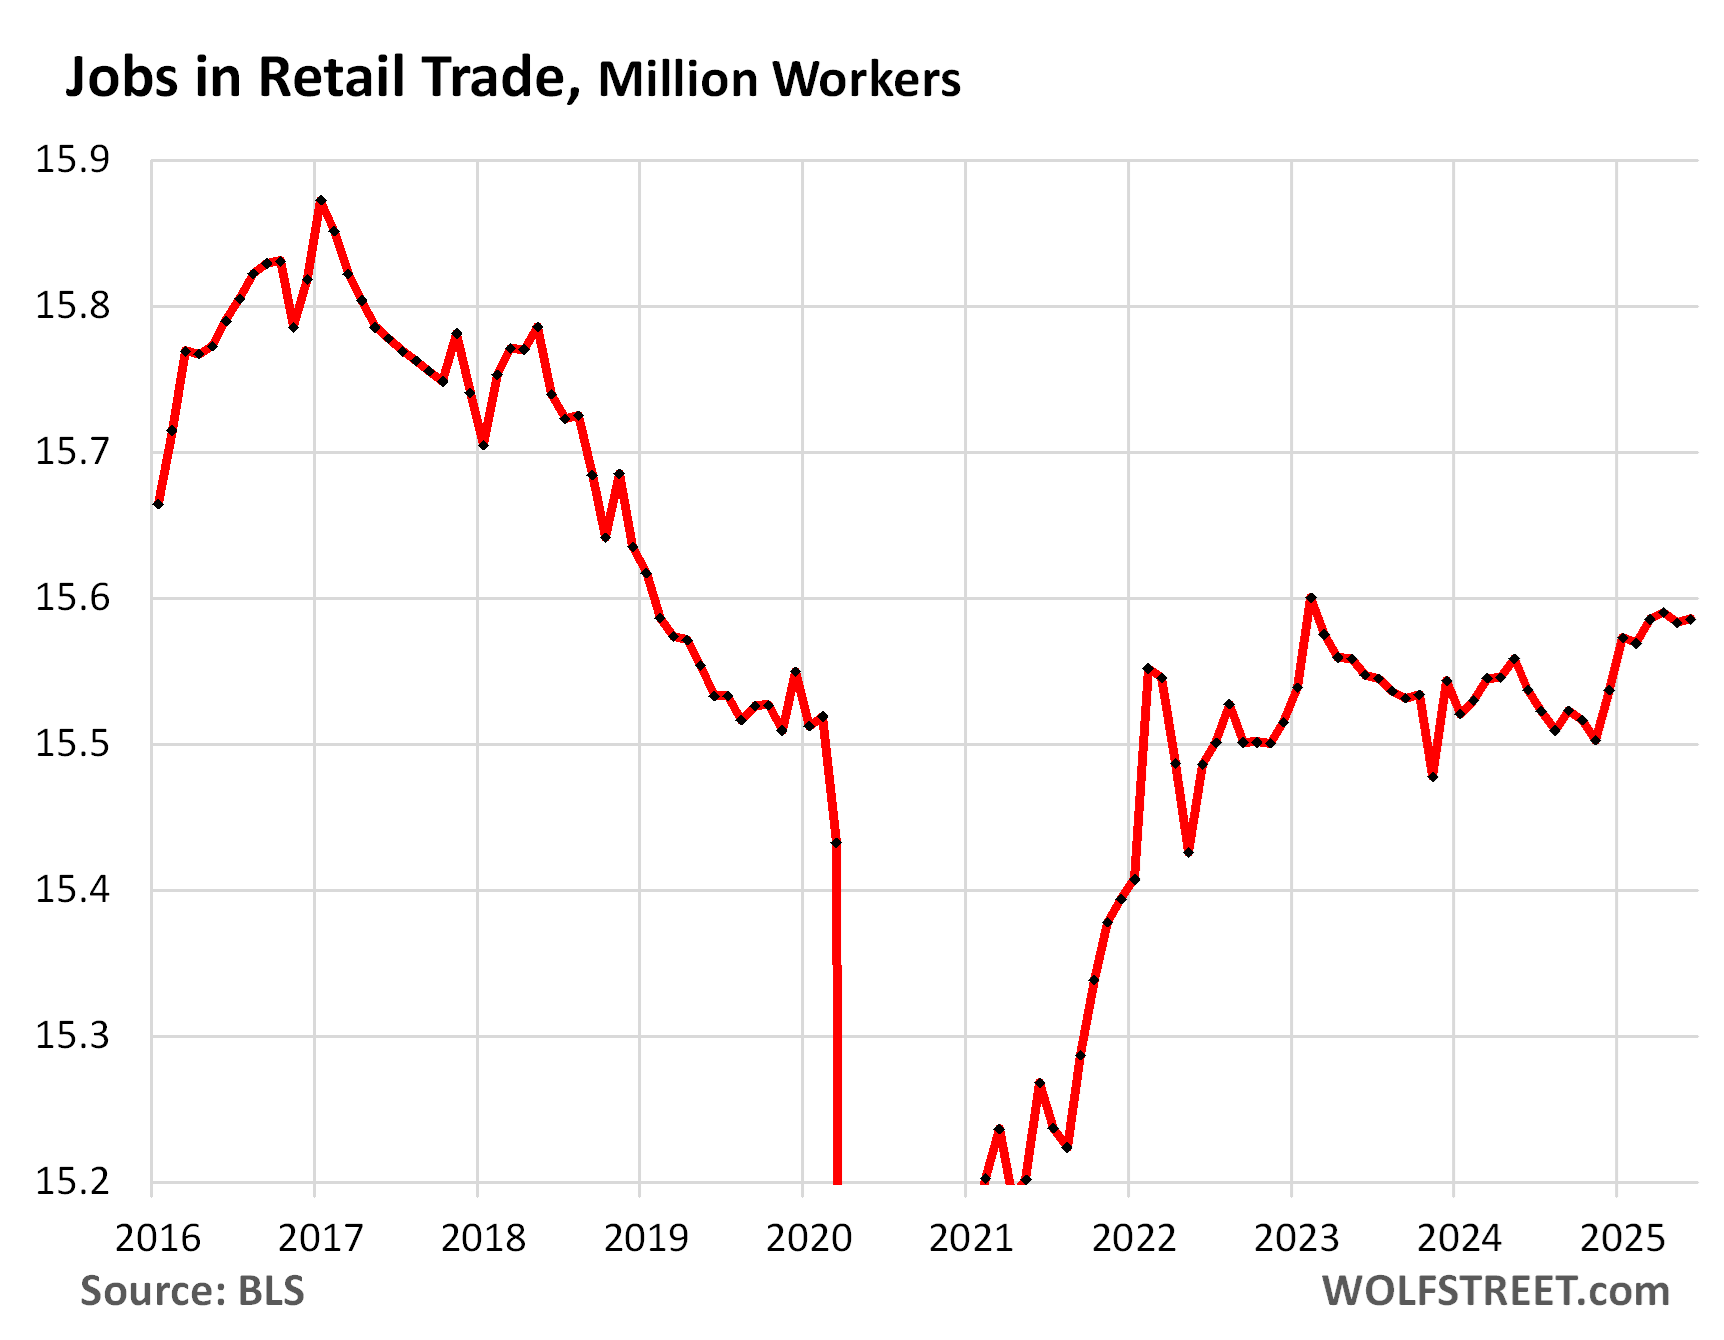
Retail trade counts workers at brick-and-mortar retail stores, such as malls, auto dealers, grocery stores, gas stations, etc., and other retail locations such as markets. It does not include the tech-related jobs of ecommerce operations, drivers, and warehouse employees.
A big portion of this sector has been under pressure from ecommerce, and dozens of major retailers have been liquidated in bankruptcy court, some of which we have documented since 2016 in our Brick-and-Mortar Meltdown series. As the chart shows: in 2017, employment began the long-term decline.
However, the brick-and-mortar retailers that are doing well are those that are selling groceries, motor vehicles, gasoline, and others that are not under pressure from ecommerce.
- Total employment: 15.59 million
- 3-month average growth: 0.
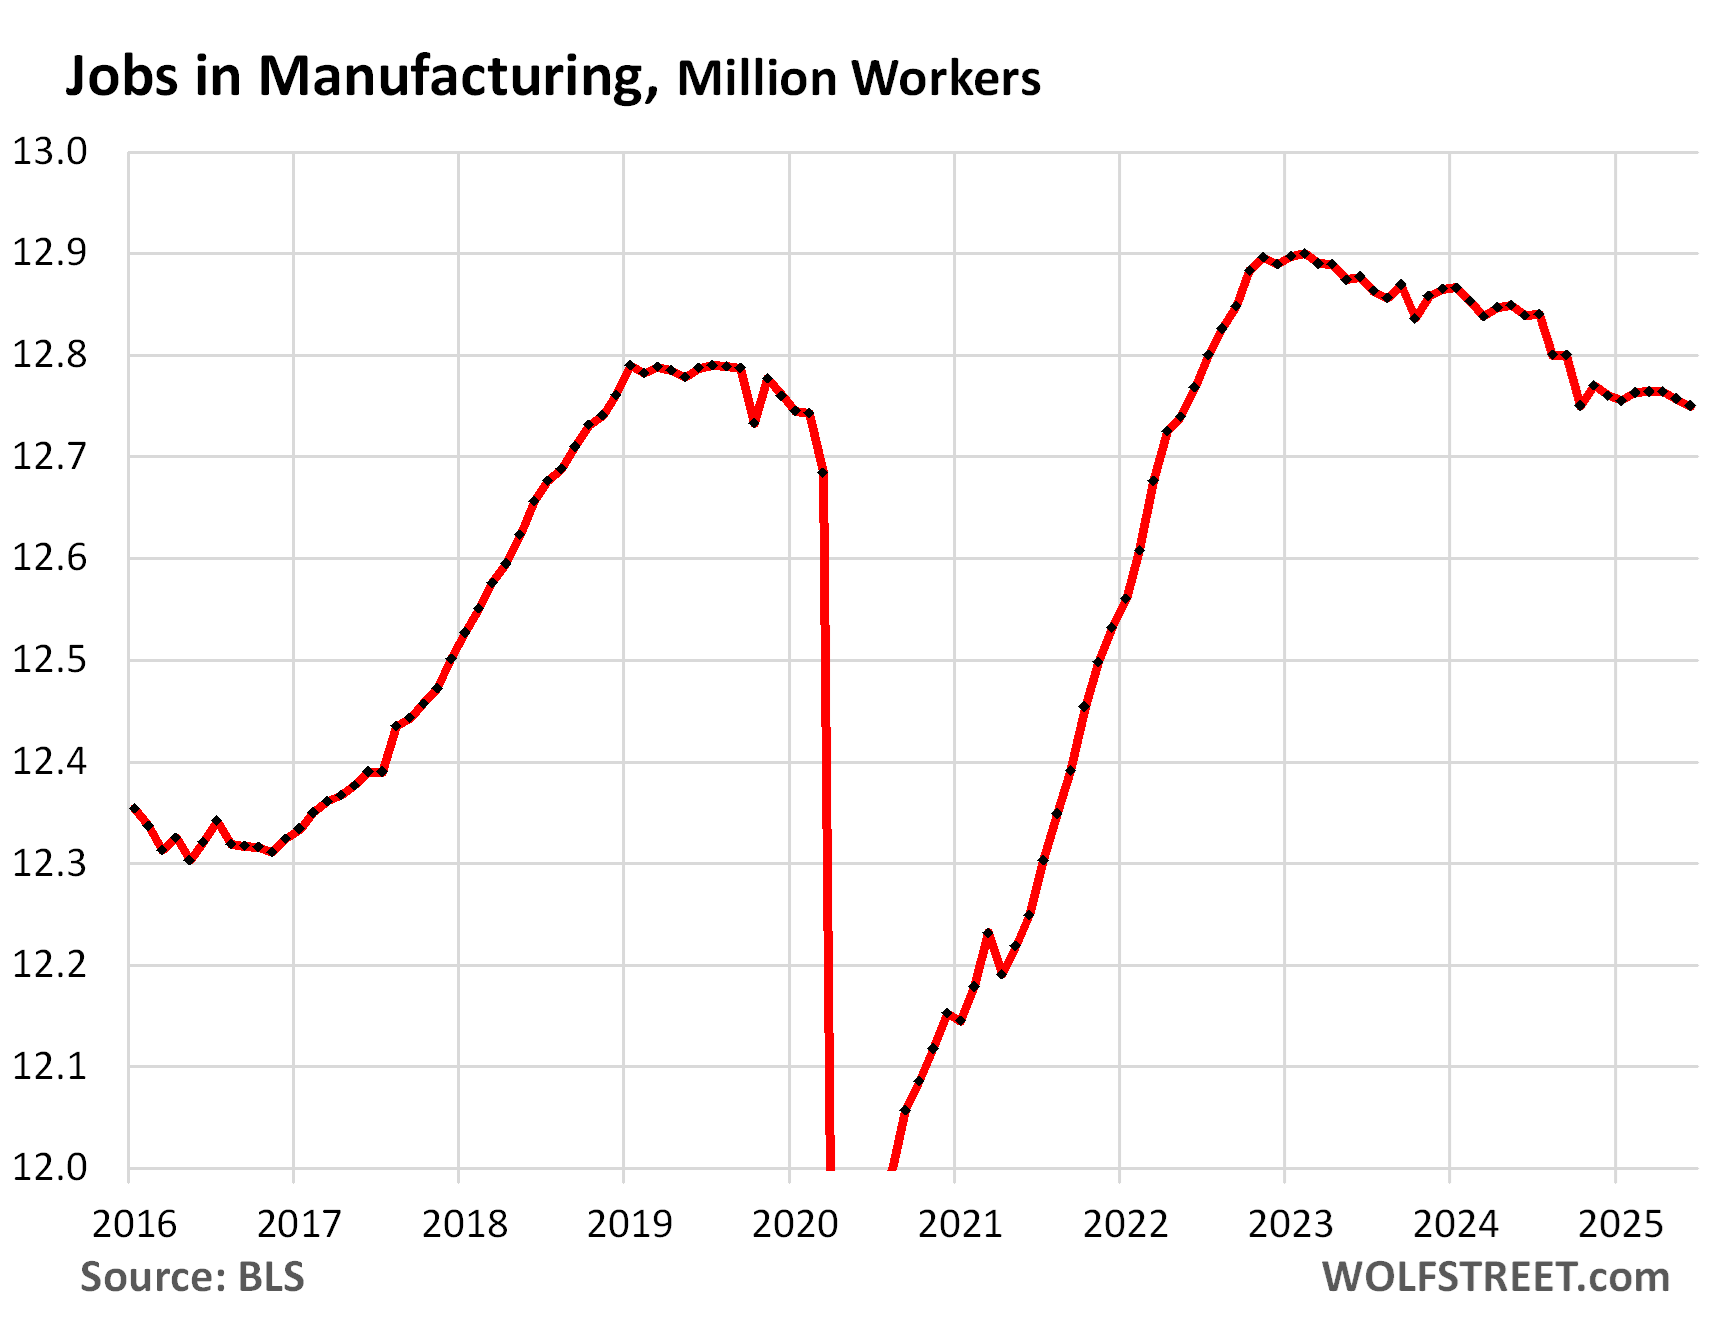
Manufacturing: Automation drives manufacturing in the US. All new plants in the US are heavily automated. They still create jobs, but not a lot of jobs that do repetitive manual labor. Manufacturing jobs often require a high skill level and include tech jobs.
After a surge out of the pandemic, including a bout of over-hiring during the labor shortages, employment plateaued and then tapered off.
- Total employment: 12.75 million
- 3-month average growth: -5,000
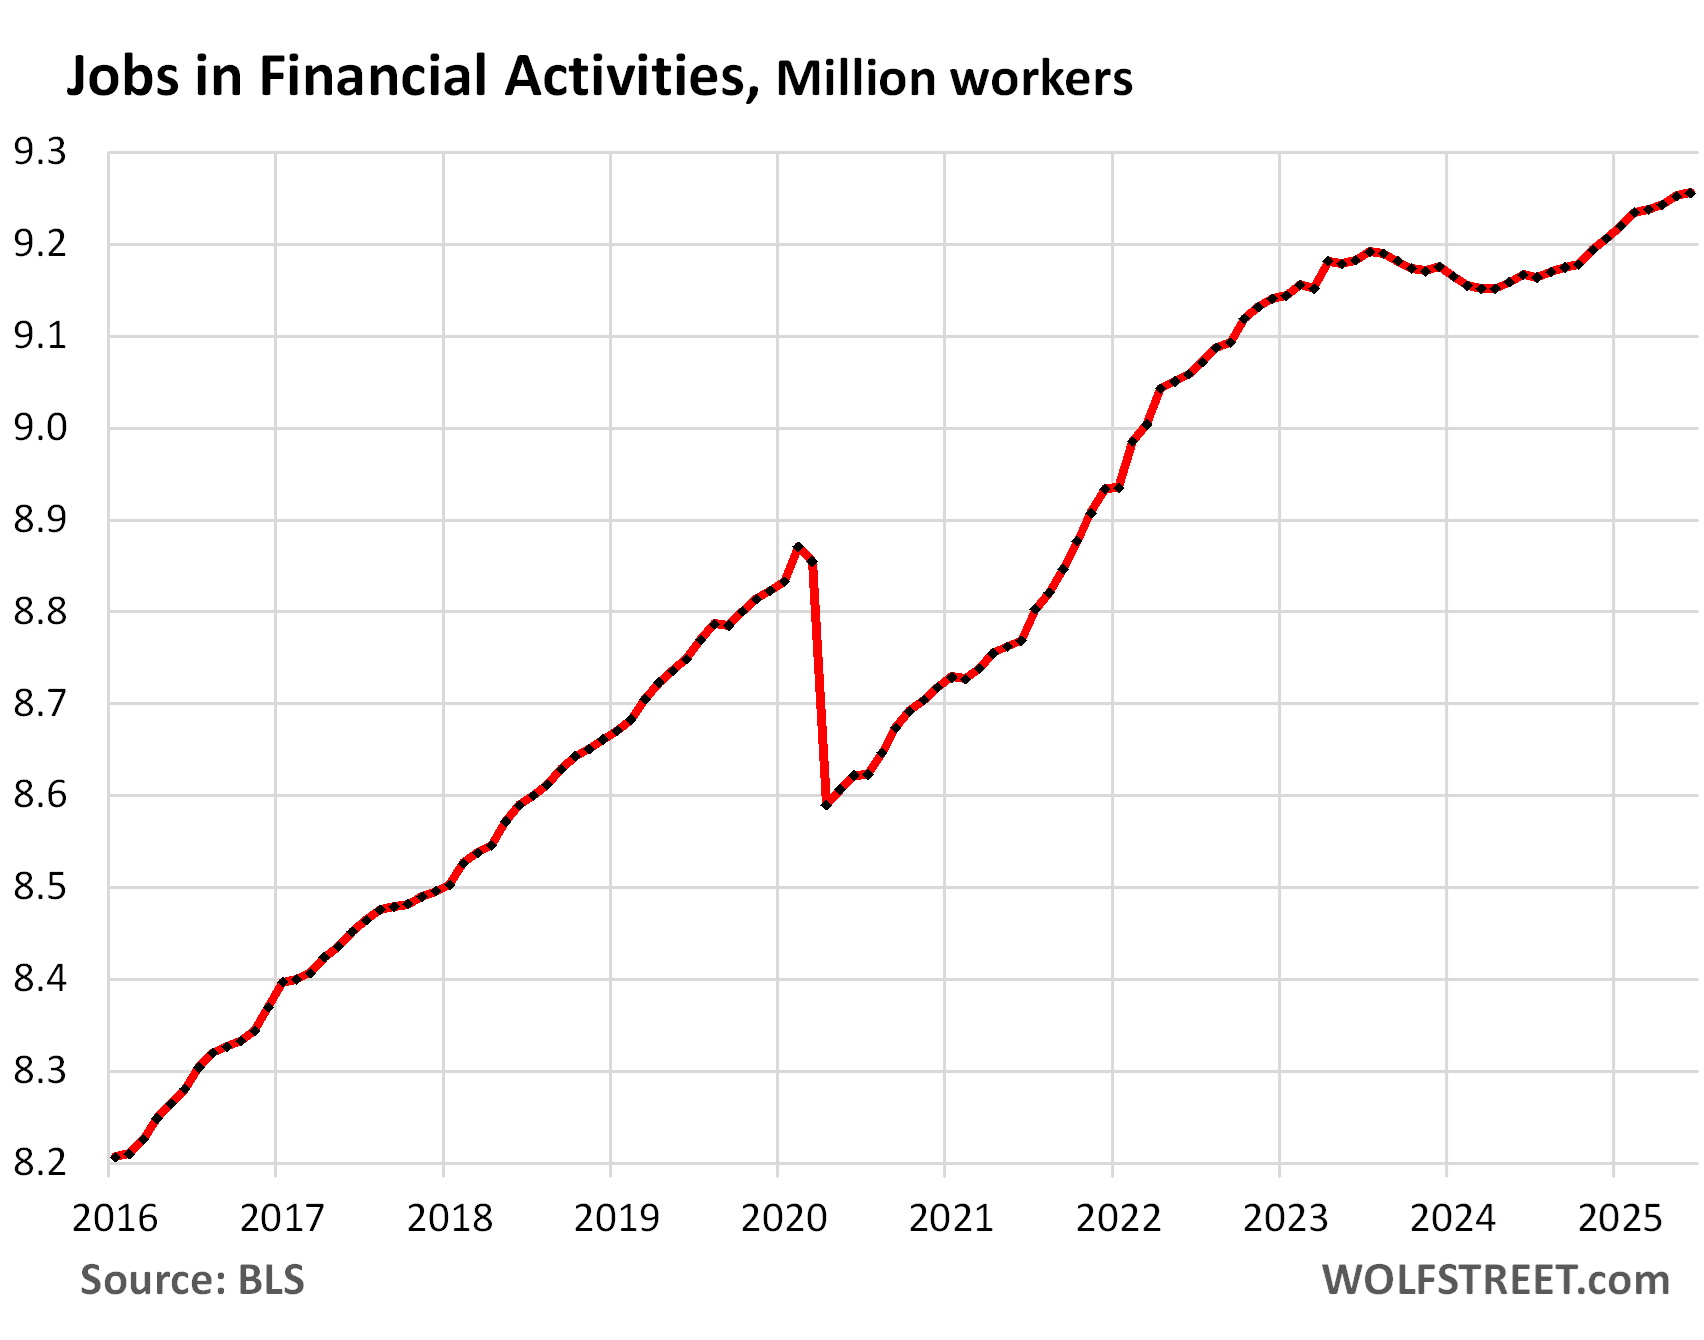
Financial activities (finance and insurance plus real estate renting, leasing, buying, selling, and management).
- Total employment: 9.26 million, new record
- 3-month average growth: +6,000
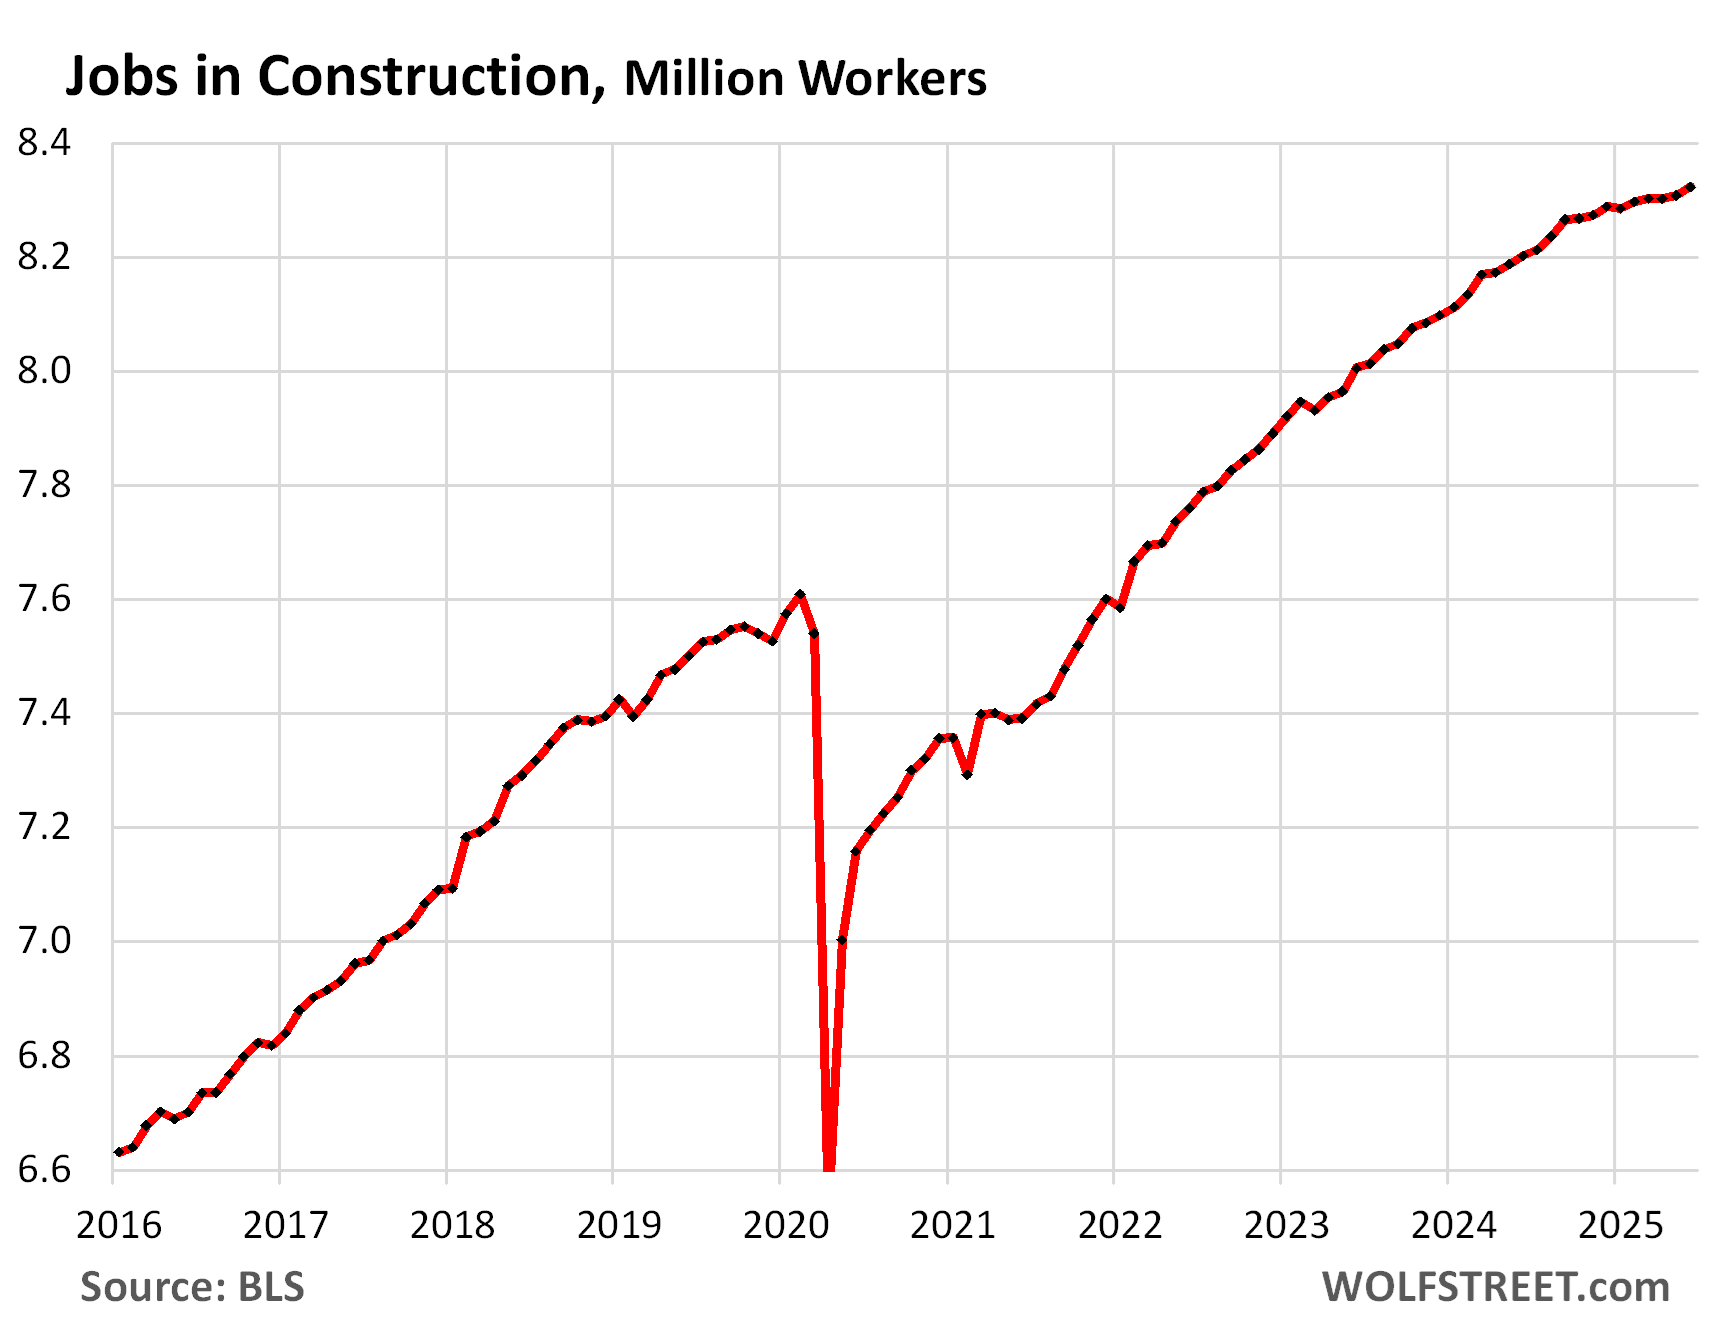
Construction (all types, from single-family housing to highways):
- Total employment: 8.32 million, new record
- 3-month average growth: +7,000
Transportation and Warehousing:
- Total employment: 6.75 million
- 3-month average growth: +1,000
![]()
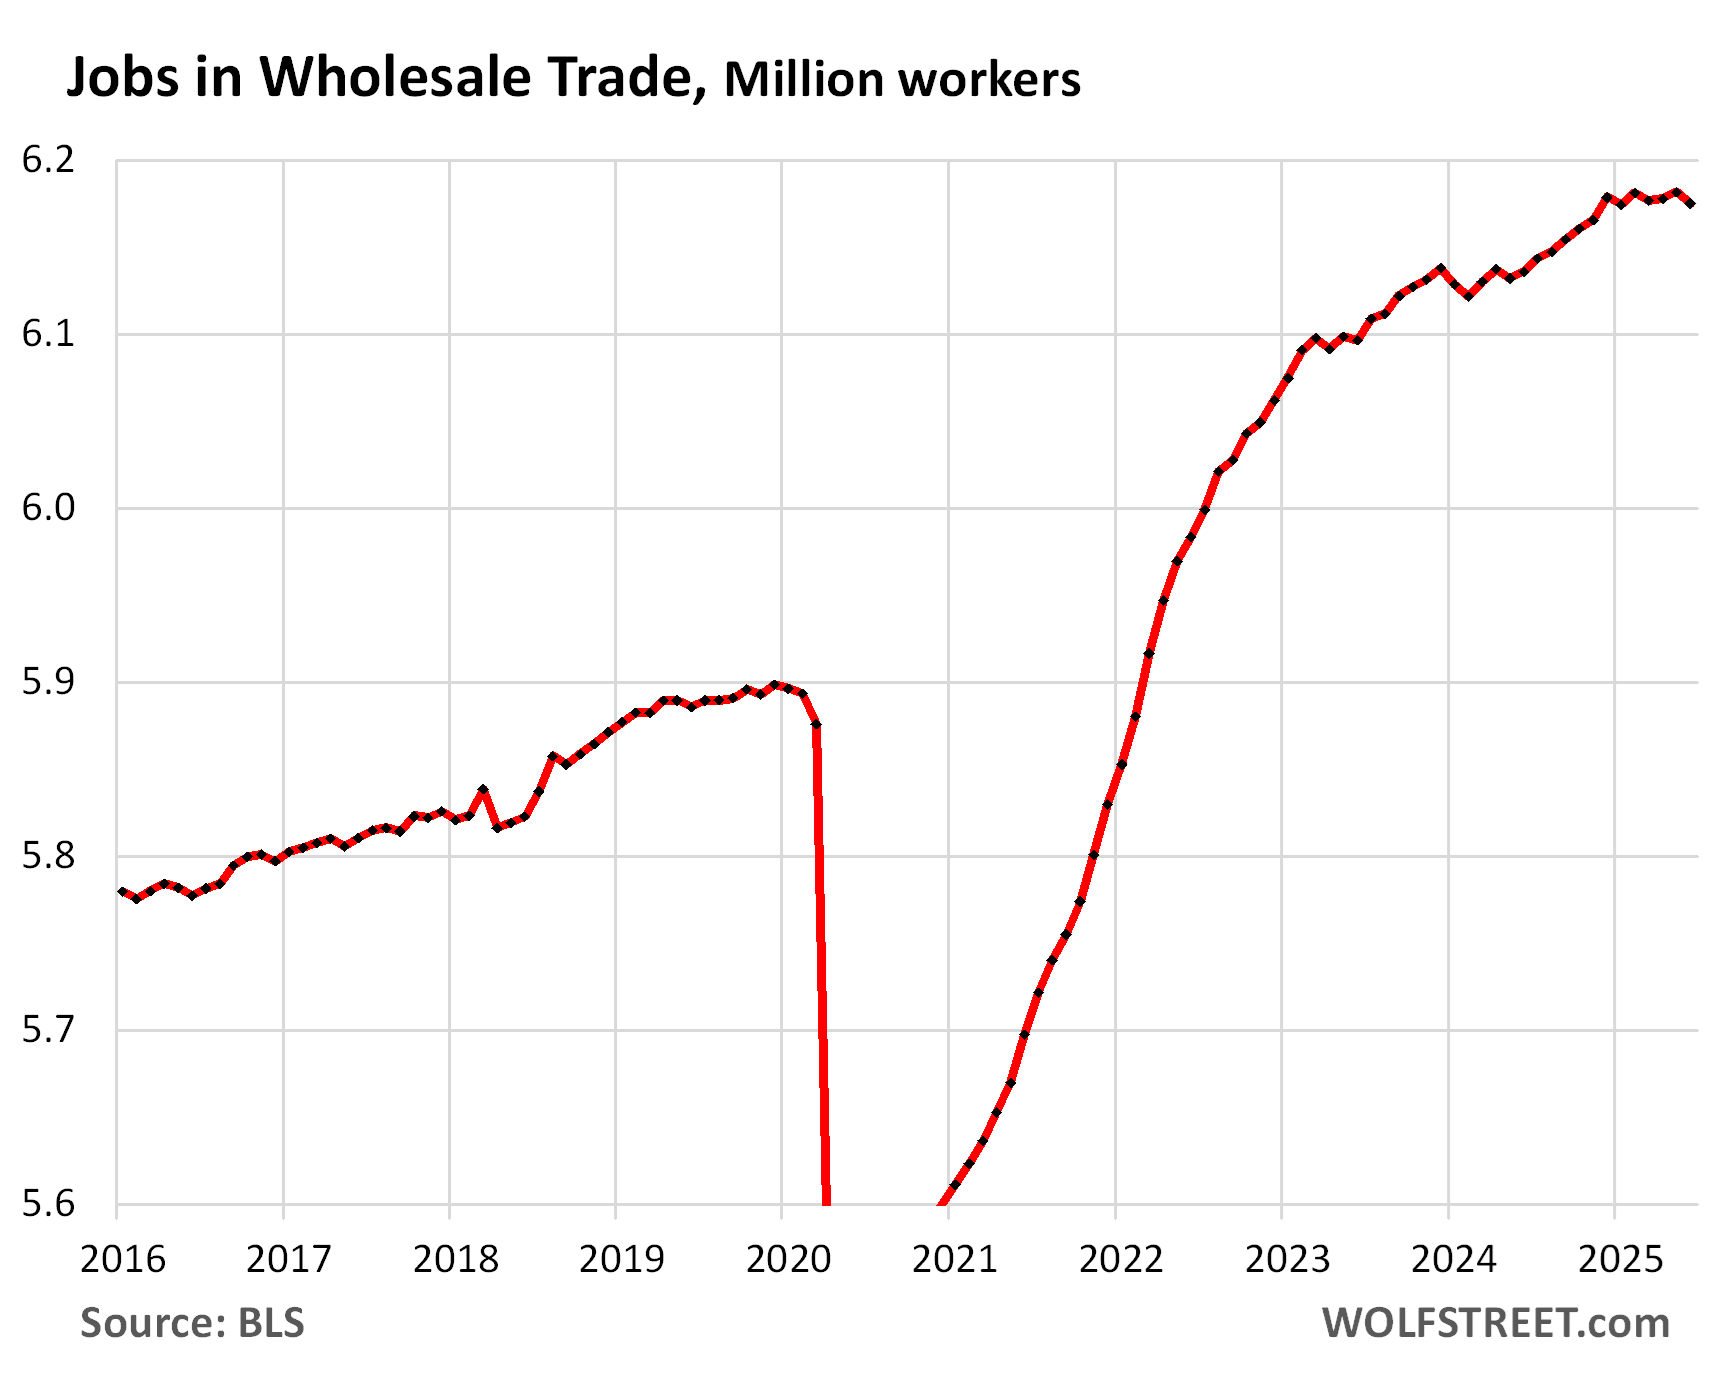
Wholesale Trade:
- Total employment: 6.18 million.
- 3-month average growth: -1,000
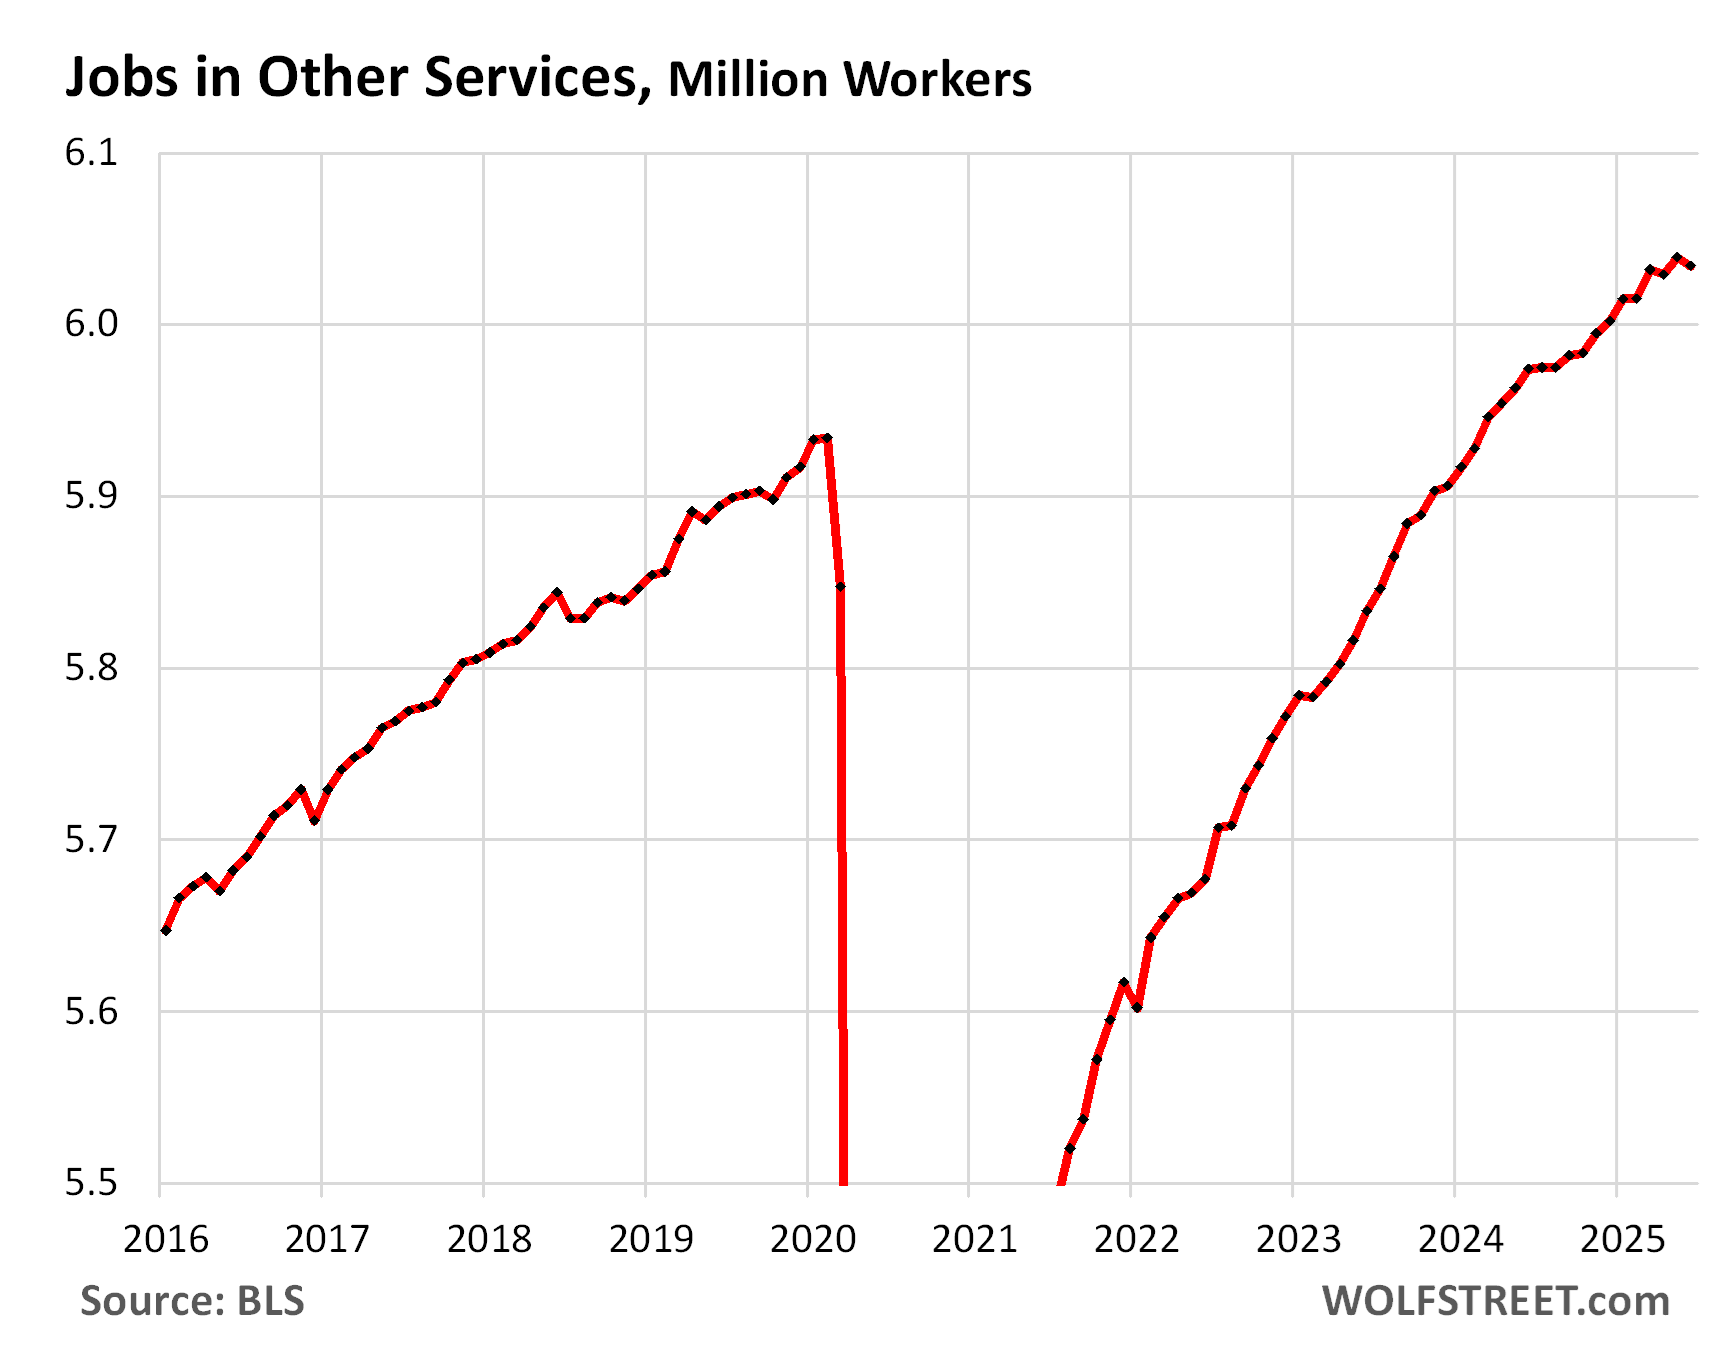
“Other services”: includes equipment and machinery repairing, promoting or administering religious activities, grantmaking, advocacy, drycleaning, laundry services, personal care services, death care services, pet care services, photofinishing services, temporary parking services, and dating services.
- Total employment: 6.03 million
- 3-month average growth: +1,000
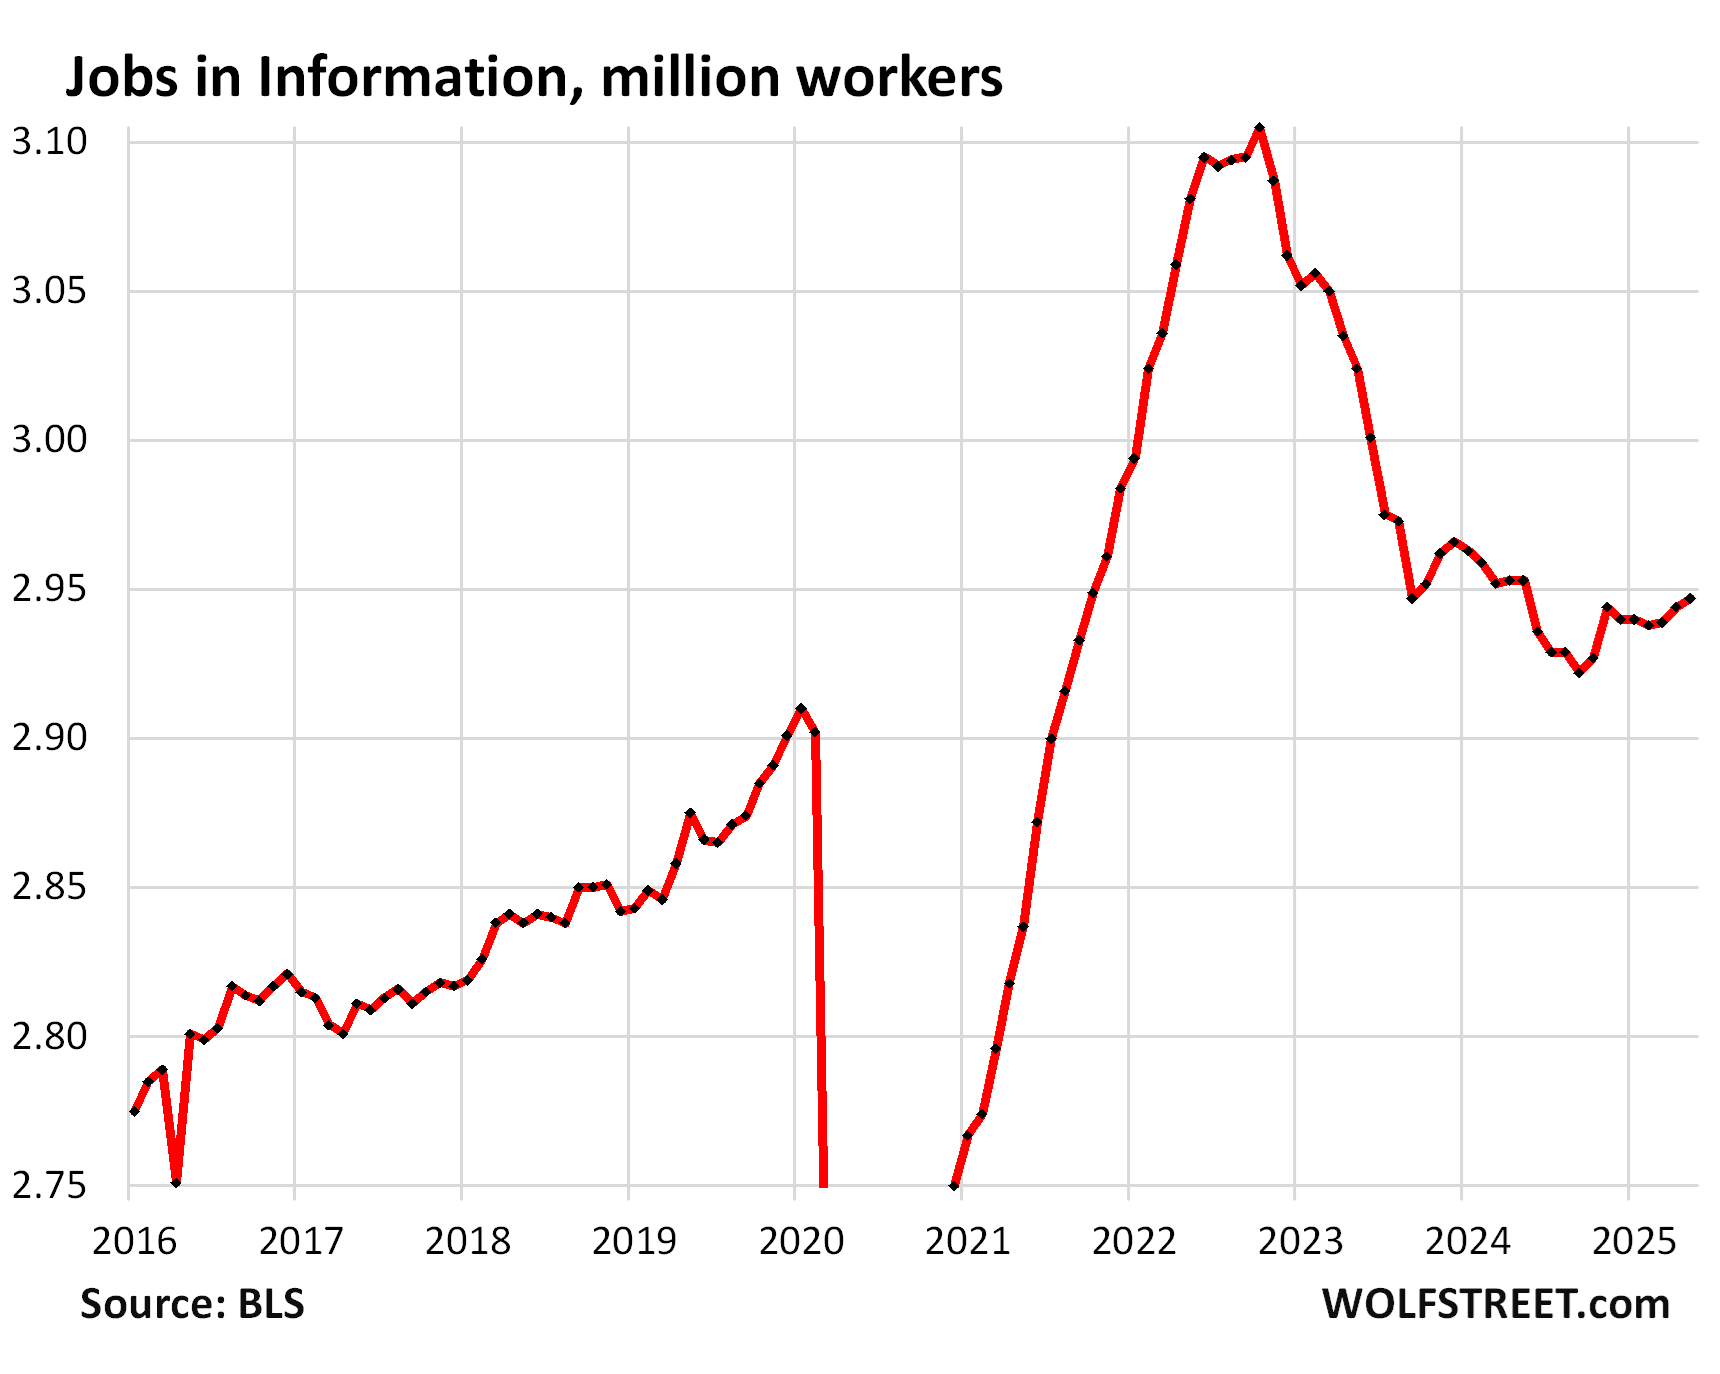
“Information” includes facilities where people primarily work on web search portals, data processing, data transmission, information services, software publishing, motion picture and sound recording, broadcasting including over the Internet, and telecommunications.
This includes work sites by tech and social media companies, which in mid-2022 started reducing their excess staff from the hiring explosion over the prior years. But by November 2024, the started adding jobs again.
- Total employment: 2.95 million
- 3-month average growth: +3,000
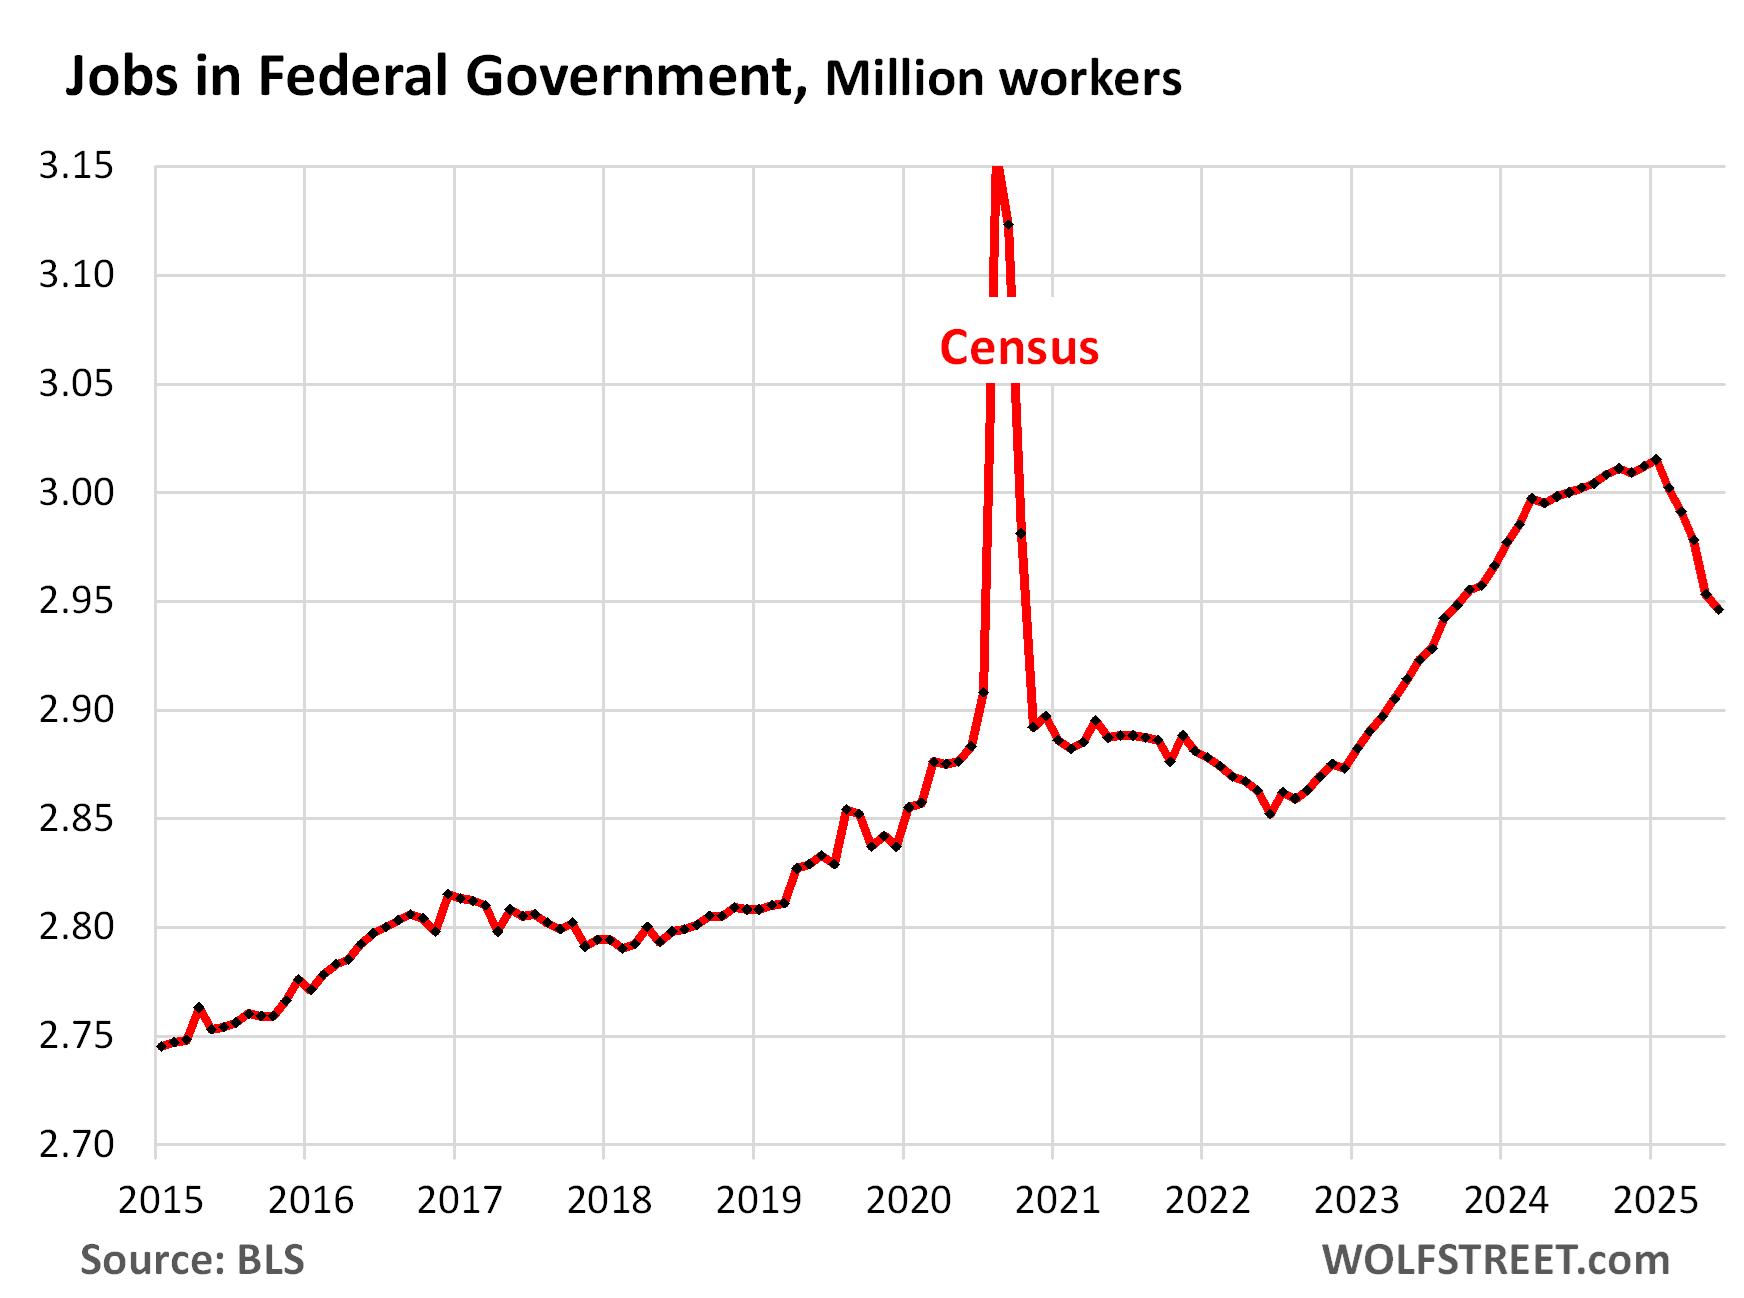
Federal government: Civilian employment shrank for the fifth month in a row, by 69,000 in total, seasonally adjusted.
- Total employment: 2.95 million
- 3-month average growth: -15,000
The payrolls still don’t fully show the federal government job reductions so far: Workers on paid leave or receiving severance pay are counted as employed until they stop being paid.
Government payrolls don’t include workers on the payroll of government contractors. They’re in private-sector categories, such as in “Professional and business services,” and if they get laid off because of government cutbacks, they count in that category.
The share of federal government jobs dropped to 1.84% of total nonfarm payrolls, the lowest share in the data going back to 1939. It peaked during the Second World War at over 7%. During the 1980s, it was around 3.0%:

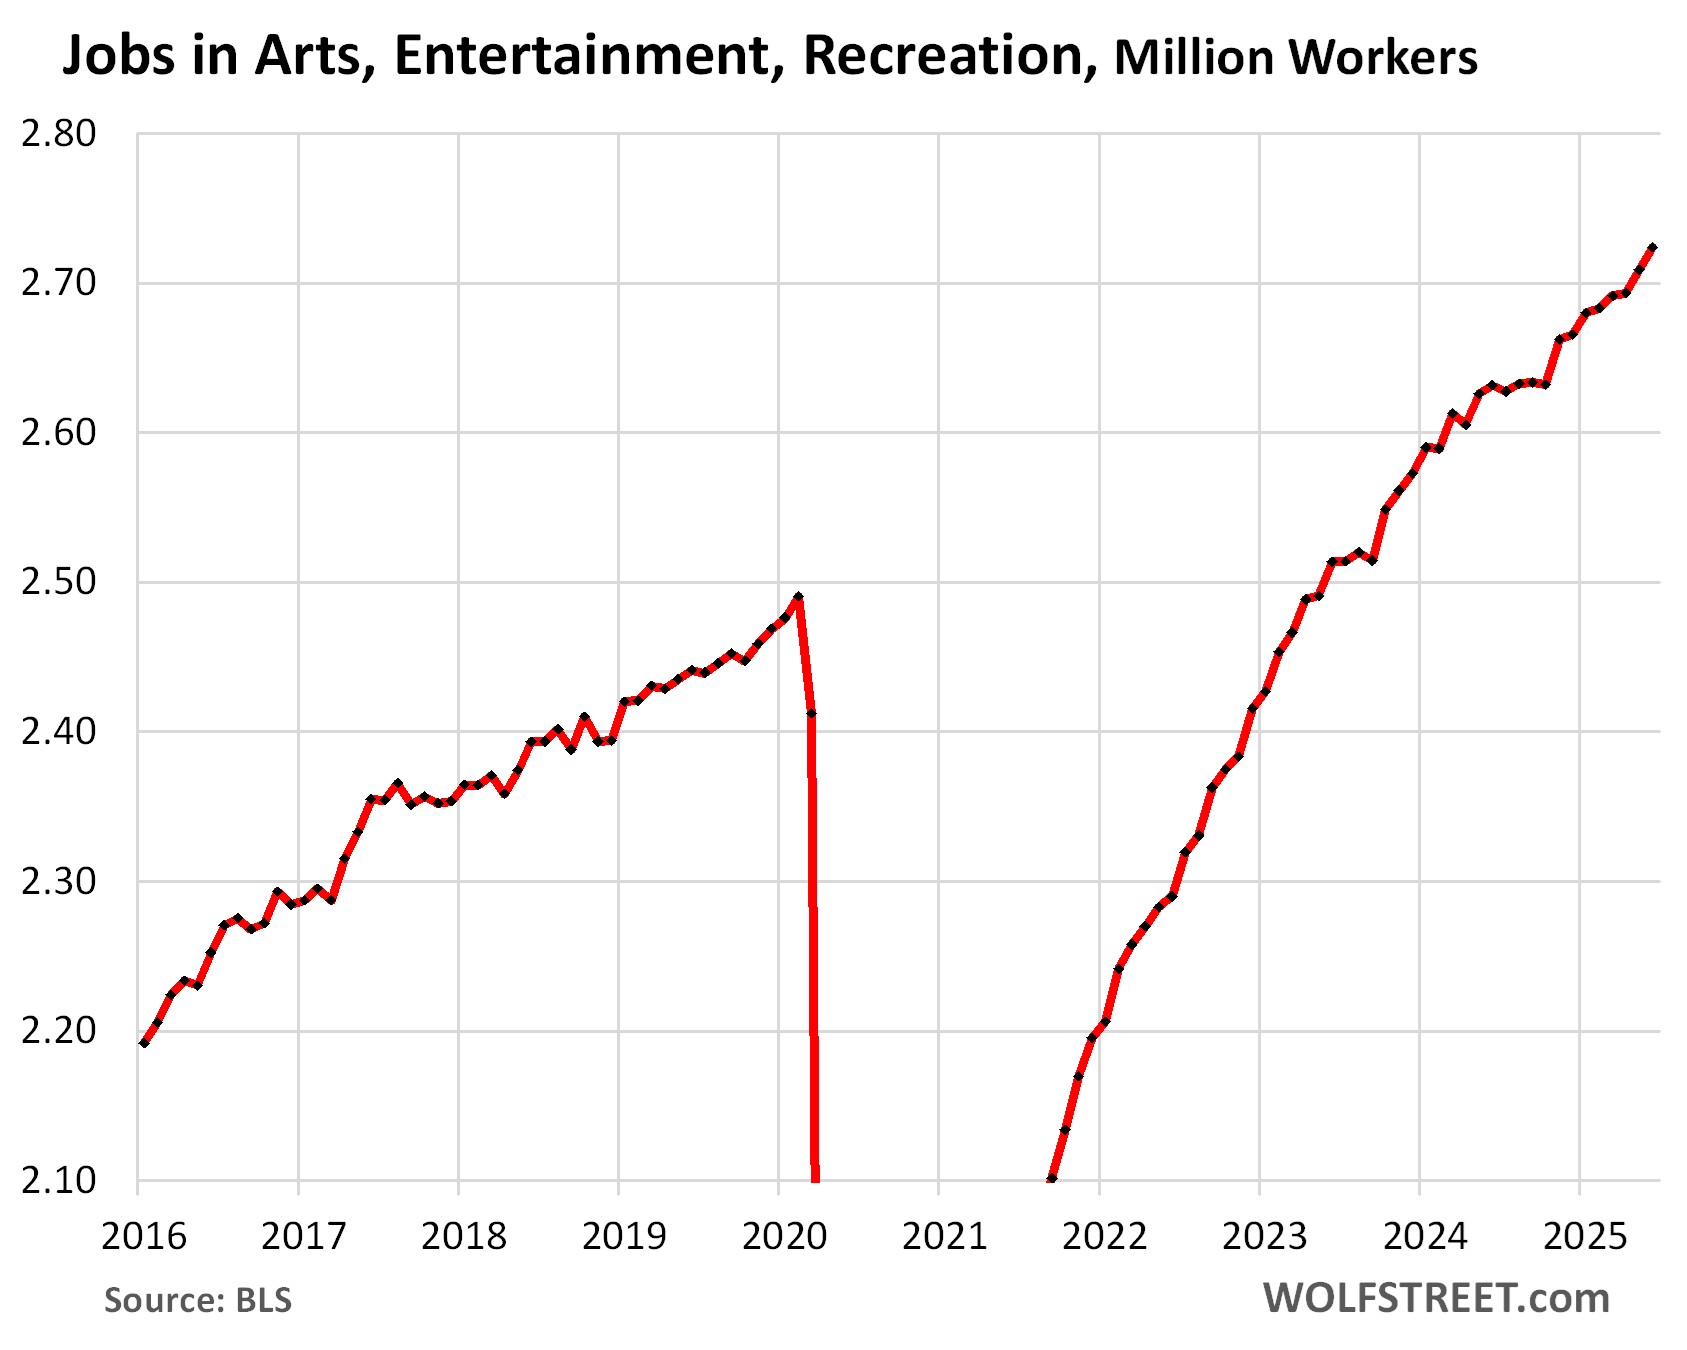
Arts, Entertainment, and Recreation:
- Total employment: 2.72 million
- 3-month average growth: +11,000
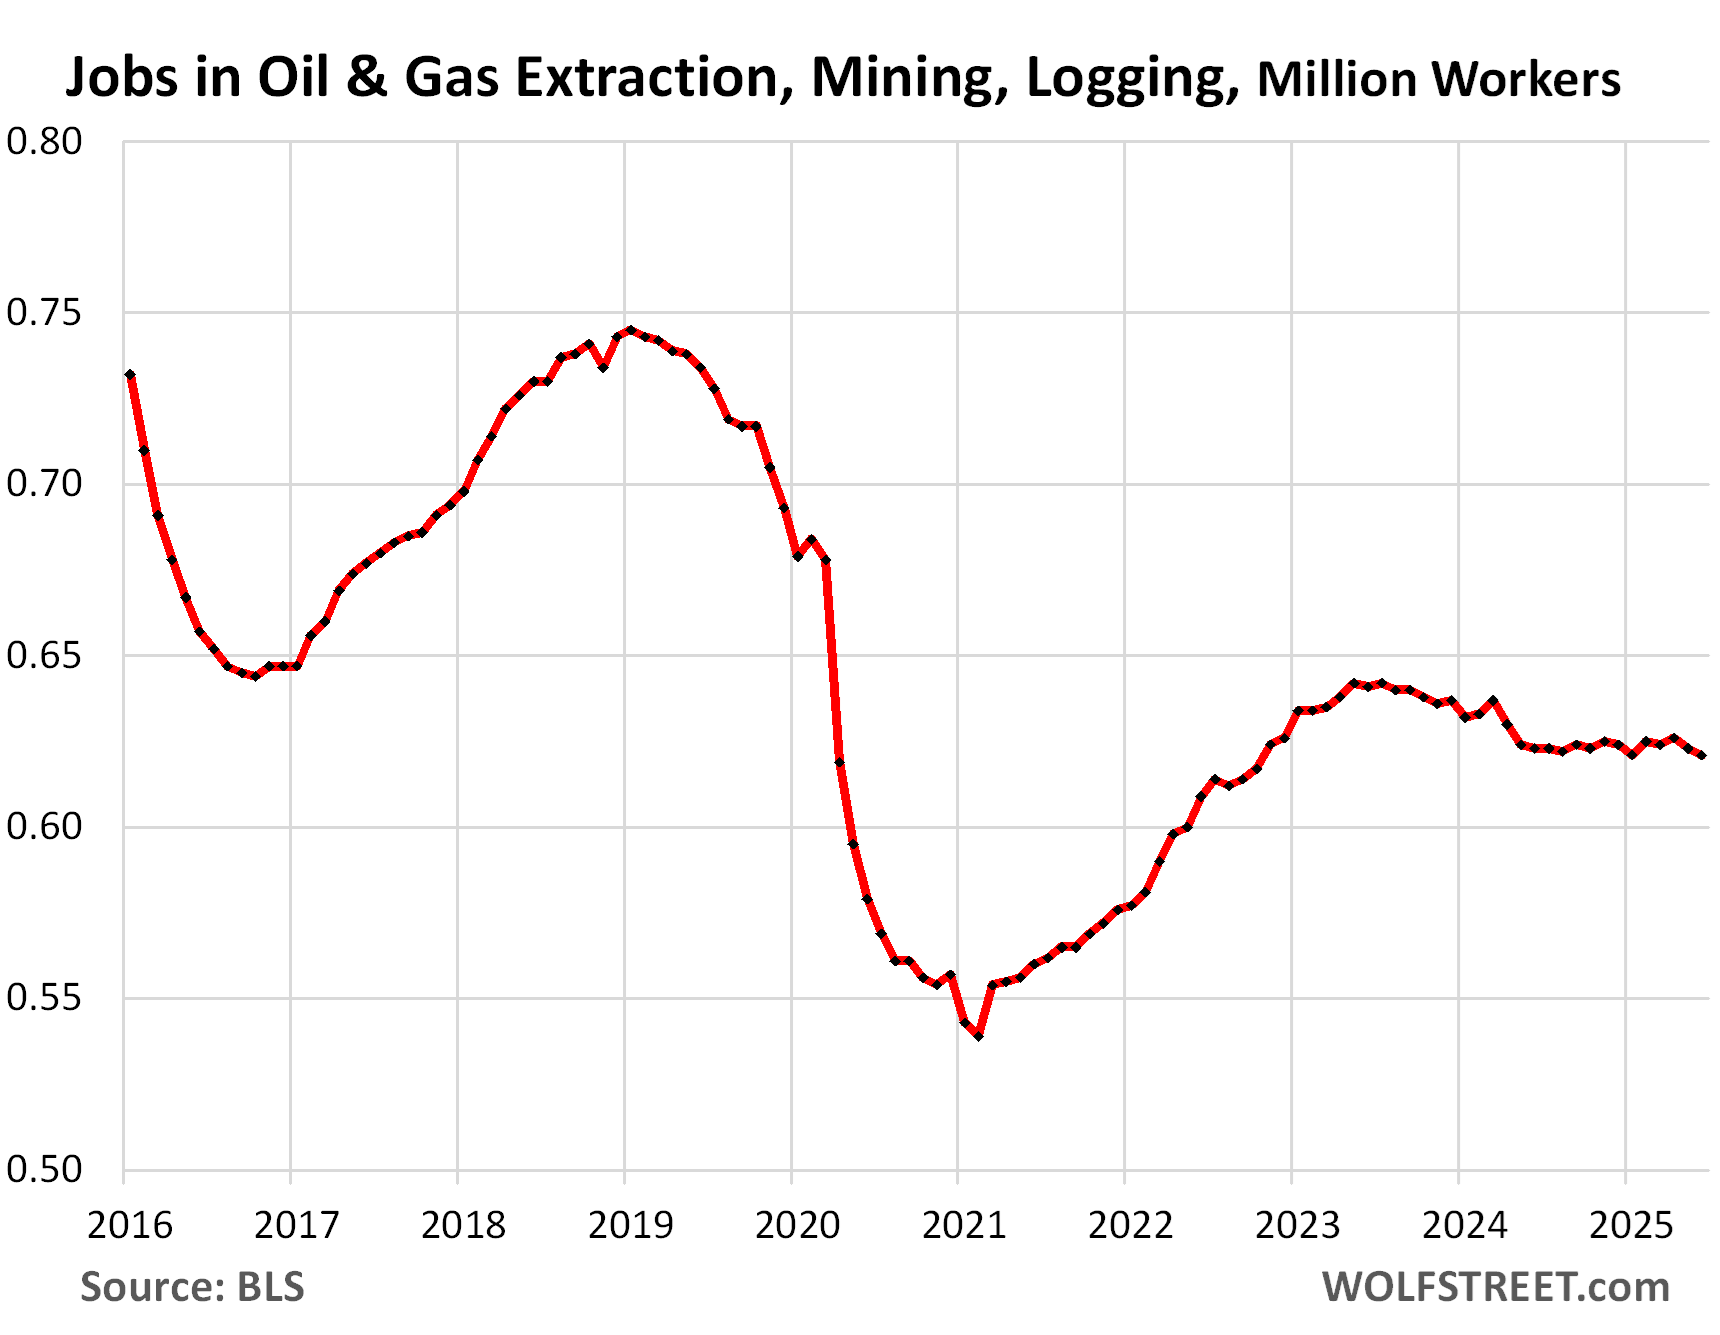
Oil & gas extraction, mining, logging: The US has become the largest crude oil producer in the world and a major exporter of crude oil and petroleum products. The US has become the largest natural gas producer in the world, and the largest LNG exporter. But fracking technology has gotten very prolific and efficient, requiring fewer oil field workers to produce records amounts of oil and gas.
The jobs included here are in the oil and gas field, such as on drilling rigs. The oil and gas industry’s tech workers, engineers, traders, finance people, managers, lawyers, etc. are counted in other categories, including Professional and business, and scientific services.
Also included are jobs in mining and logging.
- Total employment: 0.61 million
- 3-month average growth: -1,000
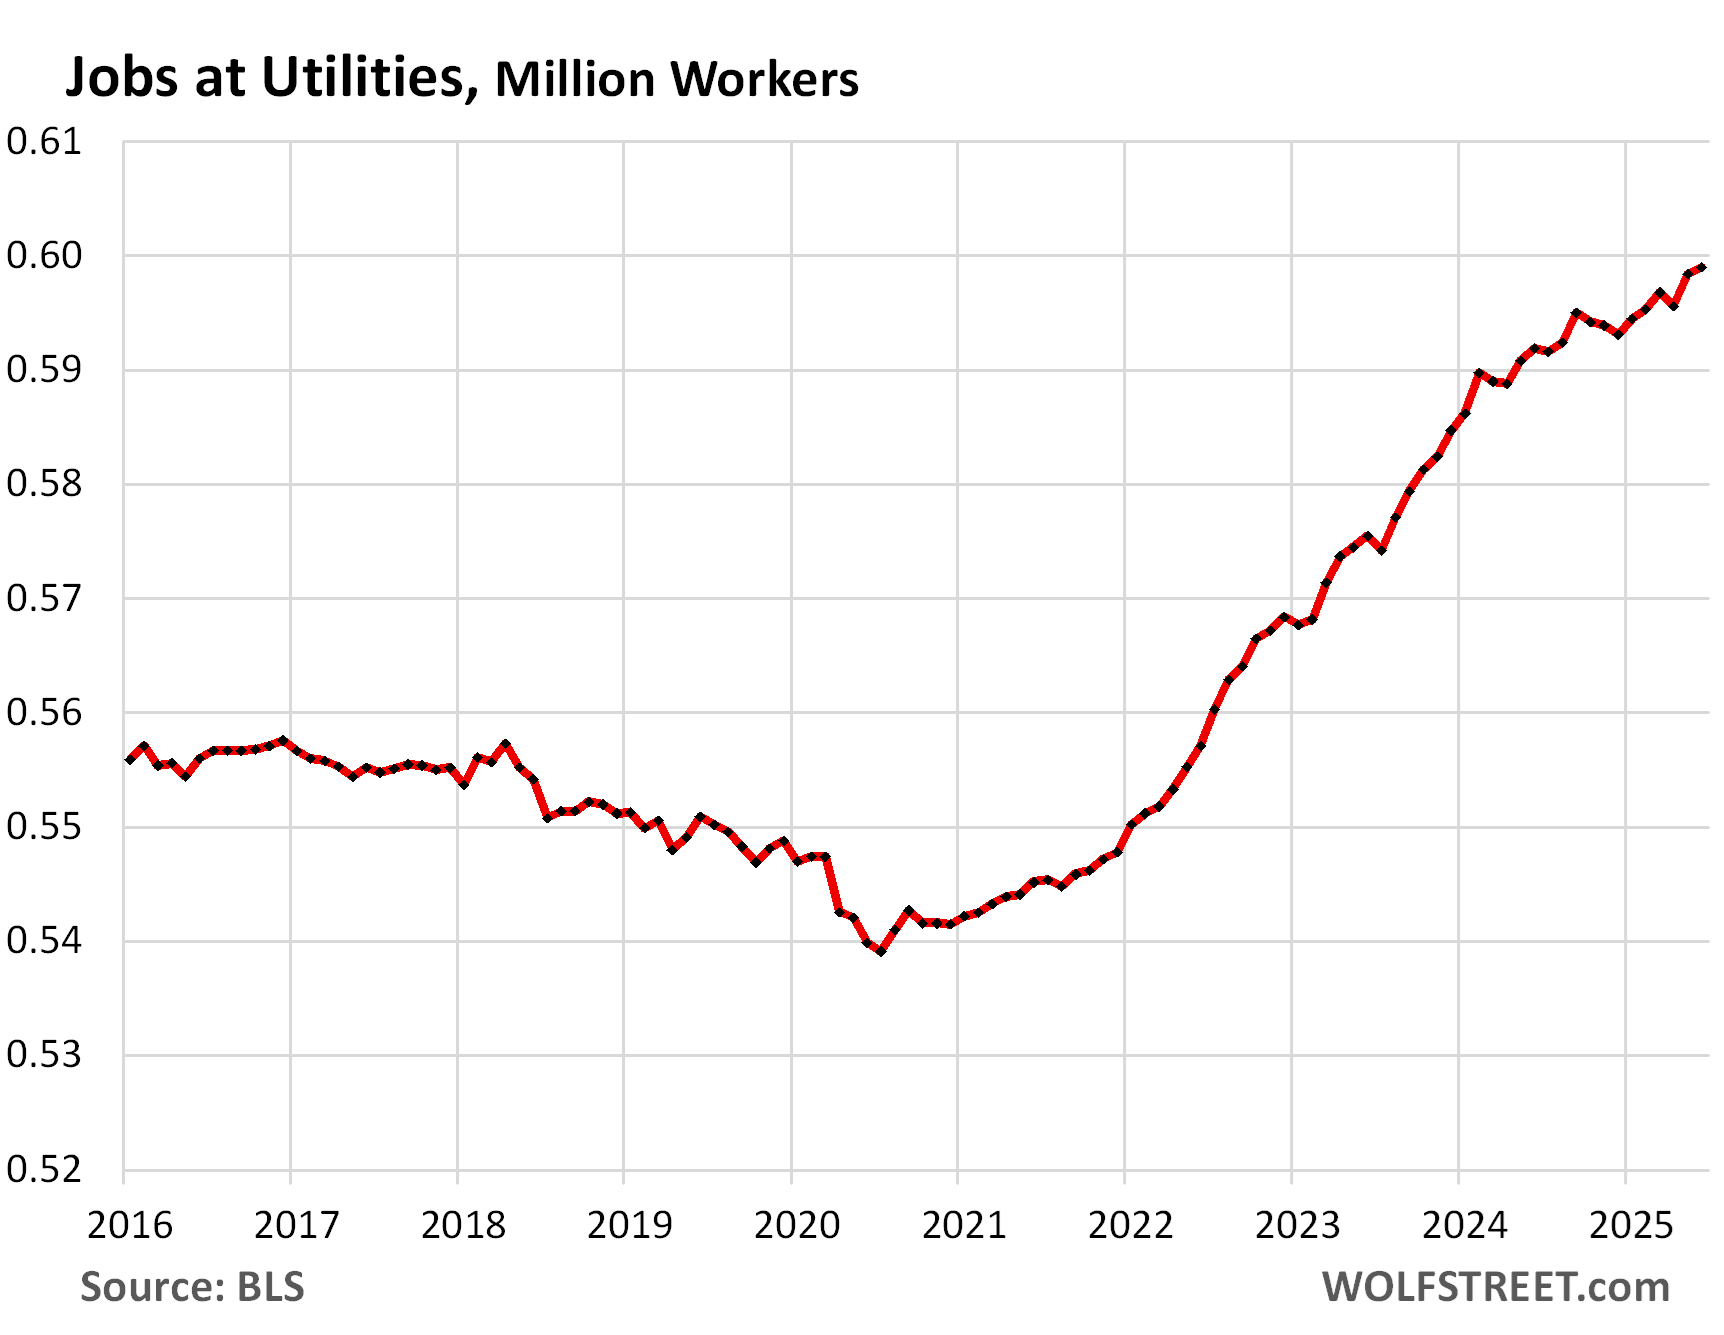
Utilities:
- Total employment: 0.60 million
- 3-month average growth: +1,000
Enjoy reading WOLF STREET and want to support it? You can donate. I appreciate it immensely. Click on the mug to find out how:

![]()
Do you have any opinion about the current divergence between the ADP employment report? Am I looking at the wrong data sets?
They always diverge. ADP’s employment report is based on the paychecks that ADP processes for other companies. There are lots of payroll processing firms out there (competitors of ADP), and ADP is only one of them. Plus most (all?) larger companies process their own paychecks and don’t use a payroll processing firm at all. So the sample from ADP is skewed and meaningless. It’s just nonsense to extrapolate from their so limited paycheck processing business to the overall labor market. I don’t know why anyone pays attention to it.
Actually, ADP data appears to be more solid to me than the BLS survey data (assuming that ADP is using their actual numbers without much statistical adjustments and extrapolation). So they are an just one aspect of the bigger picture of the job market.
The most interesting data points in my opinion were the deceleration of weekly wages (hourly rate x weekly hours) and the concurrent decrease in the unemployment rate and labor force participation rate: The job market is cooling overall (no weekly wage growth), but more and more people don’t seem to need a job at all. So the economy may not be growing much, but it doesn’t manifest itself in a rising unemployment rate. If this is indeed correct, the FED should be solely focusing on inflation. And cut the FED funds rate now.
The Federal Reserve FOMC should start increasing the Federal Funds Rate by a full percentage point and keep hiking as the additional data points rolling in make it clear that inflation is a very real problem and a message needs sent to the markets. If they don’t do that the bond markets will do it for them.
Jason,
“ADP data appears to be more solid to me than the BLS survey data (assuming that ADP is using their actual numbers without much statistical adjustments and extrapolation).”
LOL, ADP data jumps all over the place month-to-month, is from the wrong and systemically skewed sample, it’s extrapolated and adjusted like you wouldn’t believe, including seasonally adjusted, and doctored to give the impression that this valid data. It’s the farthest cry from raw data.
You just like it better because it was lower in June, and it fits your narrative better.
Wage growth in and of itself doesn’t mean jack shit. We had 5% wage growth under the last administration but we had inflation outpacing it.
Right now wage growth is above inflation
Year Jan Feb Mar Apr May Jun Jul Aug Sep Oct Nov Dec
2015 2.3 2.0 2.2 2.4 2.3 1.9 1.9 2.0 2.2 2.4 1.9 1.8
2016 1.3 1.4 1.5 1.3 1.3 1.5 1.8 1.4 1.1 1.0 0.8 0.7
2017 -0.1 -0.1 0.2 0.4 0.6 0.8 0.8 0.7 0.6 0.4 0.3 0.6
2018 0.7 0.4 0.5 0.3 0.2 0.1 0.0 0.5 0.7 0.7 1.2 1.4
2019 1.7 2.0 1.5 1.3 1.5 1.8 1.6 1.7 1.4 1.4 1.2 0.6
2020 0.5 0.7 2.0 7.7 6.4 4.3 3.8 3.5 3.4 3.4 3.4 4.0
2021 3.8 3.6 1.8 -3.3 -2.5 -1.2 -1.0 -0.8 -0.4 -0.8 -1.3 -1.9
2022 -1.8 -2.5 -2.4 -2.4 -2.7 -3.4 -2.7 -2.7 -2.8 -2.6 -2.0 -1.4
2023 -1.7 -1.2 -0.4 -0.4 0.3 1.6 1.3 0.7 0.7 0.9 1.0 0.7
2024 1.2 1.0 0.7 0.6 0.8 0.9 0.6 1.4 1.4 1.5 1.4 1.1
2025 0.9 1.1 1.4 1.4 1.4(P)
Behold the beauty of 2021-2023
After a brief period using ADP for my small business, I’ll never try that again. There are so many more effective, efficient and better online-only solutions to handle payroll these days. I’d have to think their data will get worse over time if they lose market size/share.
Wolf,
You are right, ADP is not reporting raw data. Still they work with a massive payroll data set, about 10-20% of all private payrolls.
A variation of +/- 100k US total payroll jobs after extrapolation is not actually all that much, it’s close to a rounding error.
One could argue the BLS data should be expected to jump around month to month much more than it does.
About 10-20%? 10-20% is a huge range for it not to be precise so that leaves 80-90% of data they don’t have.
That is a huge data set.