Wages & salaries rose at a solid pace, but Social Security payments returned to trend after a spike in April due to policy changes.
By Wolf Richter for WOLF STREET.
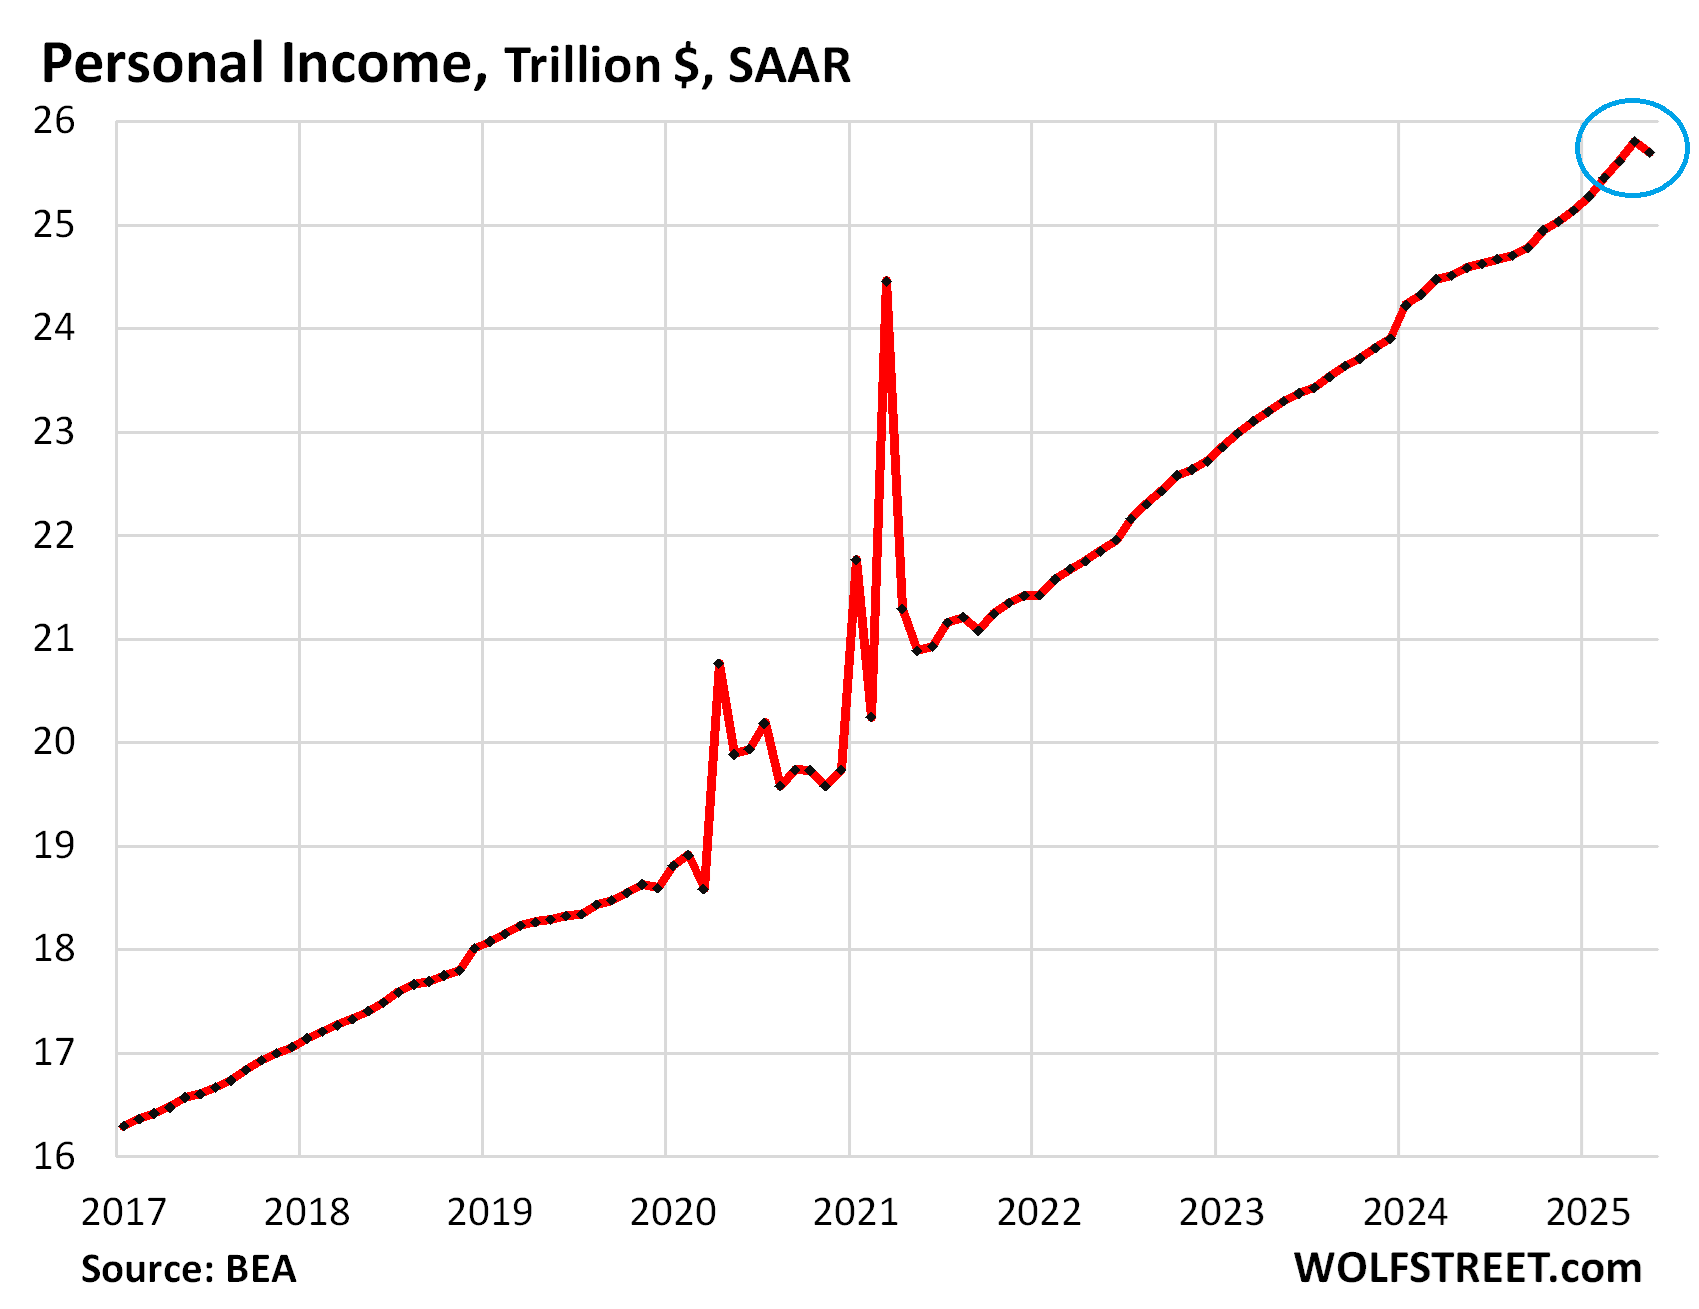
The recession talk started heating up again on Friday when the personal income data for May hit the news. Total personal income from all sources fell by 0.4% in May from April, the first month-over-month decline since September 2021. Personal income drops during a recession. So a drop in personal income, if persistent, is a worrisome event.
This is total consumer income. It includes wages and salaries, contributions by employers to retirement funds and social insurance, rental income, interest and dividend income, farm and small business income, and personal transfer receipts such as Social Security benefits paid to beneficiaries. In May, this income fell by 0.4% to a seasonally adjusted annual rate (SAAR) of $25.7 trillion.
But that drop was a false alarm, in terms of the economy. There was a big culprit, and it had nothing to do with the economy, but with changes in government policy.
The culprit was Social Security. Income from personal transfer receipts plunged by 2.2%, or by an annual rate of $110 billion, in May from April, after having spiked by 2.5% in April from March due to government policy changes that expanded beneficiaries and increased the benefits of some beneficiaries, which then triggered catch-up payments in April. And in May, payments returned to trend.
Conversely, these Social Security catch-up payments had fattened up the increase in total income in April to +0.7%.
![]()
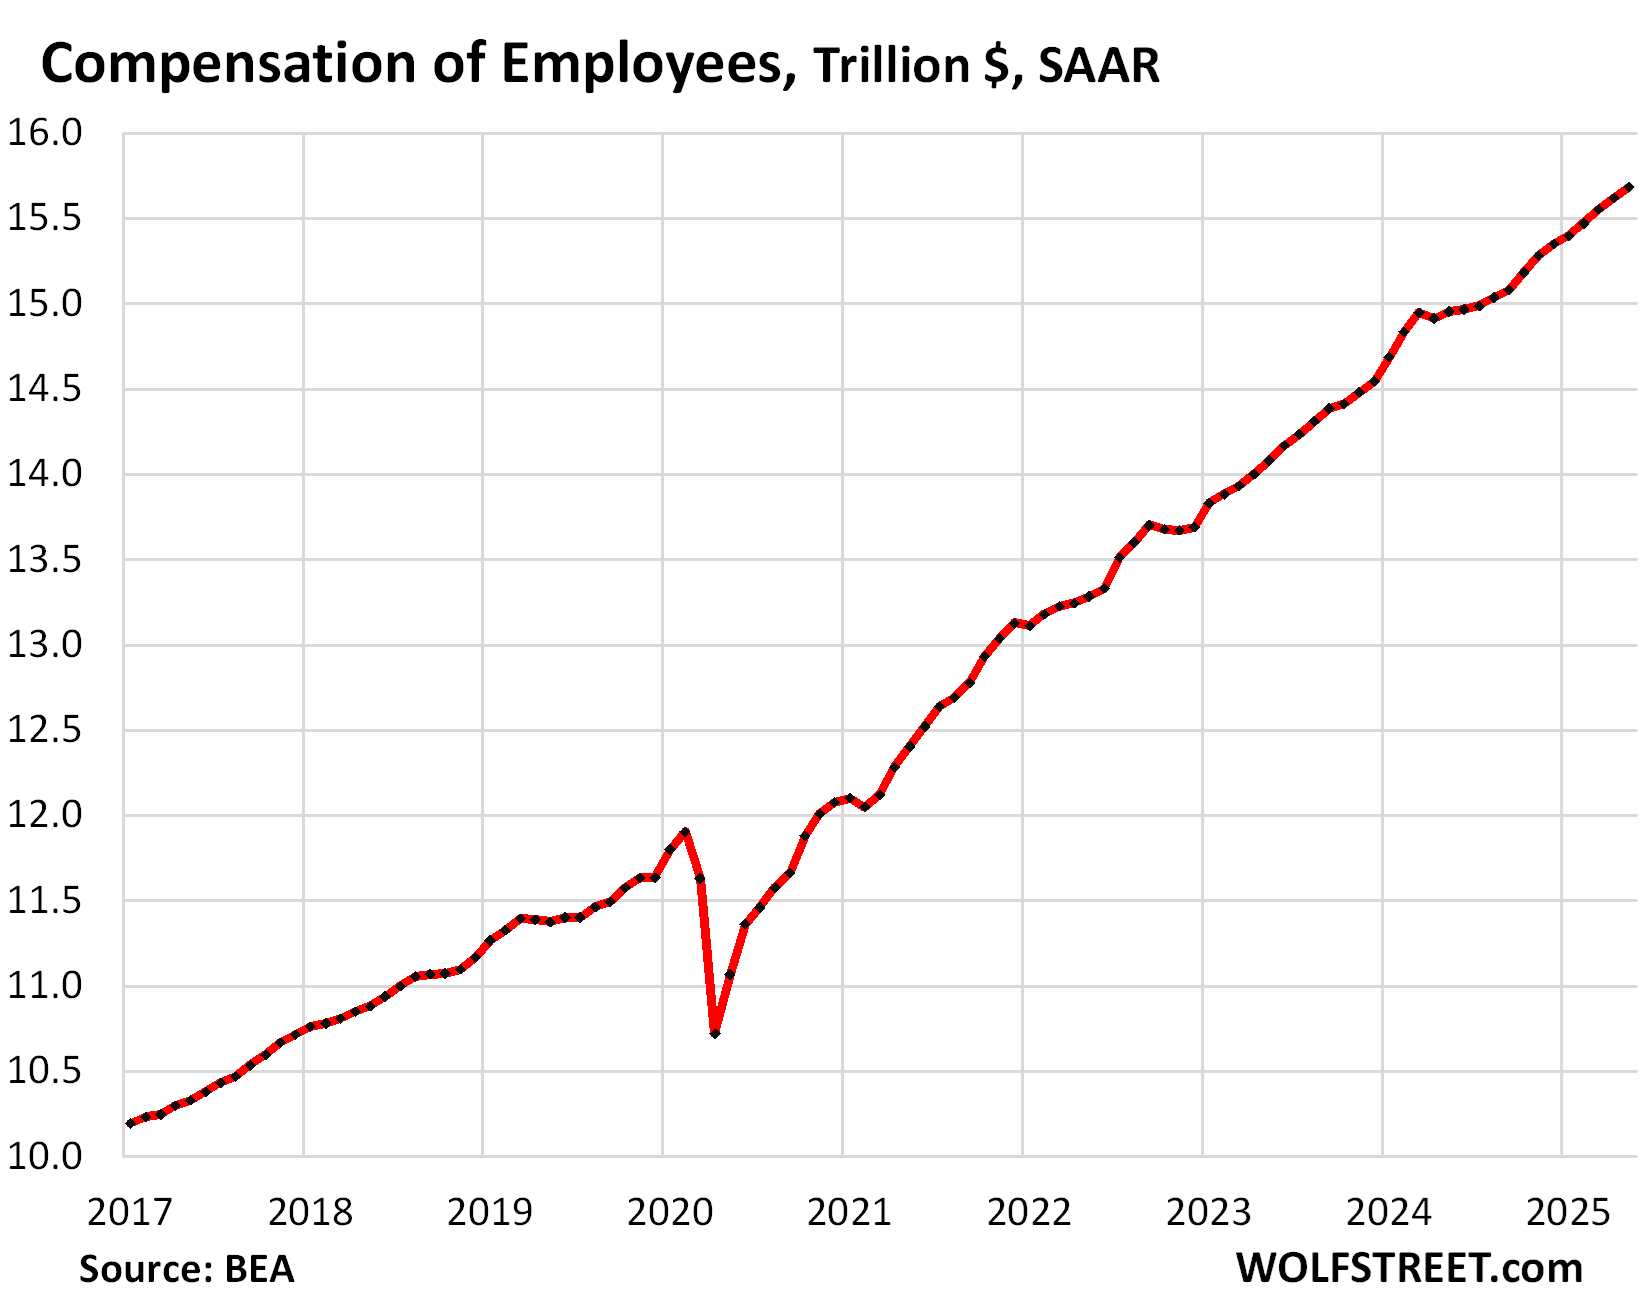
Compensation of employees: solid growth. The total of wages and salaries, plus contributions paid by employers to retirement funds and government social insurance rose by 0.4% in May from April, which was exactly average for the past 12 months.
Year-over-year, compensation of employees rose by 4.9%, to a record seasonally adjusted annual rate of $15.7 trillion.
This all-important labor market gauge, which includes wage increases, is growing at a solid pace.
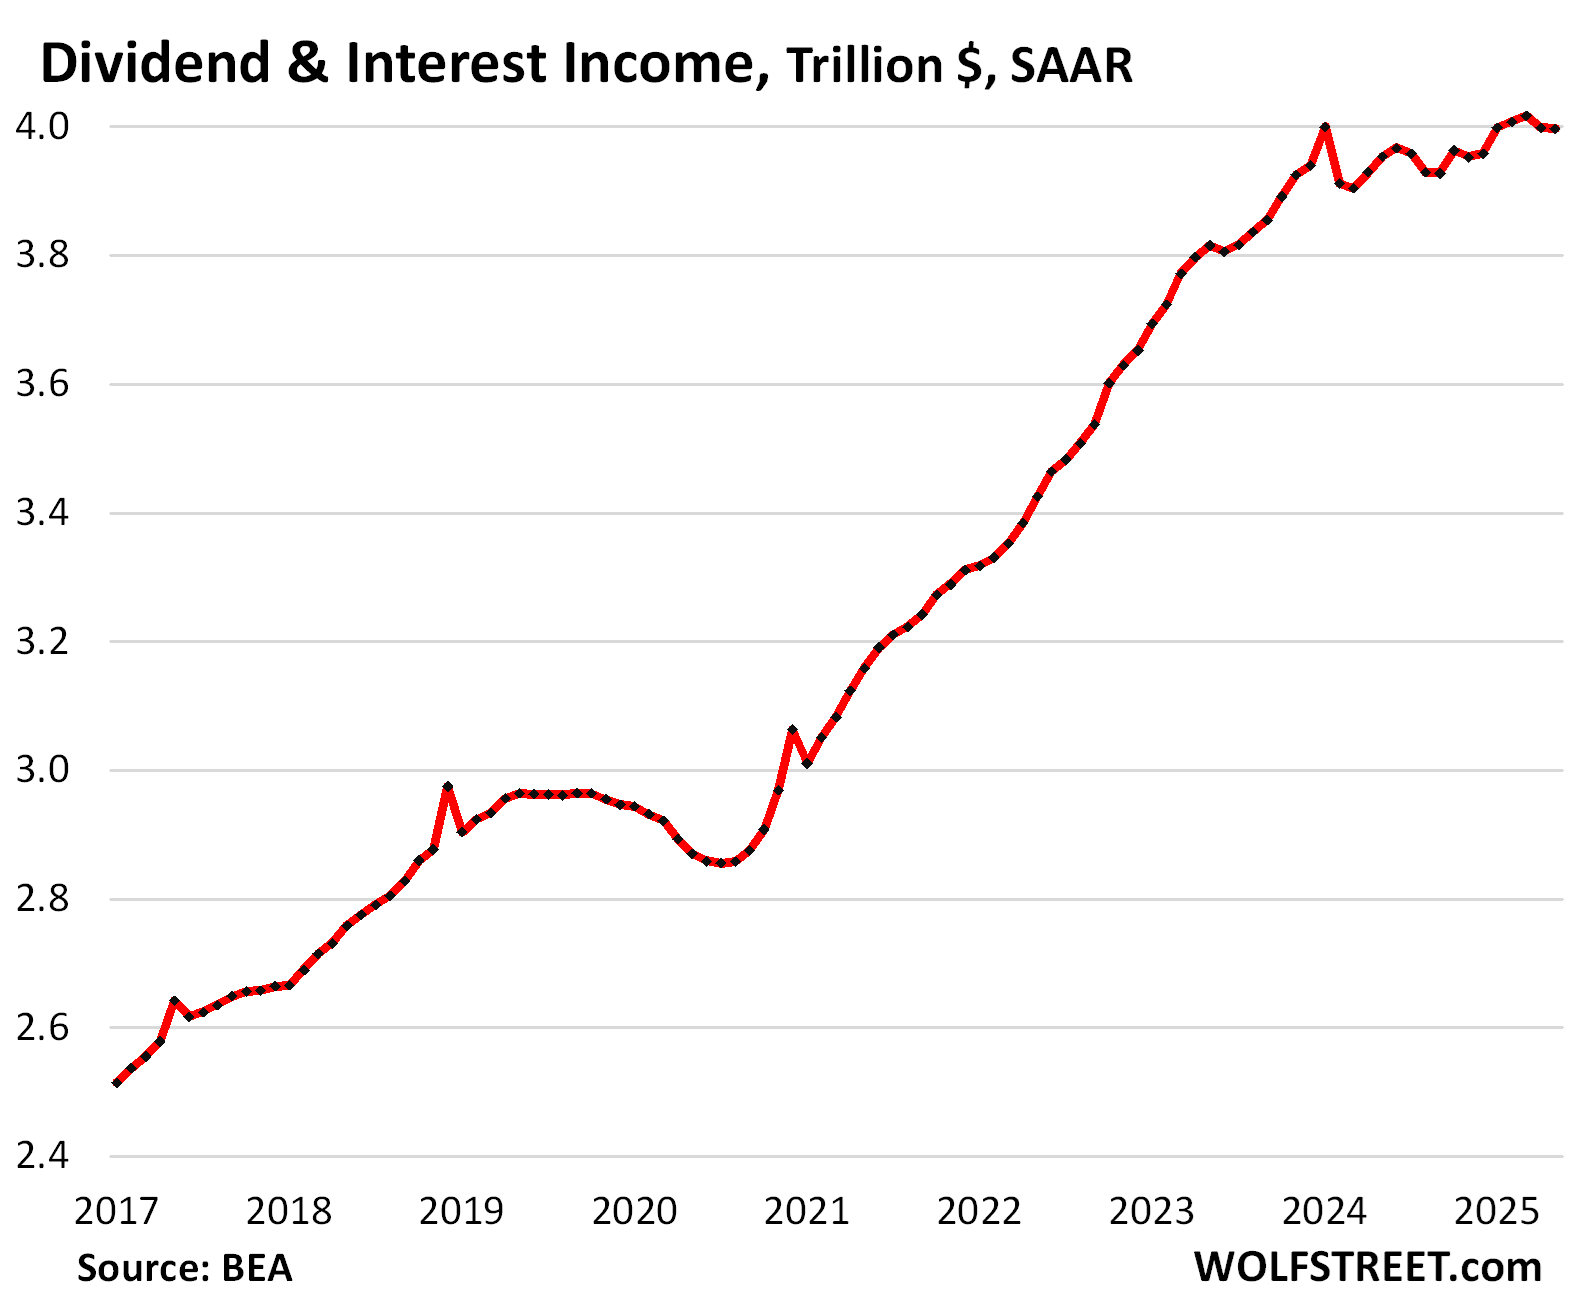
Income from Dividends and Interest has been wobbling along at record levels all year. In May, they were essentially unchanged, at a seasonally adjusted annual rate of $4.0 trillion, up by 1.1% from a year ago.
About half of the income is from dividends and half from interest.
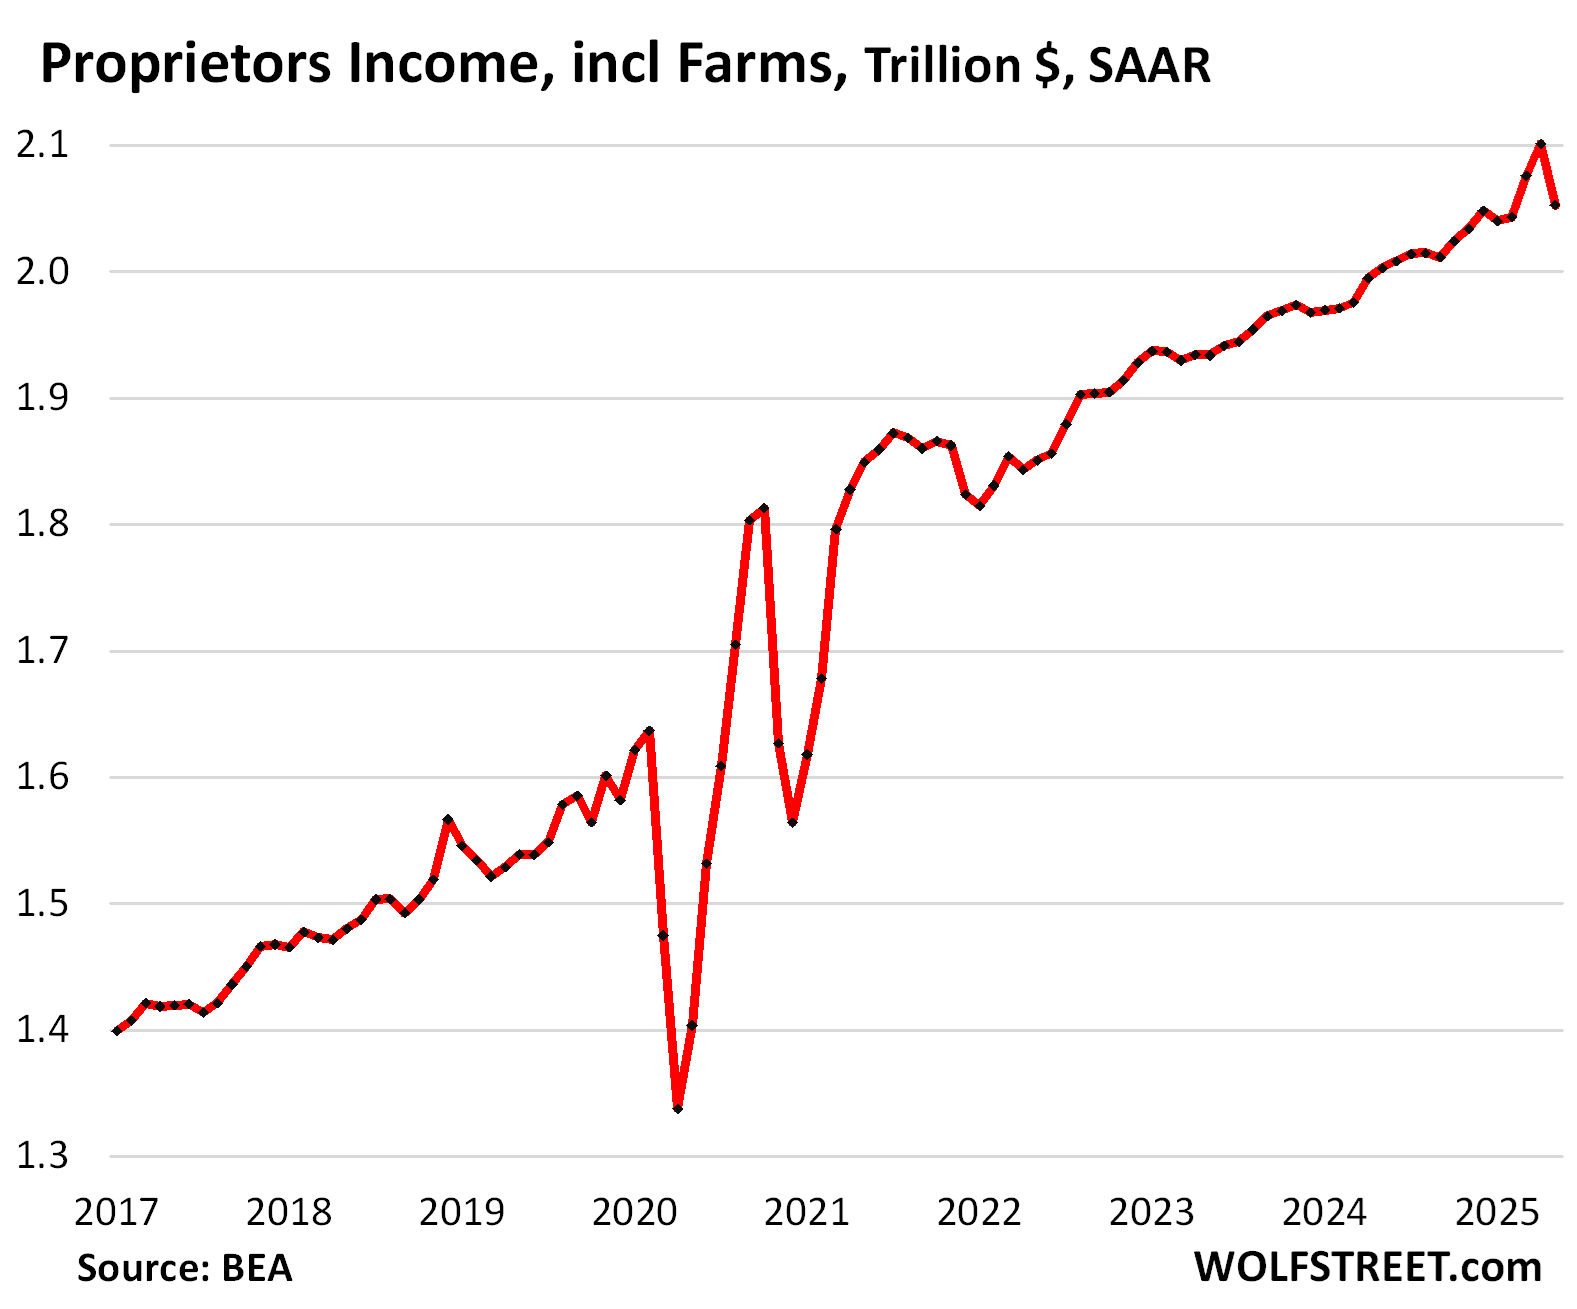
“Proprietors’ income” (income from personally owned businesses and farms) fell by 2.3% in May from the record in April, but that drop only partially undid the big spike in March and April.
Over the three months combined, income rose by 0.5%. Year-over-year, income rose by 2.3%.
The month-to-month drop ($49 billion SAAR) was mostly due to the always super-volatile but minuscule income from personally-owned farms, which fell by $41 billion SAAR in May to a seasonally adjusted annual rate of $42 billion, after big-percentage jumps in the prior months.
Nonfarm proprietors’ income – revenues minus expenses from personally owned small businesses – dipped by 0.3% from the record in April, to a seasonally adjusted annual rate of $2.01 trillion.
All these figures here are annual rates. To get a very rough feel for the actual monthly dollars, divide the dollar figures by 12. That’s obviously not how seasonally adjusted annual rates are figured, but it gives you a very rough feel for the monthly magnitudes.
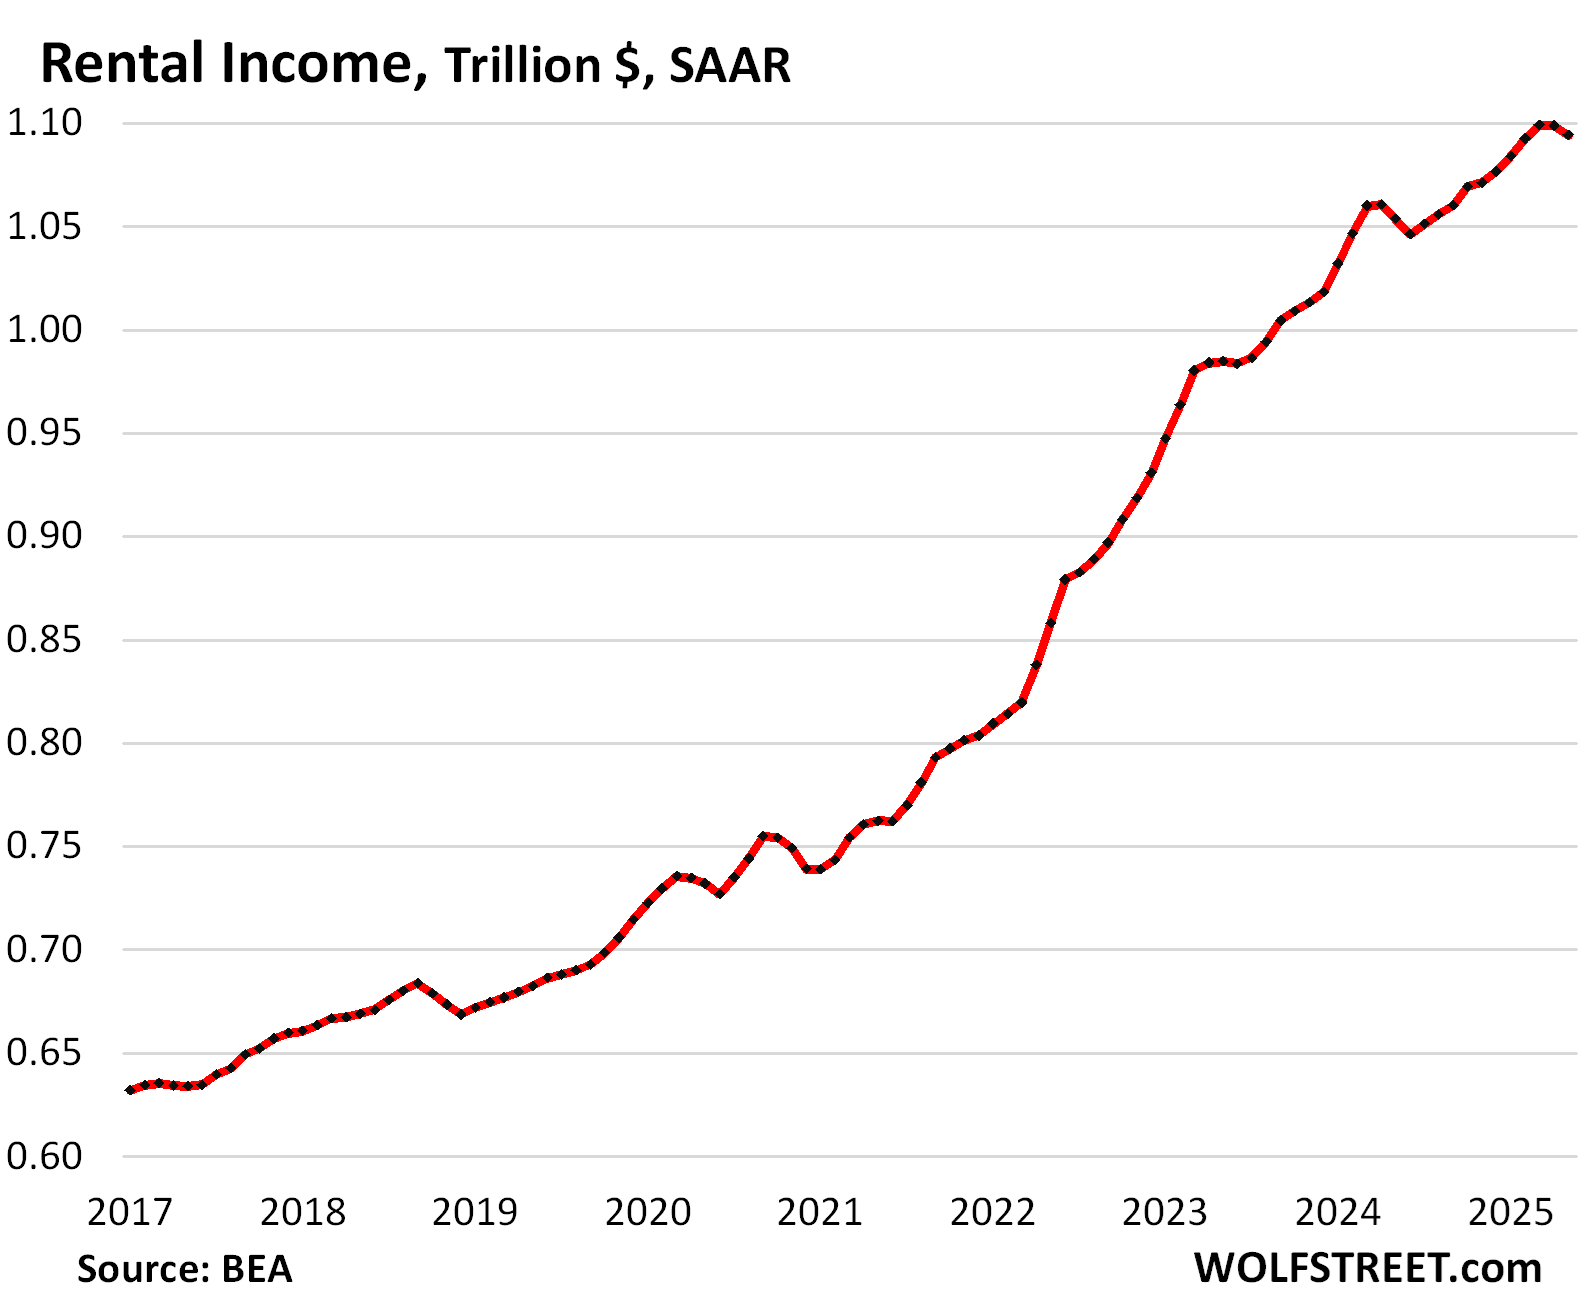
Rental income of “persons” dipped a hair in May, to a seasonally adjusted annual rate of $1.1 trillion. This was still up 3.9% year-over-year. Rental income reflects revenues from rents minus expenses. This is personal rental income, such as mom-and-pop landlords have.
And in case you missed it: PCE Inflation Accelerates. But Tariffs Haven’t Shown Up Yet: Why the Fed Is in Wait-and-See Mode
Enjoy reading WOLF STREET and want to support it? You can donate. I appreciate it immensely. Click on the mug to find out how:

![]()
The anticipation of what or may not be coming is getting old.
Let the cards fall where they may and let’s get it over with.
Always appreciate Your analysis W.R.
Have a fantastic weekend !
Don’t get caught up in the hype about a near term recession. . Simply wait for Wolf to call it..or not..
I appreciate the data analysis! Thanks Wolf!
Solid work as per usual from Wolf, very helpful.
Questions I have going forward on consumer spending are :
1)on the DOGE effect on culling the erroneous 100+ year old social security receivers
2) the restart of student loan debt payments in coming months.
Absent any real problems from those or other issues on growth ,I think the long end of the bond market will react poorly to a premature cut in interest rates by the Fed that this administration is pushing for.
Actually pushing mortgage rates higher, not lower
The potentially 10s of thousands of dollars clawed back through erroneous SS payments should probably pay off the entire US debt if I am not mistaken. /s
I have been paying my student loans again for a couple years. The only reason I have not paid them off completely is because they are old and very, very low interest (sub 2%). I don’t think that money becomes substantial either.
I think the government profits by the single digit billions annually. I’m pretty sure the annual deficit starts with a “T” for trillion.
Also, the BBB tax bill will probably increase the deficit by reforming taxes in all the wrong directions? At least they removed the sale of public lands (which probably would have been skewed to benefit those with greater resources anyway).
I believe I read that the CBO has projected that the new Tariffs will bring in approximately $3 Trillion over ten years.
I think that is the same projection for the accumulated budget deficits from the so-called BBB deal being voted on soon
Since we don’t know what the tariffs are yet, I don’t see how projections can be made with any degree of certainty beyond zero.
Excellent catch Wolf. Nicely done.
any idea why the little bump up every 2 years (approx) in the Dividends and Interest chart? it’s rising a pretty regular rate, then there’s a little bump up and then it settles back to trend, 2 years later, same thing, 2 years later same thing.