In some industries, profits surged. In others, profits sagged. By major industry.
By Wolf Richter for WOLF STREET.
The explosion of corporate profits during the high-inflation years stalled in Q1, according to data from the Bureau of Economic Analysis today. That explosion of profits was quite something. From Q1 2020 through Q4 2024, over those five years, pretax profits of incorporated businesses of all sizes in nonfinancial industries had spiked by 122%, and in financial industries by 97%. Over the same period, CPI inflation rose by 23%. But in Q1, corporate profits remained essentially flat.
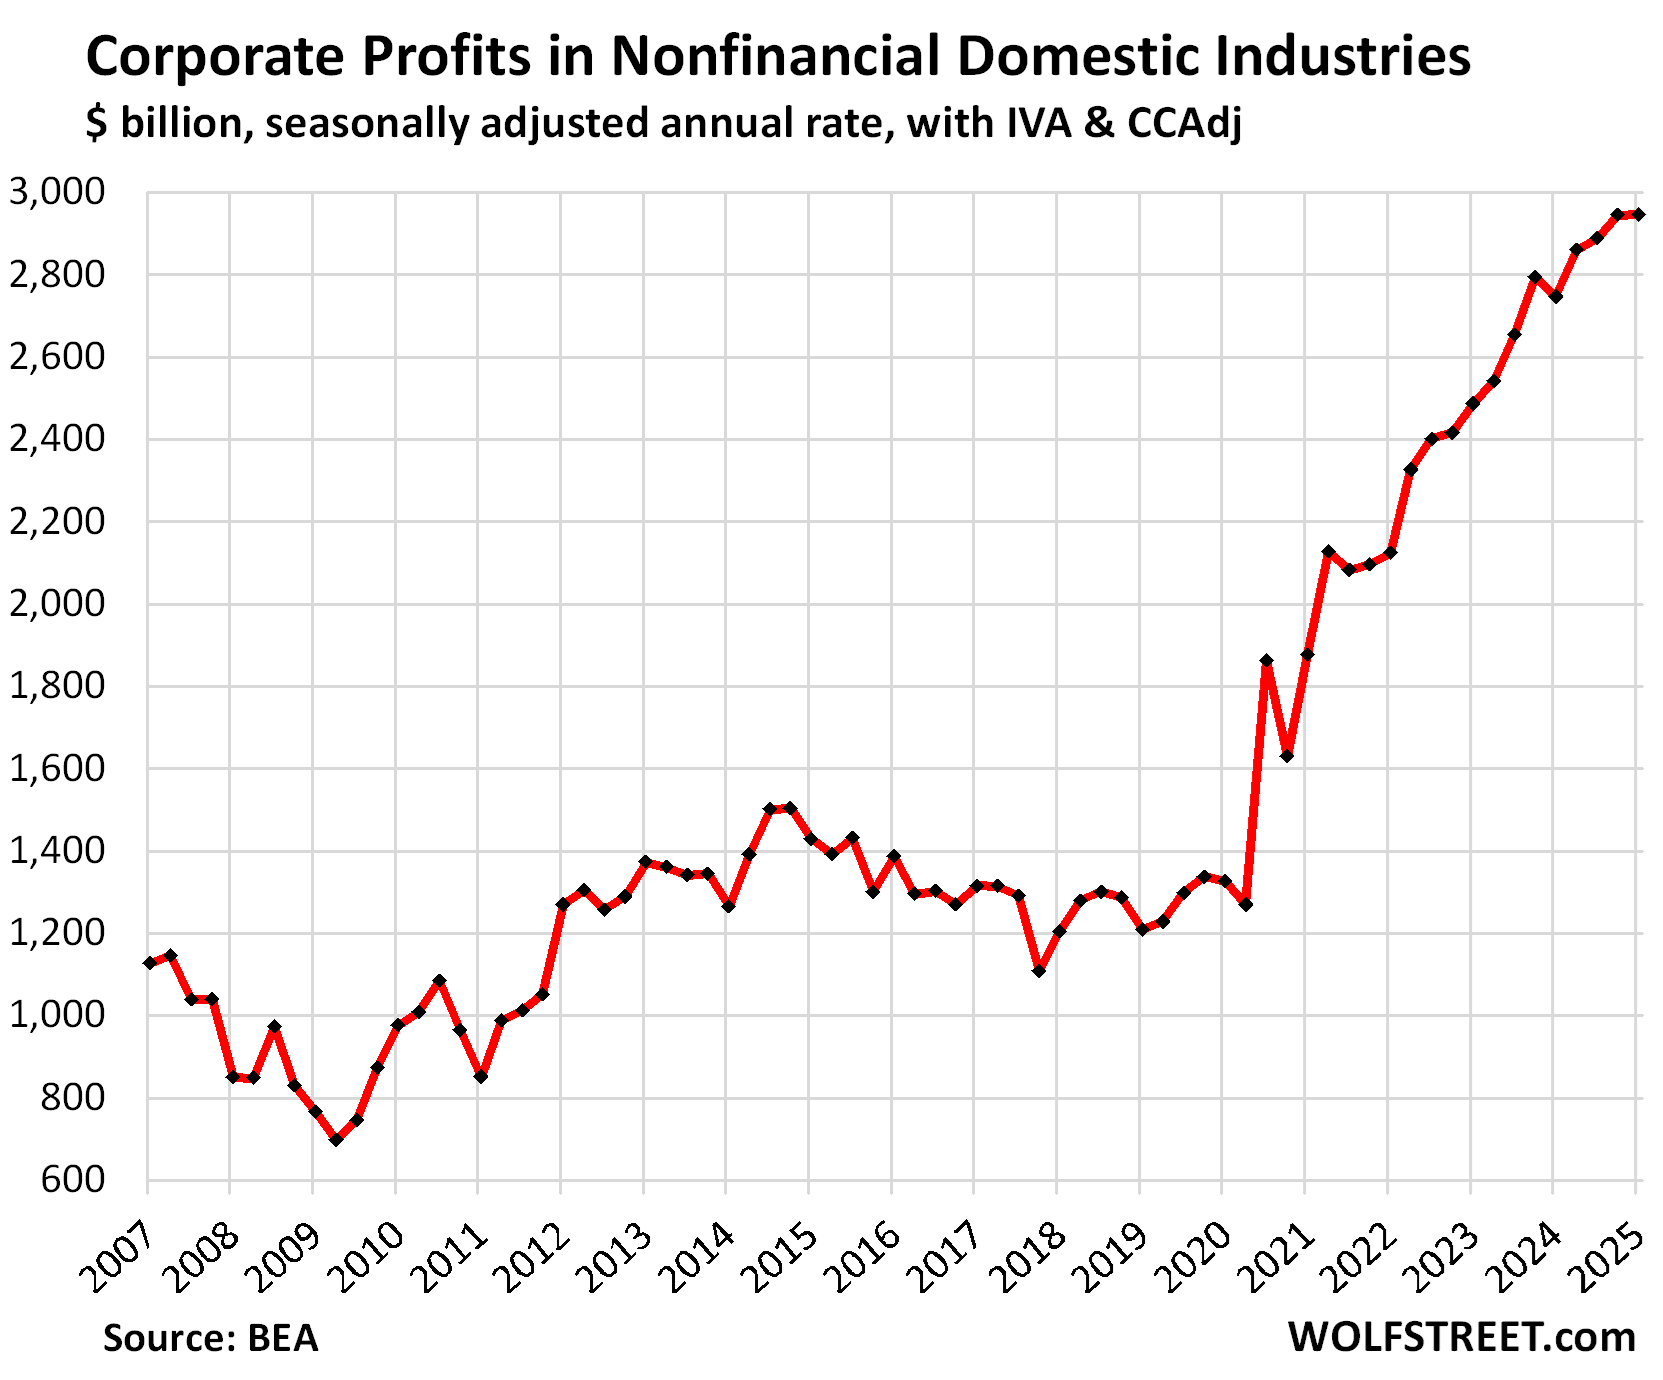
In nonfinancial domestic industries, pretax profits of incorporated businesses of all sizes edged up by just 0.1% in Q1, to a seasonally adjusted annual rate of $2.95 trillion. Year-over-year, profits were still up by 7.9%, due to the surge last year.
This category includes all businesses except financial firms. More on the individual categories of nonfinancial firms in a moment.
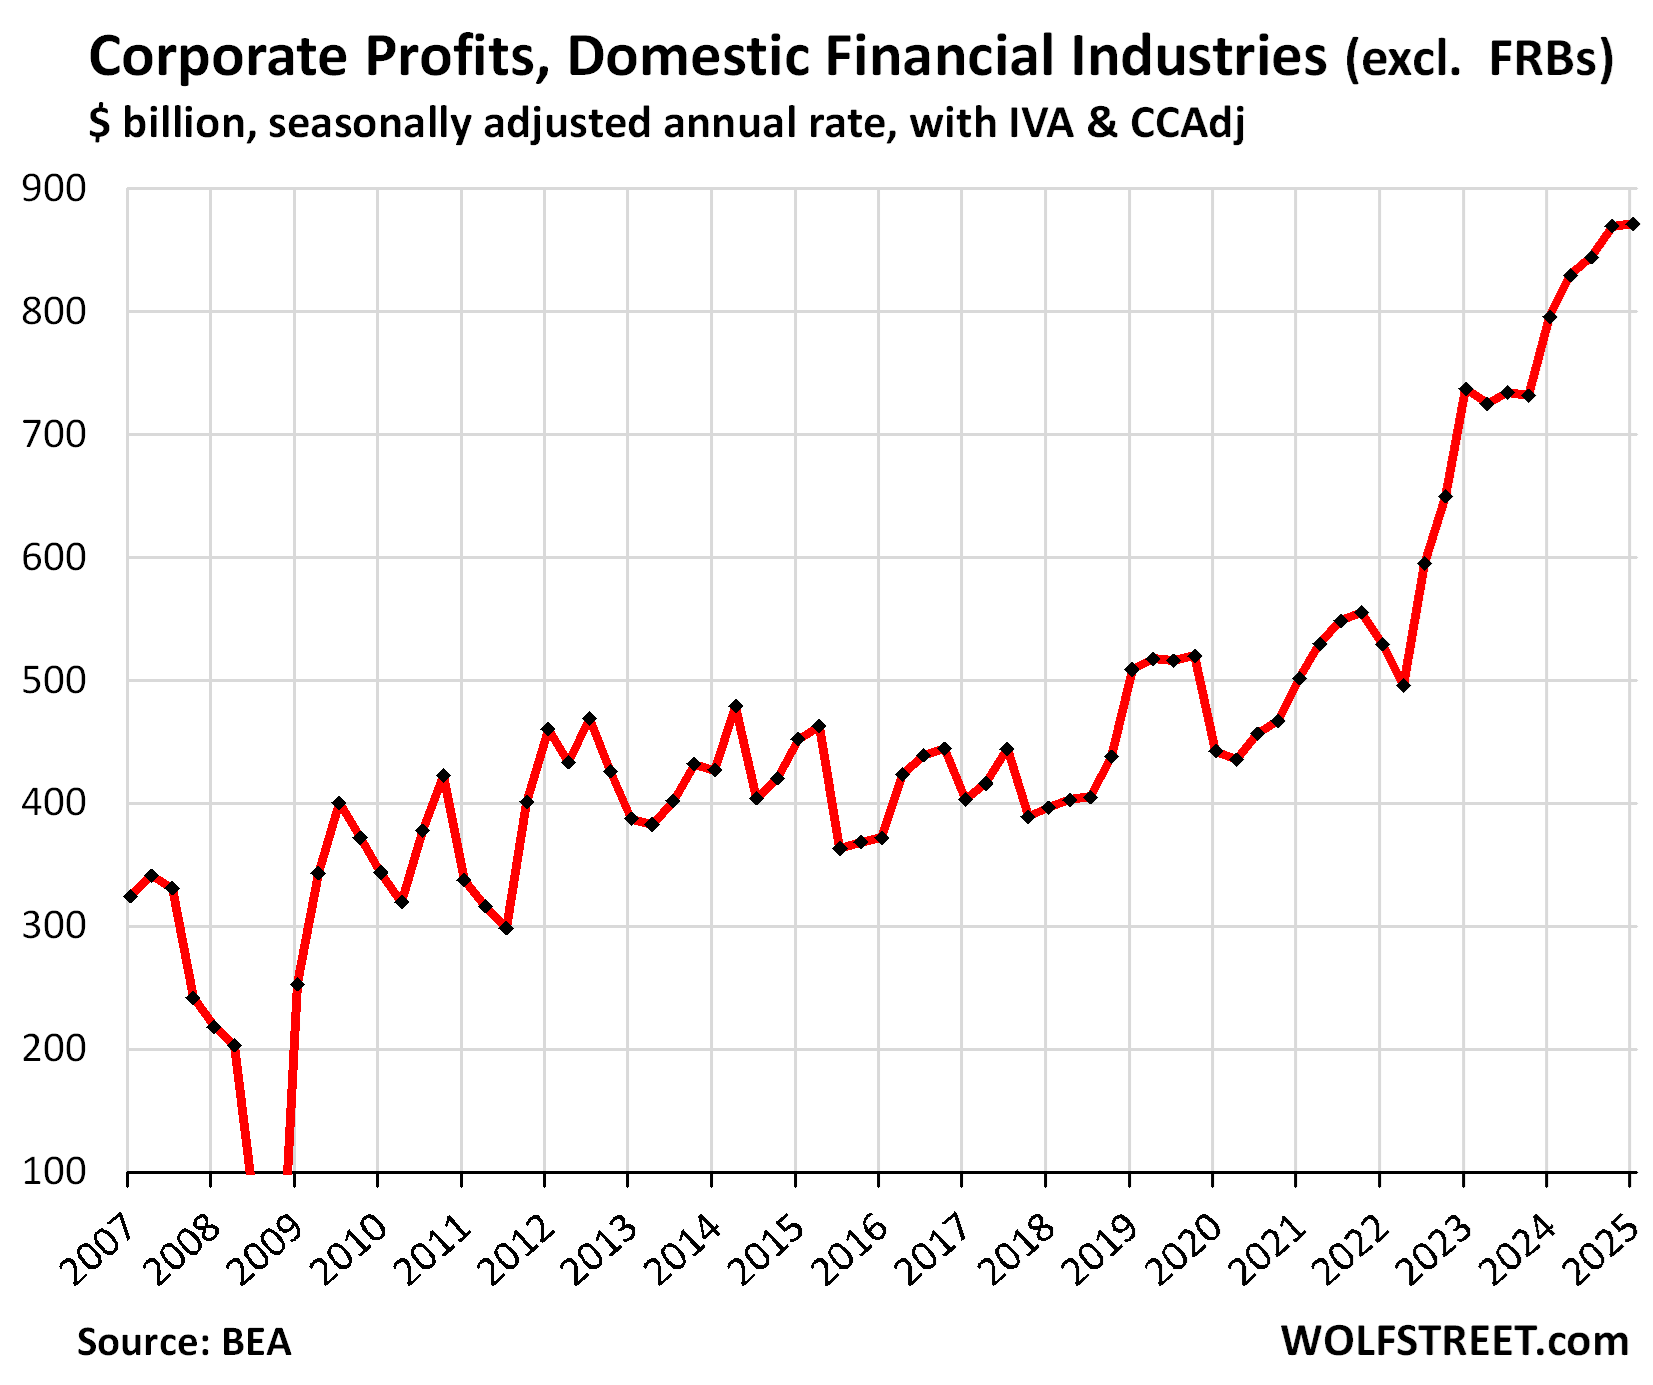
In financial domestic industries, pretax profits edged up by just 0.2%, to a seasonally adjusted annual rate of $872 billion.
The category includes banks and bank holding companies, firms engaged in other credit intermediation and related activities; firms engaged in securities, commodity contracts, and other financial investments and related activities; insurance carriers; funds, trusts, etc. But it does not include the 12 regional Federal Reserve Banks (FRBs).
These are pre-tax profits “from current production” by all businesses that have to file corporate tax returns, including LLCs and S corporations, plus some organizations that do not file corporate tax returns. The BEA obtains this information from IRS income tax data and from financial statements filed with the SEC.
The profit explosion fueled the high-inflation period. High inflation by definition means companies can and do raise their prices by a lot without losing sales. This kind of sudden “pricing power,” when it occurs, spreads like wildfire because it immediately inflates profits.
During the high-inflation years, companies could raise prices willy-nilly because consumers were willing to pay whatever, loaded up as they were with free money from stimulus funds, PPP loans, mortgage and student-loan forbearance, eviction bans, all kinds of tax credits, etc.
Faced with higher prices, workers in turn clamored for higher wages, and they started massively changing jobs to get those higher wages. Companies, having discovered their pricing power, were then willing to pay higher wages to keep and attract talent.
The phenomenon that consumers were suddenly willing to pay whatever, starting in late 2020, caused companies to jack up their selling prices while they were also willing to pay somewhat higher prices to their suppliers and somewhat higher wages to their employees. And on the difference, pretax profits blew out.
But recently, at least some price resistance has set in, to where raising prices entails the risk of losing sales.
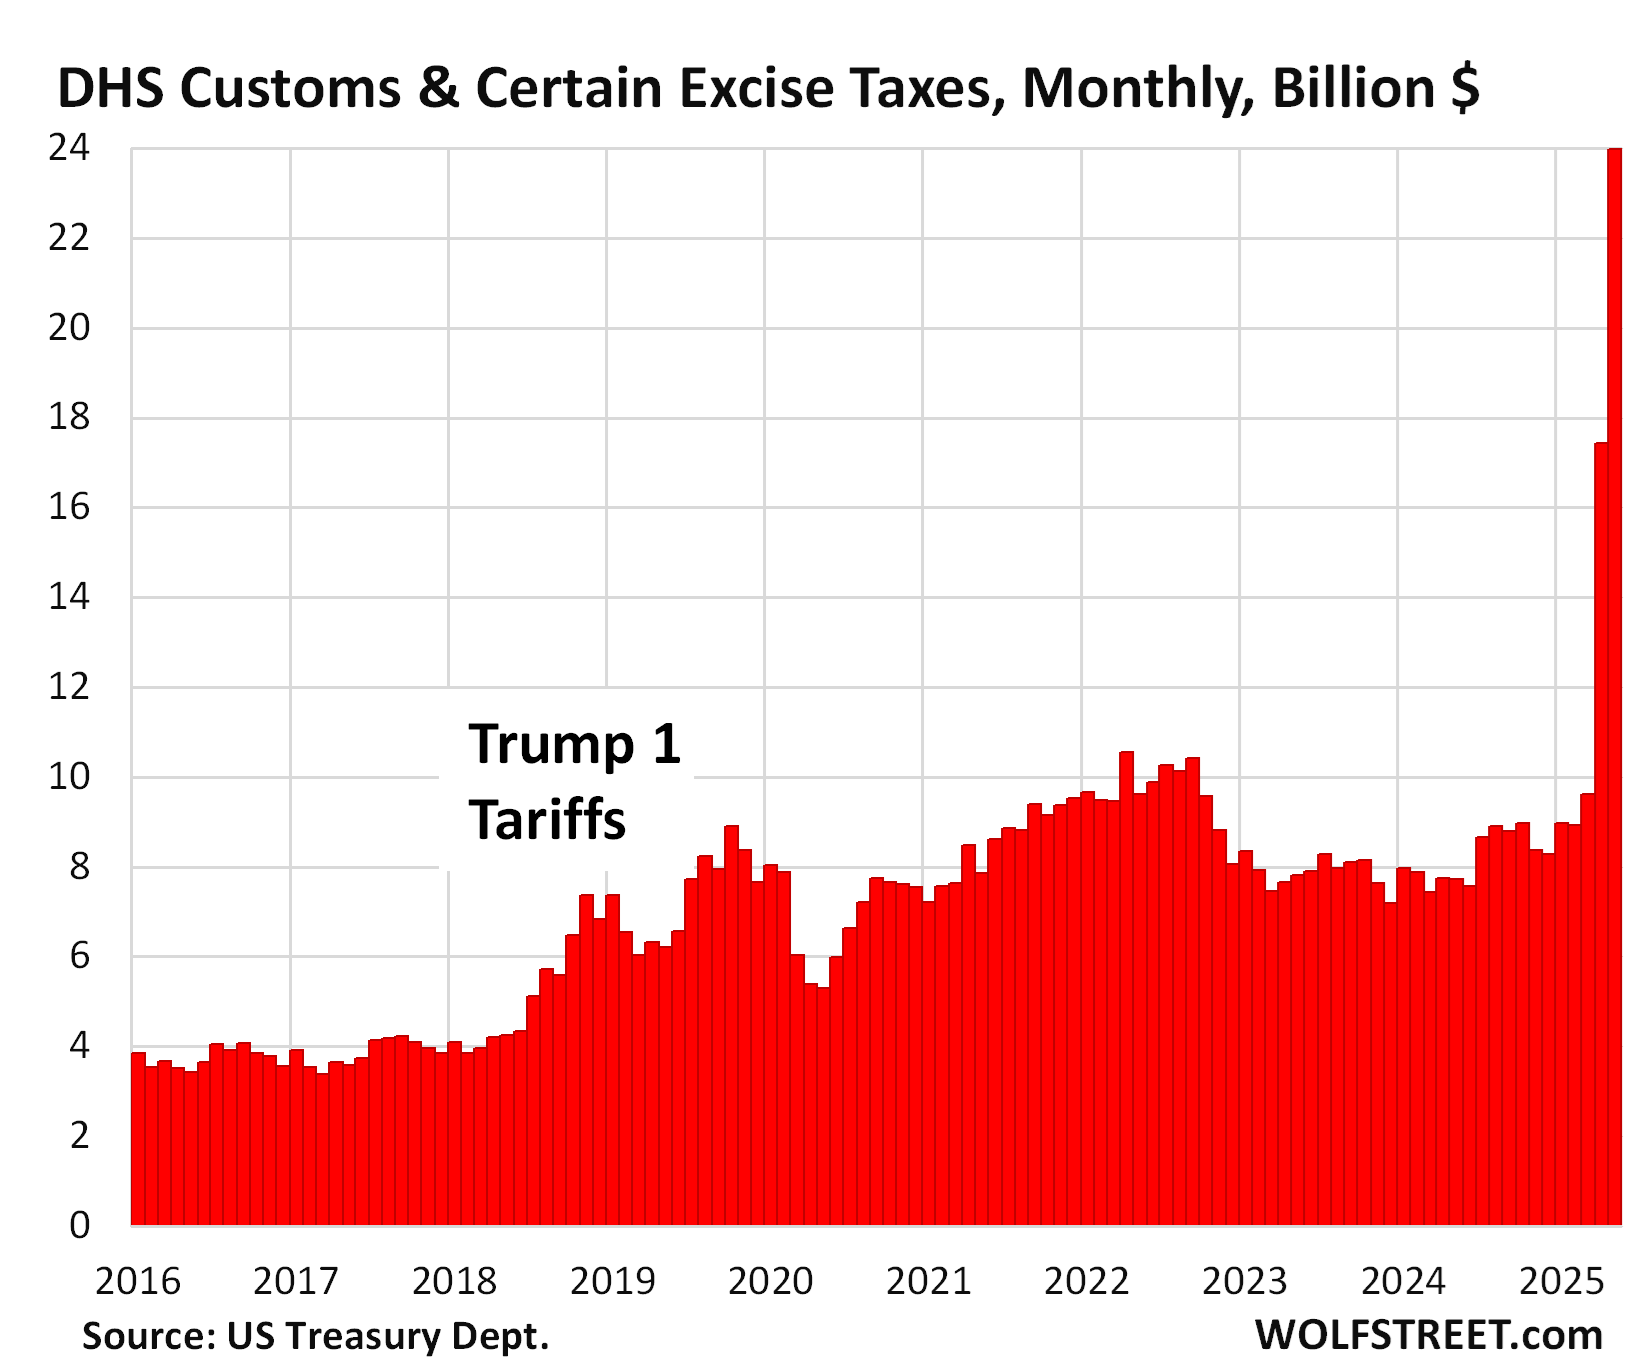
Q1 was still before the new tariffs were paid. The tariff payments by importers to the government started to surge in April and spiked further in May, which will hit Q2 profits of the companies that import tariffed goods. We discussed the monthly cash flow from tariffs here.
Companies have not yet been able to pass the tariffs on to consumers, as of the May inflation data. In Q2 so far through May, tariffs were paid out of corporate profits, not by consumers. We don’t know yet about June’s inflation data. But companies overall have lots of room to eat the tariffs, given the gigantic profits they obtained by jacking up prices since 2020.
Corporate profits by major industry.
“Other nonfinancial” industries: This is the biggest category by profits, with huge industries: construction; professional, scientific, and technical services (includes some tech and social media companies); healthcare and social assistance; real estate and rental and leasing; accommodation and food services; mining and oil-and-gas drilling; administrative and waste management services; educational services; arts, entertainment, and recreation; agriculture, forestry, fishing, and hunting.
Profits jumped by 3.1% quarter over quarter and by 7.3% year-over-year, to a seasonally adjusted annual rate of $1.07 trillion.

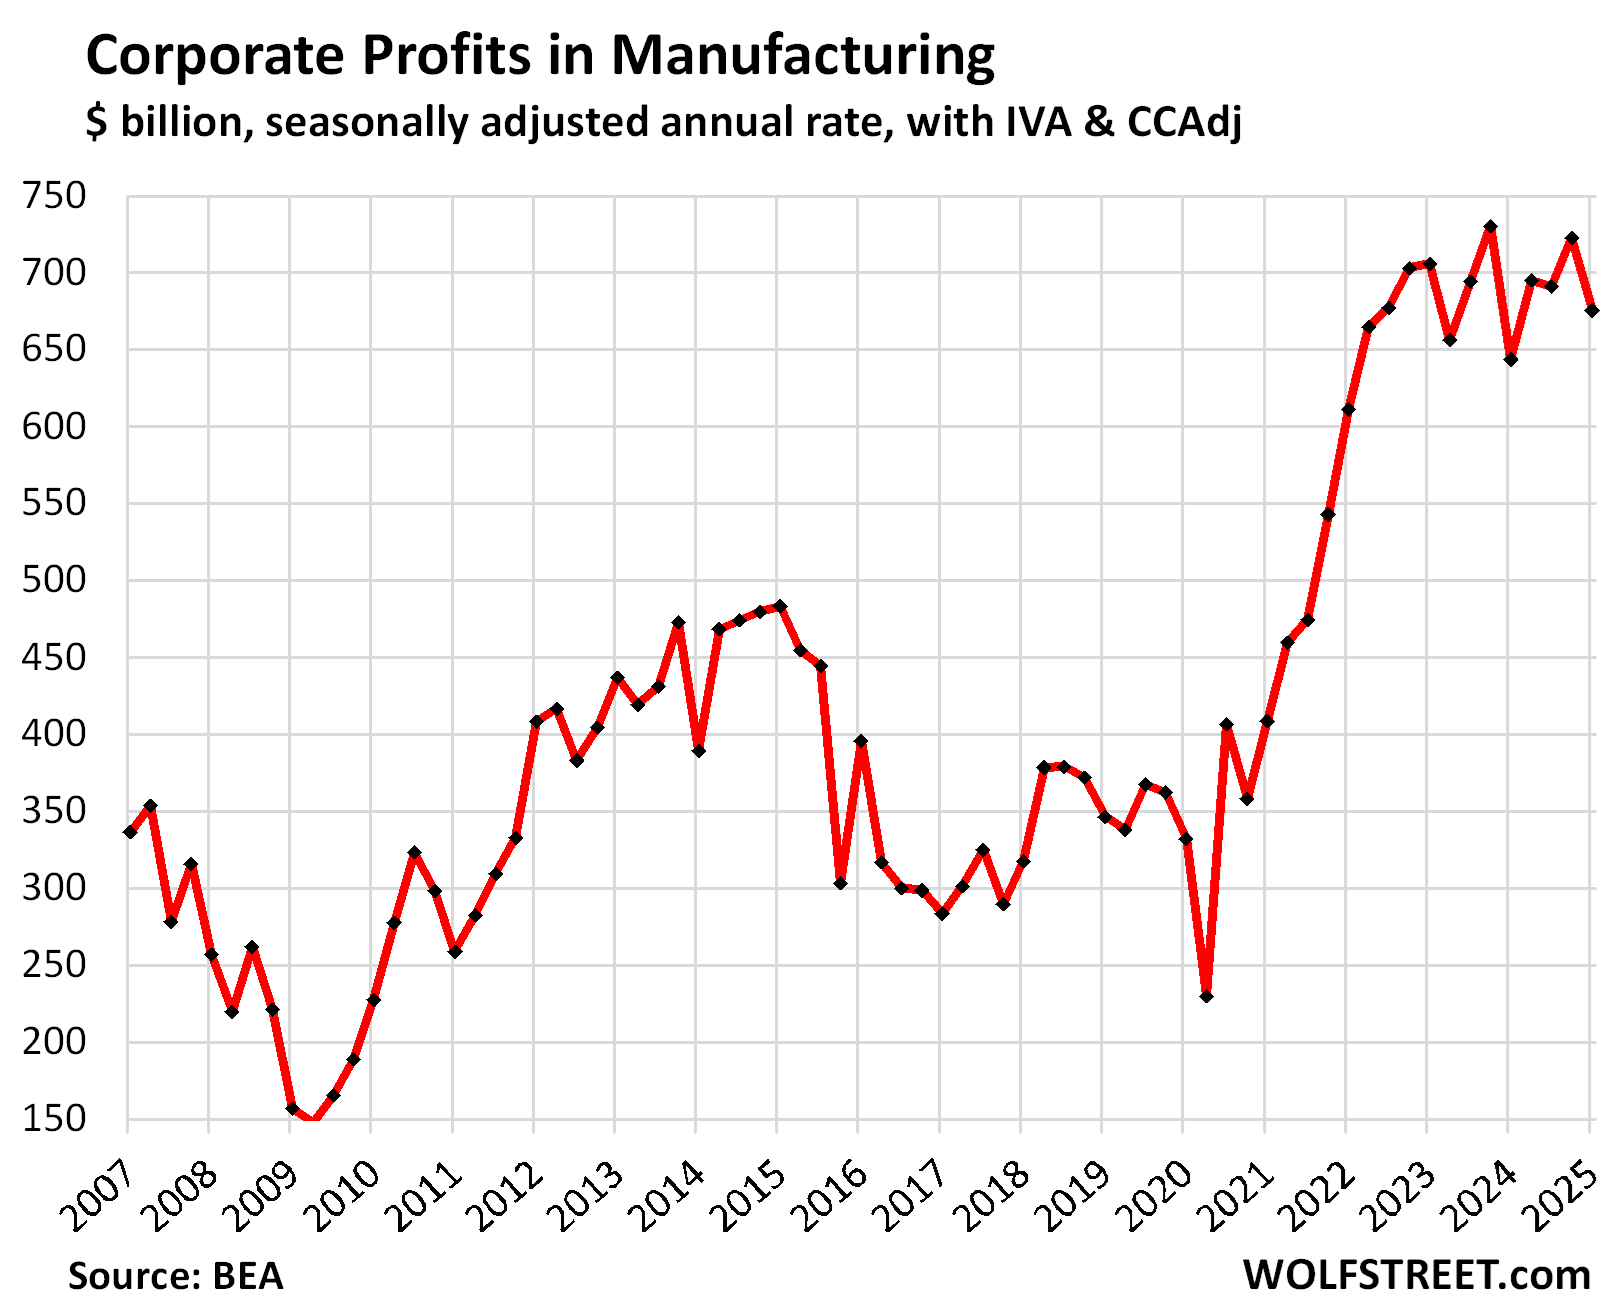
Manufacturing industries: Profits fell by 6.5% in Q1 from Q4, to a seasonally adjusted annual rate of $675 billion, but year-over-year, were still up by 4.8%.
This includes manufacturing of durable goods (computers, electronics, electrical equipment, appliances, motor vehicles, trailers, machinery, fabricated metals, components, etc.) and nondurable goods (food, beverages, supplies, petroleum products, chemical products, coal products; etc.).
Since 2019, profits in the manufacturing industries have doubled.
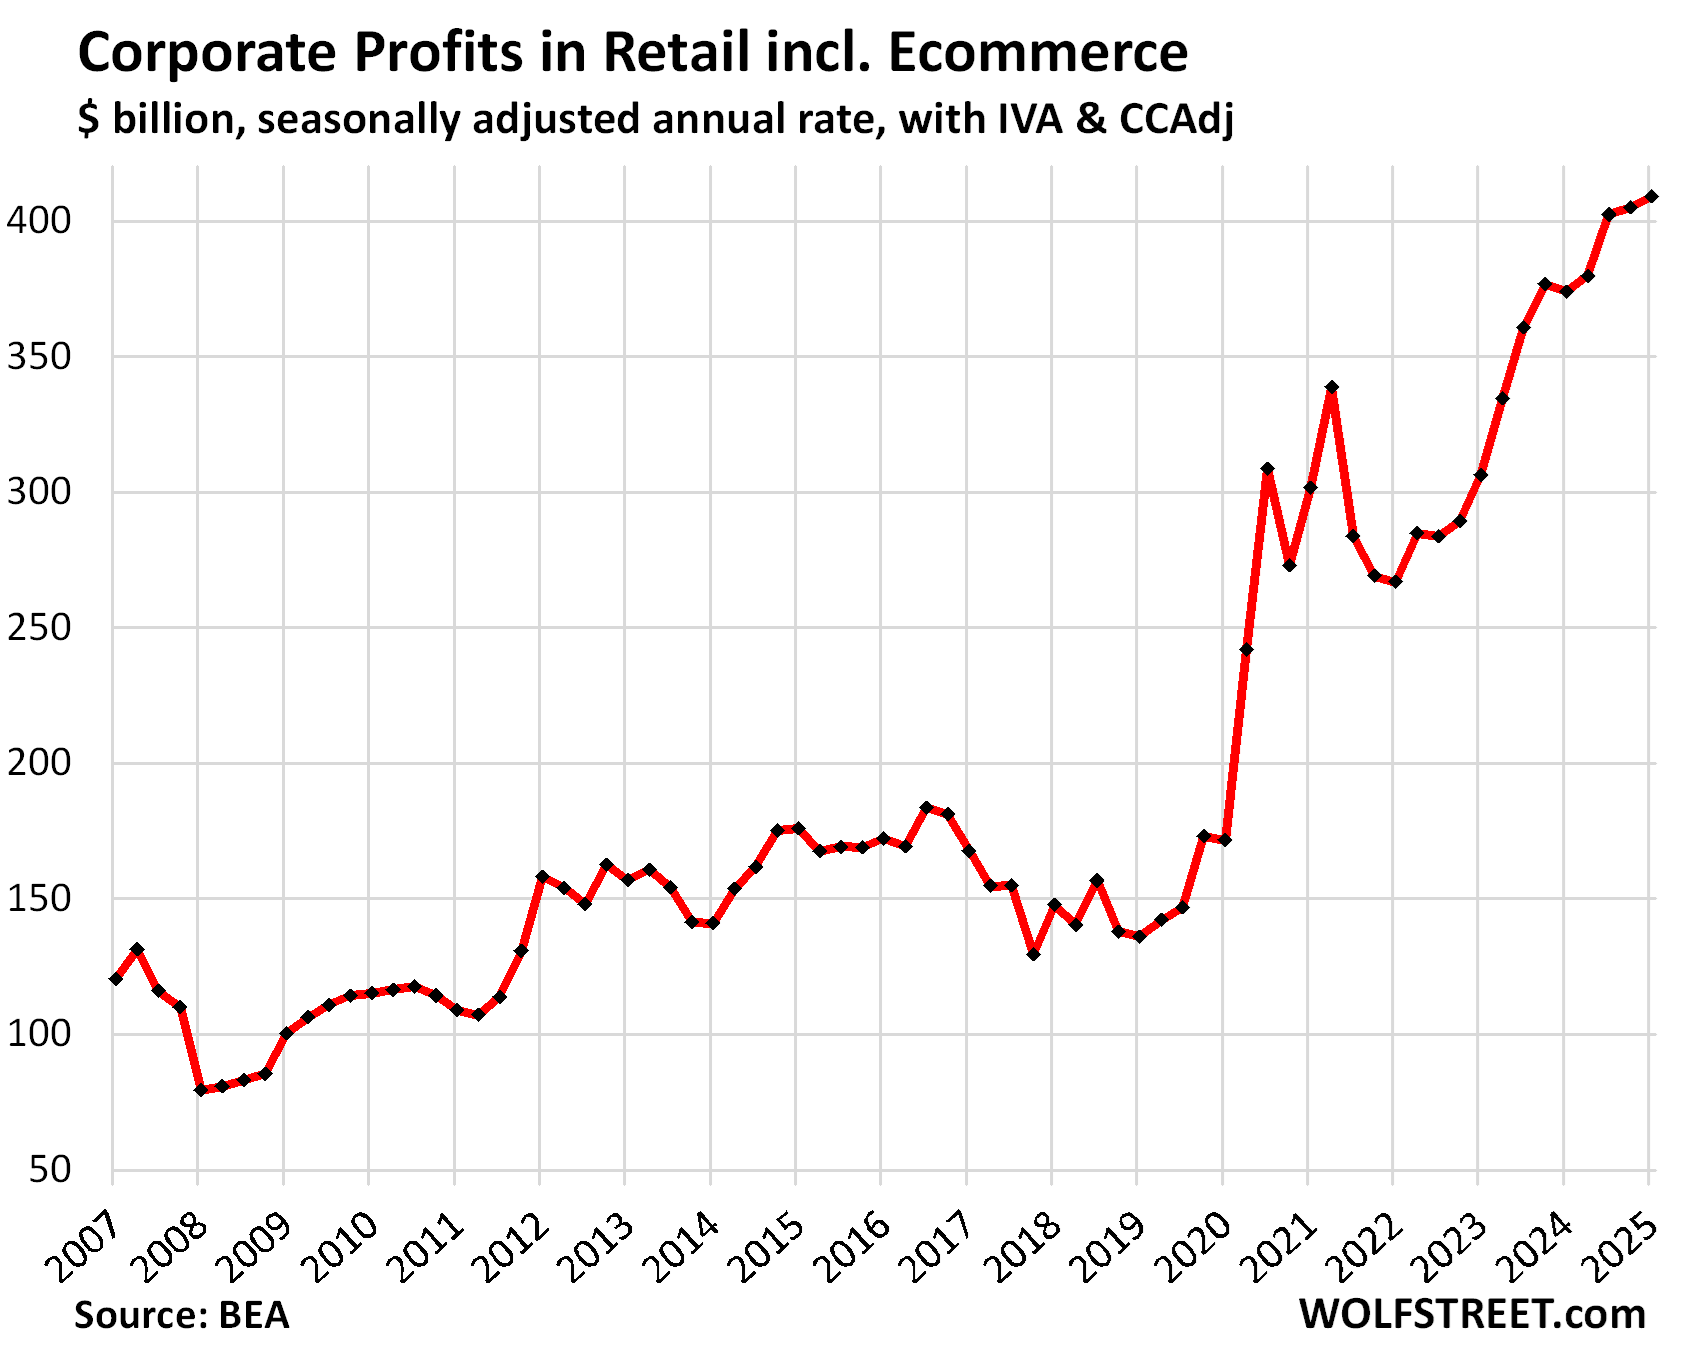
Retail trade, including Ecommerce: Profits rose by 1.0% in Q1 from Q4 and by 10.5% year-over-year, to a seasonally adjusted annual rate of $409 billion, up 138% since Q1 2020:
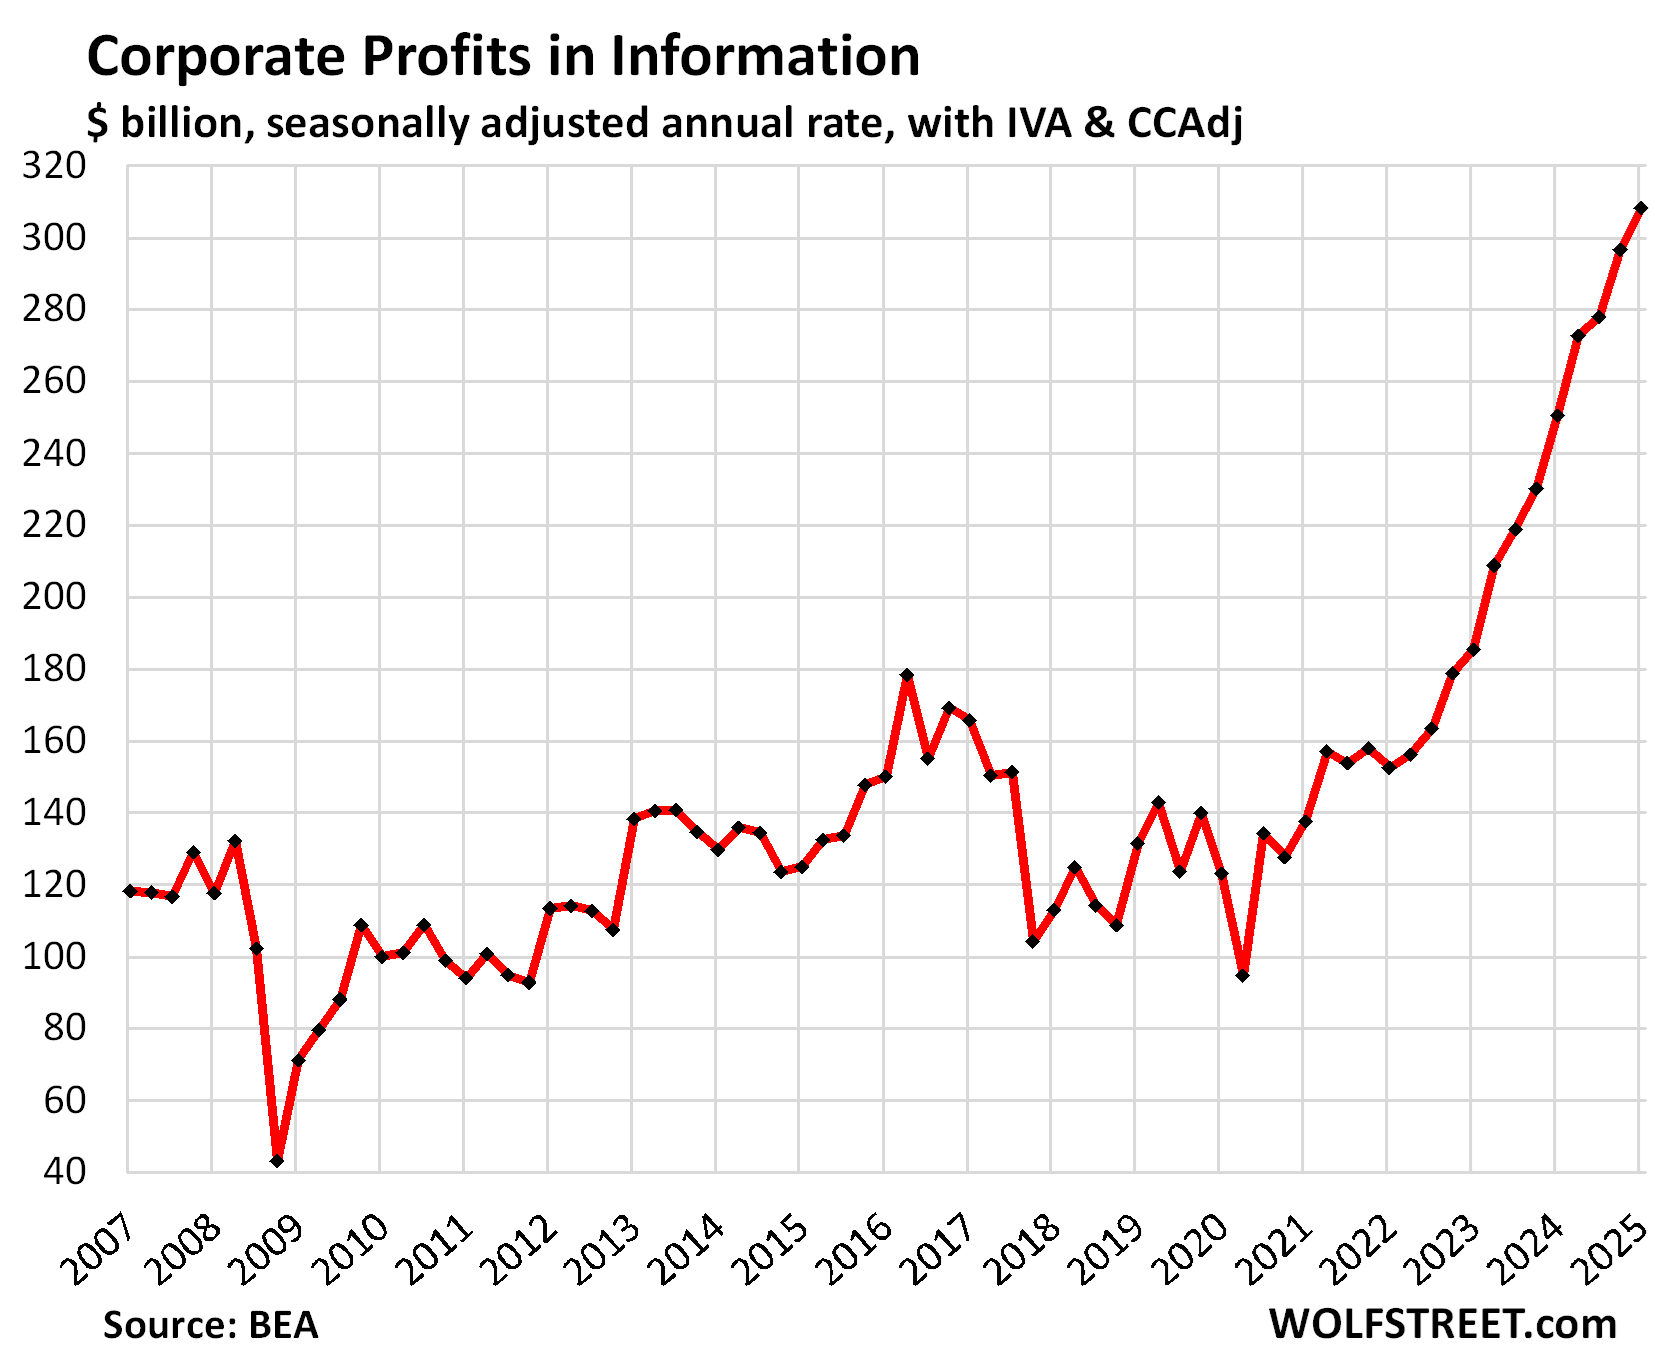
Information: Profits jumped by 3.9% in Q1 and by 27.6% year-over-year, to a seasonally adjusted annual rate of $308 billion. Since Q1 2020, profits have spiked by 150%.
The category includes businesses engaged in web search portals, data processing, data transmission, information services, software publishing, motion picture and sound recording, broadcasting including over the Internet, and telecommunications.
This is a small industry in terms of employees, but with outsized profits.
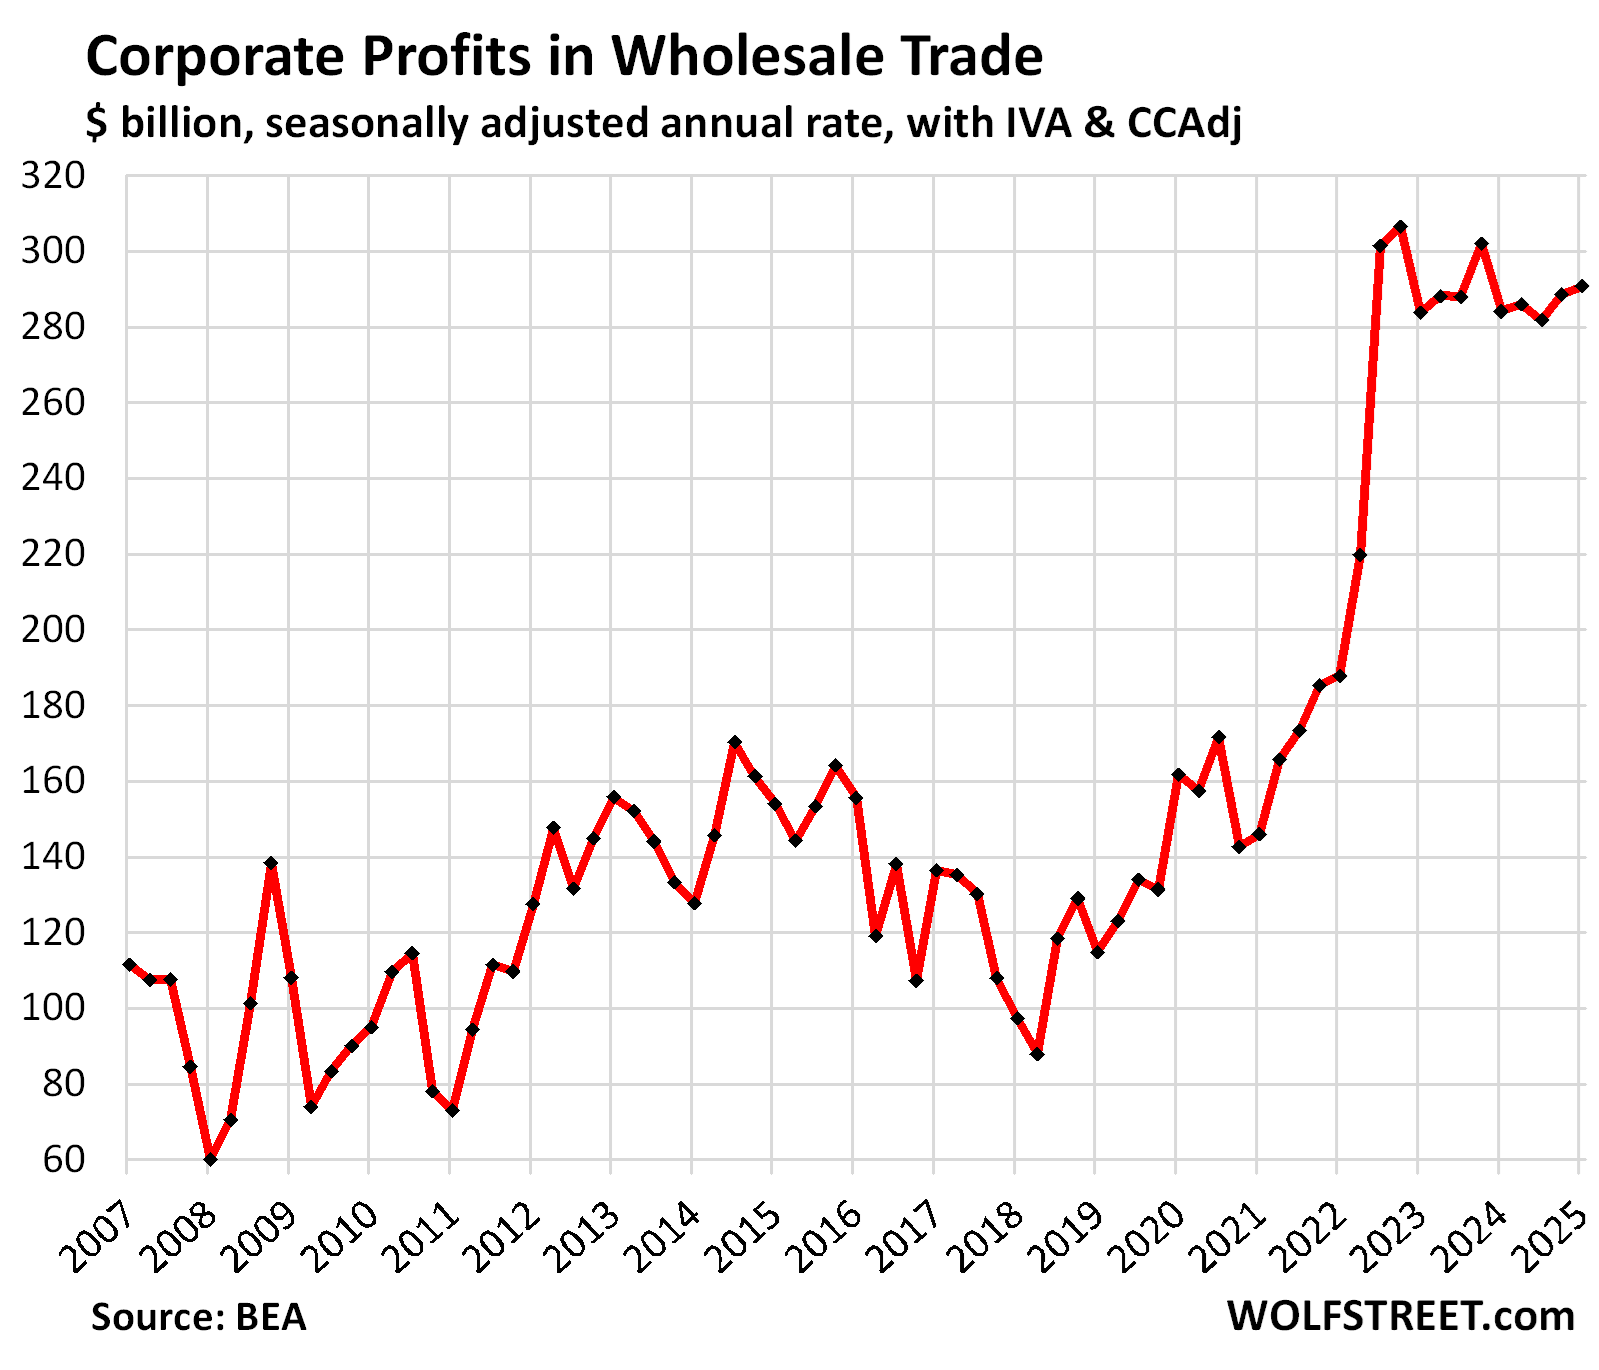
Wholesale trade: Profits rose by 0.8% in Q1, and by 2.3% year-over-year, to a seasonally adjusted annual rate of $291 billion. Since Q1 2020, profits have surged by 80%.
Transportation & warehousing: Profits rose by 1.4% Q1, and by 3.0% year-over-year, to a seasonally adjusted annual rate of $133 billion. Since Q1 2020, which was the low point after a long decline, profits quadrupled (+304%). From the average levels in 2016, profits doubled.
![]()
On a technical note, these pre-tax profits “from current production” have been adjusted in three ways:
- “Inventory valuation adjustment” (IVA) removes profits derived from inventory cost changes, which are more like capital gains rather than profits “from current production.”
- “Capital consumption adjustment” (CCAdj) converts the tax-return measures of depreciation to measures of consumption of fixed capital, based on current cost with consistent service lives and with empirically based depreciation schedules.
- Capital gains & dividends earned are excluded to show profits “from current production,” rather than financial gains.
Enjoy reading WOLF STREET and want to support it? You can donate. I appreciate it immensely. Click on the mug to find out how:

![]()
Government deficit spending is sure awesome for corporations and their owners. And their politicians…… Until it doesn’t. When?
The CFO survey from Richmond Fed yesterday, definitely backs up the premise of profit declines mixed with passing on costs to consumers — who saw that happening?
The second quarter results suggest that CFOs expect heightened price and unit cost growth in 2025 and 2026. They also expect lower revenue growth than they did last quarter.
“The 40 percent of firms that cited tariffs as a pressing concern were more likely than their unconcerned peers to report reducing capital expenditures, passing through cost increases, and moving up purchases. Manufacturers were more likely than non-manufacturers to take action in response to tariffs.”
Truly eye opening. Profits tripling in 3-5 years is something that should never happen.
Plenty of room for the tariffs to work on behalf of the American people. A bit of a profit squeeze should be music to the ears of all of the socialist types out there but, not so much if you’ve been afflicted by TDS.
Yet it wasn’t enough for our drunk asset holders. They want more fuel to the fire with lower rates. They’ve grown addicted to ballooning asset prices at the expense of non-asset holders.
House Republican holdouts threaten revolt over spending bill…
Setback as Senate referee disqualifies key provisions…
Investors on Edge About a Potential Shadow Fed Chair…
Battered Dollar Takes Another Beating…
GDP revised lower on tepid consumer spending…
As usual, great information with a lot data to unpack. Just wanted to pass along some observations:
– One thing is for certain from the charts/graphs is that the impact of the Great Recession (2007 – 2009) and the Great Inflation/Stimulus (2021 – 2023) is clearly evident. Can you imagine the charts/graphs if the FED’s balance sheet didn’t more than double from 2020 through mid-2022 and the federal debt didn’t increase from $23 trillion in 2019 to $36 trillion in 2024? Talk about a case study in excessive monetary and fiscal stimulus.
– I completed some cowboy math (rough estimates) and calculated that the magnificent seven companies annual pre-tax income amounted to approximately $600 billion over the same period (Tesla being the dog as teh other six tech companies have blow out results). Compare this to roughly $3 trillion of pre-tax income (referenced in the article) and the ratio is 20%. Seven companies produce 20% of the pre-tax income. Wow, talk about concentration risk. It would be interesting to extract the pre-tax earnings from these companies and analyze the results.
– The charts/graphs presents only pre-tax earnings which take into consideration all expenses other than income taxes. Seeing that interest rates have been increasing for the past 2+ years, with the effect of interest rate increases probably becoming more visible over the past year (as lower cost debt is rolled over and variable debt rates adjust), it would be interesting to evaluate the impact on rising interest rates on the non-financial business sector of the economy.
– Interestingly enough, the CAGR of net pre-tax income from 2007 through 2025 amounts to roughly 5.37% for the non-financial business sector. This compares to a CAGR of approximately 8% in the S&P 500 for the same period. Over almost 18 years, the 5.37% average annual return appears reasonable but again, the bump in this figure over the last four years (from 2021 through 2024) has been huge. If you look at the data from 2007 through 2020, the pre-tax income figures barely budged (from $1.15 million to $1.25 million, hardly impressive).
– Last comment. I see no proof what so ever that using monetary (QE, ZIRP, etc.) and/or fiscal (tax cuts, grants/credits, etc.) policies stimulate the economy enough to help reduce the annual deficit and federal debt levels (via increasing tax receipts). From 2007 to 2025, the total federal debt has increased from approximately $9 trillion to $36 trillion, while the nominal annual USA GDP has increased from roughly $14 trillion to almost $30 trillion. That’s a pretty crappy ratio, $27 trillion increase in federal debt compared to $16 trillion of nominal GDP growth, a ratio of 1.69 to 1.00. During this period, pre-tax corporate profits from all companies have increased from roughly $1.5 trillion to approximately $3.8 trillion (eyeballing WR’s figures). I don’t have the figures for personal taxable wages but its safe to say that combining this increase along with the increase in companies earnings and then applying the marginal tax rates is not nearly sufficient to address the federal debt and annual deficits. My point is, every politician tells the same lie. Our tax cuts and stimulus policies will pay for themselves through increased business activity, earnings, and wage growth, driving higher income tax receipts. Yep, the oldest lie in the profession and complete BS.
There are some interesting patterns in when profits spiked in each category vs when inflation increased (and important to note that profits increased far more than inflation did).
For example, retail profits were the first to spike, nearly doubling by mid-2020, well before inflation started to increase. Next came transportation in late 2020 to early 2021. Then manufacturing in mid to late 2021, then trade in early 2022, and information and financial later in 2022. Inflation didn’t increase until mid-2021 and didn’t peak until mid-2022.
There’s an interesting story to be told about those relative timings.
Good observation!
Thank you, Wolf. People should know this.
China’s Xiaomi undercuts Tesla with yet another cheaper car
BEIJING — Chinese smartphone company Xiaomi is taking aim straight at rival Tesla
with a new electric SUV.
Xiaomi’s luxury YU7 SUV will start at 253,500 yuan ($35,322), CEO Lei Jun said Thursday, pointing out that the vehicle is 10,000 yuan cheaper than Tesla’s Model Y, which starts at 263,500 yuan in China.
Prior to the official price announcement, a Citi report had listed expectations that the YU7 SUV would be priced around 250,000 yuan to 320,000 yuan ($34,800 to $44,590), forecasting monthly sales of about 30,000 units. Once the pace picks up, Citi predicts annual sales of 300,000 to 360,000 units.
Xiaomi’s company’s SU7 sedan launched last year was also priced below Tesla’s Model 3.
Stocks just made the round trip from Liberation day. We will see how stocks respond to Q2 earnings in few weeks. If the trend in Wolf’s article holds true then I am wondering how companies will beat their earnings estimate.