Austin, Oakland, New Orleans, San Francisco, Washington D.C., Denver, Portland, Phoenix, Fort Worth, San Antonio.
By Wolf Richter for WOLF STREET.
There are different housing market dynamics among big cities in terms of mid-tier single-family homes: Some big cities have been showing price declines for some time, and in 10 of them, the price declines have turned more serious, seasonally adjusted, after the gigantic price explosion over the prior few years. But other big cities show continued price increases; or flat prices around the high; or the first declines after big surges.
Five of these big cities had double-digit price declines from their peaks in mid-2022 through May, two of which over 20%, seasonally adjusted. Other cities had similar price declines of mid-tier single-family homes, such as Birmingham, AL (-14%). But the cities are too small to qualify for this big-city list. Five more big cities had price declines of around 8% to 9% from their peaks in mid-2022 through May:
- Austin: -22.1%
- Oakland: -20.3%
- New Orleans: -18.1%
- San Francisco: -15.3%
- Washington DC: -10.8%
- Denver: -9.0%
- Portland: -8.9%
- Phoenix: -8.8%
- Fort Worth: -7.7%
- San Antonio: -7.6%
Prices in all of these 10 big cities in May fell month-to-month and year-over-year.
Single-family home prices are not sliding down the slippery slope as fast as condo prices have been sliding, which I discussed a few days ago: The Condo Bust Is Here: Prices Dropped Already 10% to 23% in 20 Bigger Cities, Unravel the Most Splendid Condo Bubble Ever.
These prices here are seasonally adjusted three-month moving averages of “mid-tier” single-family homes in “cities” – not in metros, or Metropolitan Statistical Areas. The values are from the Zillow Home Value Index (ZHVI), which is based on millions of data points in Zillow’s “Database of All Homes,” including from public records (tax data), MLS, brokerages, local Realtor Associations, real-estate agents, and households across the US. It includes pricing data for off-market deals and for-sale-by-owner deals. These are not median prices.
The 10 Big Cities with the biggest price declines.
In the little tables for each city below, note the sharp month-to-month drops – a sign that the declines are heating up (the drops are not seasonal because the index is seasonally adjusted).
The metrics in each table from left to right: price decline from the peak, change from prior month (MoM), change year-over-year (YoY), and increase since January 2000.
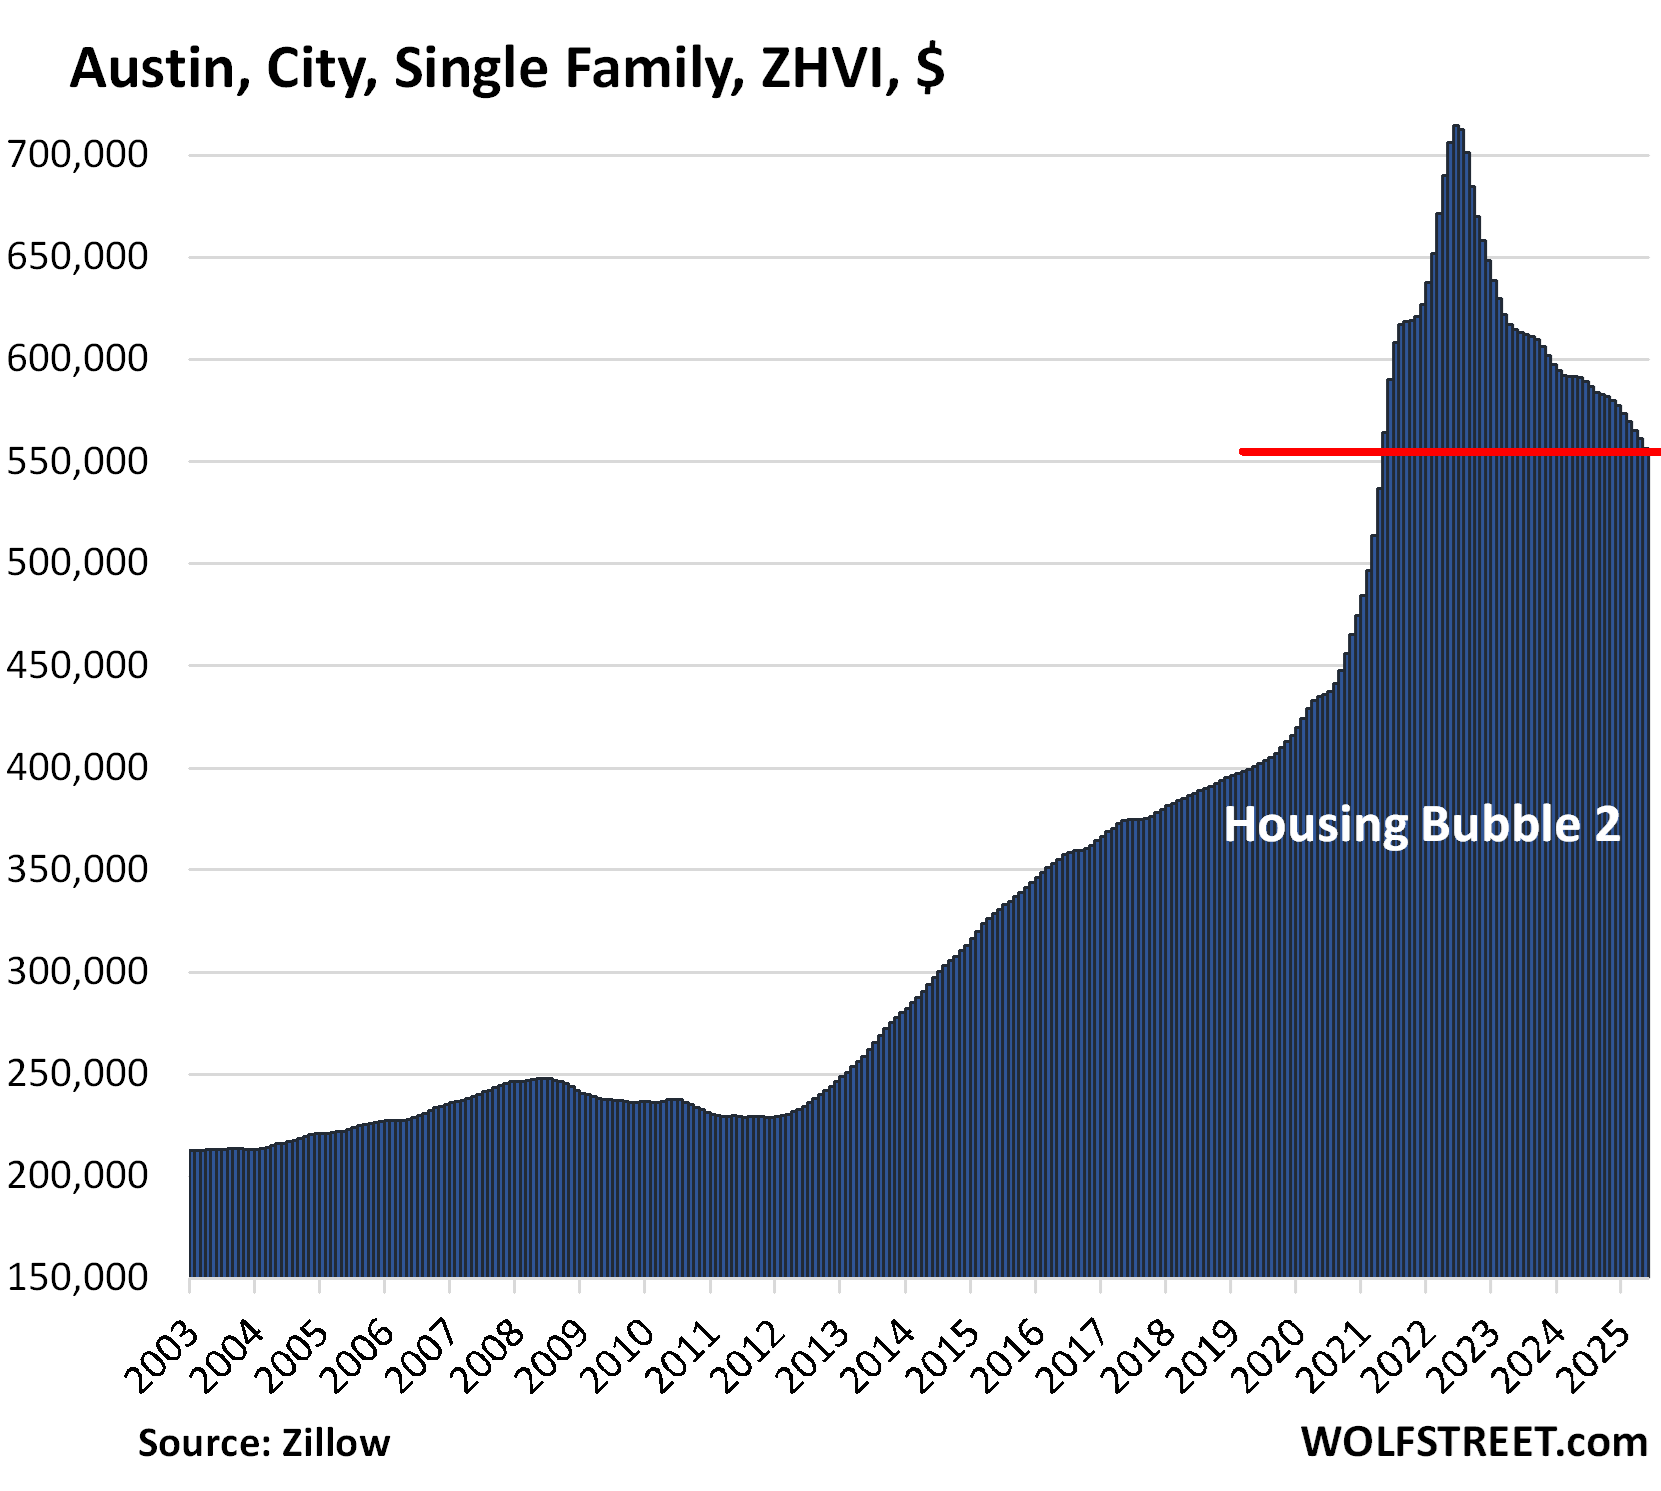
| Austin, City, Single-Family Home Prices | |||
| From Jun 2022 peak | MoM | YoY | Since 2000 |
| -22.1% | -0.8% | -5.9% | 172% |
Prices in the city of Austin are back where they’d first been in May 2021. They exploded on the way up but are much slower-moving on the way back down.
In the two years from mid-2020 through mid-2022, prices in the city of Austin had exploded by 64%, which was nuts. This price explosion in Austin and across the US shows that something went seriously wrong with the Fed’s monetary policies at the time, and we know what: Buying trillions of dollars of Treasury securities and mortgage-backed securities and leaving short-term policy interest rates at near zero for way too long. But now the Fed is doing the opposite: it shed $2.3 trillion in securities so far via its QT program and has been sticking to its 4%-plus policy rates.
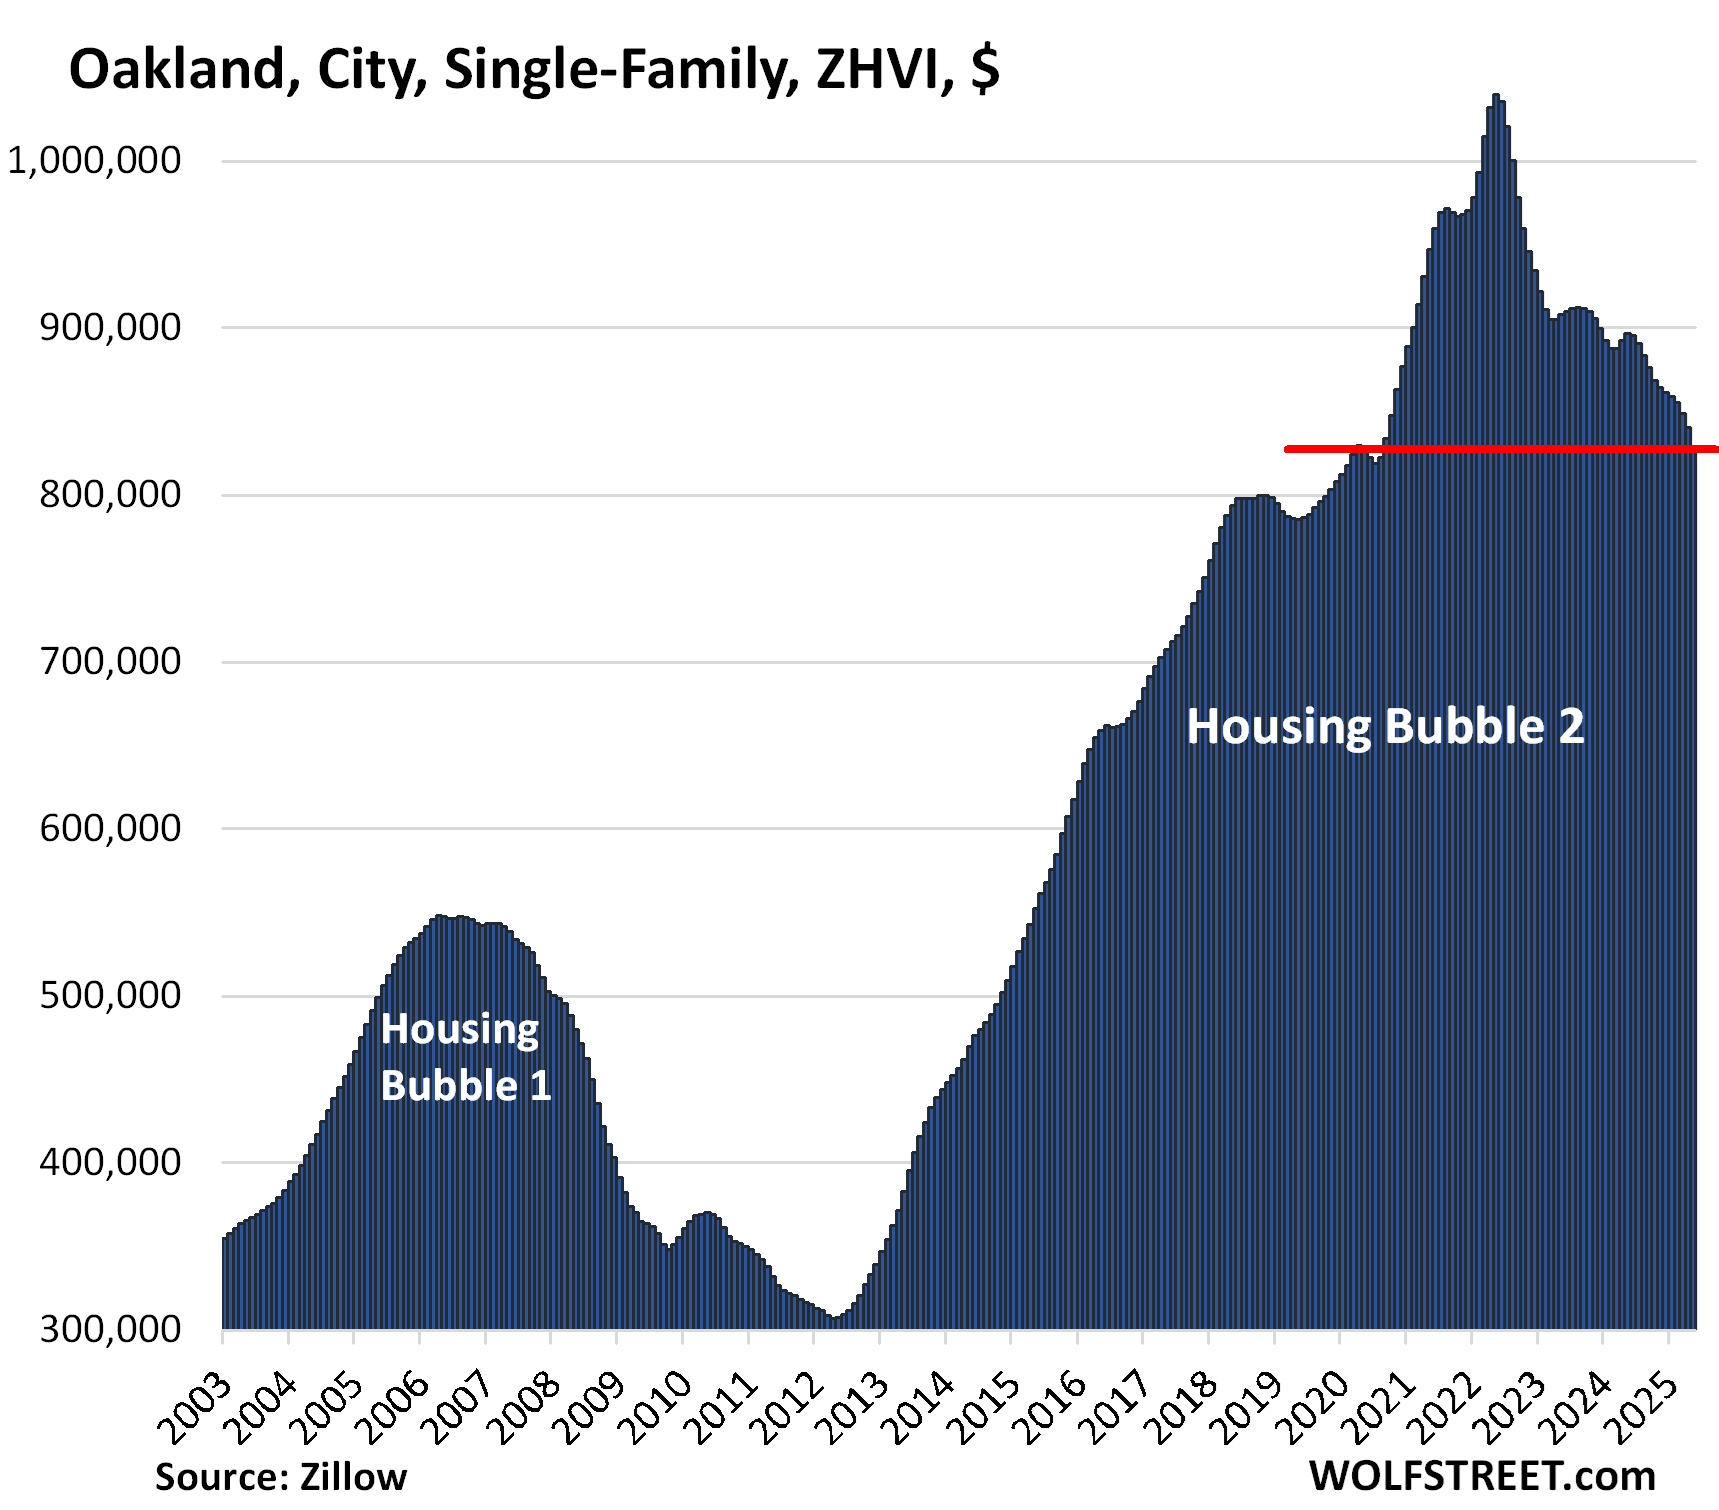
| Oakland, City, Single-Family Home Prices | |||
| From May 2022 peak | MoM | YoY | Since 2000 |
| -20.3% | -1.4% | -7.6% | 297% |
Note the month-to-month drop of -1.4%, seasonally adjusted, which is substantial. Prices are back where they’d first been in March 2020. In the decade between mid-2012 and the peak in May 2022, prices had exploded by 236%, which was nuts.
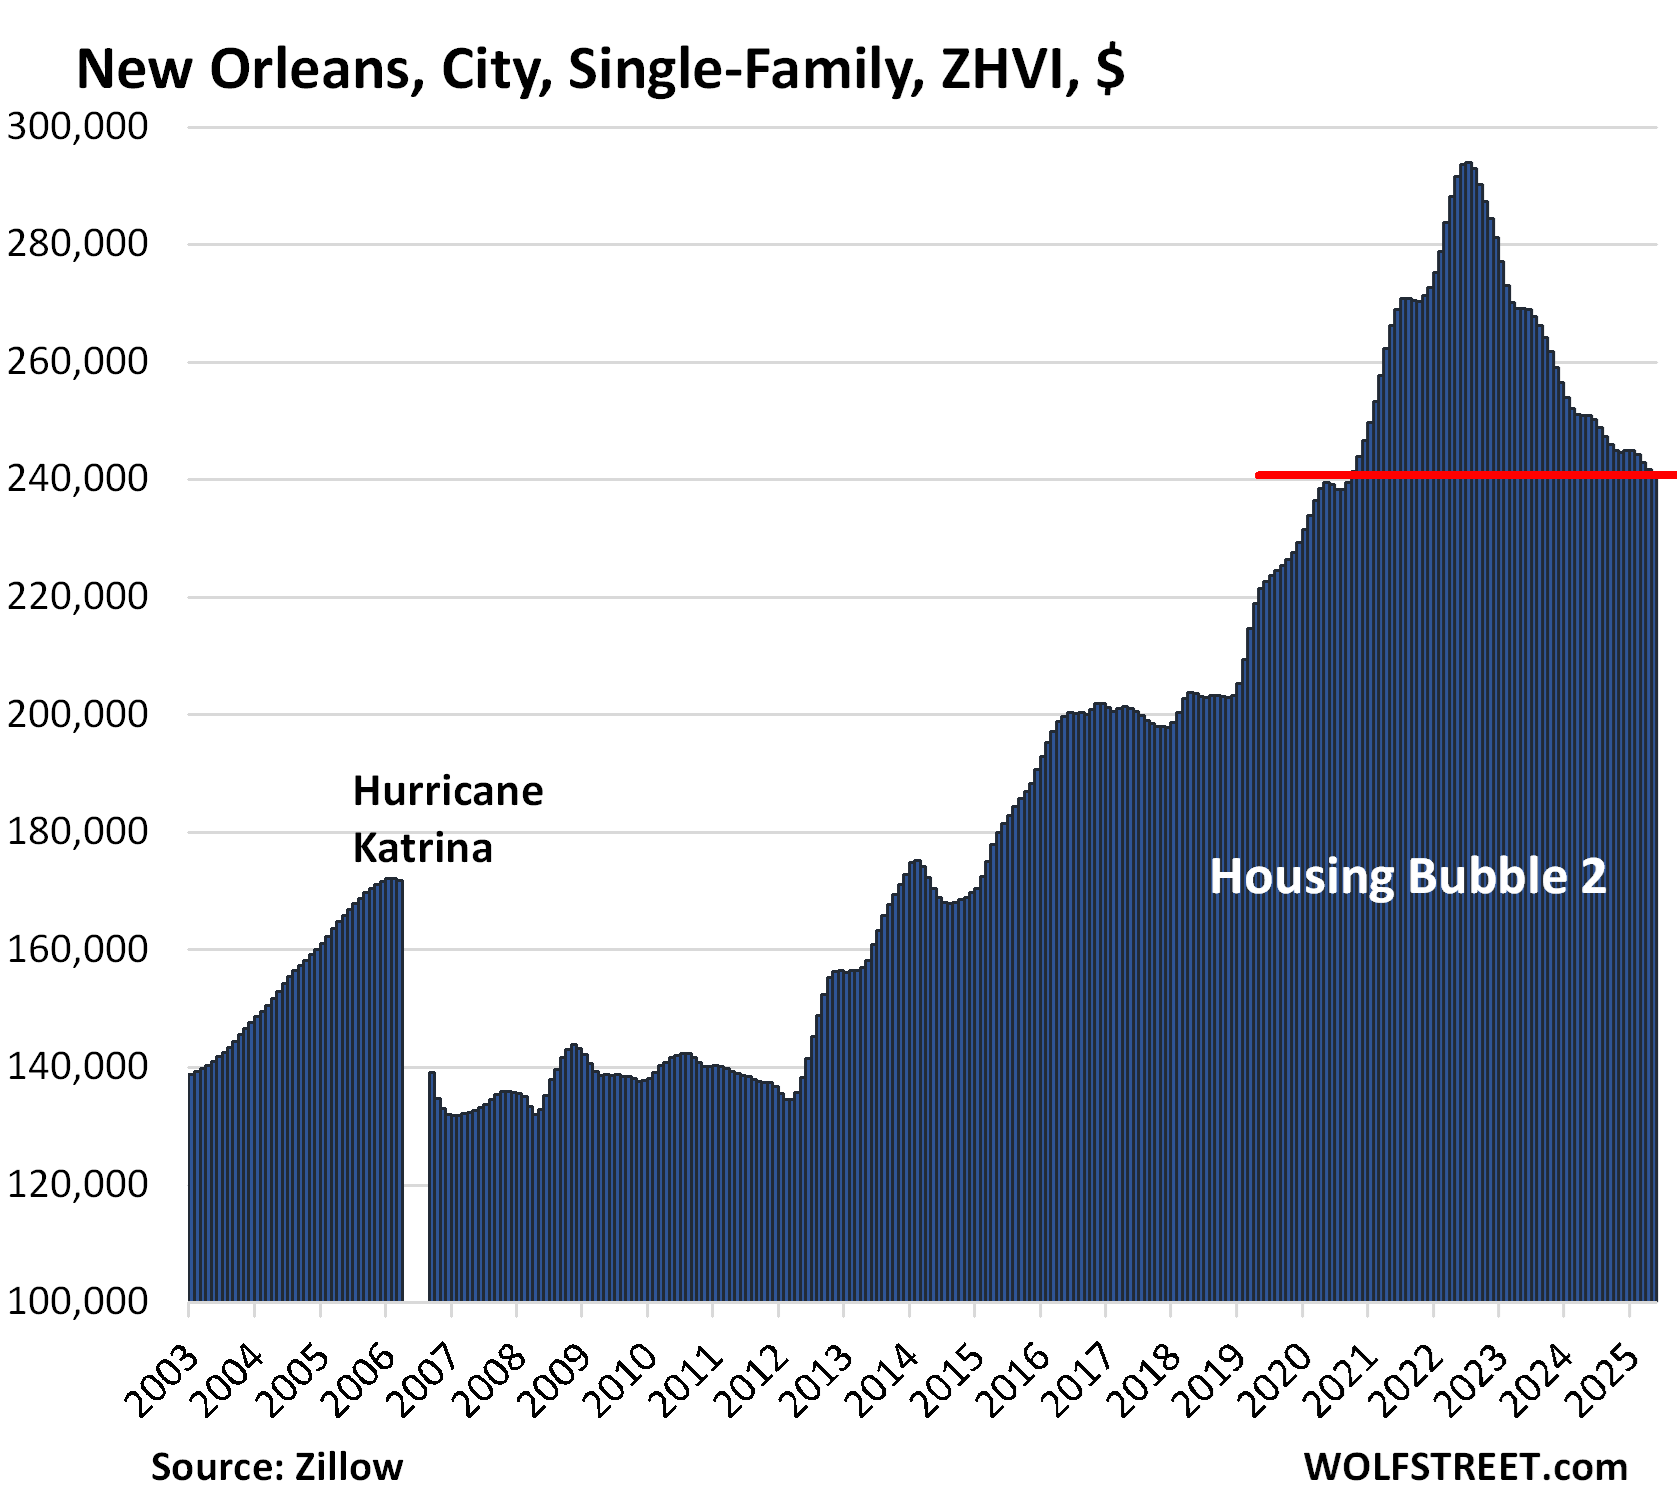
| New Orleans, City, Single-Family Home Prices | |||
| From Jun 2022 peak | MoM | YoY | Since 2007 |
| -18.1% | -0.4% | -4.1% | 109% |
Prices are back where they’d first been in September 2020.
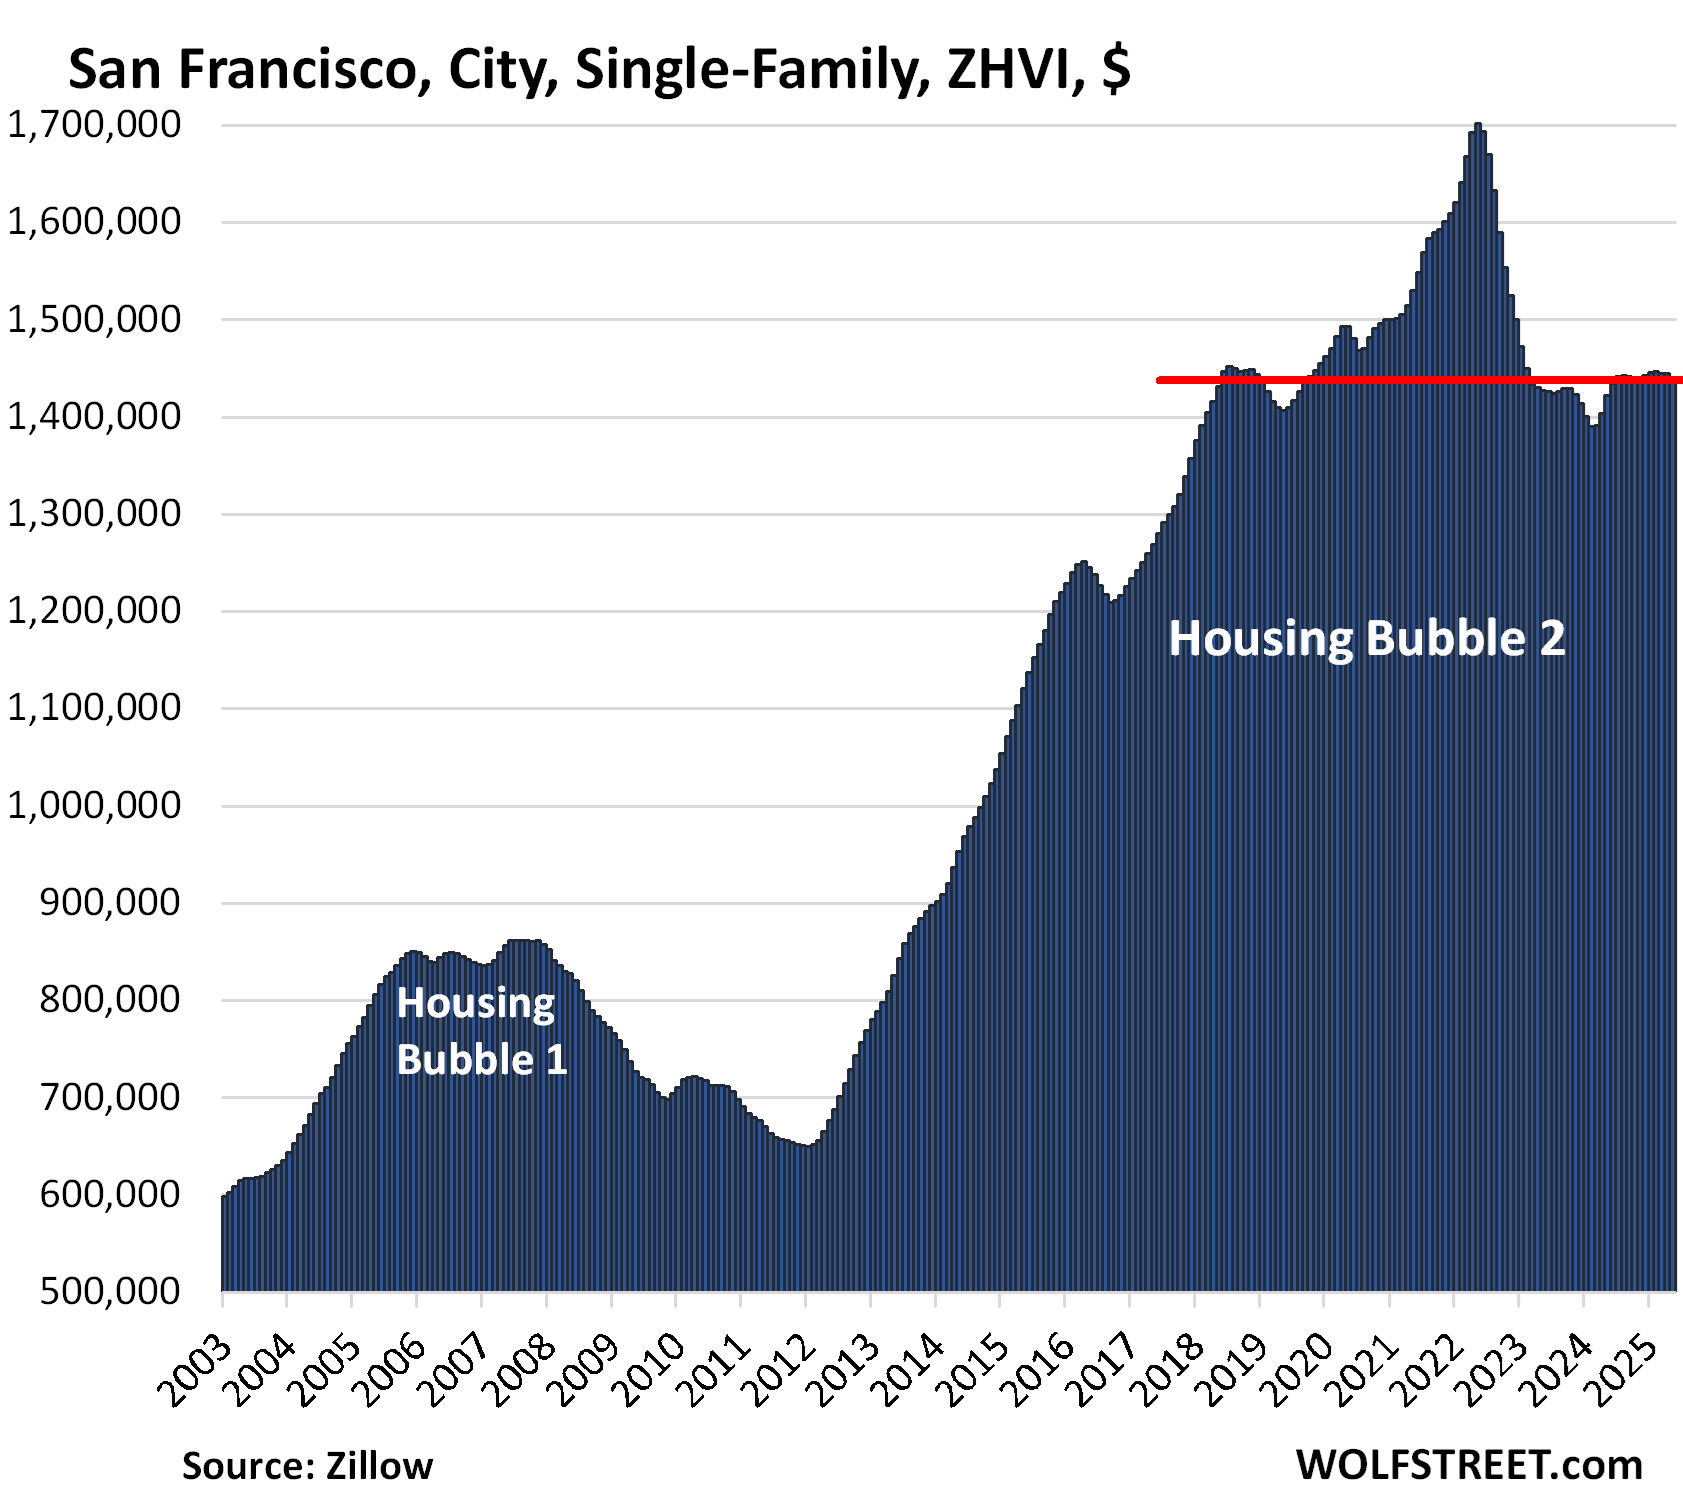
| San Francisco, City, Single-Family Home Prices | |||
| From May 2022 peak | MoM | YoY | Since 2000 |
| -15.3% | -0.3% | 1.2% | 236% |
Prices have returned to where they had been over six years ago in mid-2018. Over the decade through mid-2022, prices had shot up by 146%.
During the two years of mid-2020 through mid-2022, prices had surged by “only” 14% as the price explosion of 127% in the prior eighth years had already exhausted the market, and major companies had started to leave because out-of-whack housing costs were driving up their payroll expenses.
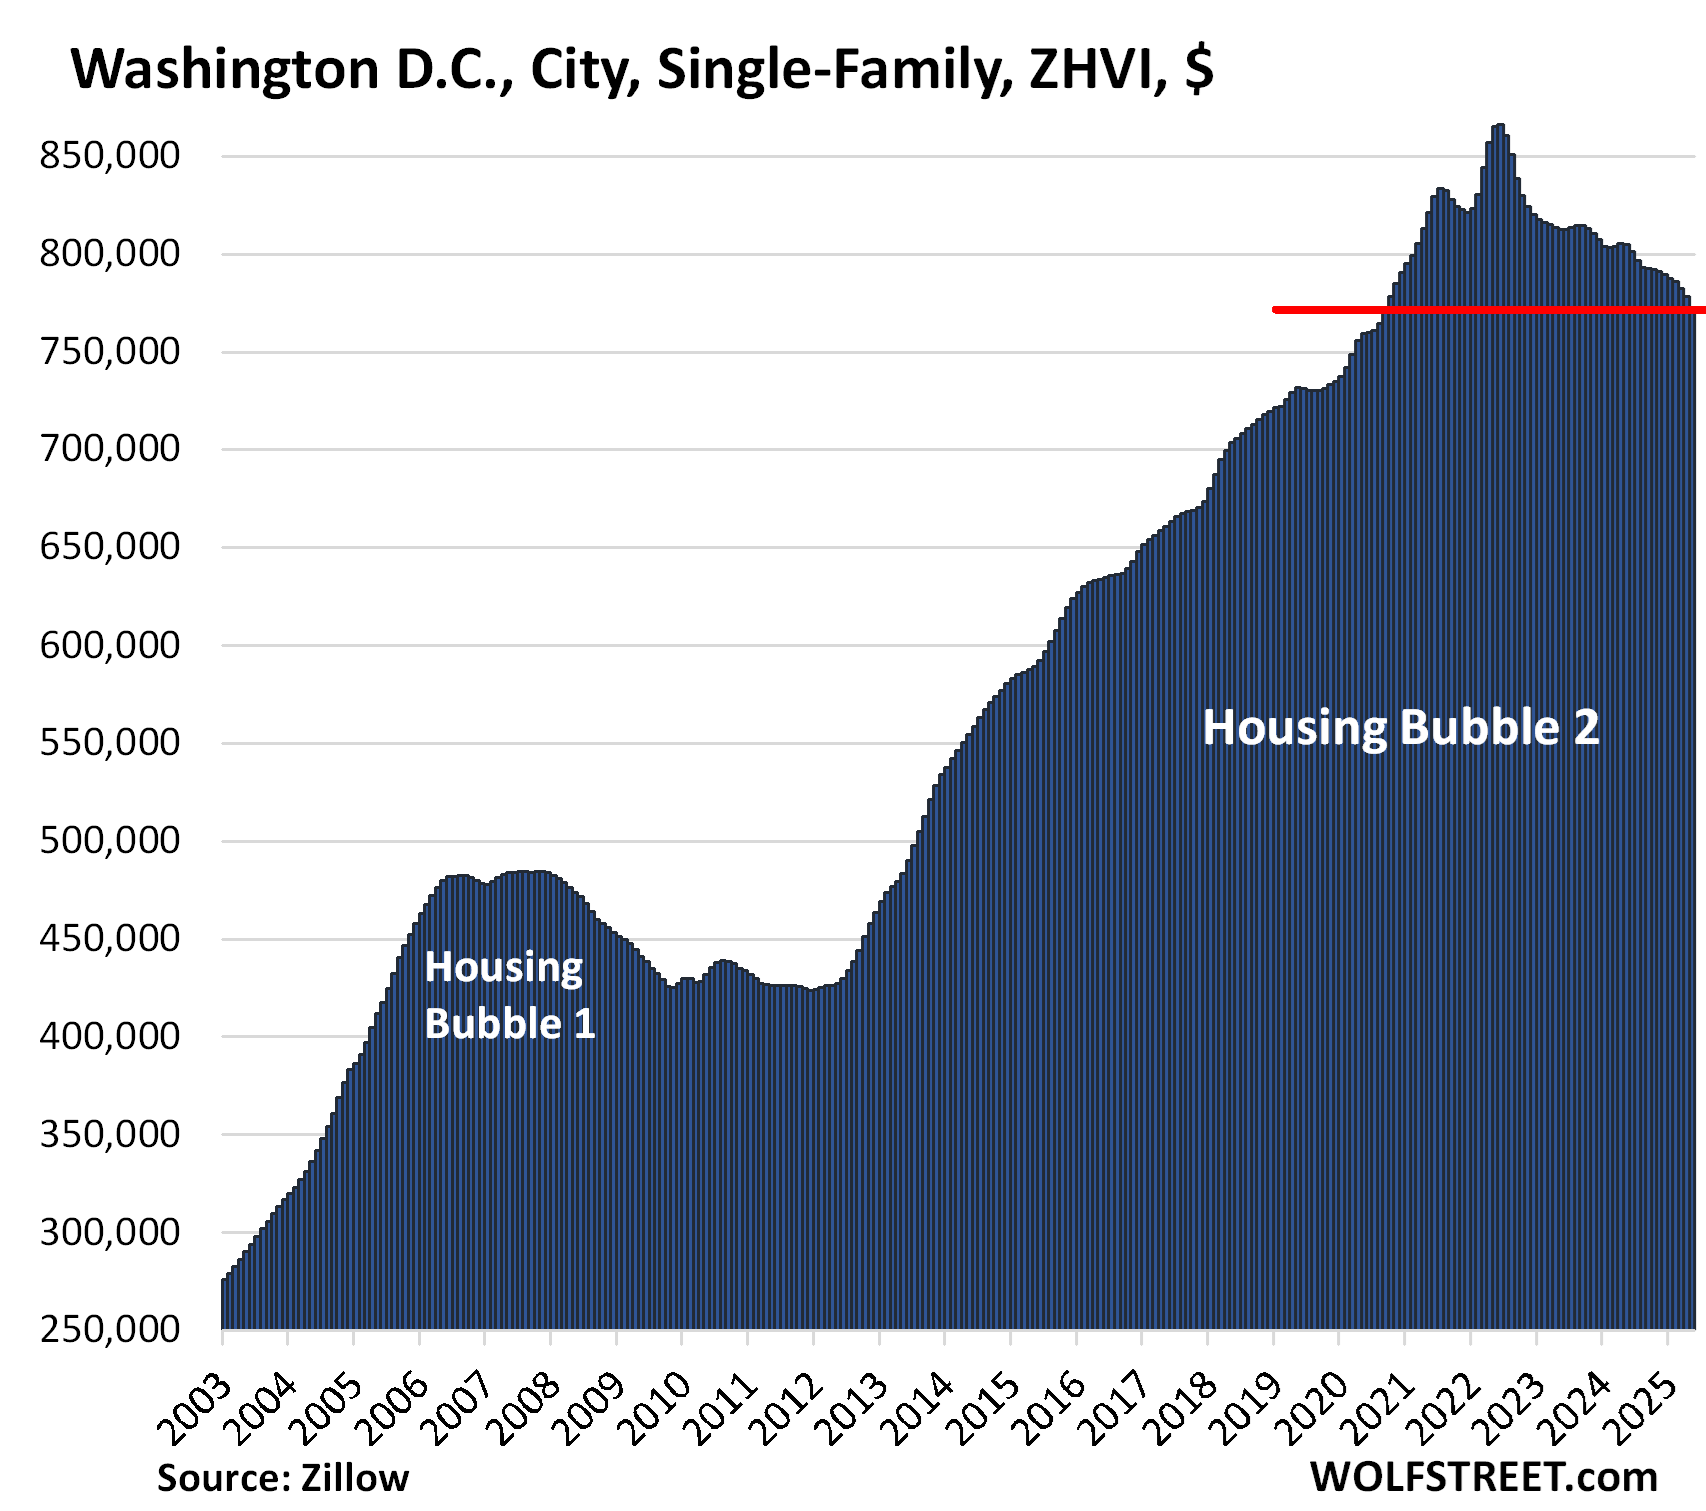
| Washington D.C., Single-Family Home Prices | |||
| From Jun 2022 | MoM | YoY | Since 2000 |
| -10.8% | -0.7% | -4.1% | 279% |
Prices are back to September 2020 levels.
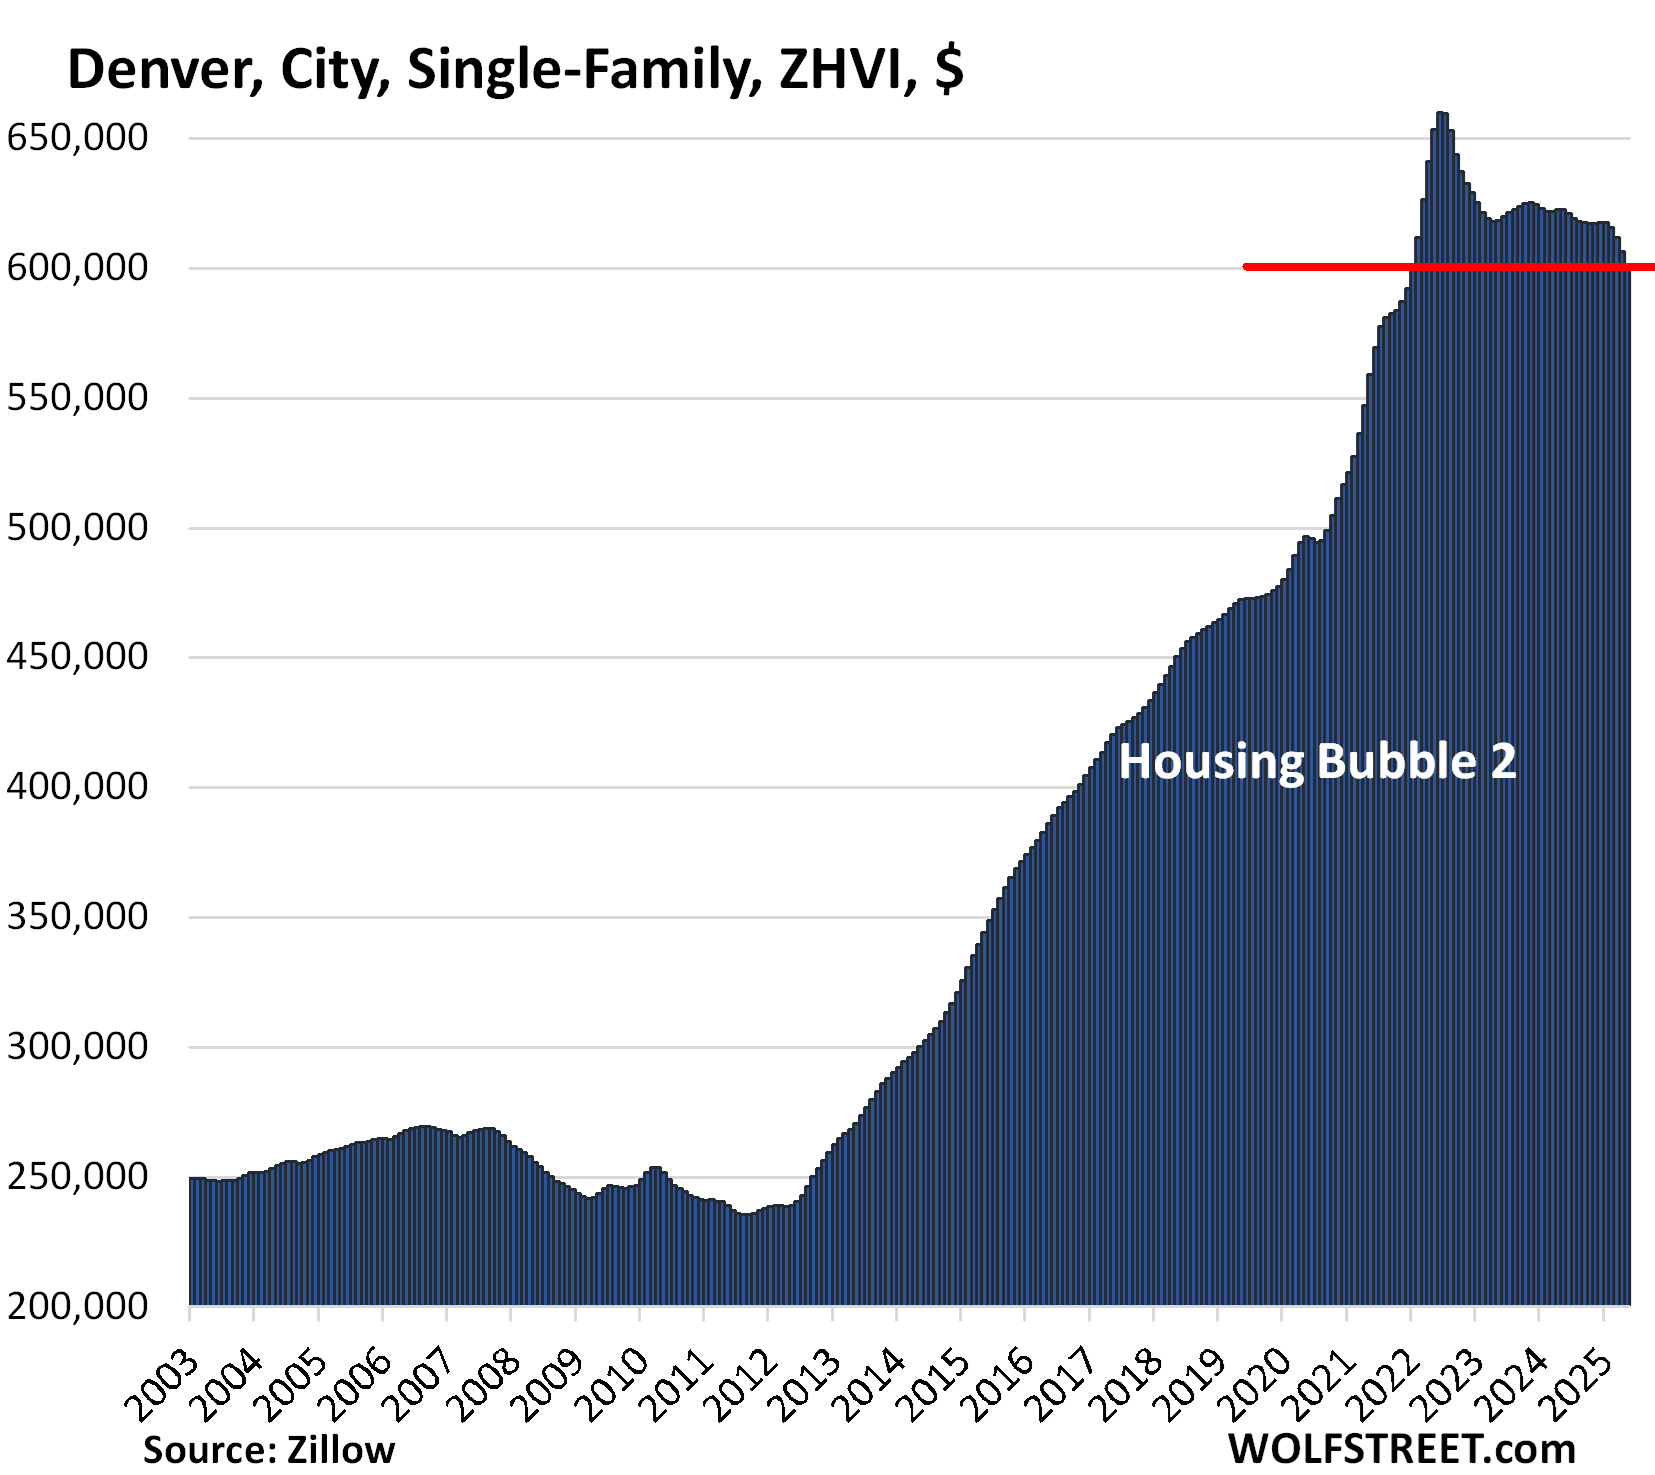
| Denver, City, Single-Family Home Prices | |||
| From Jun 2022 peak | MoM | YoY | Since 2000 |
| -9.0% | -0.9% | -3.5% | 218% |
Prices have returned to January 2022 levels. In the decade through mid-2022, prices had spiked by 174%.
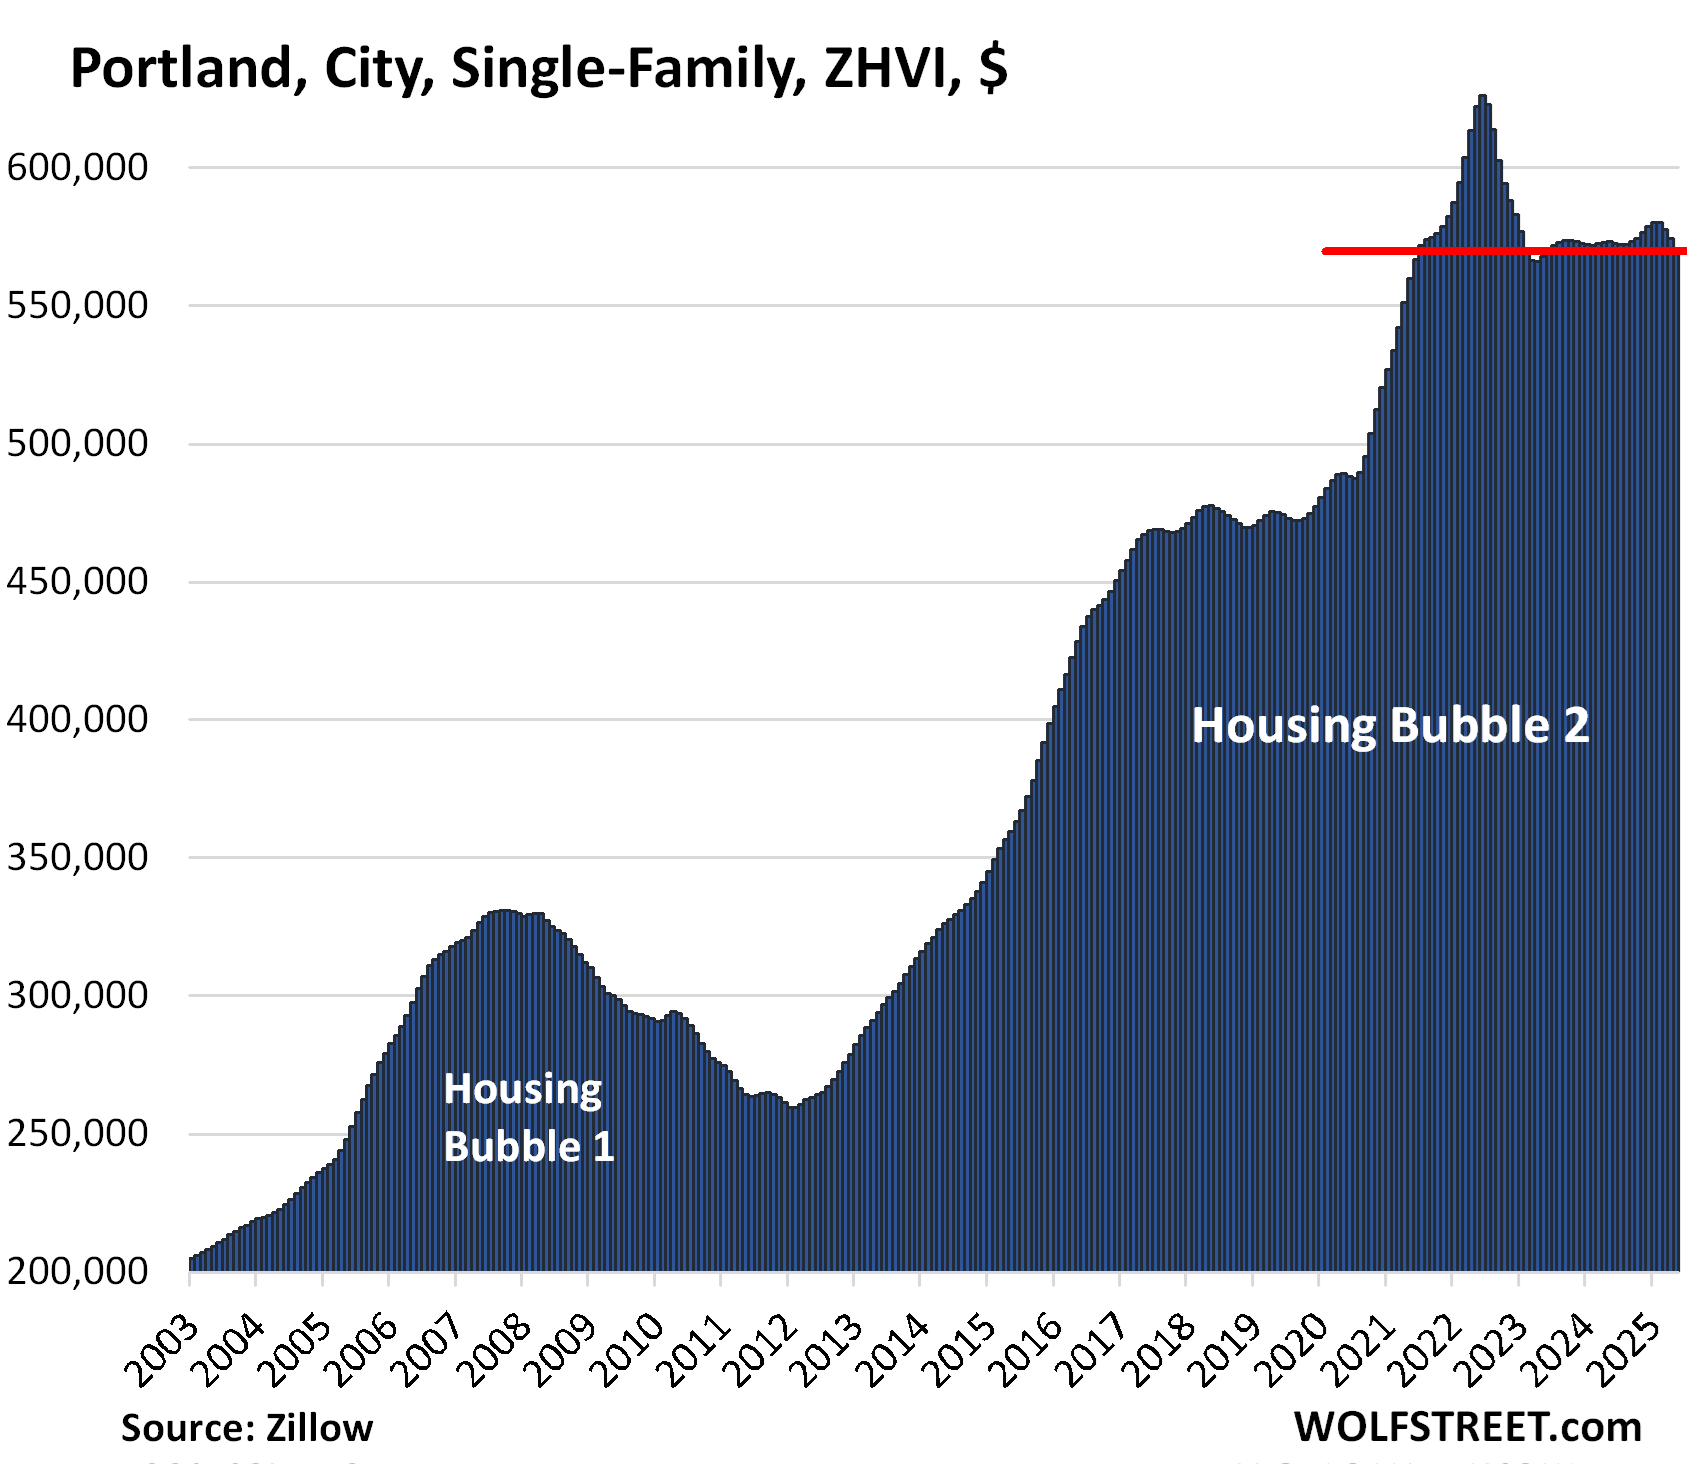
| Portland, City, Single-Family Home Prices | |||
| From May 2022 peak | MoM | YoY | Since 2000 |
| -8.9% | -0.7% | -0.5% | 225% |
Prices have fallen below July 2021 levels.
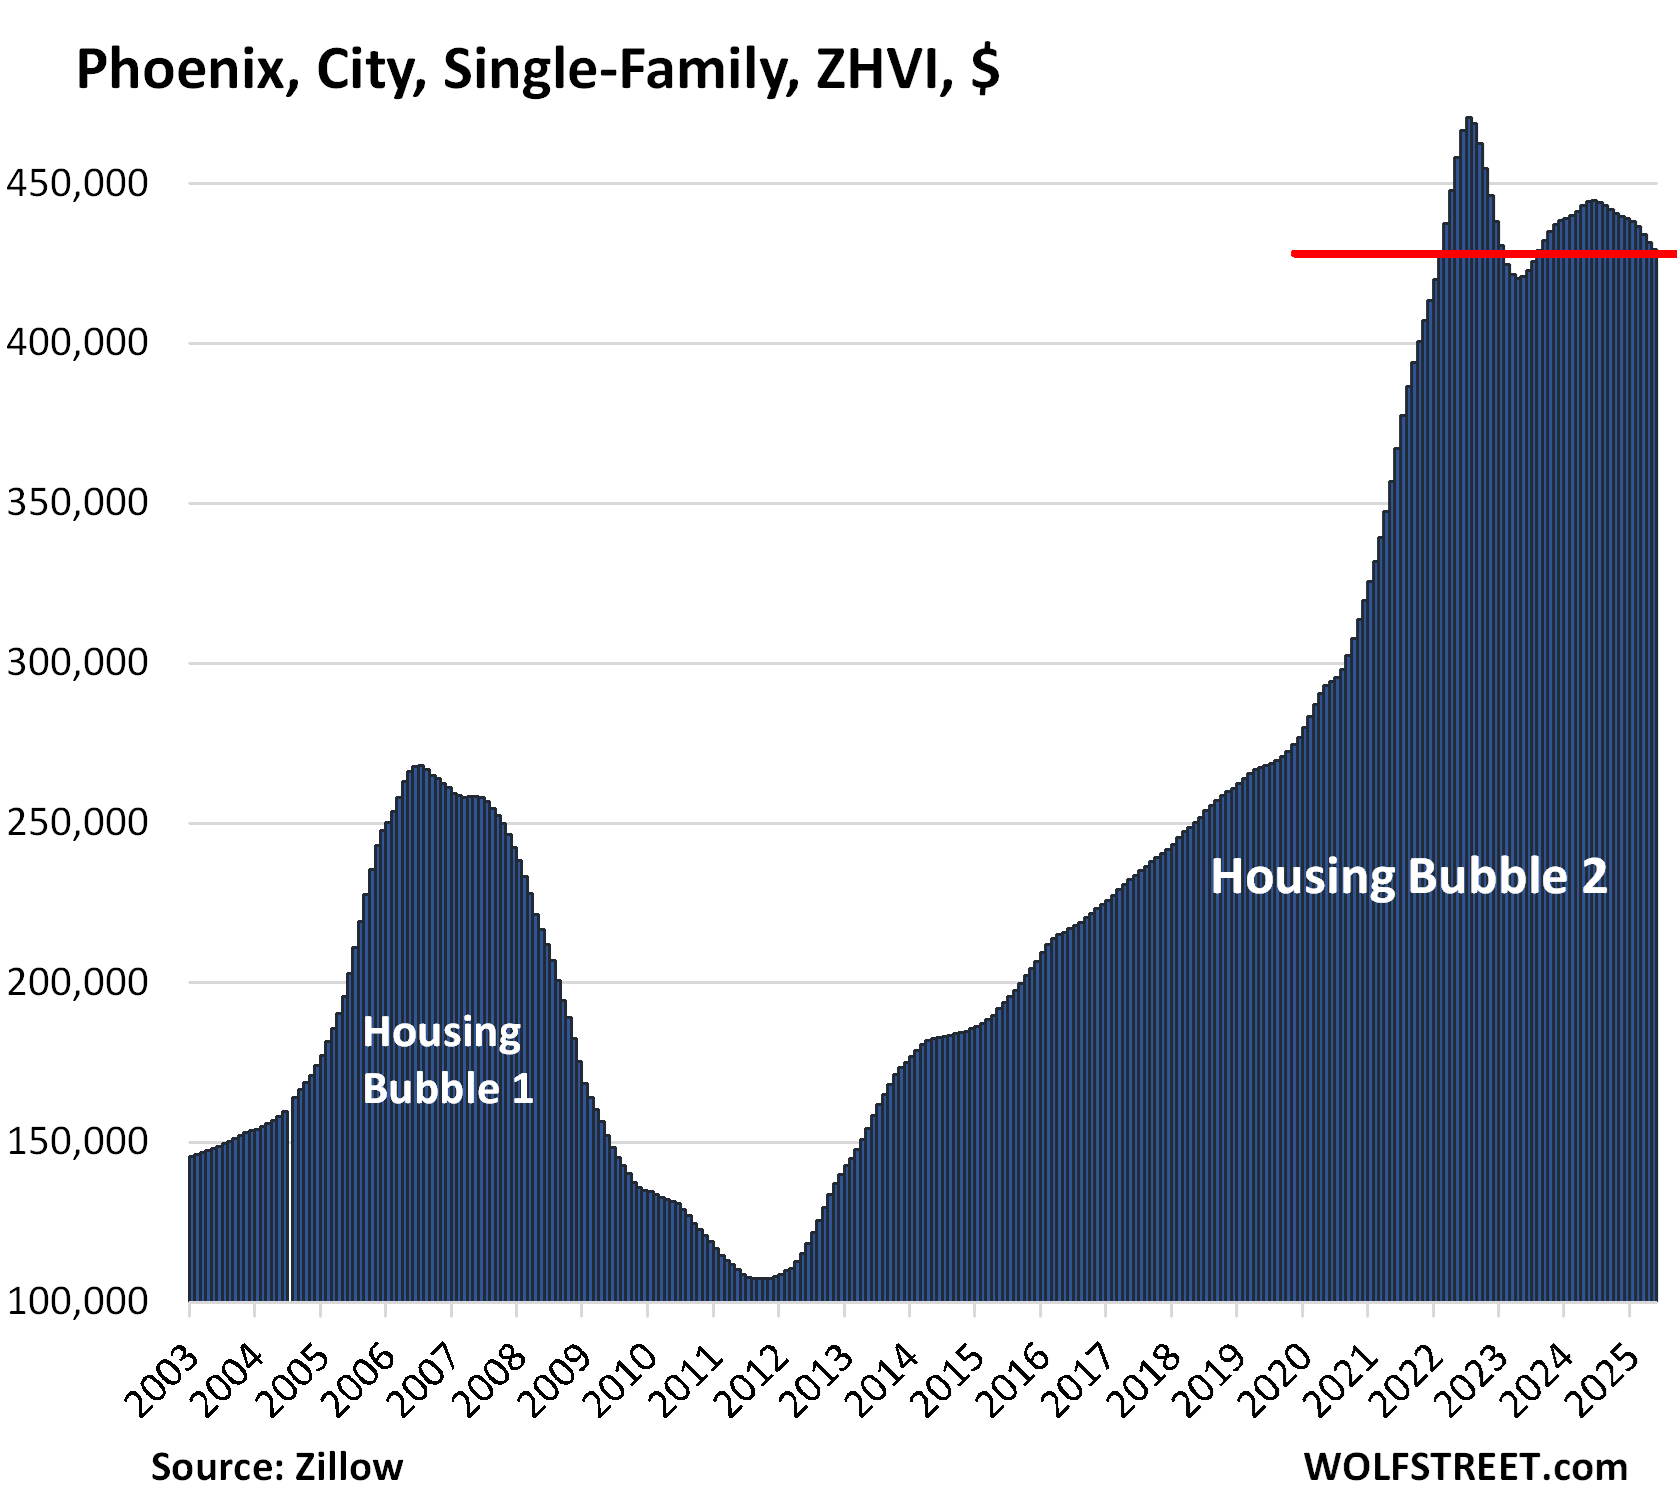
| Phoenix, City, Single-Family Home Prices | |||
| From Jul 2022 peak | MoM | YoY | Since 2000 |
| -8.8% | -0.5% | -3.4% | 254% |
In a little over two years, between April 2020 and the peak in July 2022, prices of mid-tier single-family homes had spiked by 62%. In the 10 years through mid-2022, prices had exploded by 339%.
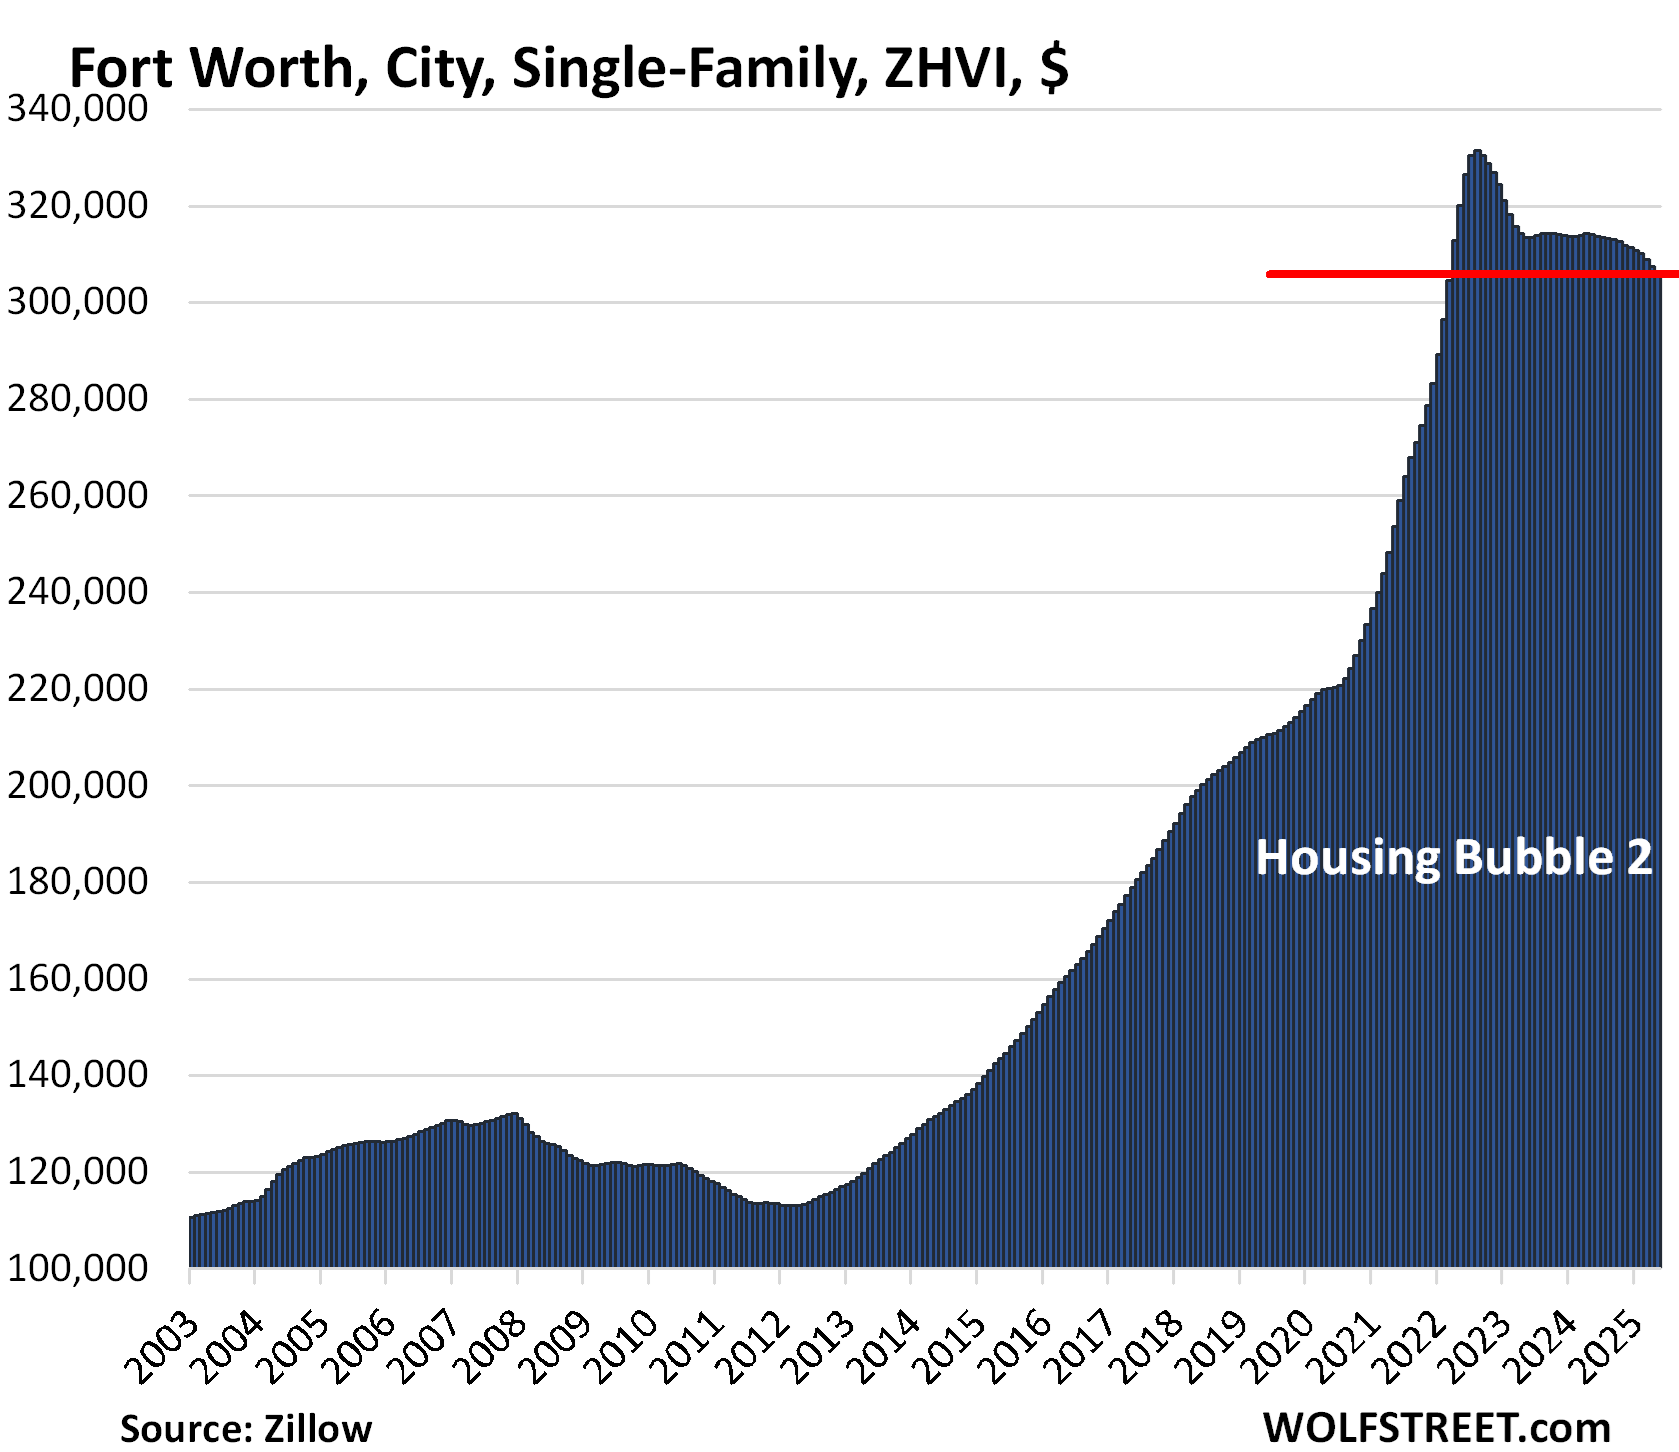
| Fort Worth, City, Single-Family Home Prices | |||
| From Aug 2022 peak | MoM | YoY | Since 2000 |
| -7.7% | -0.5% | -2.6% | 194% |
Prices have backtracked to March 2022 so far. In the 10 years through August 2022, prices had spiked by 187%.
The cities in Texas didn’t experience much of a Housing Bubble 1, and Housing Bust 1 was therefore relatively mild. But this changed with Housing Bubble 2.
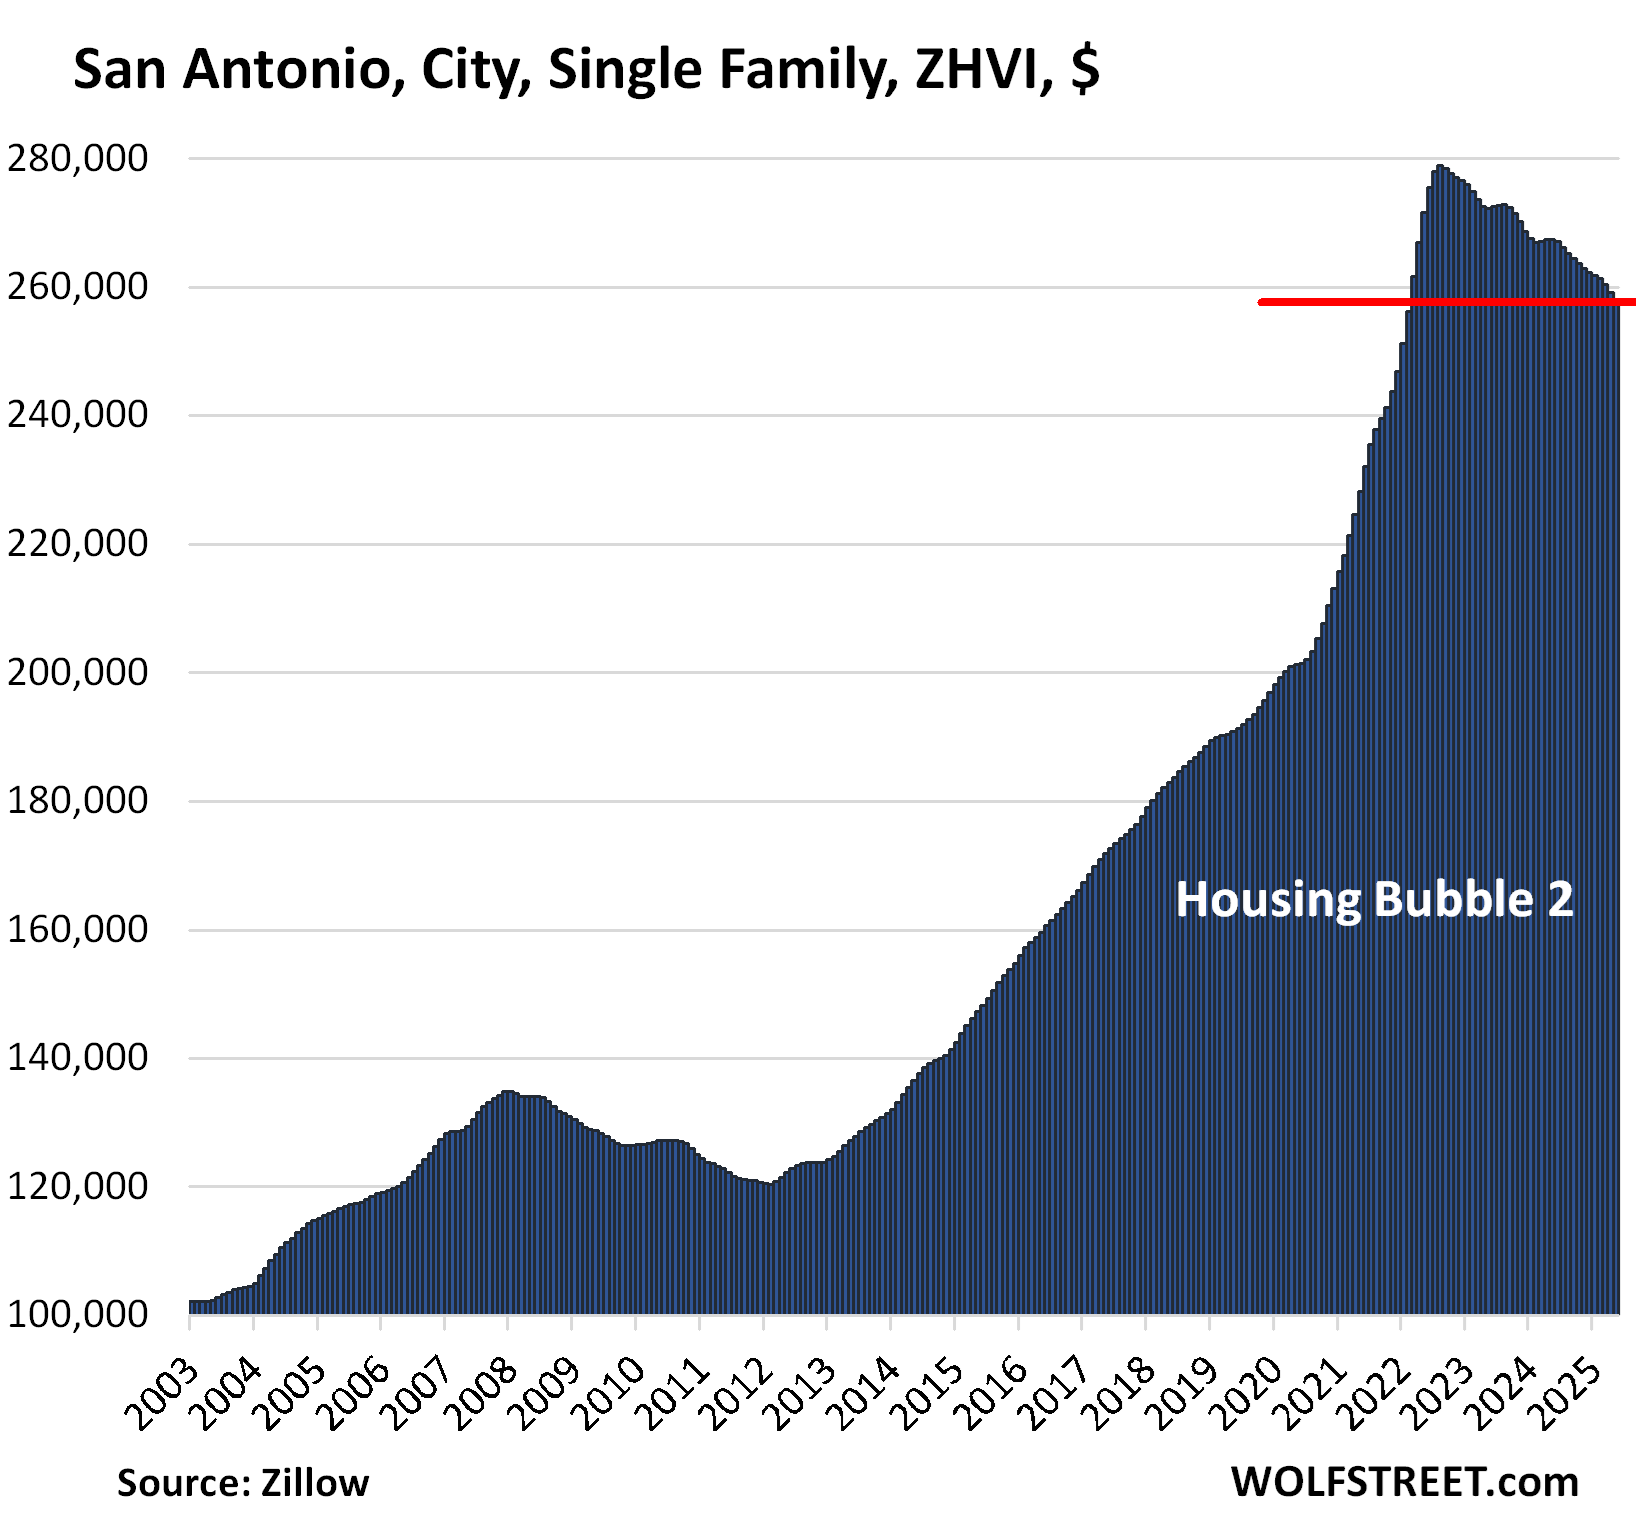
| San Antonio, City, Single-Family Home Prices | |||
| From Jul 2022 peak | MoM | YoY | Since 2000 |
| -7.6% | -0.5% | -3.6% | 154% |
Prices have returned to February 2022 levels. In the decade through mid-2022, prices had shot up by 126%.
Enjoy reading WOLF STREET and want to support it? You can donate. I appreciate it immensely. Click on the mug to find out how:

![]()
Even with price decreases the prices are still incredibly high. Add closing costs into the price and it still takes a lot of money to go to settlement.
Good thing the crash has only begun. We are inning 4 of this game. Enjoy!
As people here should know prices will need to come down further in order to create demand to clear the market.
Does anyone have any realistic guess as to what kind of pricing we will see when the housing markets nationally hit bottom? 2012 pricing? Before?
Wolf has previously noted that CRE fell 70% in some areas, could this be the case with residential real estate too?
Any realistic guesses as to how much prices have to drop nationally in order to create enough demand for the market to balance?
Hi Jack,
Realistic? Hardly, but when in doubt why not try the ‘wet-finger-in-the-wind’ gauge.
How much has the underlying average per capita income/GDP grown in comparison to the housing prices?
If wages and interest rate stay static, then you’d need home prices to crash 20-25% to get back to affordability (no more than 30% of gross income spent on your mortgage)
This figure assumes 20% down payment and includes taxes and insurance.
According to Atlanta Fed home affordability index – if you’re making median wage and buy a median priced home, then nearly half your gross income will be spent on your house. So well over your half your take home pay.
Being house poor is a bad way to go through life.
The National Association of Realtors should cheer the price declines instead of opposing them. Sales volume will increase a lot once prices fall enough to motivate sellers and attract buyers. That will more than make up for smaller commission sizes.
@ Bagehot’s Ghost,
Agreed, at least from a common-sense standpoint. However, many member realtors would probably object to such a statement because their agents frequently talk up residential real estate as a “good investment.” Hard to reconcile that point with a formal NAR statement that prices are falling in some areas.
A positive “spin statement” on falling prices from the NAR would also produce an immediate follow up question from prospective buyers: how do you know they won’t fall further? That sensible question is what is keeping many people out of the market today.
Decreasing residential RE prices also resurrect an ugly specter: the possibility of “going underwater” on one’s mortgage loan. The NAR itself acknowledges the real estate market is cyclical. As Wolf has noted, it is a slow cycle. But all it takes is one poorly timed RE investment to put an unfortunate owner in the “house is not worth as much as the mortgage loan in today’s market” position. Not pleasant to be forced to cut the bank a check for 20K just for the privilege of selling one’s home.
And yes, I’ve heard the old “it depends on how long you plan to live in the property” argument. A fine contention provided you can do one thing with 100% accuracy: predict the future. Unplanned sales happen all the time from people who originally planned to live in the property for a long period.
As has been repeatedly noted on this forum, there are many reasons for unplanned and unexpected RE sales: illness, job loss, job transfer, divorce, death in the family, etc.
I give the “depends on how long you plan to live there” point the same level of credibility (none) I give to the “marry the house and date the rate” crap. That point also depends on predicting the future accurately. Can’t be done, but that doesn’t stop the agents from using it.
No matter the market conditions, agents ALWAYS have a “why buying today is a great idea” spin. That is part of their job. Buyer beware.
Realtor propaganda works best on buyers. Harder to push sellers to drop their price or accept a “lowball “ offer.
Realtors know phrases like “marry the house, date the rate” work well on buyers emotions.
Don’t fall for their propaganda! Home you live in isn’t that great of an investment. It’s a place to raise your family and make memories
2nd place still gets to hang the NL or AL pennant in a drafty corner of the stadium.
Just saying
With regards to Austin, for people moving into town from 2020 on, where were most coming from?
My guess is a combination of California and New York, but I don’t have any data to back it up.
With the US at war again, only this time more bigly, one wonders how it will affect the housing market. My guess is it will have a chilling effect as people will react to economic and political uncertainty by staying put and not being as willing to risk making investments.