Austin, Oakland, New Orleans, San Francisco, Washington D.C., Phoenix, Portland, Denver, Fort Worth, San Antonio.
By Wolf Richter for WOLF STREET.
For the US overall, for the entire market, the median price of all single-family homes was up on a year-over year basis by 1.7% in April, having shrunk for the fourth month in a row. But someone buying a home buys it in a specific market. They don’t buy the median home in the US at the median price.
And there are dramatically different scenarios in various big cities: Some are showing continued price increases, while others are showing serious price declines.
Five of these big cities had double-digit price declines from their peaks in mid-2022:
- Austin: -21.5%
- Oakland: -19.2%
- New Orleans: -16.7%
- San Francisco: -15.2%
- Washington DC: -10.2%
Other major cities had similar price declines, such as Birmingham, AL, (-14%). But the population of those cities is too small to qualify for this big-city list.
Three more big cities had price declines of 8%-plus, and two of 7%-plus from their peaks in mid-2022:
- Phoenix: -8.3%
- Portland: -8.3%
- Denver: -8.1%
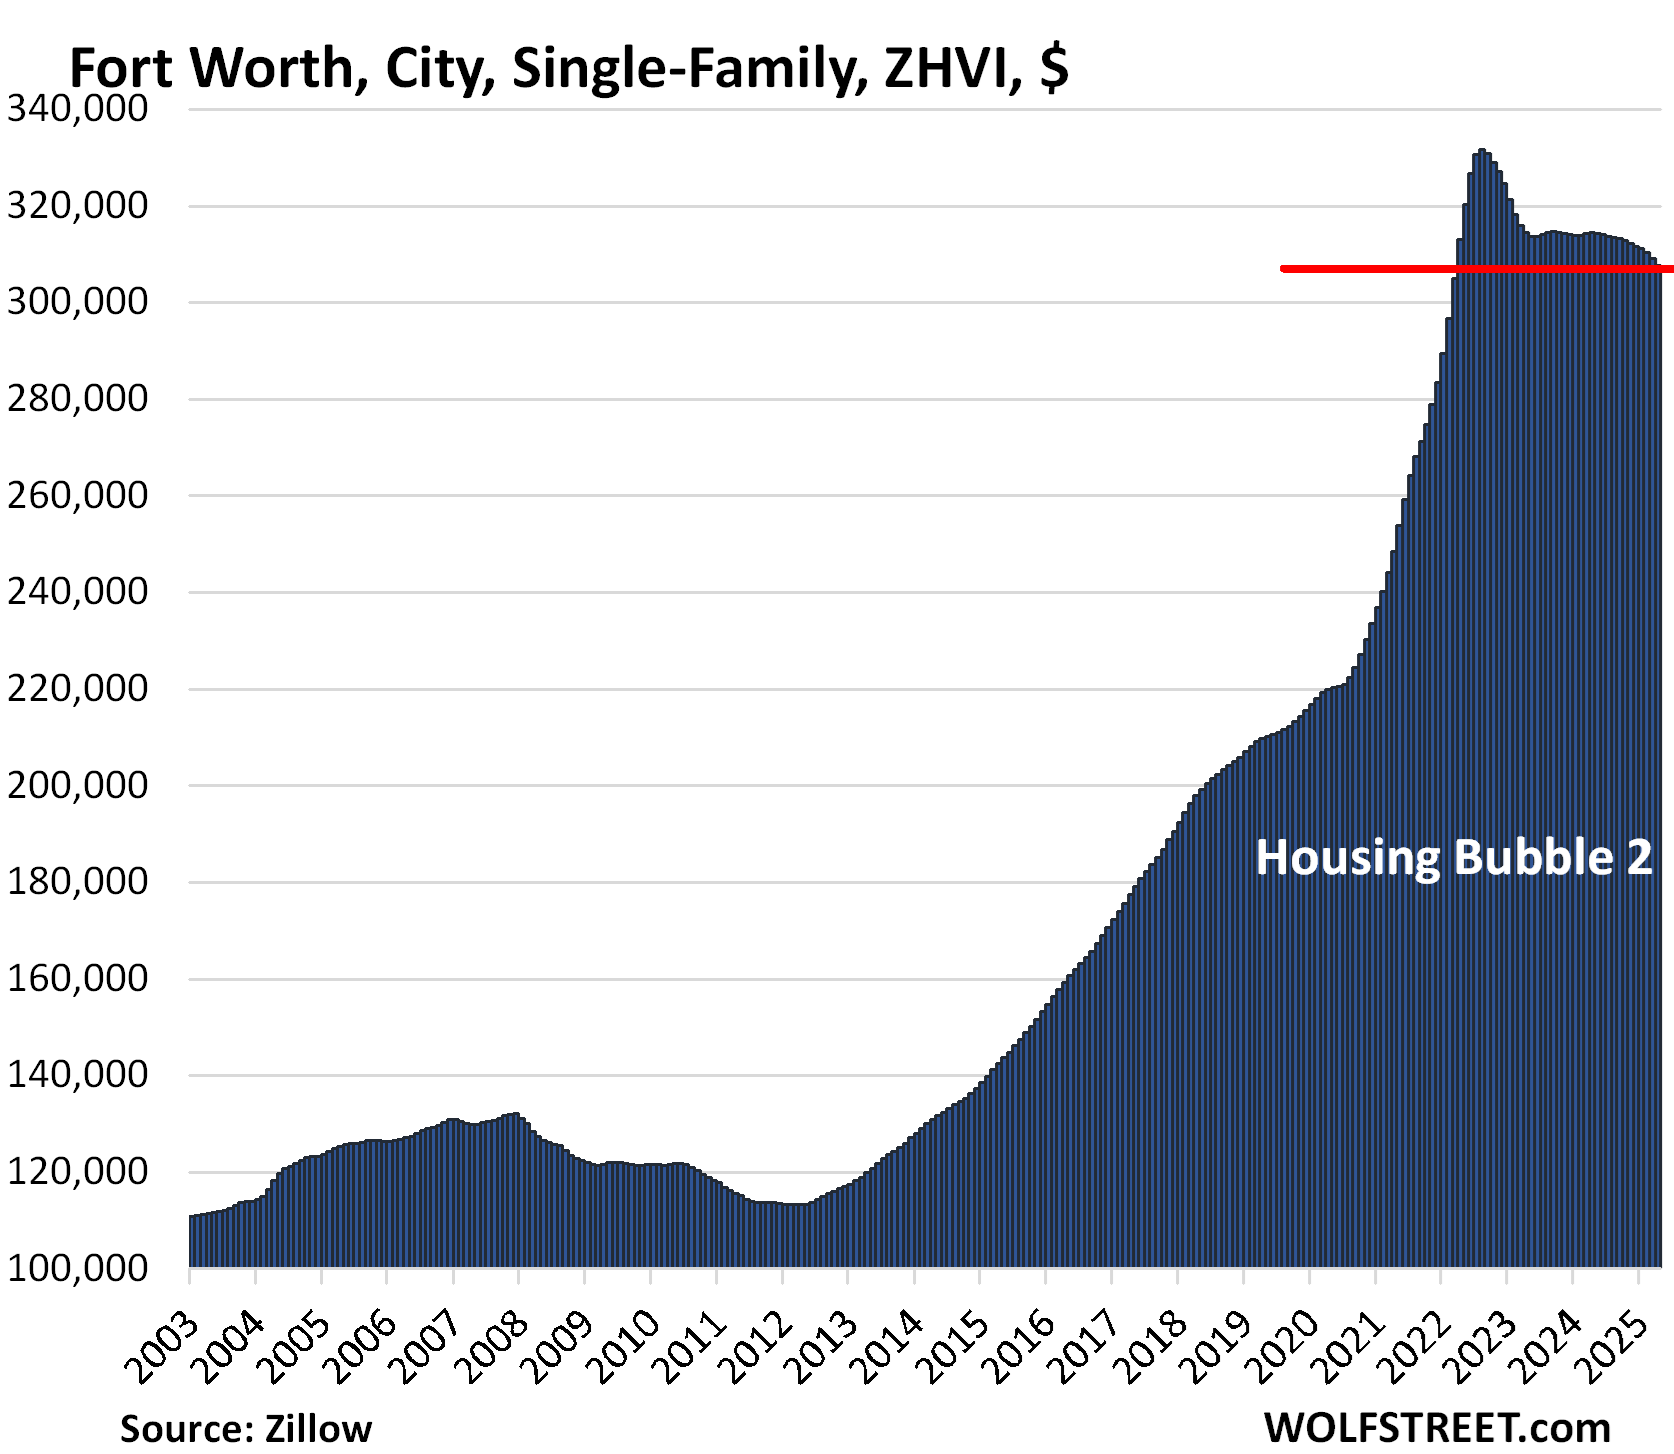
- Fort Worth: -7.3%
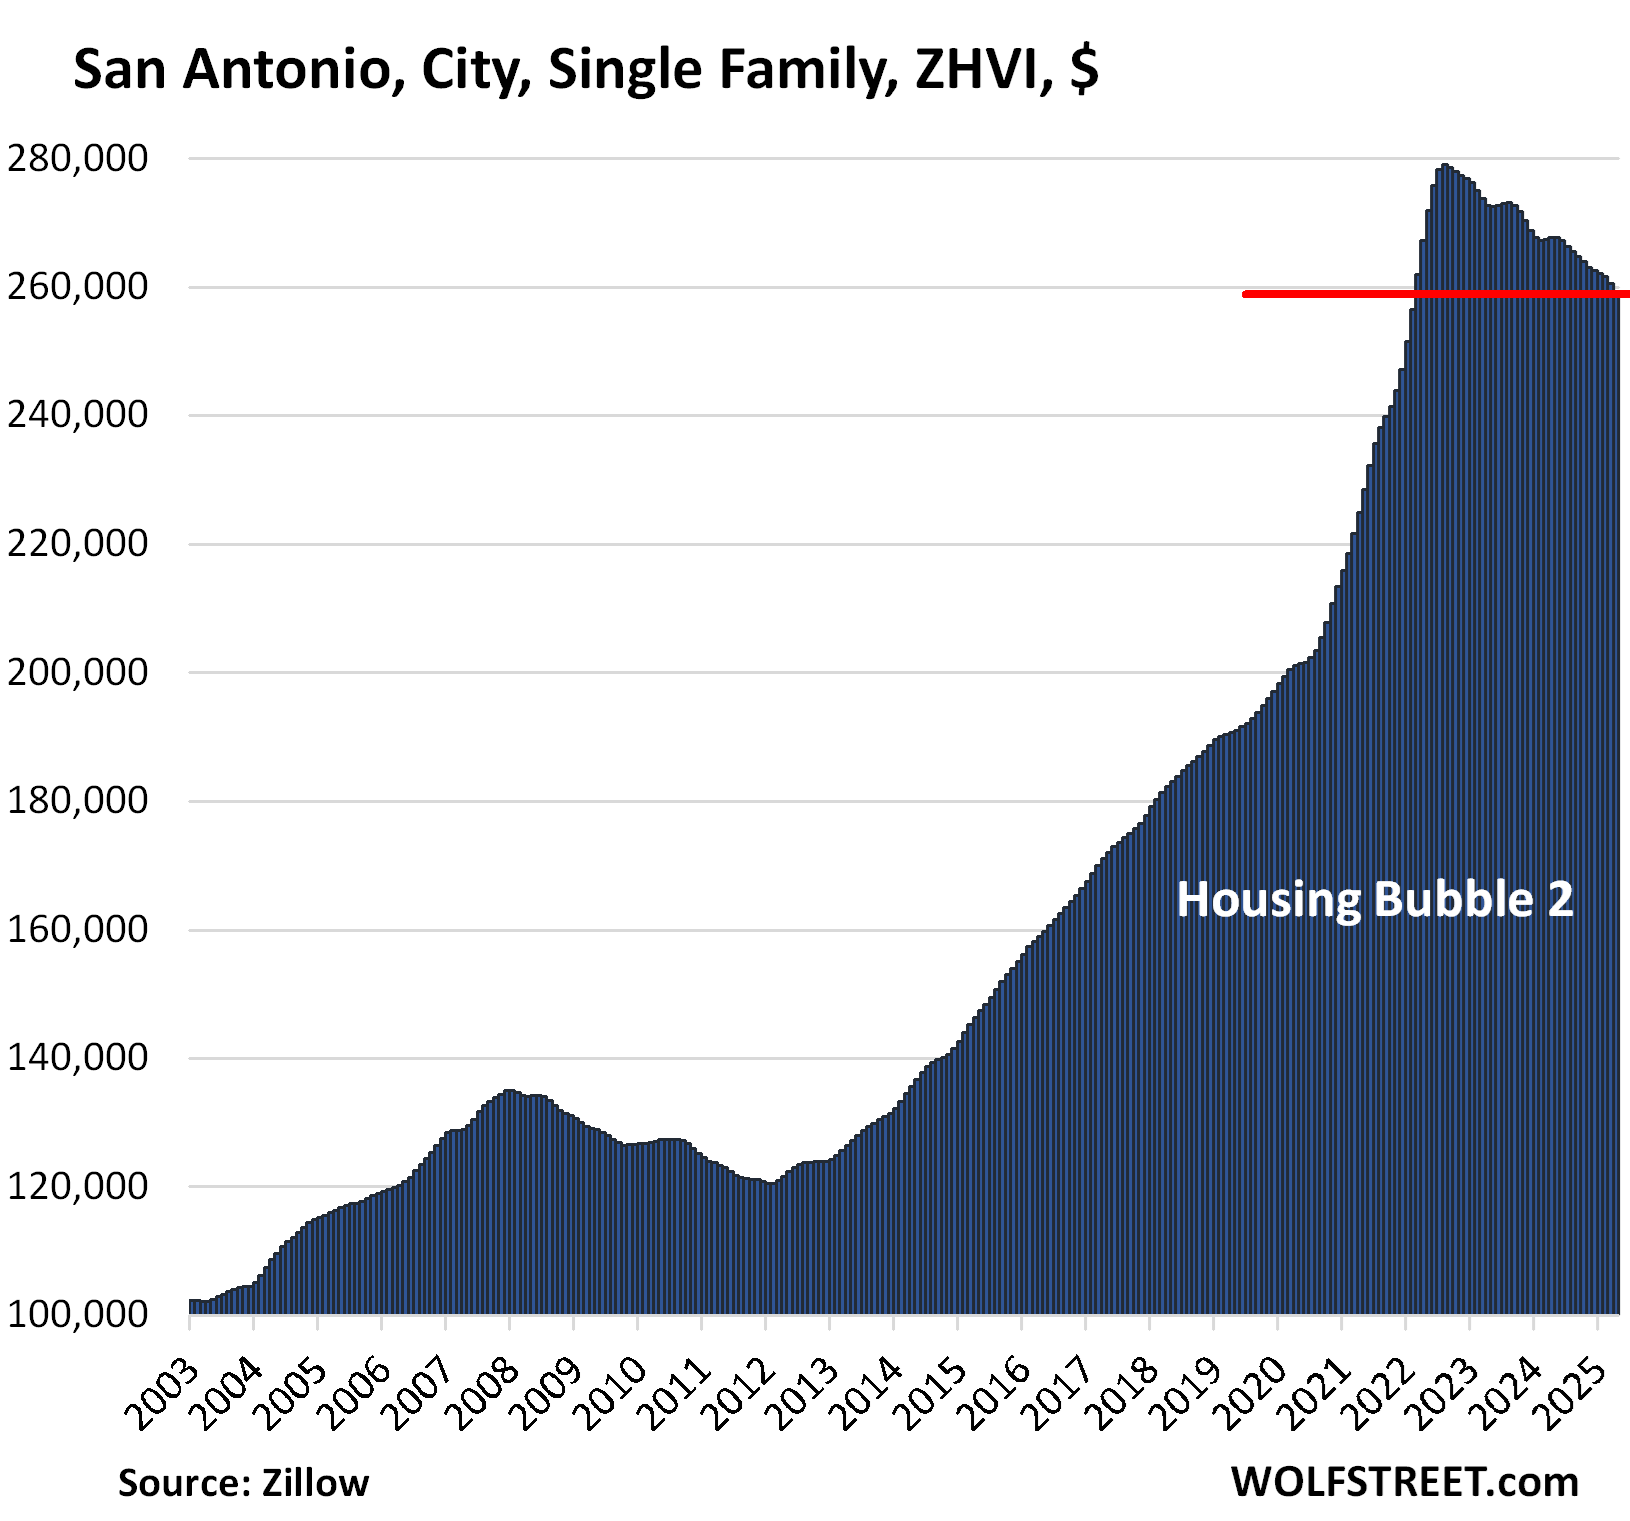
- San Antonio: -7.1%
Many other big cities have smaller price declines from their peaks.
Here we’re drilling down to the city level, single-family homes only, in the largest cities – not Metropolitan Statistical Areas (MSA) that can cover multiple cities in several states. By contrast, our long-running Wolf Street series, The Most Splendid Housing Bubbles of America, charts 33 of the largest and most expensive MSAs, single-family and condo combined. So here only cities, and only single-family homes.
All data through April. These prices here are seasonally adjusted and a three-month moving average to iron out the month-to-month squiggles. They’re part of the Zillow Home Value Index (ZHVI) data, based on the Zillow Database of All Homes. These are not median prices.
The 10 Big Cities with the biggest price declines.
The metrics in each table: price decline from the peak, change from prior month (MoM), change year-over-year (YoY), and increase since January 2000.
| Austin, City, Single-Family Home Prices | |||
| From Jun 2022 peak | MoM | YoY | Since 2000 |
| -21.5% | -0.7% | -5.2% | 174.7% |
Despite this drop, prices are only back where they’d first been during the price explosion in May 2021. They exploded on the way up but are much slower-moving on the way back.
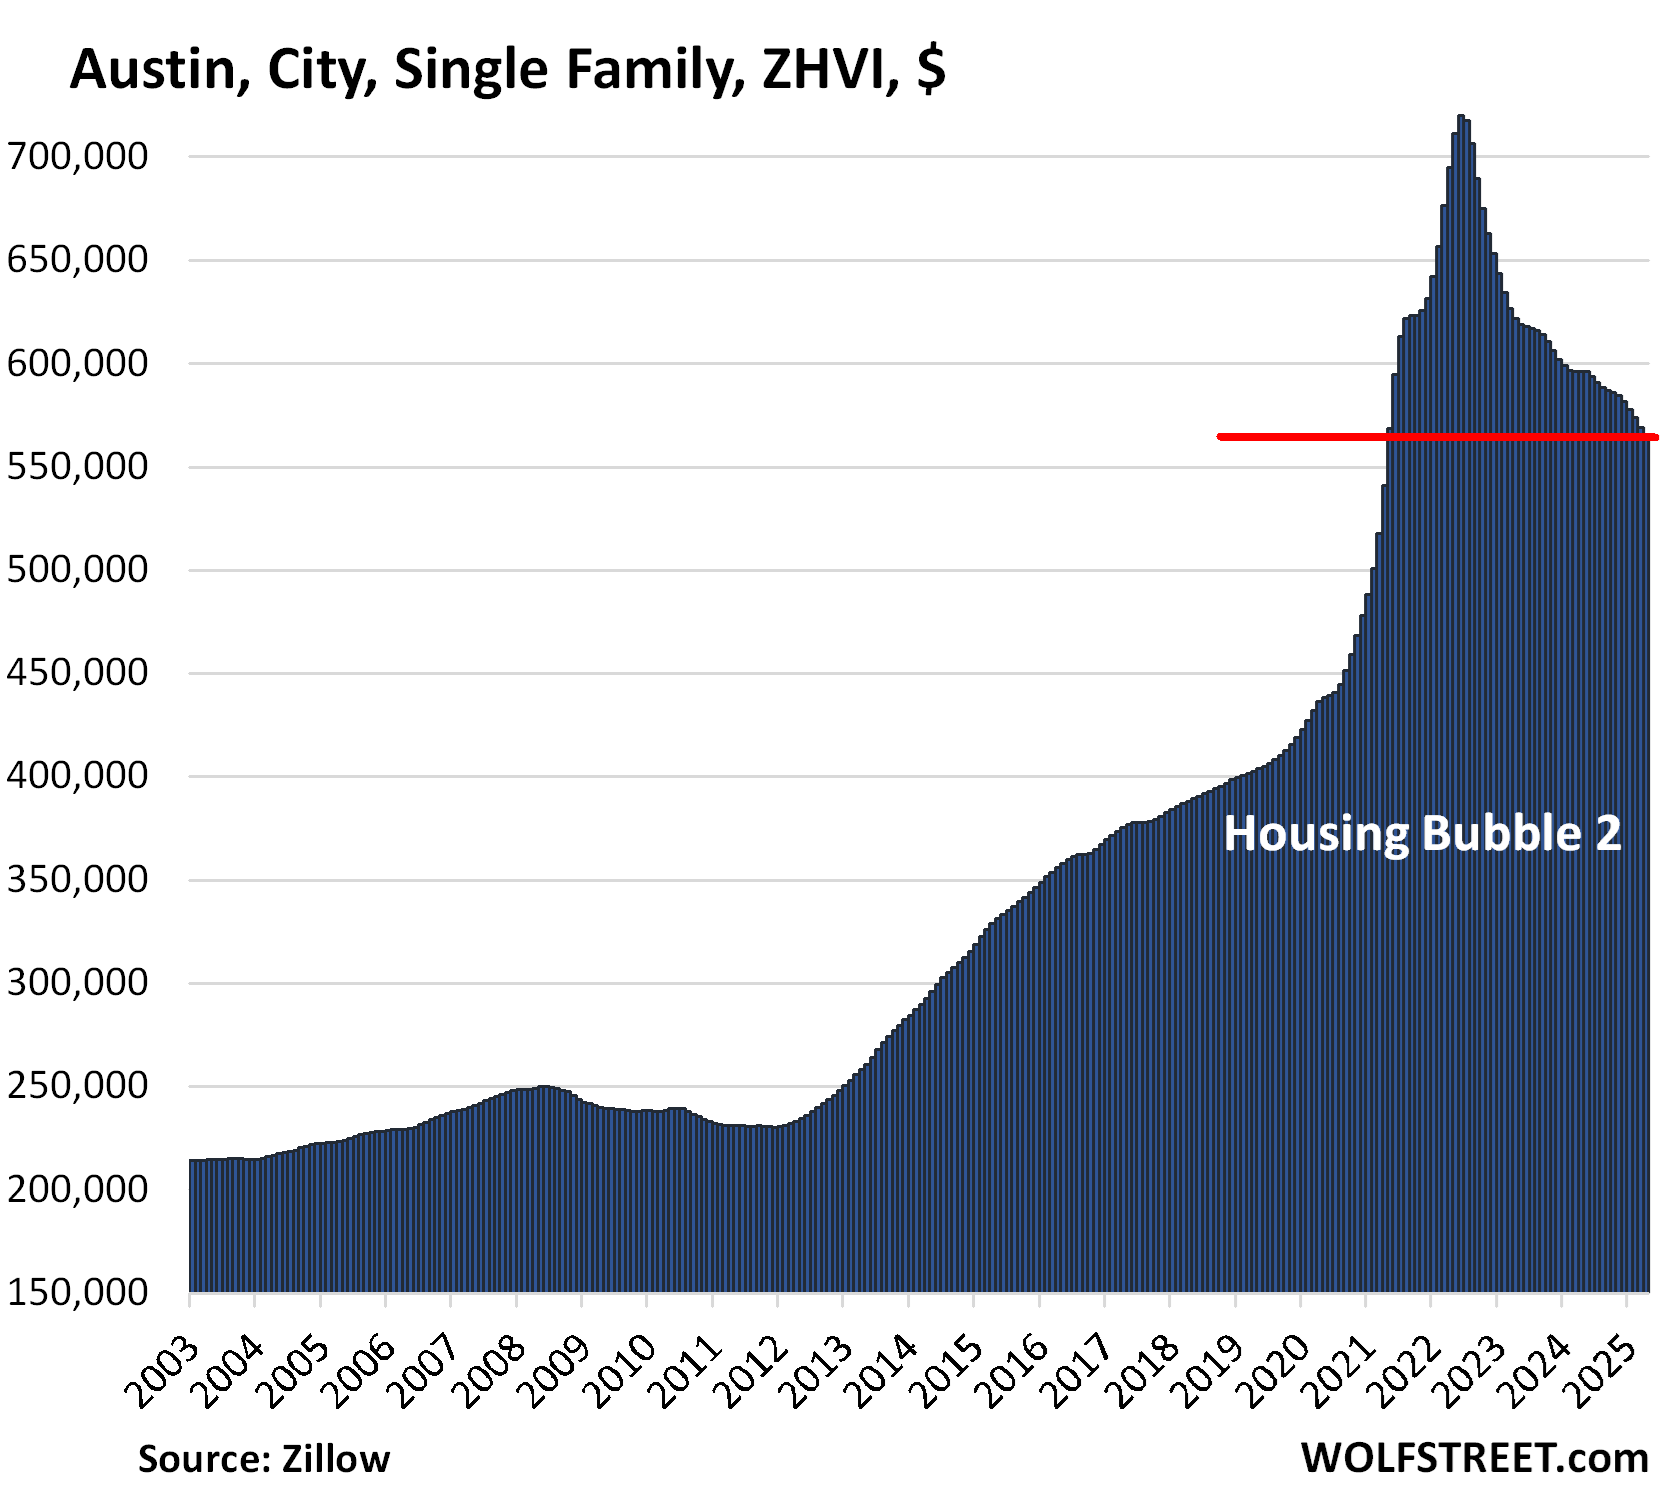
No housing chart should ever look like this. In the two years from mid-2020 through mid-2022, prices in the city of Austin had spiked by 64%. Homes are not cryptos. A chart like this shows that there was something seriously wrong: The Fed’s monetary policy, specifically the all-out interest rate repression, including through the Fed’s massive purchases of mortgage-backed securities (MBS) that helped push mortgage rates down below 3%.
It was one of the most egregious policy errors of all time, resulting in massive historic home price inflation, on top of already substantial price increases in prior years, that completely distorted every aspect of the housing market.
But now the Fed is doing the opposite. Mortgage rates are back in the 7% range. And prices have begun to unwind in many markets.
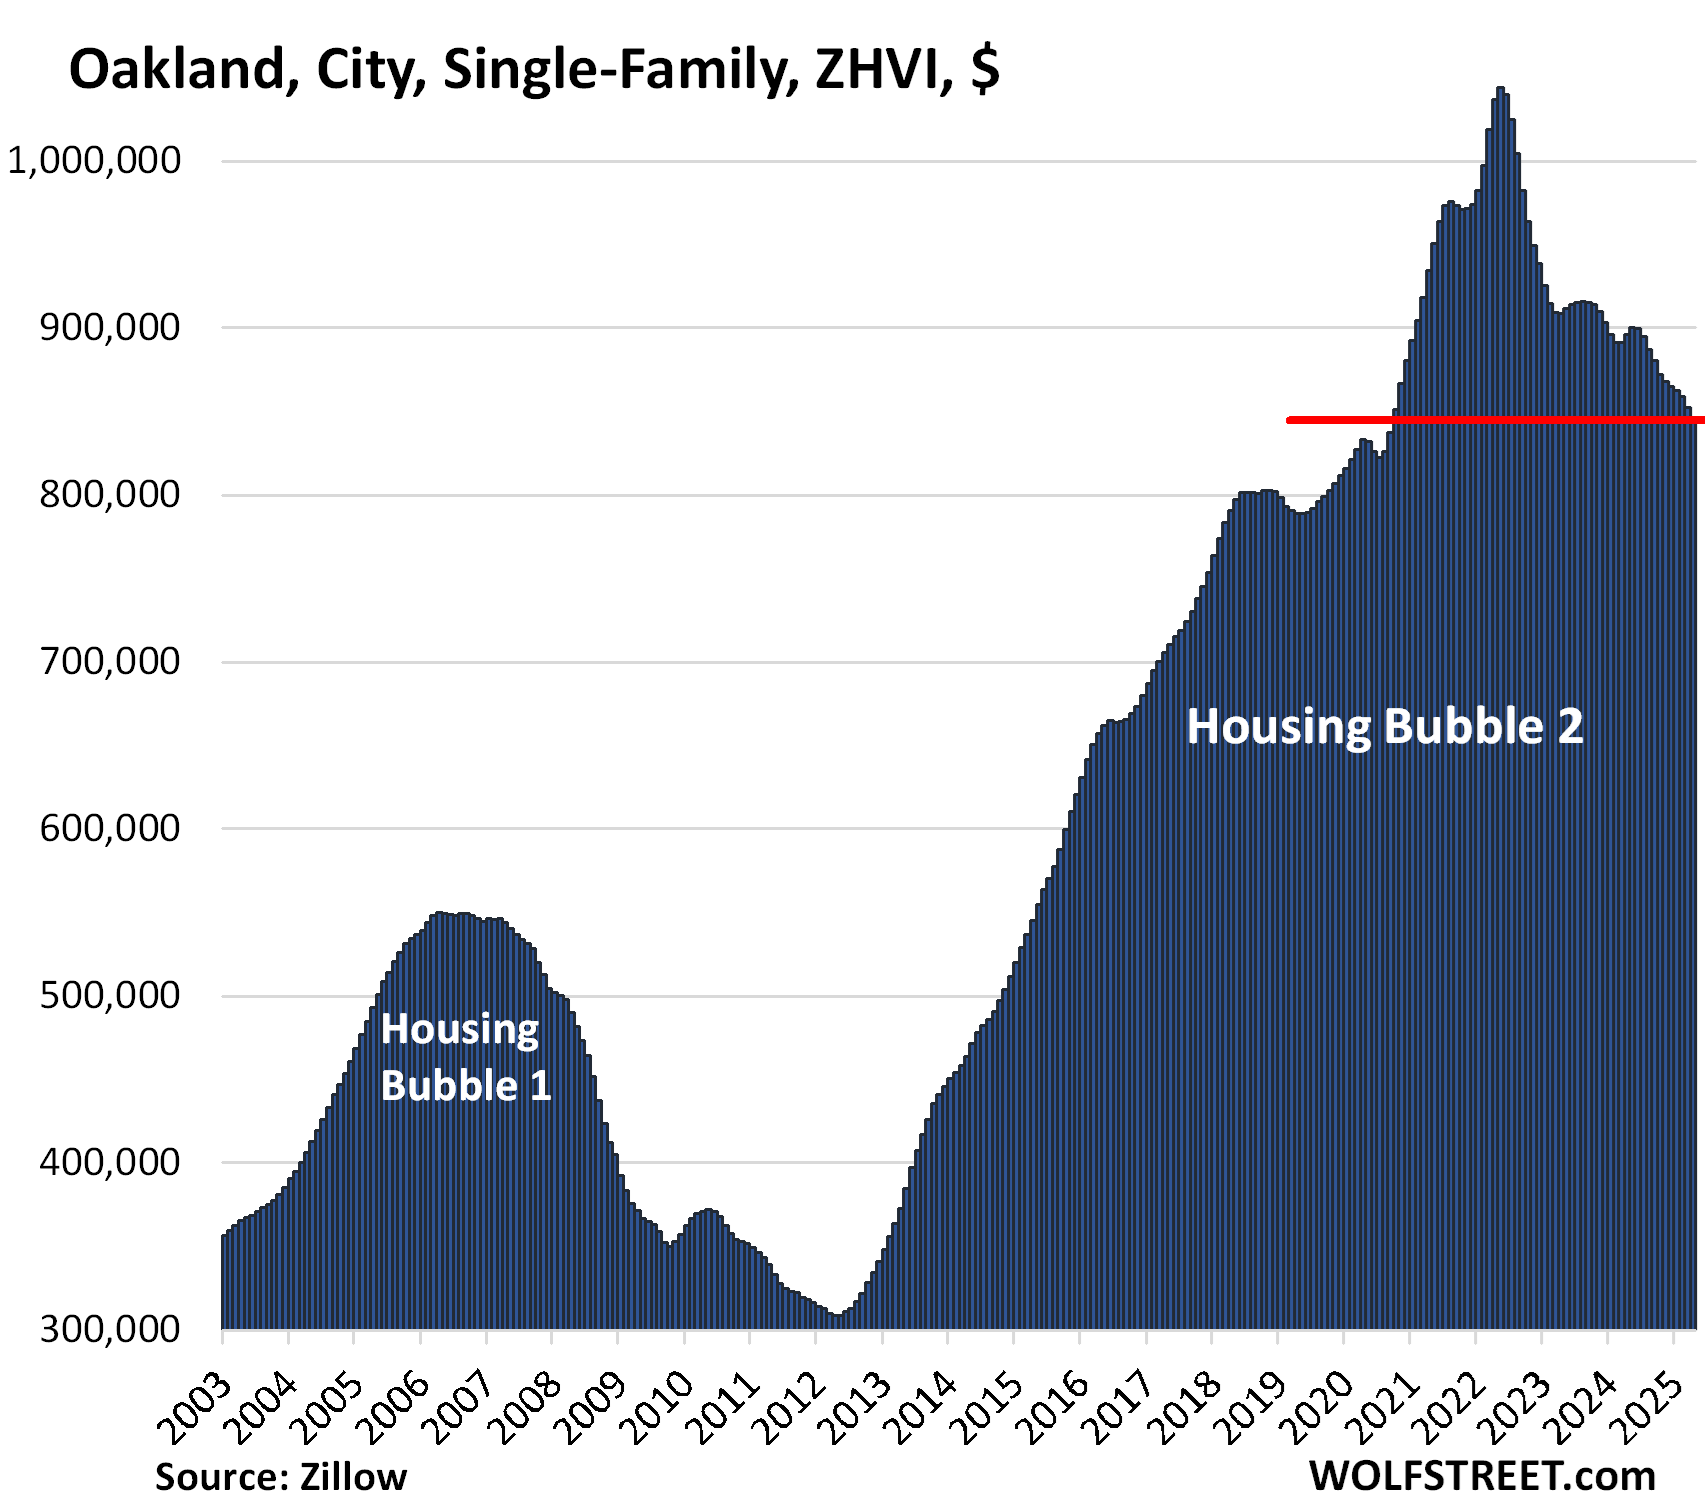
| Oakland, City, Single-Family Home Prices | |||
| From May 2022 peak | MoM | YoY | Since 2000 |
| -19.2% | -1.0% | -5.8% | 302.8% |
Prices are back where they’d first been in October 2020. In the 10 years between mid-2012 and the peak in May 2022, prices had exploded by 236%.
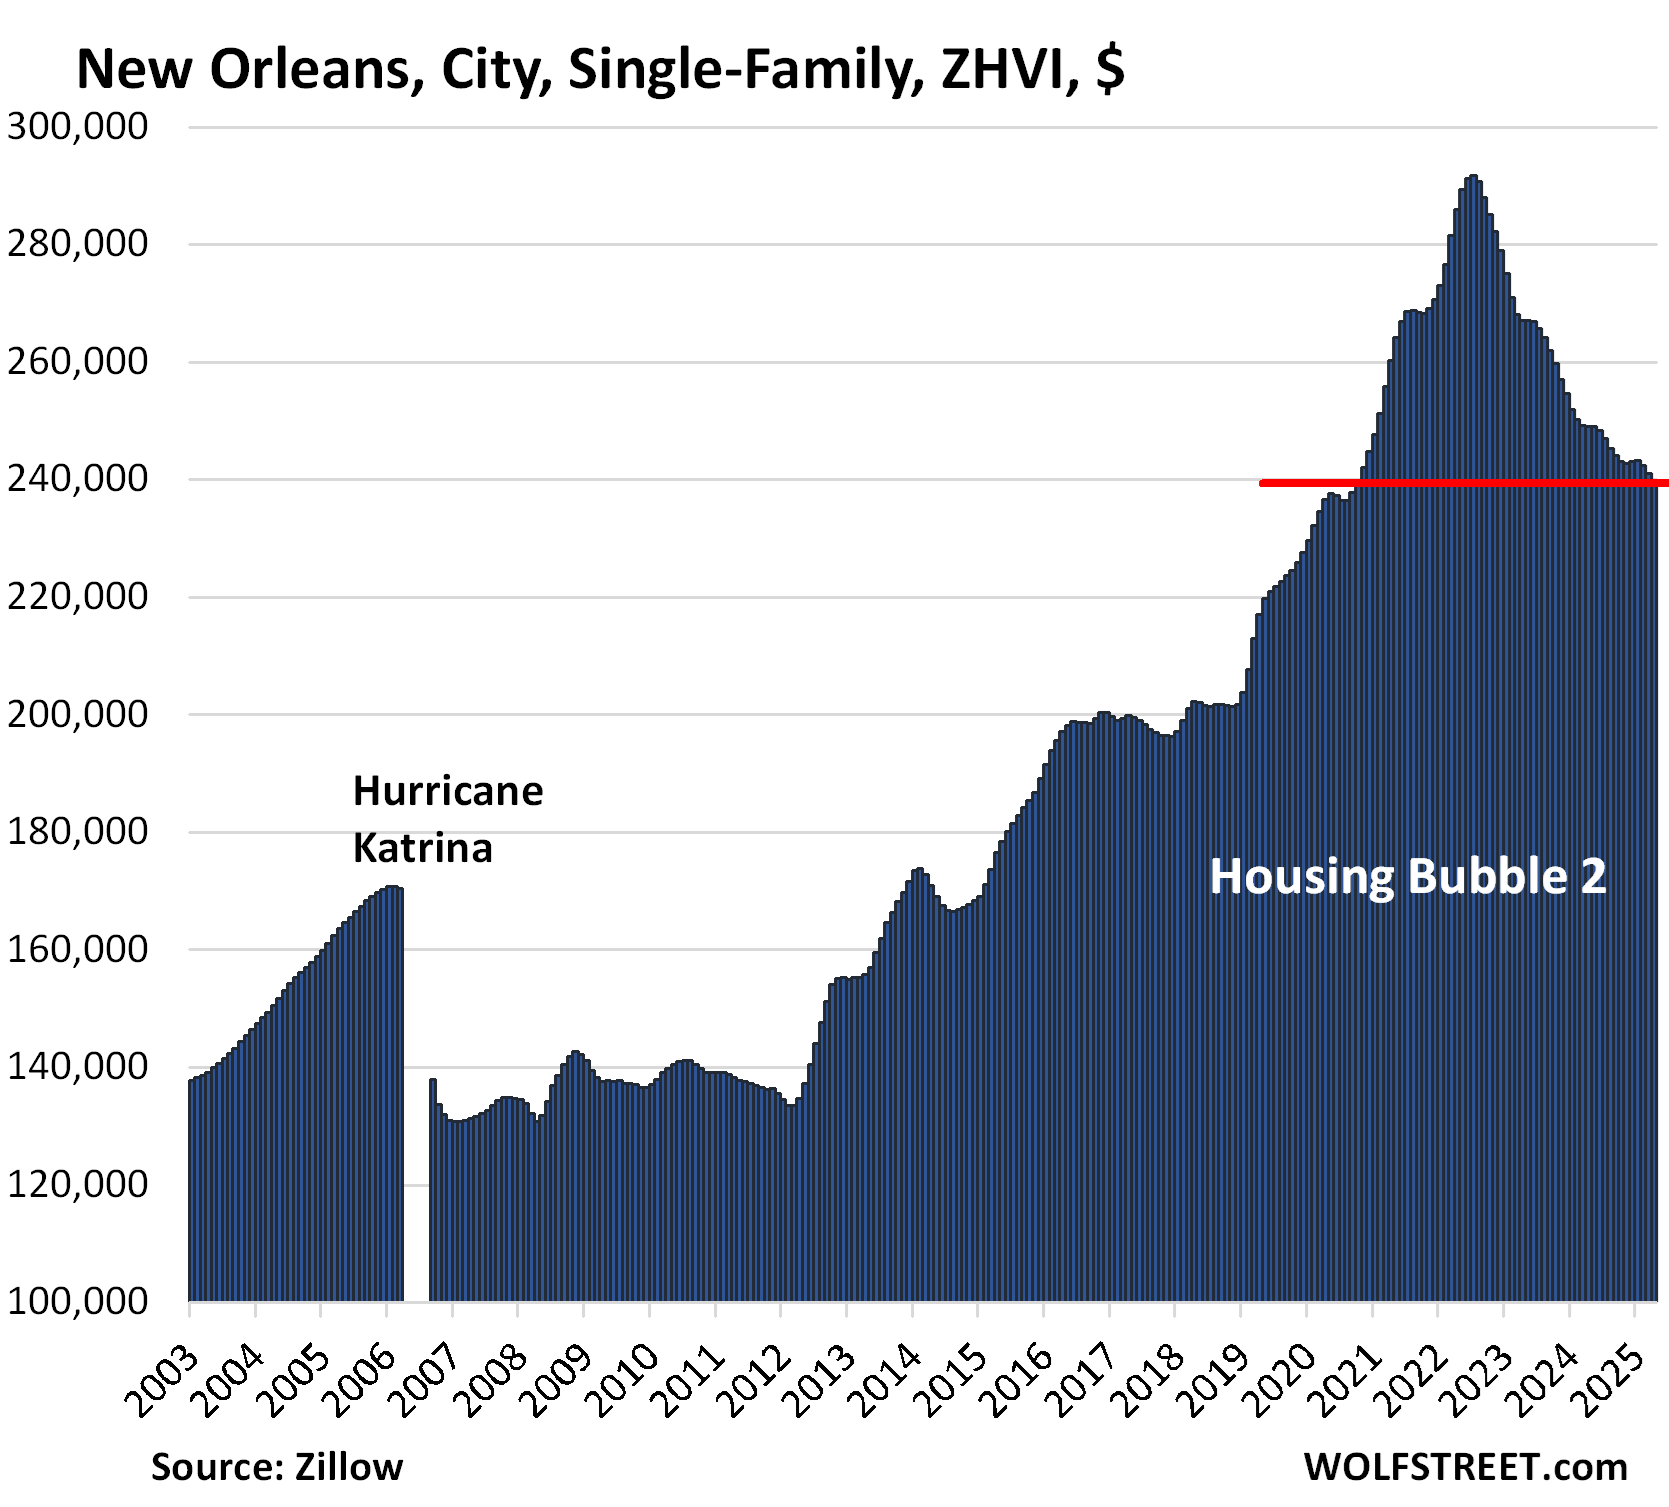
| New Orleans, City, Single-Family Home Prices | |||
| From Jun 2022 peak | MoM | YoY | Since 2007 |
| -16.7% | -0.5% | -3.7% | 110% |
Prices are back where they’d first been in September 2020.
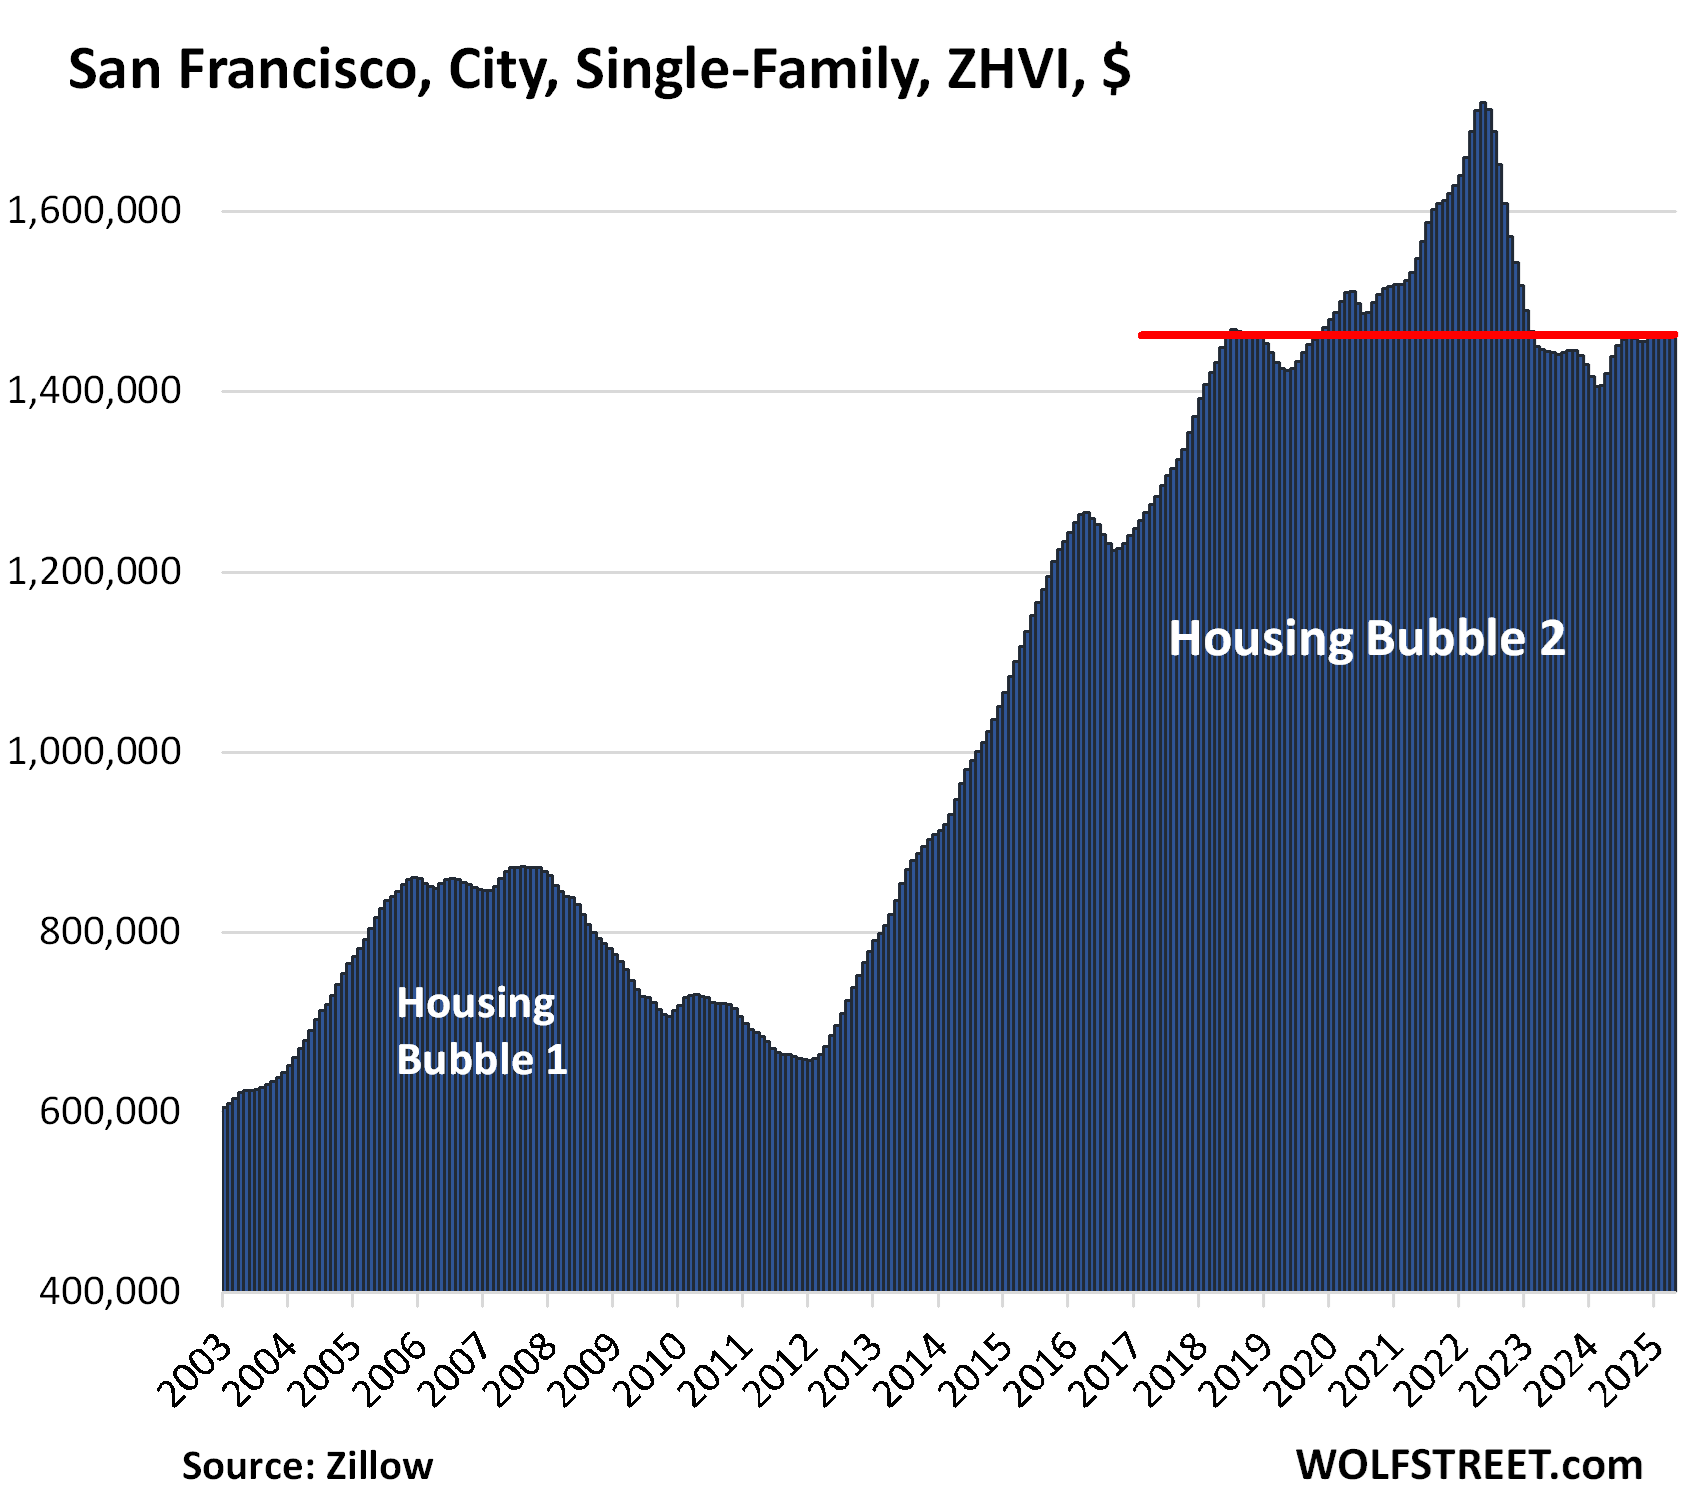
| San Francisco, City, Single-Family Home Prices | |||
| From May 2022 peak | MoM | YoY | Since 2000 |
| -15.1% | 0.0% | 2.9% | 237% |
Prices are now back to where they had first been in mid-2018. That was over six years ago. Over the decade through mid-2022, prices had shot up by 146%.
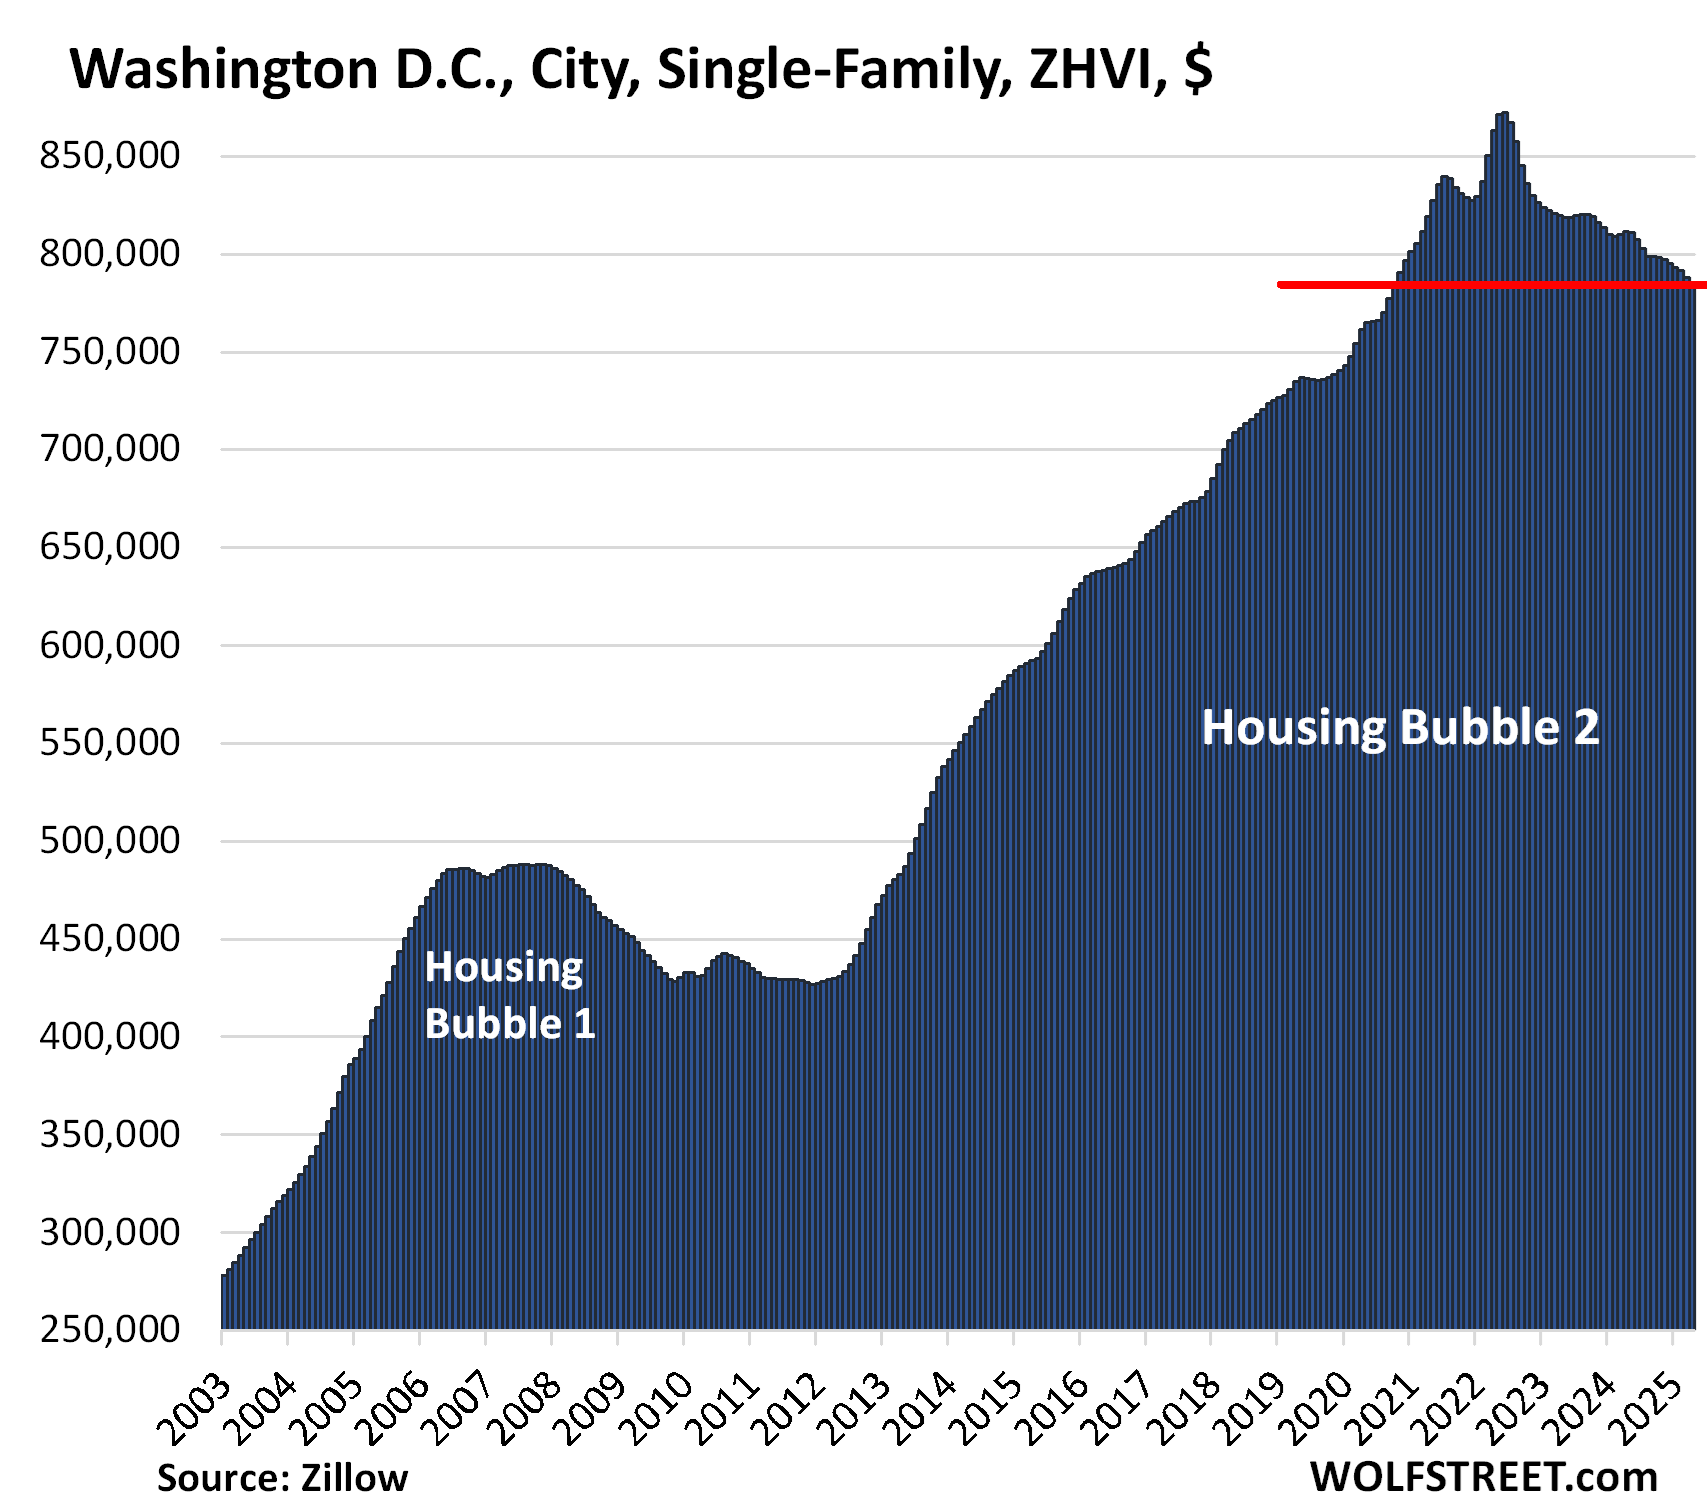
| Washington D.C., Single-Family Home Prices | |||
| From Jun 2022 | MoM | YoY | Since 2000 |
| -10.2% | -0.5% | -3.4% | 282% |
Prices are back to October 2020 levels.
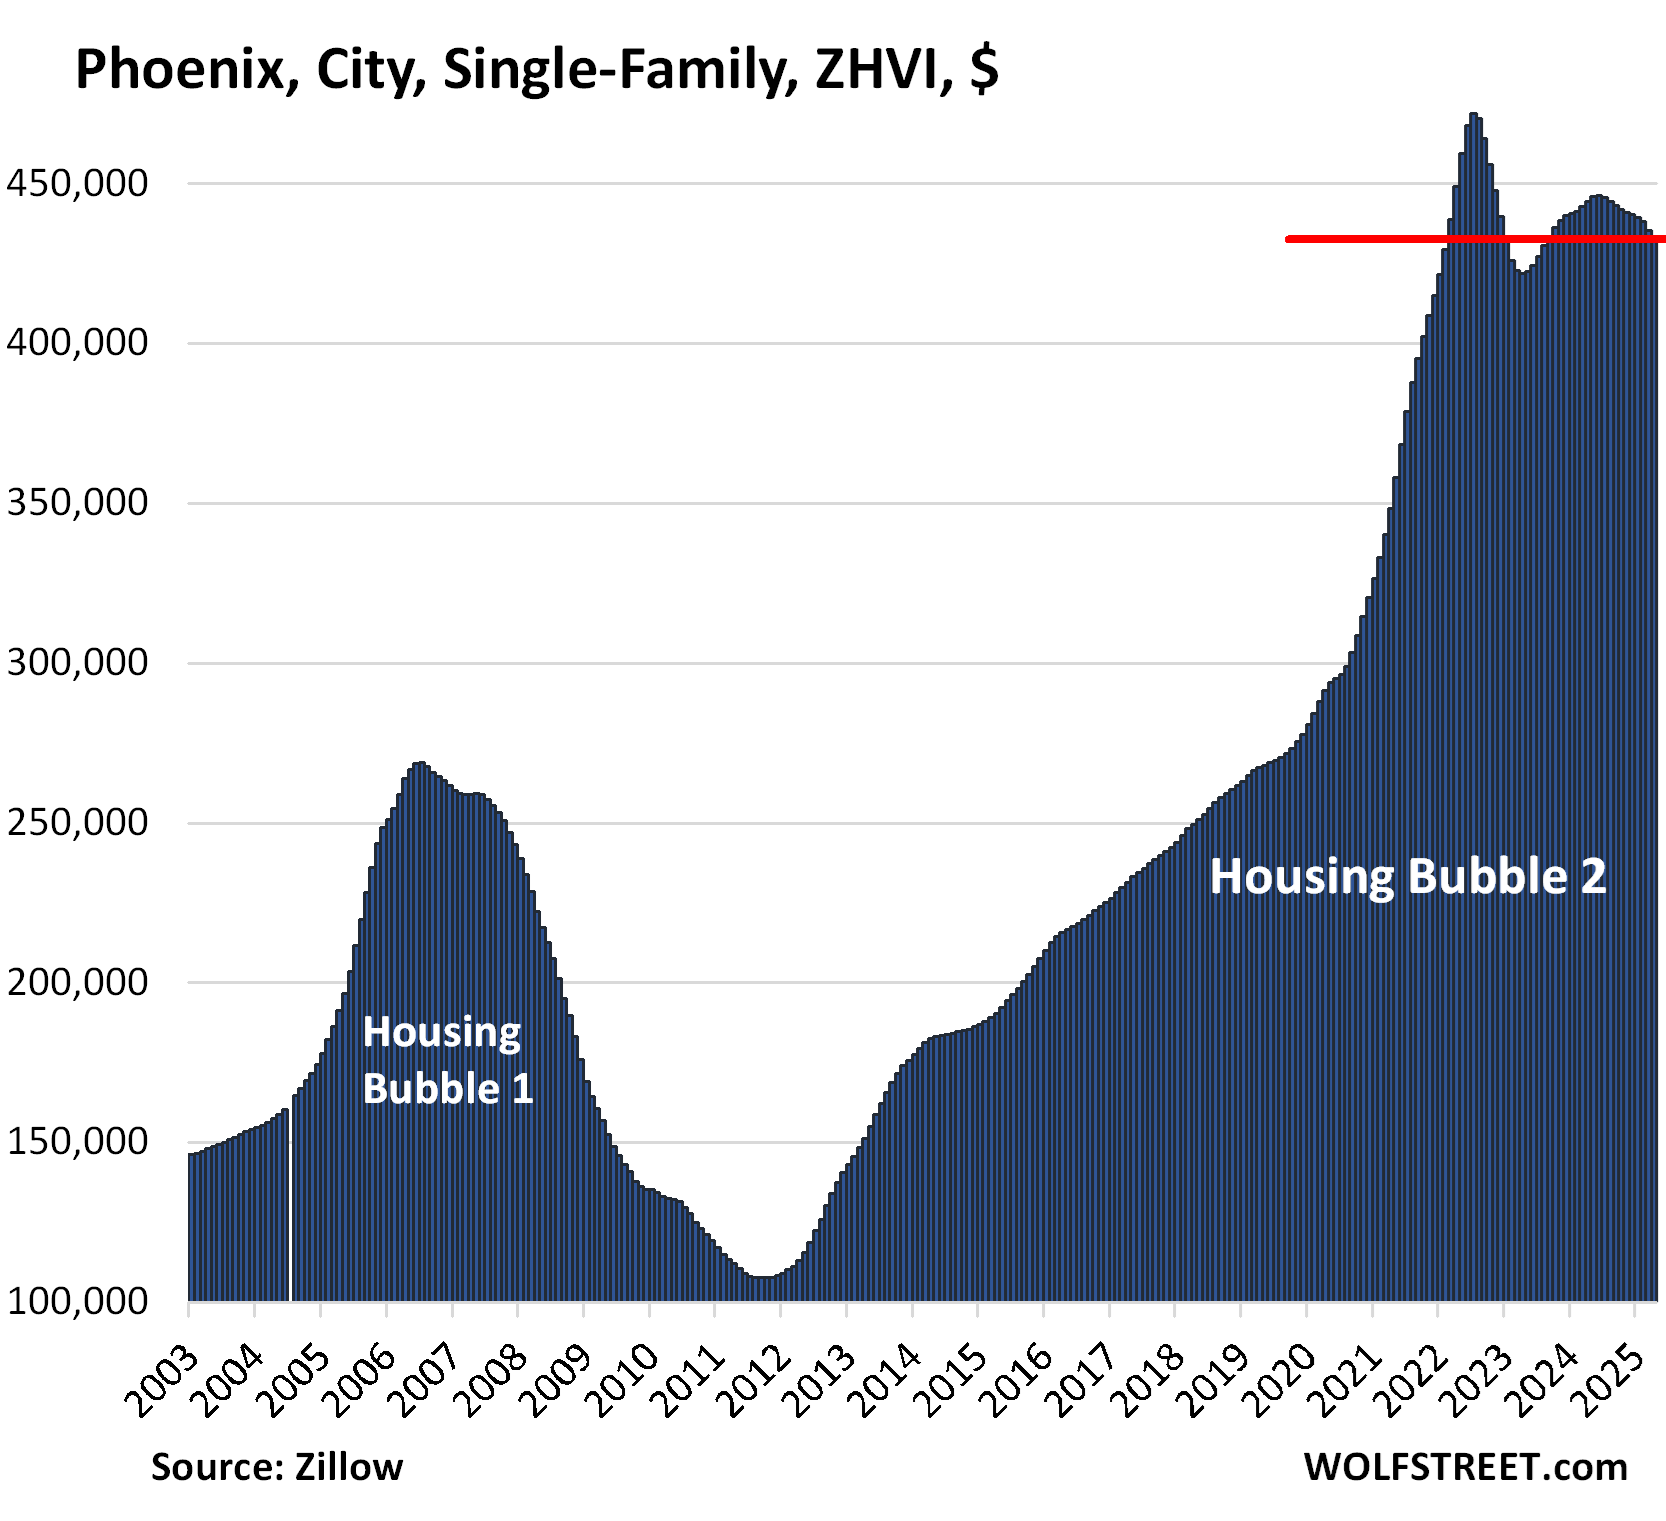
| Phoenix, City, Single-Family Home Prices | |||
| From Jul 2022 peak | MoM | YoY | Since 2000 |
| -8.3% | -0.5% | -2.6% | 256.0% |
The spike topped out in July 2022. That mini-hump topped out in June 2024.
In the 26 months between April 2020 and July 2022, prices of single-family homes had spiked 62%. In the 10 years through mid-2022, prices had exploded by 339%.
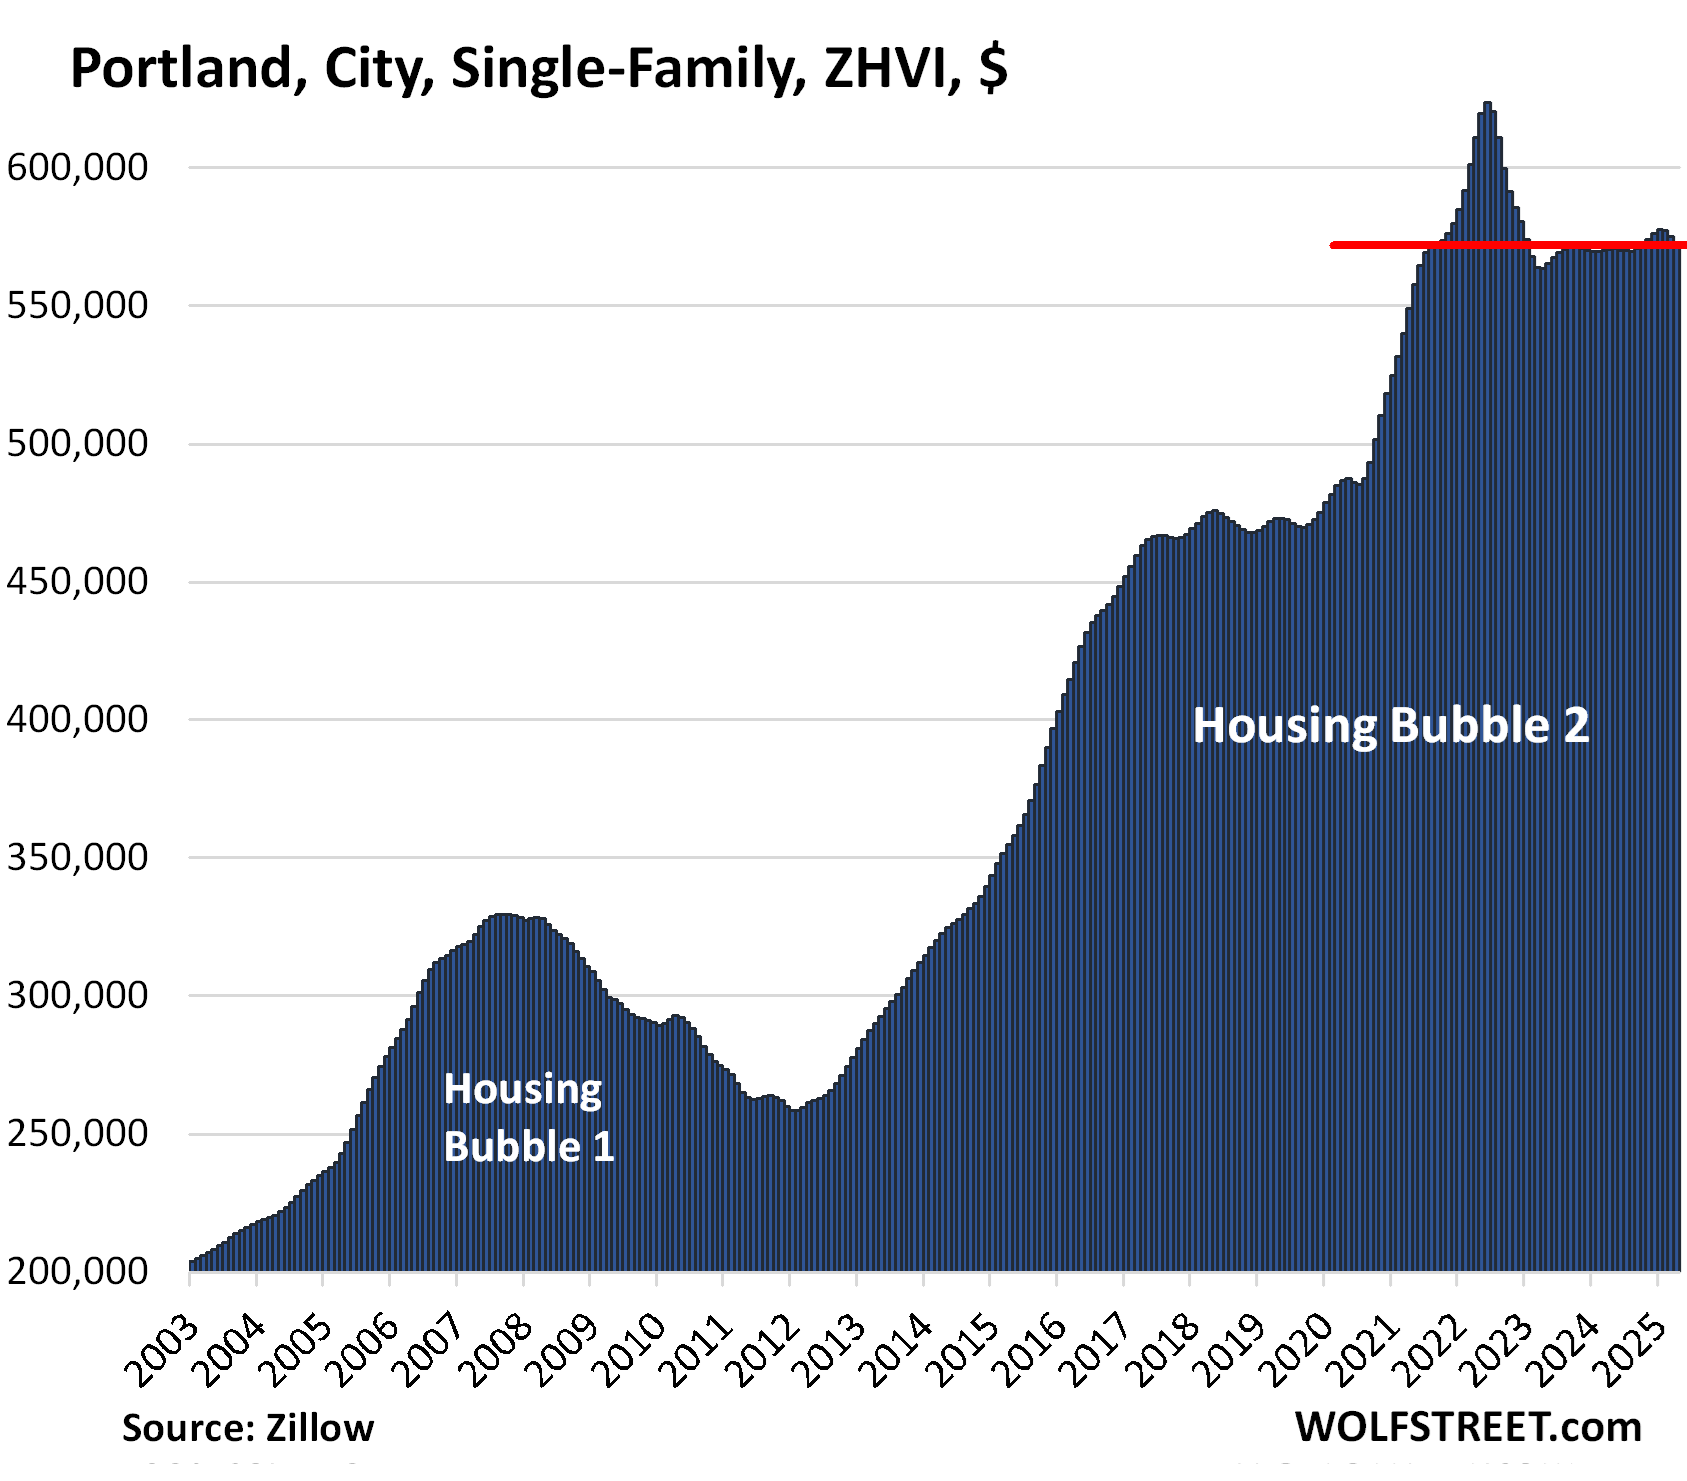
| Portland, City, Single-Family Home Prices | |||
| From May 2022 peak | MoM | YoY | Since 2000 |
| -8.3% | -0.6% | 0.3% | 227% |
Prices are back where they’d first been in August 2021.
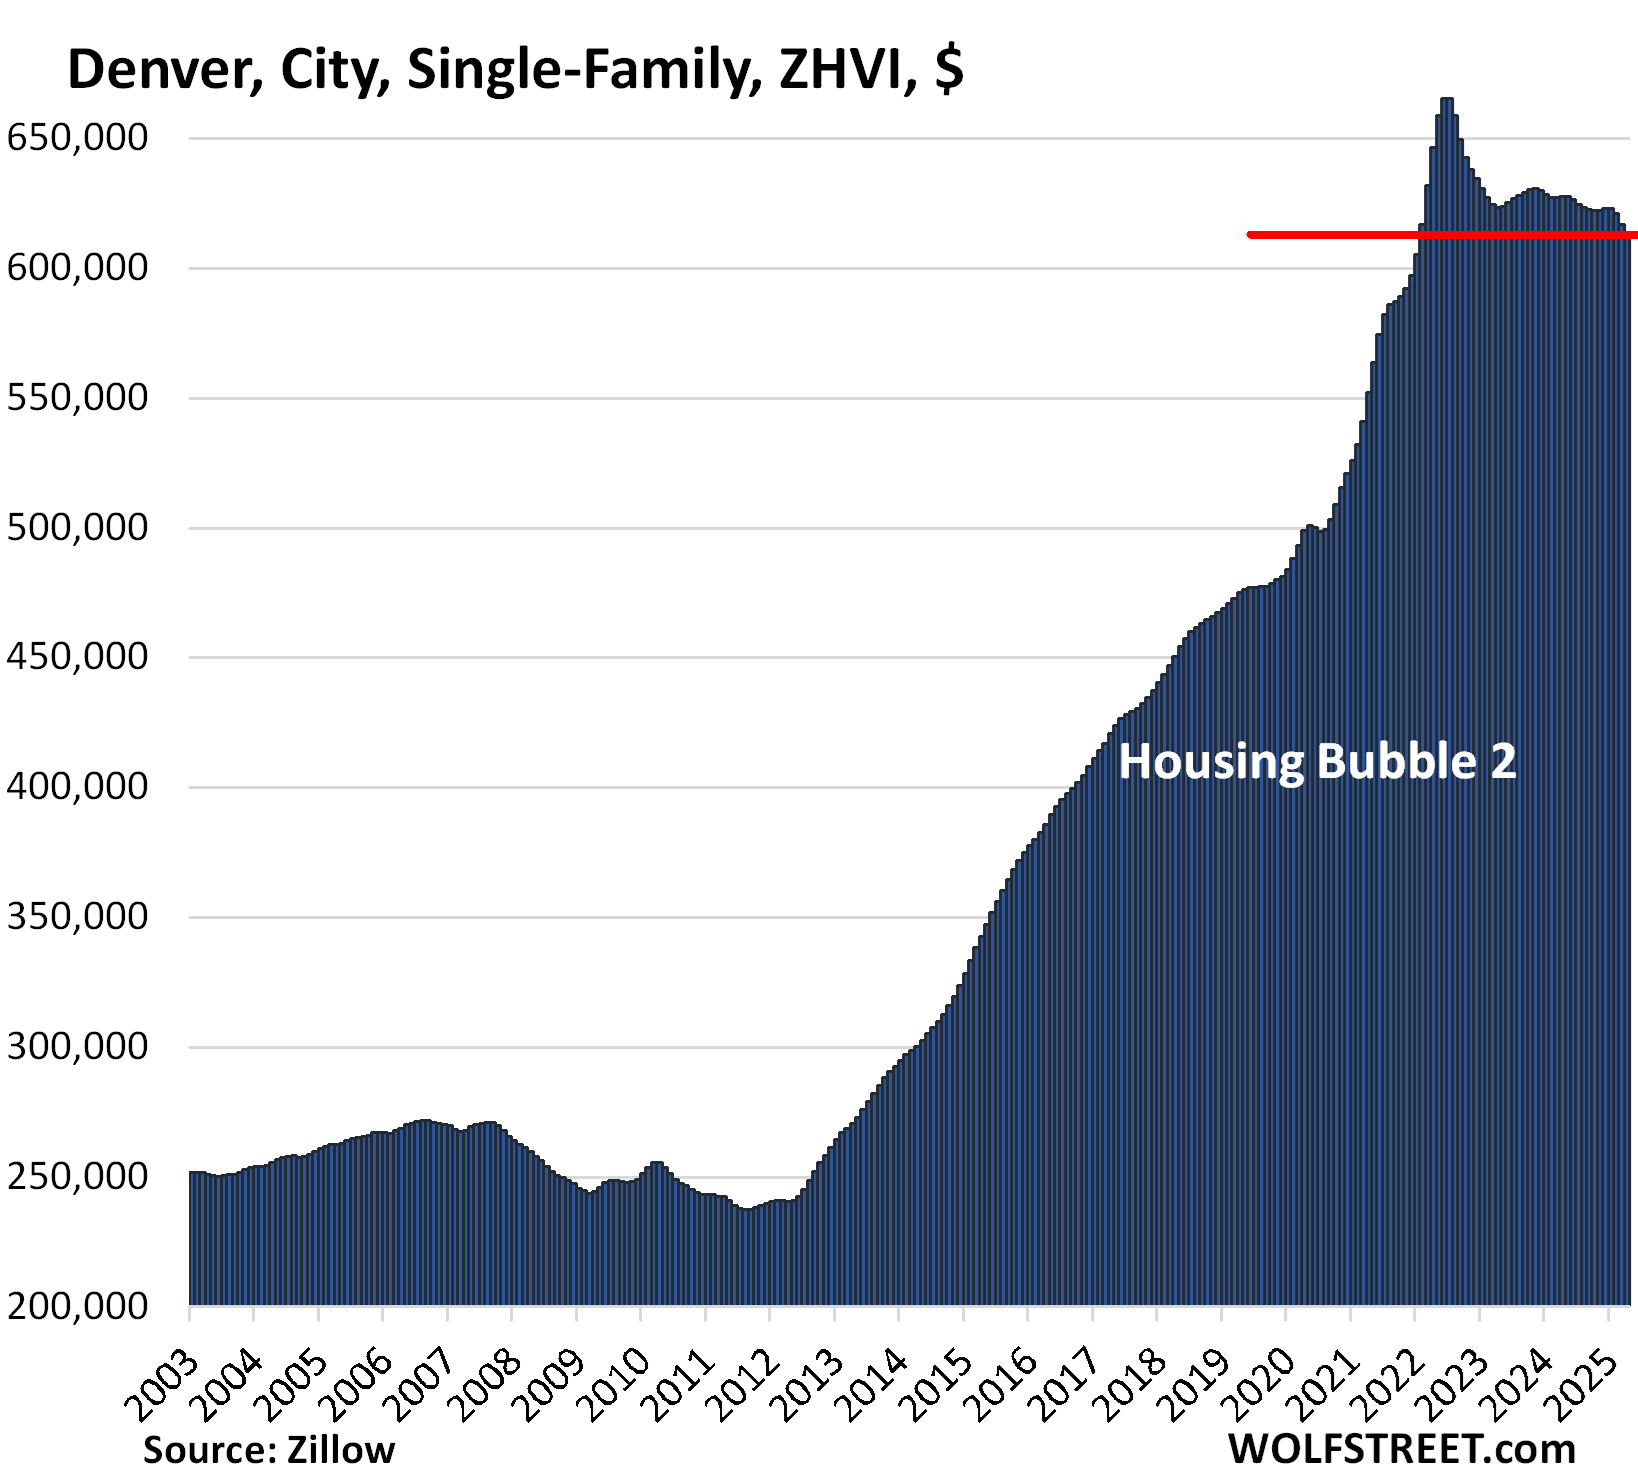
| Denver, City, Single-Family Home Prices | |||
| From Jun 2022 peak | MoM | YoY | Since 2000 |
| -8.1% | -0.8% | -2.6% | 221% |
Prices dropped below February 2022 levels. In the 10 years through mid-2022, prices had spiked by 174%.
| Fort Worth, City, Single-Family Home Prices | |||
| From Aug 2022 peak | MoM | YoY | Since 2000 |
| -7.3% | -0.5% | -2.2% | 196% |
Prices are back to March 2022. In the 10 years through August 2022, prices had spiked by 187%.
Texas didn’t experience much of a Housing Bubble 1, and Housing Bust 1 was therefore relatively mild.
| San Antonio, City, Single-Family Home Prices | |||
| From Jul 2022 peak | MoM | YoY | Since 2000 |
| -7.1% | -0.5% | -3.1% | 154.9% |
Prices are back to about February 2022 levels.
In the 10 years through mid-2022, prices had shot up by 126%, while wages of workers covered by unemployment insurance have risen by only 34%. This is why these crazy home-price spikes are not sustainable; they trigger demand destruction, plunging sales, and surging inventories, the scenario now playing out, even in Texas.
Enjoy reading WOLF STREET and want to support it? You can donate. I appreciate it immensely. Click on the mug to find out how:

![]()
Timing is everything.
Nope – ignorant buyers and an endlessly manipulative ZIRP were “everything”.
For all intents and purposes, 25 years of persistent FED self-delusion turned the housing of America’s hundreds of millions into a perpetual casino of non-stop, highly leveraged, interest-rate speculation.
Wanna live indoors? – Gotta borrow money to lay bets on the roulette wheel.
As with so many other instances, our betters in DC have always known the inarguable path to a healthier society…
It appears we’ll get $2T-3T annual deficits to delay stock market collapse and recession.
Enjoy it while it lasts.
They’re going to destroy the currency and the financial lives of the working class and poor to save asset bubbles for the wealthy insiders who are already positioned to protect their extreme wealth. Jerome Powell and Co. should burn in hell.
I don’t really disagree, but what happened today to make you say that? It’s been clear to me for decades that no one would ever really try to cut spending.
DC,
Both “sides” have perpetuated clearly failed policies for well over 50 years, primarily to enrich their own interest groups.
They have lobotomized themselves to any other function – I picture decades of legislatures consisting of those gigantic mushroom heads from “The Last of US”
And it will happen like this again and again as long as mbs can be leveraged and traded. It’s essentially a license to print money that has replaced production and sale of goods and services in the USA.
Neighbor in San Fran is now selling his home to retire. Was 5 doors down I could go buy his house and still pocket 750k vs what I sold my home a few years back.
Good news is he’s been there since the early 90s and has equity he just needed more advise on pricing and getting out now, my guy informed him he needs to drop the price by about 300 – 500k to get buyer interest in this market to be below the market.
He asked how I got so many offers when I sold my home. I told him all the stupid people came in droves in 2021 / 2022 nothing else was different except his house is much nicer but all the stupid money has disappeared.
Timing is everything…
Yet I suspect in San Francisco that very high-end sales are doing just fine? That silly money is still silly money, but the rest is starting to take a beating? Would be interested in any data on this. Thx.
Your assumption might be mistaken.
1. “very high-end sales” really don’t matter much. There are only a relatively small number of them, and they have zero impact on anything except the commissions paid to Realtors and fees paid to lawyers. But you can read lots of useless stories about them, such as the most expensive sale this year: “Property records show 3699 Washington St. officially sold on May 5, closing at $19 million, half a million dollars less than its original asking price.”
2. In terms of the top tier (top one-third, so that’s not “very high-end”), the ZHVI has dropped by 17%, so that’s a bigger drop. It’s the low trier that has dropped less.
While there are certainly some owners who are in the red at this point, the vast majority of homeowners in San Francisco (including the top tier segment) are very much in the black, and likely very much so.
Yes, which is why a big home-price downturn from the peak nationally would not be a big deal this time around for the economy overall: Not that many people bought near the peak because the price explosion was so short.
Banks are also not at risk from bad mortgages since the vast majority of mortgages were bought and guaranteed by the government and packaged into MBS.
So the Fed can just let this rip.
“Banks are also not at risk from bad mortgages since the vast majority of mortgages were bought and guaranteed by the government and packaged into MBS.
So the Fed can just let this rip.”
Ermm…the Fed is the gut-shot “everything saviour” now – “protecting” the banking system is just one of its tasks.
So if the G comes up short in hundreds of billions in G backed MBS – there is nothing other than the Fed to “save it” (just like in hundreds of other areas of ruinous policies – see MMT, see debt death-spiral…)
These cities all seem to represent a wide range of average home prices.
To a certain extent.
What they almost all have in common, though, is an idiotic overvaluation compared to 2000-2002, in comparison to American’s actual earning power growth during the exact same period (The Necromancy of ZIRP).
I think we all have to consider this in terms of the “aggregate housing value” and the “aggregate American earning power”.
As Wolf has pointed out many times, there are a LOT more Americans now than in 2000. 30 million more?
There sure aren’t 20 million more houses. So each American get less housing than they used to but maybe the total value of housing/earnings is more or less steady?
SOMEONE is paying all those mortgages and rent. At least most of the time.
Right now you have some people that paid $600k and have a 3% mortgage, and others who pay $510k and have a 7% mortgage. Who will end up in a better long term position depends a lot on when they have to sell. Meanwhile, a third family is renting one of those houses for $2500 a month and will spend at least $150k over the next five years “waiting for prices to collapse”.
In my neighborhood It takes 12k per month to own a home and 6
5k per month to rent the same home
In this case the math is very clear if to buy or rent a home
On top of this inventory is increasing and prices are going down albeit gradually.
People who rent today and buy after few years would do well i think.
Not every market is like this.
This is in so cal
But some of the cities in this list are four times as expensive as others.
Would homes in Ft Worth have practically been worthless without the ZIRP?
*Not* going up 100%, 200%, 300% (Oakland. Oakland!!. Snort) is *not* the same as becoming “worthless”.
In the decades before the ZIRP-fueled insanity, homes might appreciate 2-3% per year – so perhaps 25% per decade (ignoring compounding).
It wasn’t like no new homes/apts/etc were ever *not* going to be built – adding to price constraining supply – so why in the hell should homes appreciate at some mad rate?
It is only ZIRP-meth that created the “generalized” sense that homes can somehow rationally appreciate 30% per year – forever (see truly moronic pandemic bubble).
Then, caught in the home valuation/property tax exploitation racket of their own making, local government officials spend most of their time conspiring to strangle new home supply (to support idiotic levels of valuation/taxation of *existing* housing – owned by the schmucks empowered to vote).
Looking at those charts just gets me pissed off.
You, me, and 60%+ of the rest of the country.
This is how you get revolutions.
Sadly it seems to me that prices need to go back down to approximately 2015 levels to be anywhere near the ballpark of “reasonable,” whatever that means. We’re going to need to see steeper drops going forward to see those levels again in my lifetime.
Bozo, at these mortgage rates they need to decrease about 25% from their recent all time high (around January 2022) after accounting for the increase in household income since 2022.
That is based on a 10% drop in price for a 1% increase in the 30 year mortgage rate.
Maybe prices will stay flat while household income increases by at least 2.5% annually for the next 5 years.
AD, this drop in housing kind of reminds me of the 1990s. I didn’t look it up but relying on memory, a home bought at the 1990 peak in the SF Bay Area took approximately 6 years to find its low point of around a 20% drop. Then from there took maybe another 3 years or so to get back to the 1990 peak. It was nearly a decade of hitting a peak, dropping 20%, and getting back to the previous peak. Seeing that Oakland and SF are at prices seen 5 to 6 years ago and are now 3 years away from the 2022 peak, I wonder if it will be similar and we won’t see it back to the 2022 peak until the 2030s.
Did you see any drop in Fremont Sunnyvale sanjose in Bay area?
These are hot destinations and sfo and Oakland people are going there.
San Jose prices dropped some (seasonally adjusted three-month average as all data here). But the peak was in Jan 2025; the top of the pandemic spike was in 2022, then prices fell quite a bit, but then rose again ultimately by a little more than they’d fallen, so a new highs were set. But since January, prices have dropped, seasonally adjusted three-month average. If prices drop an additional 4.2%, they will have fallen below the 2022 high.
“These are hot destinations”
Few people other than realtors and firemen use the word “hot” when discussing real estate, and you don’t seem like a public servant…
“These are hot destinations”
And Swedish Bikini Models are the Cynosure of All Eyes.
But 99%+ of all male humanity are never going to have any relationship whatsoever to them – so what is the point?
The “hot” outlier markets are just that – outliers. And therefore irrelevant to the 99% remainder of the market.
– I also blame demographic developments. The baby boomers are busy retiring and the next generation of workers is moving into the labour forcce.
Maybe some are busy retiring but not all- 19% of adults aged 65 and older were employed in 2023, nearly double the share from 35 years ago.
Including me, and loving it, not ever gonna retire, LOL
Not sure if this is your only job but you clearly love what you do and are good at it. Honestly wish I was in your position as I move closer to retirement as the “romantic” view I had of what I thought I might do when I retire is not lining up with where I am now. Figure I may as well work until I discover what I want retirement to be, and as a parent I am concerned about the future so ensuring solid estate planning not a terrible thing.
I’d love to be like Alex Lidow (founder of Internation Rectifier): worked until he was 95, died at 100 :)
Like to see a chart of US inflation vs. US housing prices. The raw numbers might back up the idea that home prices and inflation are highly correlated, and help explain why retirees do not downsize. Perhaps houses are an inflation proof asset?
They’re NOT correlated. Look at Housing Bust 1, home prices plunged, while consumer prices continued to rise.
Since 2000, there was 90% consumer price inflation (CPI). And the home prices in this list here have soared by far more than that, such as 300% in Oakland and 237% in San Francisco and 175% in Austin.
If home prices rise with inflation over the long term, if that is true, there will be a massive (but maybe slow) drop in home prices to bring them back in line with consumer price inflation.
Residential real estate seems to have increased slightly ahead of the average CPI over the past 30 years, 4.3% vs 3.8%. Health care costs have fared better (worse) at 5.5%.
I have viewed houses as an an inflation-resistant asset, since what I saw in the 1970’s. But then occasionally deflation happens, for years, as when my SoCal townhouse drew down by half in 2009. (I had paid steadily since 1994, so I was never underwater.) Steady as it goes for 30 years has sure paid off.
Meanwhile, not perfectly smooth, as in ’09, the felon next door (who weaseled in with the failing divorcee there) went for a long time paying no payments, while making life excruciating for us. But that sort of thing is unlikely to be replicated, I hope.
Here in flyover southern Ohio the market continues to be tight. A large percentage of sellers are still listing their properties at 2022 prices.
I’ll sometimes check the local County Auditor’s website and compare the seller’s asking price to their purchase price. The magnitude of the some of the differences are laughable, even after adjusting for inflation.
The only real difference I see now is some properties are taking longer to sell. Still not a buyer’s market by any means. More of a “less bad” market, and less bad is still bad. I’m sticking to the sidelines for now.
I wonder how the Fed feels now about the decision to repress interest rates to the extent that was done. How would they rationalize that? Possibly they would say: at the time they did not know how bad the pandemic would be and they used a “worst case scenario” policy.
I’d still agree with Wolf though. This was a major policy error. What a shame the residential RE prices don’t come down as quickly as they went up. Too many people are priced out of the current market.
“I’ll sometimes check the local County Auditor’s website and compare the seller’s asking price to their purchase price.”
This is one of the smartest things any home buyer can do – and almost none do it.
To not know the maximum about the other size in *any* negotiation is simply an invitation to obscene abuse – clothed in baloney like “the market price is the market price” – sure, pal, until the second it changes.
I candidly don’t think they care.
I’m curious – how are real estate agents doing in this market? Are their earnings down substantially? Are people dropping out of the profession?
Who cares?
Probably
Hopefully
“how are real estate agents doing in this market?”
Hopefully they are being boiled in their own lard.
I know several Realtors who left the industry, doing something else.
As another poster so poignantly put it, a lot of them are burnishing their pole dancing skills at this time…
As per Austin, “No housing chart should ever look like this.”
Totally agree. I would love to see that average price drop to $450K & erase about 90% of that crazy price increase. To do so, looks like about 2 more years of high interest rates.
I believe real estate is cyclical (15-17 year cycles) I sold the majority of my holdings in 2022 in Florida and Georgia. I was a bit early on the Georgia properties as they are just now starting to correct. If we have a recession (which I believe we are in) real estate in the rest of the country will drop. Ultimately, real estate will go back up due to the devaluation of the dollar.
Seeing zero decline here in Seattle…Zero. I don’t care what the stats are showing. There is zero decline. Longer times, yes, but zero decline. The woke mob is always willing to vote in more property taxes and push real estate values even higher. That way, they can double dip. We’ll see if it reaches a tipping point with the latest ridiculous tax increases that just passed here. So far, nada.
“Seeing zero decline here in Seattle…Zero. I don’t care what the stats are showing.”
RTGDFA before you post. At least look at the pictures. NO ONE said a word about Seattle and there are no “stats” about Seattle in this article. So don’t complain about what doesn’t exist, just because you didn’t read the article and THOUGHT it might be in there somewhere.
Downtown Seattle sure took a big hit during COVID. It’s not recovered. I’m just lucky I downsized to a tiny studio in time.
One good thing is my property taxes have actually gone down even with the tax increases.
I’m more worried about a monetary and fiscal crisis than a housing crash. There’s a $2T deficit, and the legislative branch won’t reduce entitlements which are creating the deficit. A contraction like shown in the images is pretty characteristic of a rapid run up. As the federal reserve turns the printer back on full speed to account for massive deficits, houses will look very cheap.
The impending doom is so obvious. How come almost everyone ignores it? They ignored the Dot com insanity. They ignored the housing bubble of 2008. They ignored the current housing bubble.
But the financial crisis will dwarf all of these.
For this (de)generation of Americans, unless they are currently set on fire, they refuse to believe that fire actually exists.
Actually, it really is unbelievably daft that after perpetual bubbles from 2000-2020, some subset of people with money to incinerate managed to get it up (again) for the pandemic bubble – “Only 1 Million Killed! – Imagine how much higher home prices might have soared if it had been 5 million killed…)
The pathology perpetuates itself because the G slews every policy to that end (Son of ZIRP, Forever).
One small/tiny grace is that the mound of madness was somewhat smaller in Implosion 2.0 than Implosion 1.0 (“Burnt Animals Can Learn”) and that the Fed got skittish about putting quite so much meth into the punchbowl in 2022.
(Although they re-opened their trenchcoat again a bit in late 2024)
I wonder how many homes sold at the inflated prices, and how deeply the buyers will regret it once the properties come down for a hard landing?
Maybe some owners will actually use the house as a home for raising their family? That’s what we did.
“I wonder how many homes sold at the inflated prices”
In Implosion 1.0 (2008-2015), approximately 16% of all SFH with mortgages (8 million SFH out of 50 million) went into default and likely lost all equity they had in “their” homes and enjoyed all the other fun aspects/fees/hounding of defaulting on massive debt obligations.
In the latest cluster, there was less time for the true stupidity to build up a maximal head of steam (although ZIRP had kept a slow roiling boil for a long time – mainly to “fix” the *prior* disaster).
A guess – Implosion 2.0 might be 60% the size of Implosion 1.0 (**ignoring all the other correlated asset valuation disasters in every other asset class due to ZIRP**)
Wolf, I am curious as to your thoughts on why the Case Shiller data does not reflect the true status of the housing market. Thanks
https://wolfstreet.com/2024/09/02/why-well-replace-the-case-shiller-home-price-index-for-our-series-the-most-splendid-housing-bubbles-in-america/
Here are 5 reasons by I stopped using the Case-Shiller Home Price Index:
1. The Case-Shiller index only covers 20 cities. So it has a “20-city index” that underweights Texas (with only one market), overweights California (3 markets), and lacks other big markets entirely, such as Philadelphia. So the 20-city index EXAGGERATED the housing bust price decline because Texas didn’t have a housing bust, but it was underweighted. So the 20-city index is NOT a national index. And do NOT confuse it with a national index.
2. To fill in the gap for a national index, the CS adds the data from the FHFA house price index, which is based on prices from mortgages that have been securitized by Fannie Mae and Freddie Mac. It doesn’t include data from sales where Fannie and Freddie mortgages were not involved (cash deals, jumbo mortgages, VA mortgages, etc.). So this FHFA house price index is systematically skewed to Fannie and Freddie mortgages, and it systematically skews the CS index. To include this data is unforgivable, and for that reason, I have never ever used the “national” Case-Shiller index.
3. The CS indexes for the 20 cities are available only as index value, with that value set at 100 for the year 2000; and not as dollar prices. So by looking at the index of each city, as I do, you have no idea how expensive they are in relationship to each other.
4. The CS was invented by three guys at a university in 1991 on a shoestring. It was a huge advancement at the time over median prices. The three guys – Case and Shiller being the two lead guys – formed a startup company and commercialized the index, and then sold the company. It has changed hands several times since then and now is part of S&P. Neither the prior owners nor S&P invested in the index to gather data on more than the 20 cities and to use modern data collection technologies. So it has been left behind.
By contrast, Zillow has invested billions of dollars to build its “Database of All homes,” and it continues to invest in it. This database contains everything… property tax records, MLS records, data from the local Realtors associations (especially useful in Texas which is a non-disclosure state), data from Zillow postings, pictures of the properties, transaction histories, etc. It has everything the CS has (sales pairs) plus a gazillion more data points on individual properties in all markets.
5. The CS uses an algo to weight the sales pairs. That is the shortcoming of the sales-pairs method. You have to assign weights to the sales pairs, depending on when the prior sale occurred. For example, a sales pair where the prior sale occurred a year ago is weighted heavily. A sales pair where the prior sale occurred 20 years ago is weighted much less. These algos are decisions, and not current market conditions. With the sales-pairs method, there is no way around these algos, but they’re human-designed algos, and so part of what you’re seeing is the calculation of these algos. And I have seen it produce some strange results.
6. The Case-Shiller lags 3-4 months, which is unforgivable with today’s data-gathering technologies. It’s just outdated.
Thank You!
Thanks for the great explanation. I quit following it after seeing your charts
Located in central Illinois and a three-hour drive from Chicago, Decatur is U.S. News’ (1st) most affordable place to live for 2025-2026. Decatur earned the top distinction thanks to its mixture of low cost of living and affordable housing costs. The city’s median rent is just $570, and its median home value of $89,855 is the second lowest on this list – about a fourth of the national average of $370,489.
2nd place goes too the thriving Metropolis of Enid, Oklahoma. There are still many good places to live in America, beyond the smoke and mirrors $FOMO and $YOLO inflation cities that are overcrowded with crime and homelessness.
Did cities like Enid and Decatur experience a real estate bubble as well?
If not, what do you think prevented that from happening?