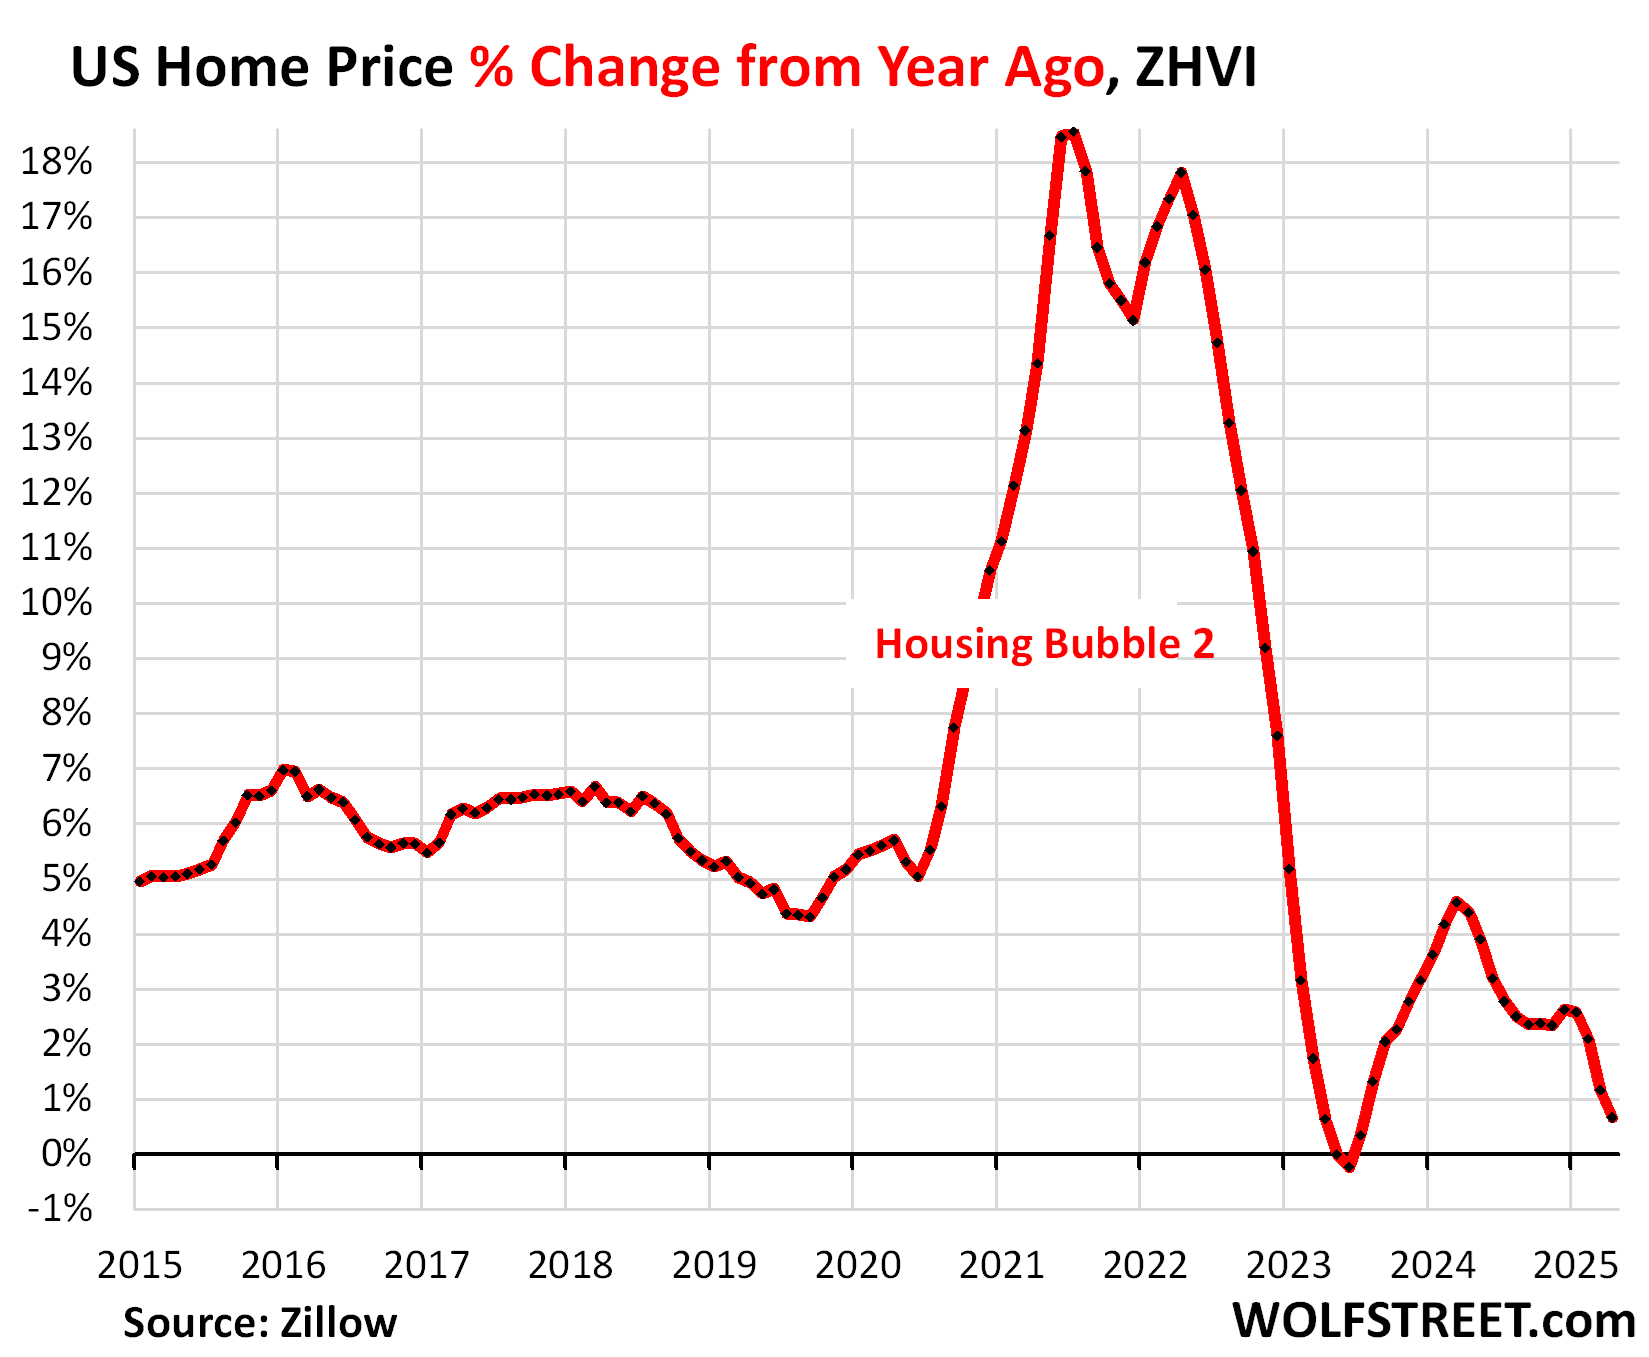
National year-over-year price gain shrinks to 0.7%. Now 18 of 33 metros have YoY price drops: San Diego, Austin, Tampa, Miami, San Francisco, San Antonio, Dallas, Phoenix, Orlando, Atlanta, Denver, Raleigh, Houston, Birmingham, Charlotte… YoY gains shrink in Los Angeles, Boston, Chicago, New York, Philadelphia, Columbus…
By Wolf Richter for WOLF STREET.
This is spring selling season when home prices in many markets rise sharply after declining during the winter, and they did so a year ago, and two years ago. But in April, prices of single-family mid-tier houses, condos, and co-ops across the US rose only 0.65% from the prior month, much less than in April 2024 (+1.15%) and in April 2023 (+1.34%). And in March, they rose only 0.21% from the prior month, much less than in March 2024 (+1.14%) and in March 2024 (+0.75%). A similar pattern played out in February.
This much smaller month-to-month price increase in April caused the year-over-year price gain in homes across the US to get whittled down to just 0.65%, continuing the trend of lower year-over-year gains.
In 18 of our 33 large and expensive housing markets, prices are already down year-over-year. And a bunch of them are in fairly steep declines from their respective peaks. Even in San Diego, prices declined year-over-year as active listings ballooned by 70% year-over-year while demand has plunged.
The growing list of Down Year-over-Year.
Similar scenarios played out in the 33 Metropolitan Statistical Areas (MSA) here: Month-to-month gains in April – if any – were smaller than a year earlier. And the group here whose prices declined year-over-year expanded in April to 18 (from 14 in March, and from 7 in February).
Year-over-year declines in April:
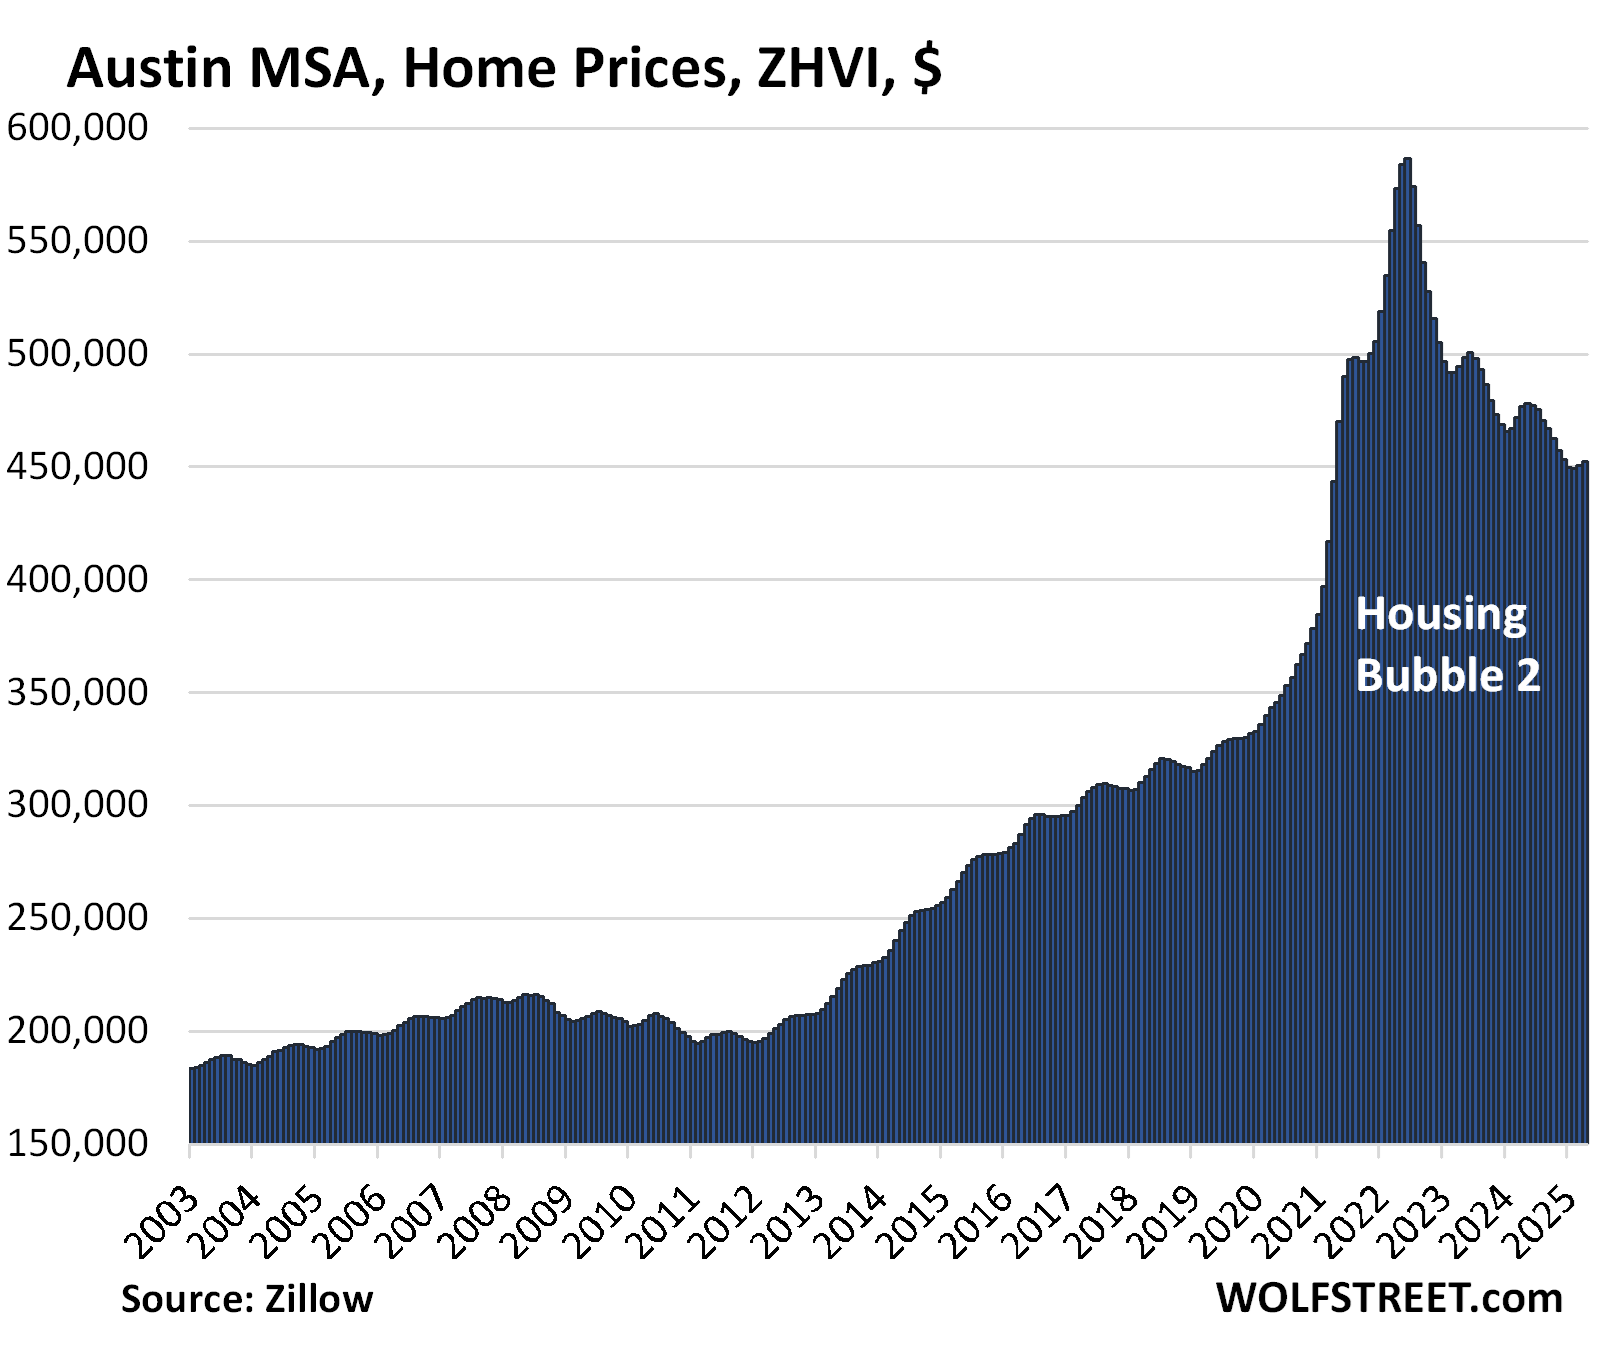
- Austin: -5.1%
- Tampa: -5.0%
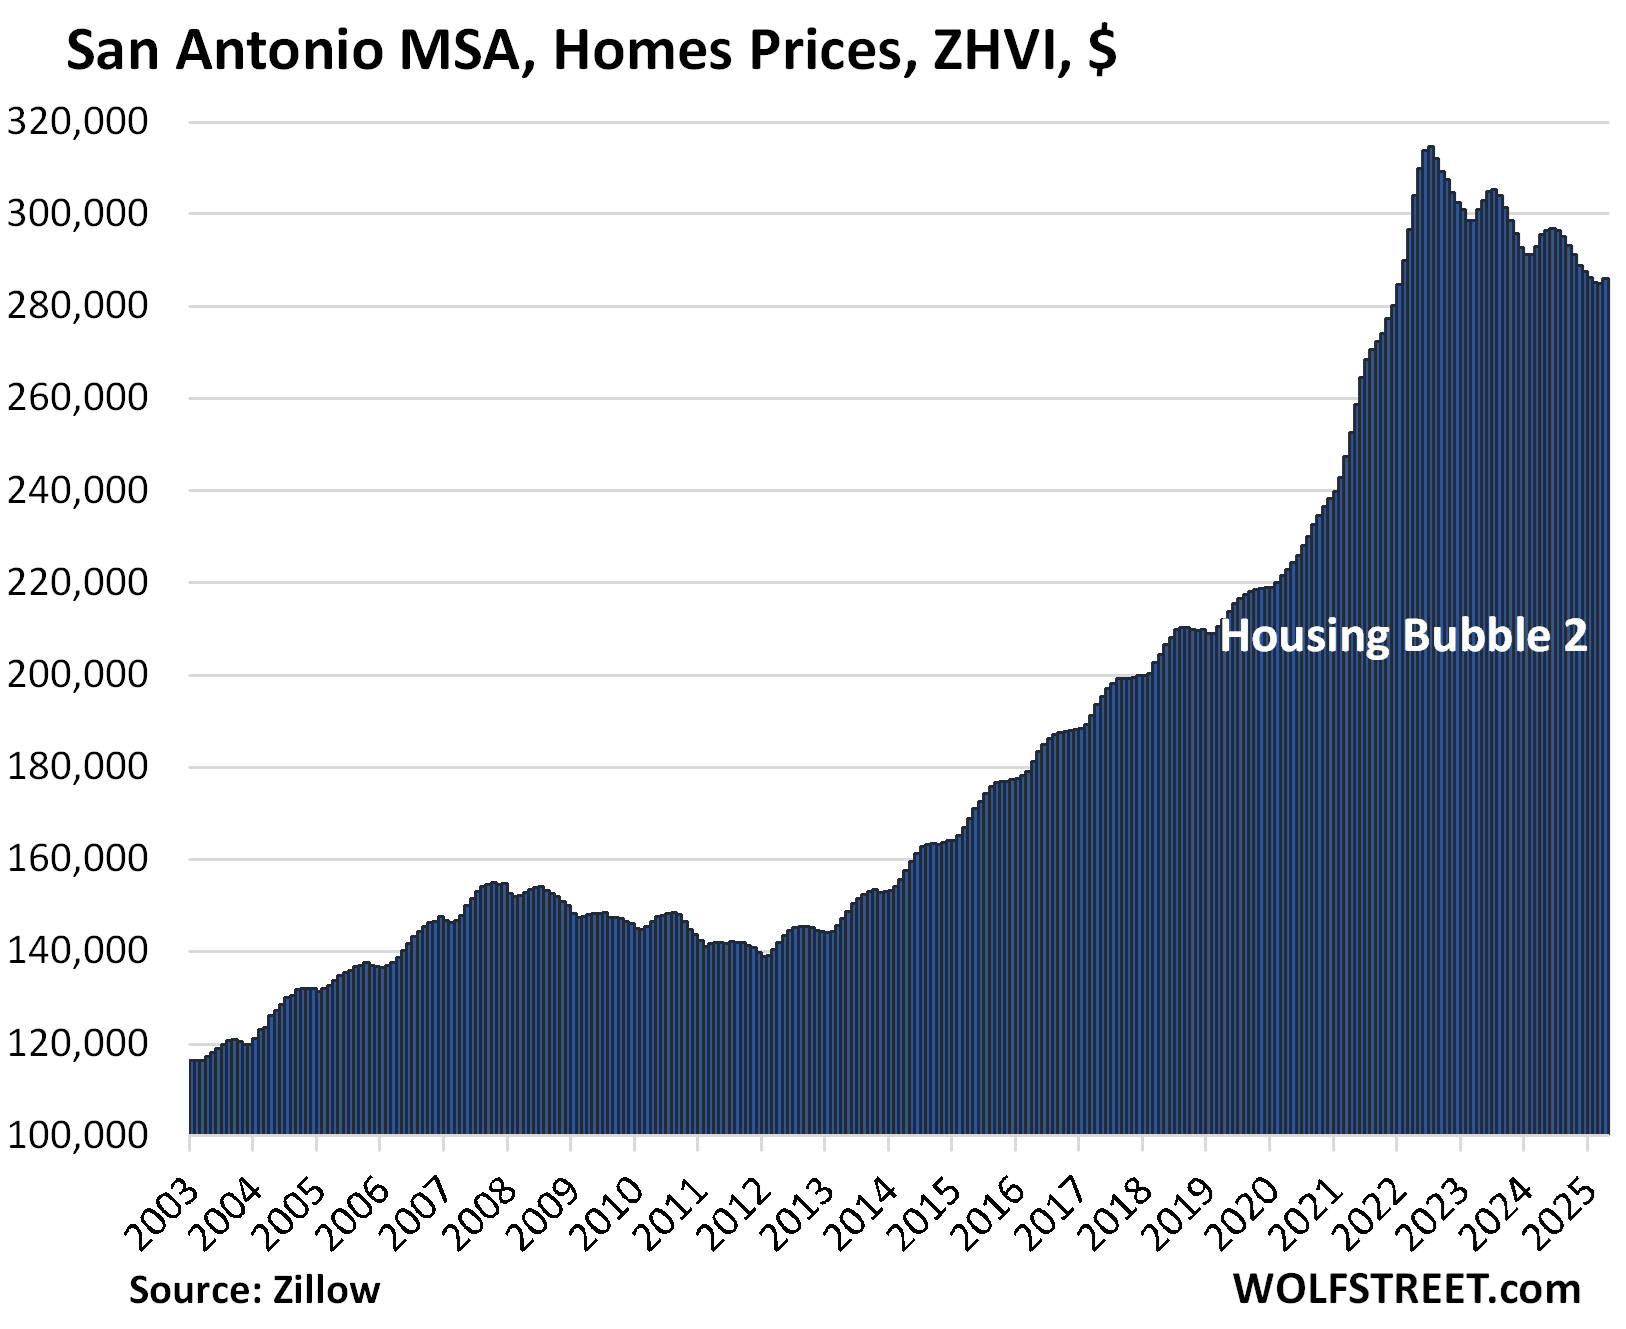
- San Antonio: -3.2%
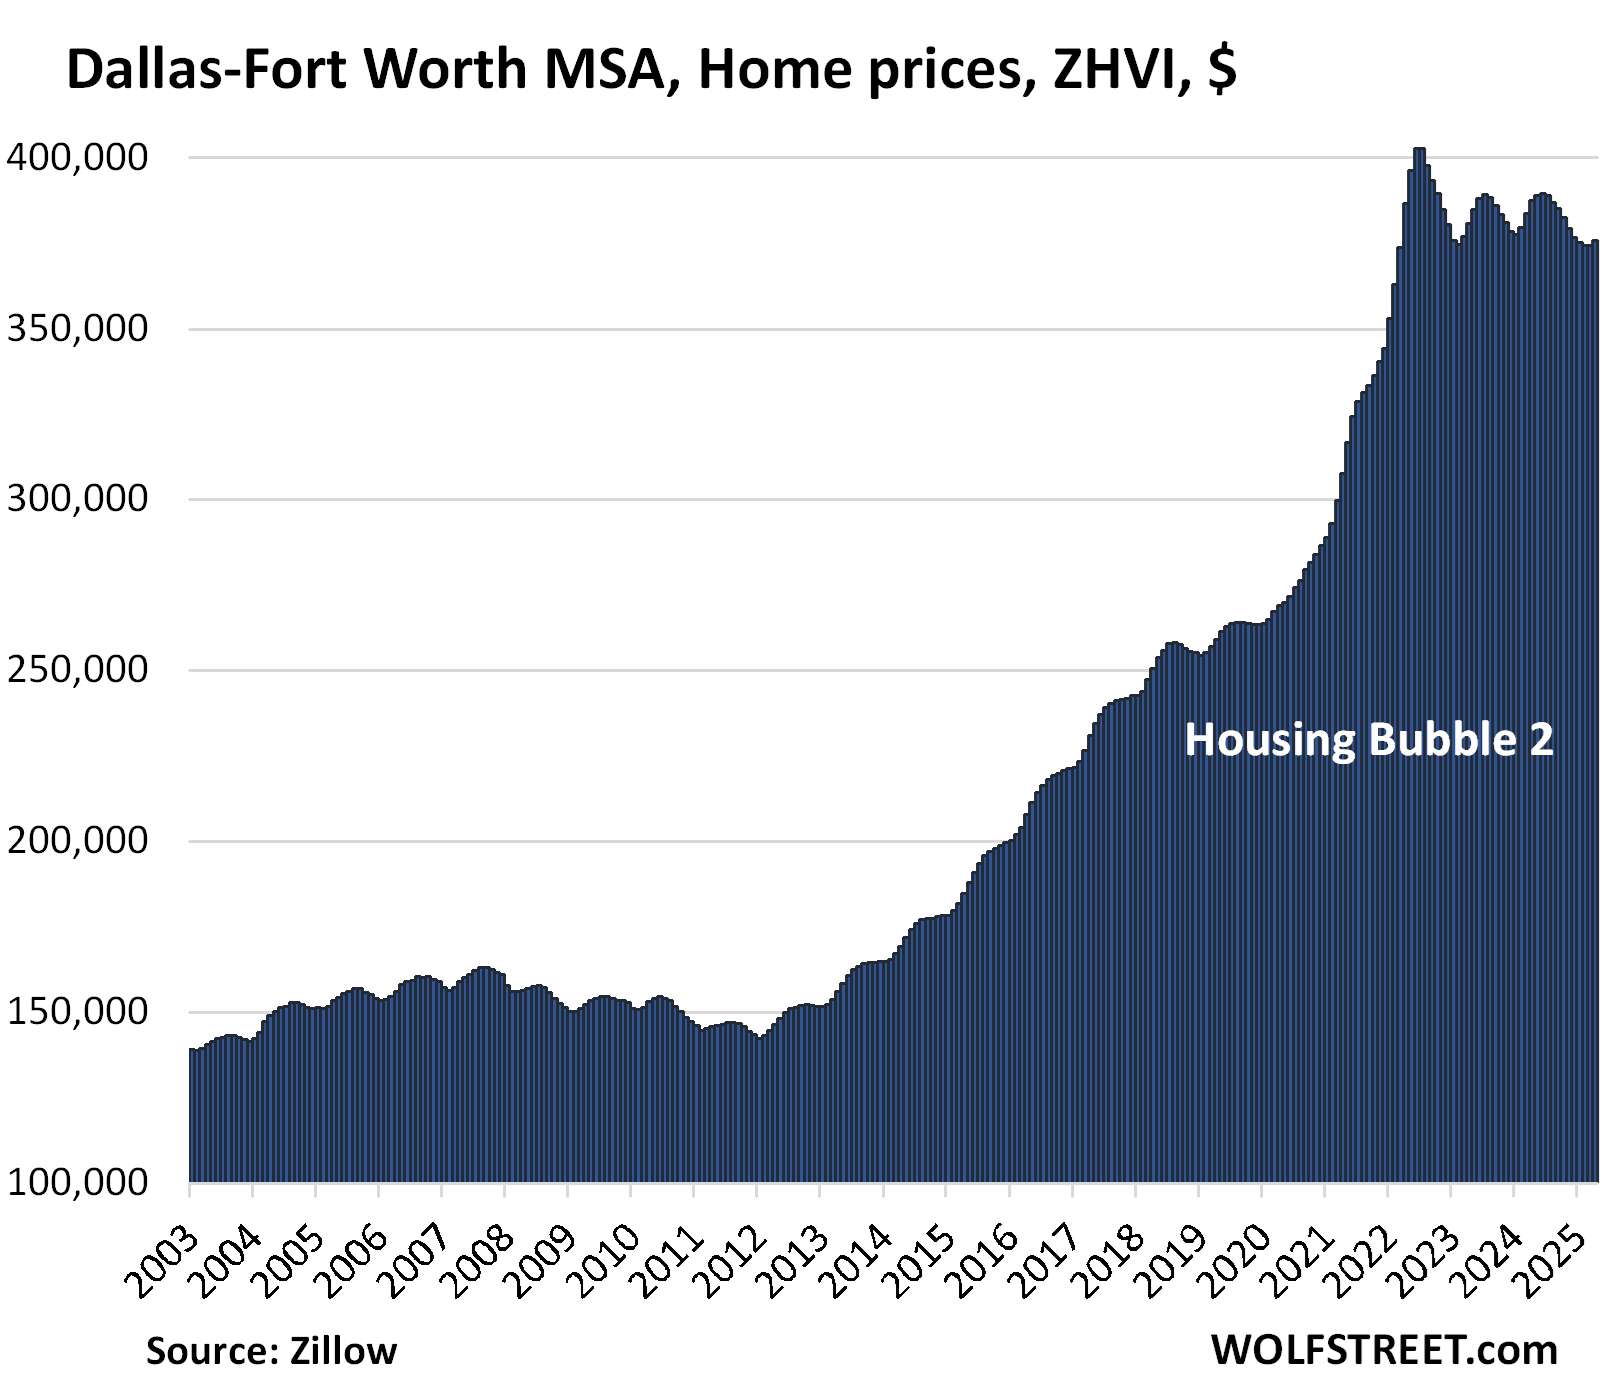
- Dallas: -3.0%
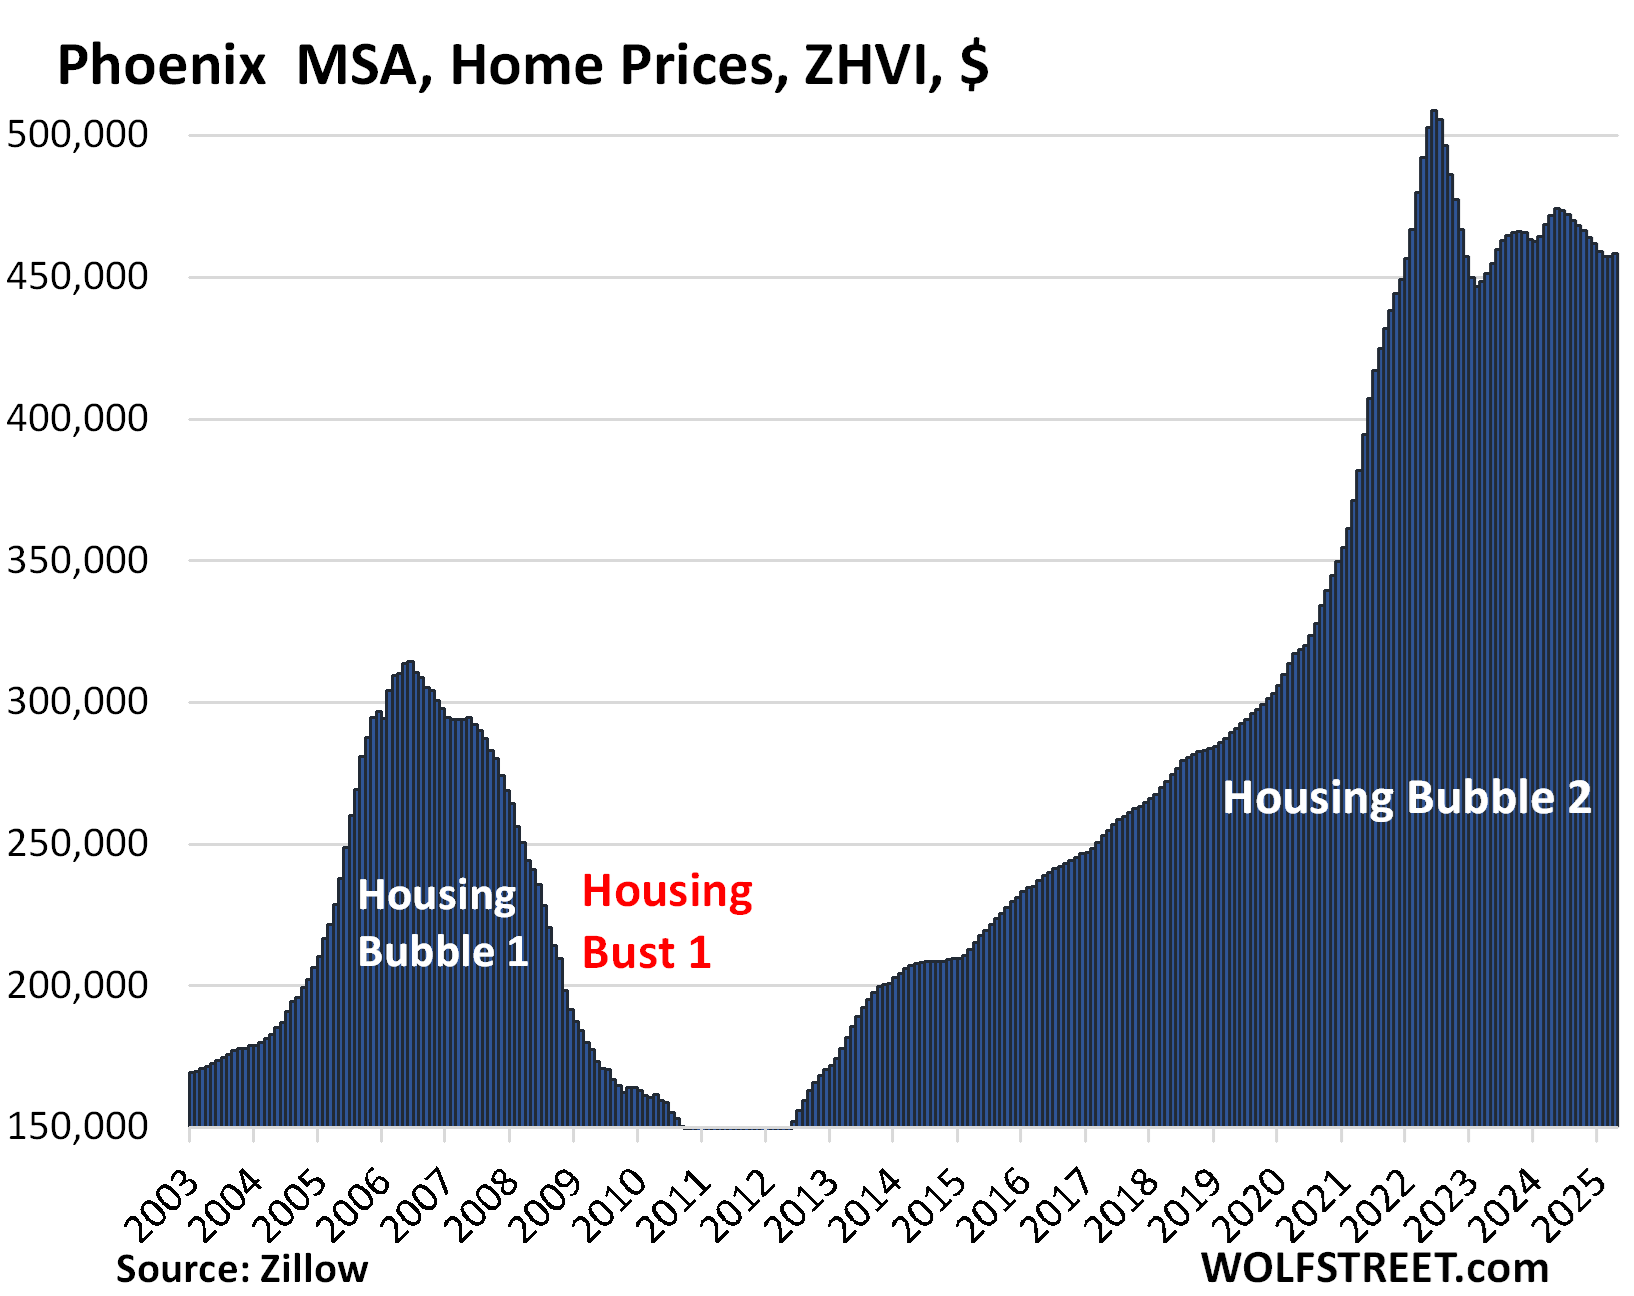
- Phoenix: -2.8%
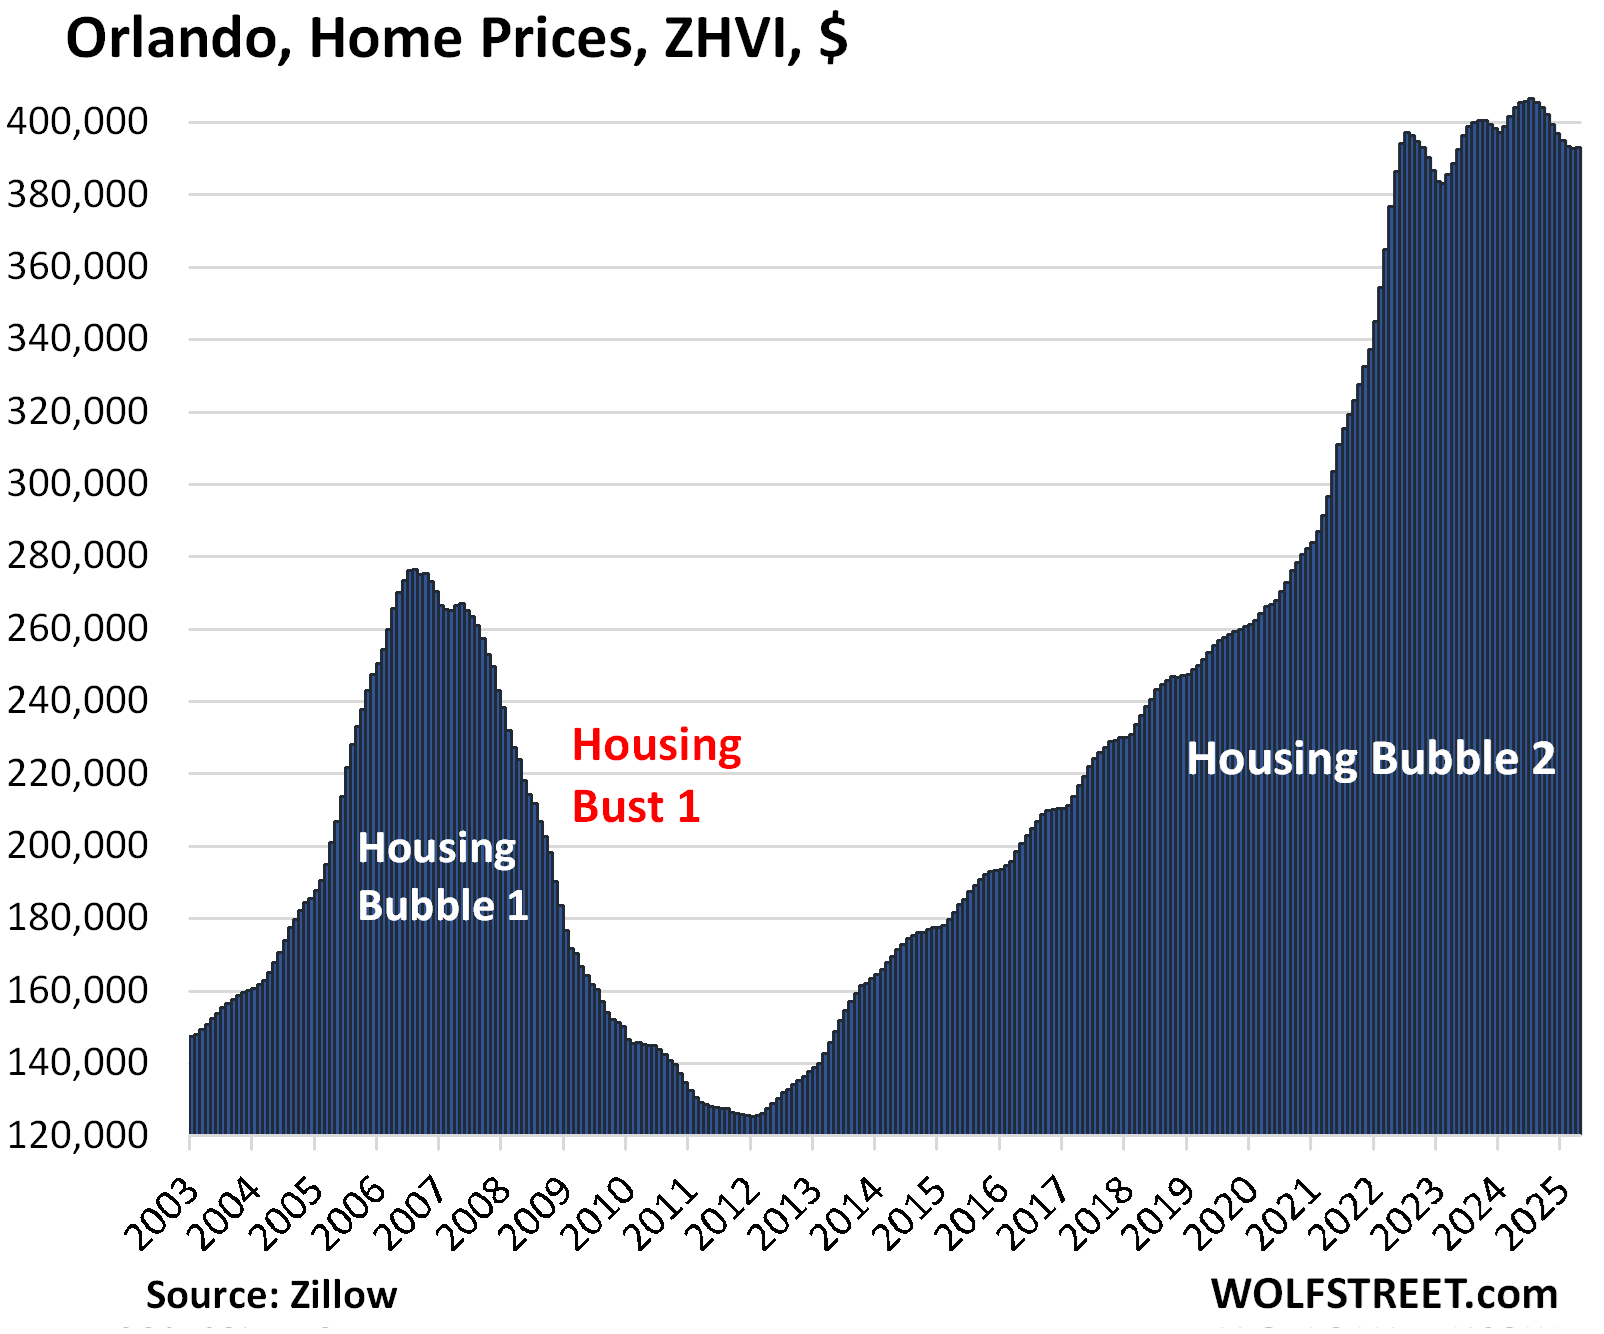
- Orlando: -2.7%
- Atlanta: -2.3%
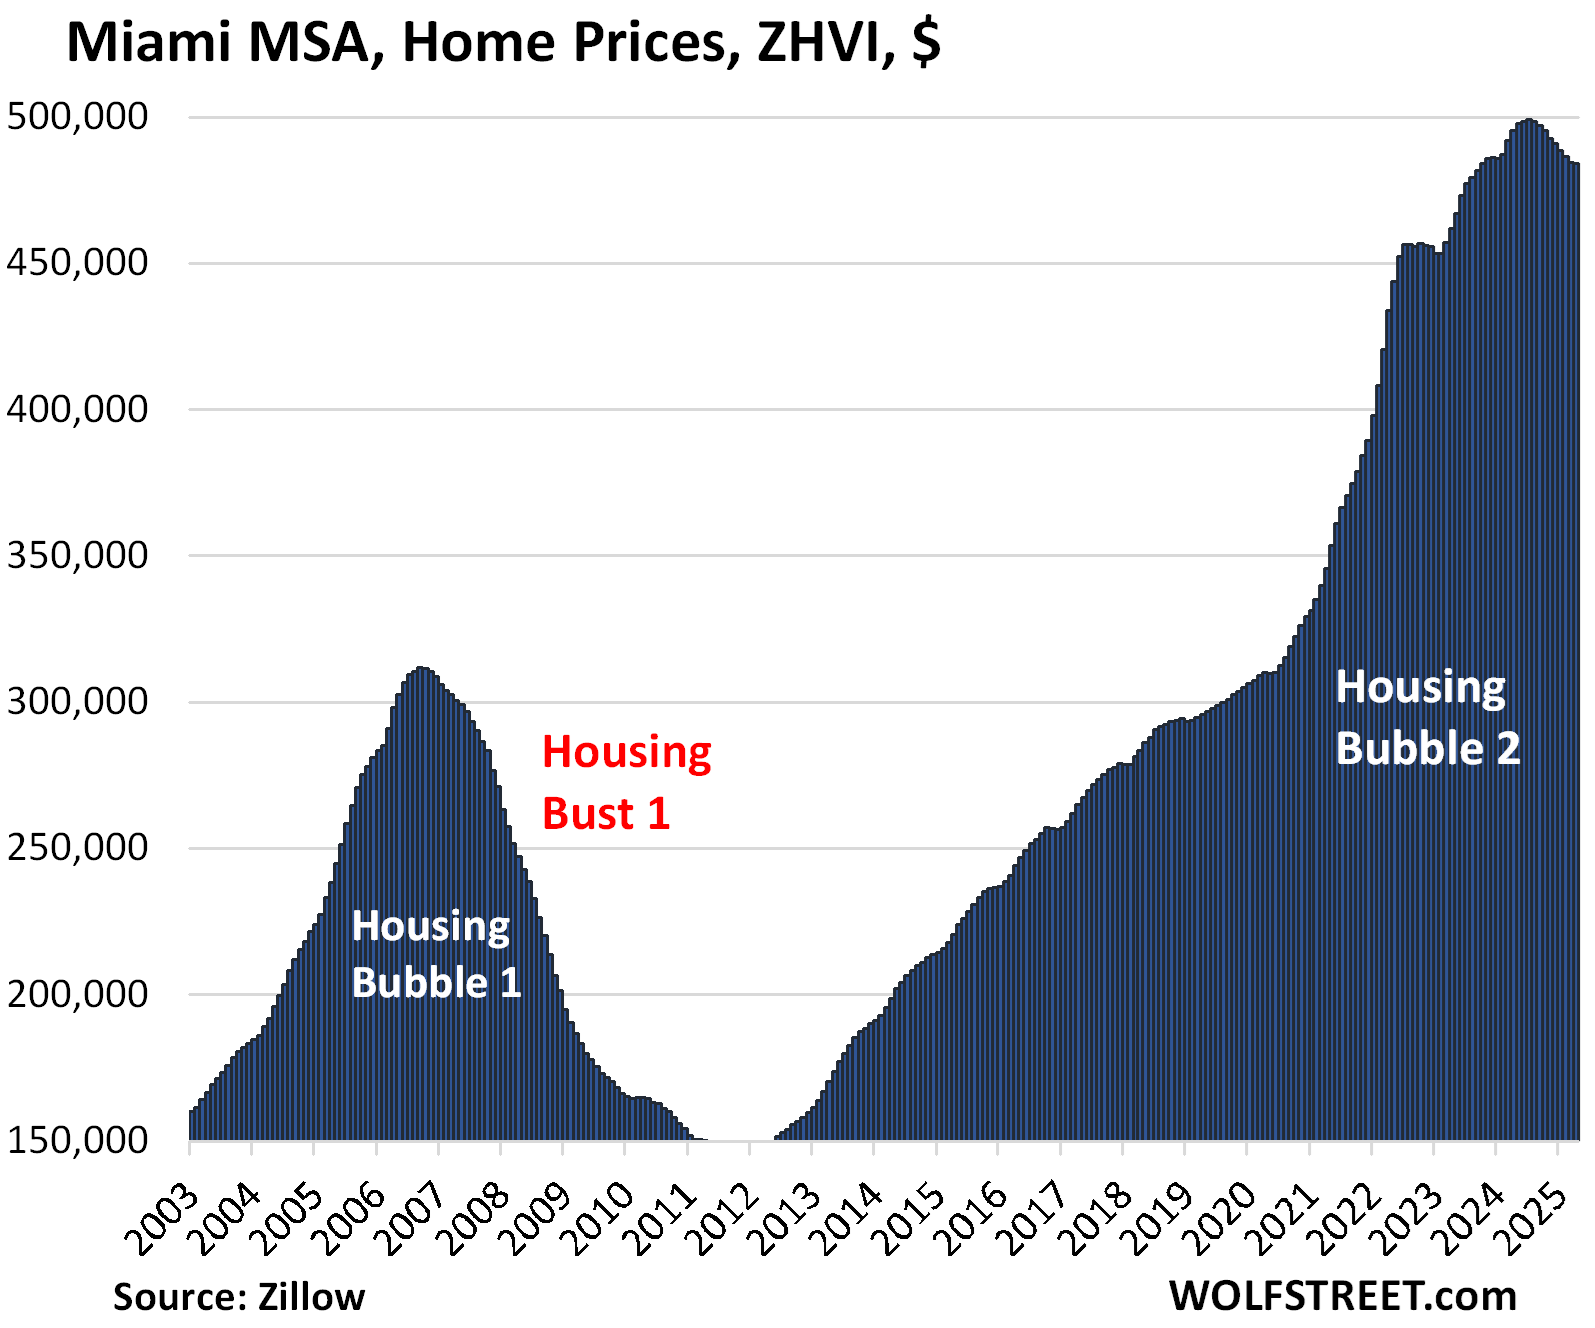
- Miami: -2.3%
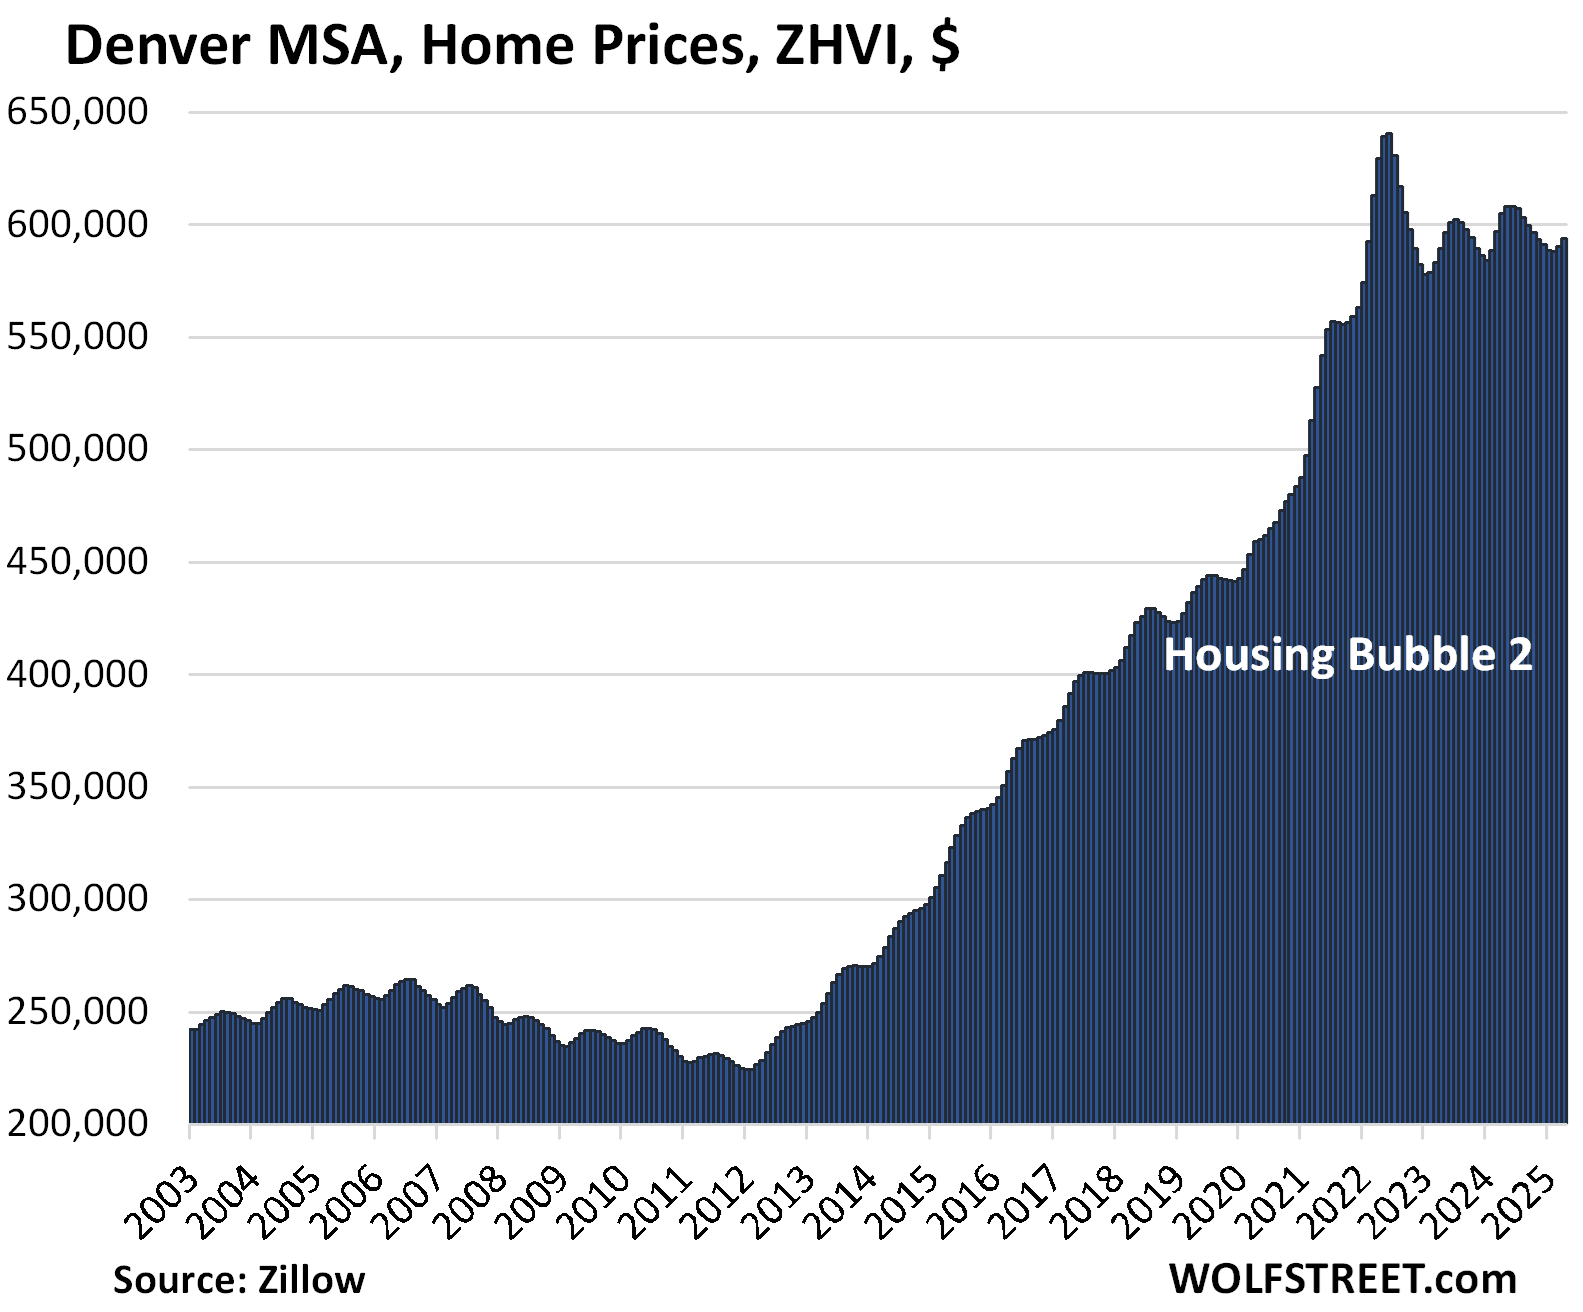
- Denver: -1.8%
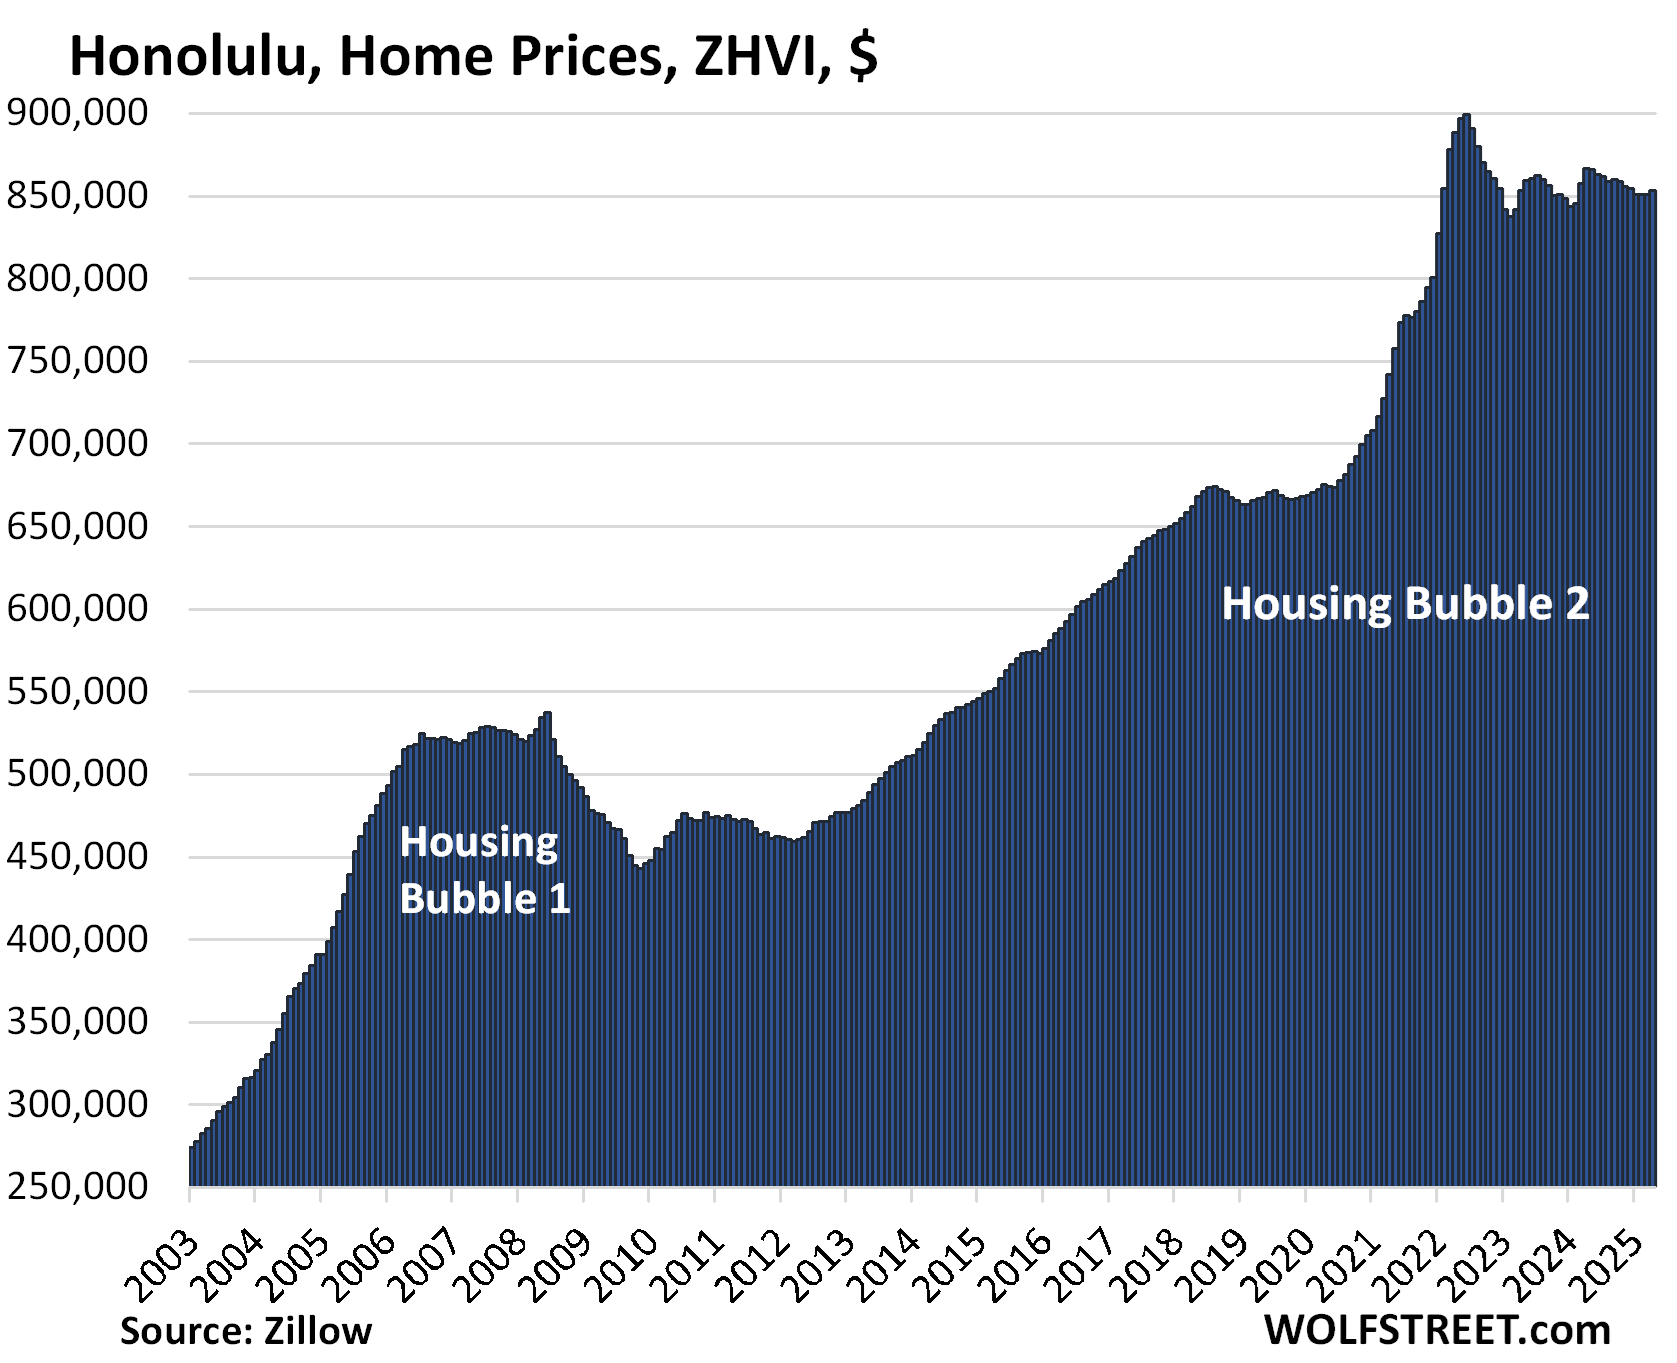
- Honolulu: -1.6%
- Raleigh: -1.4%
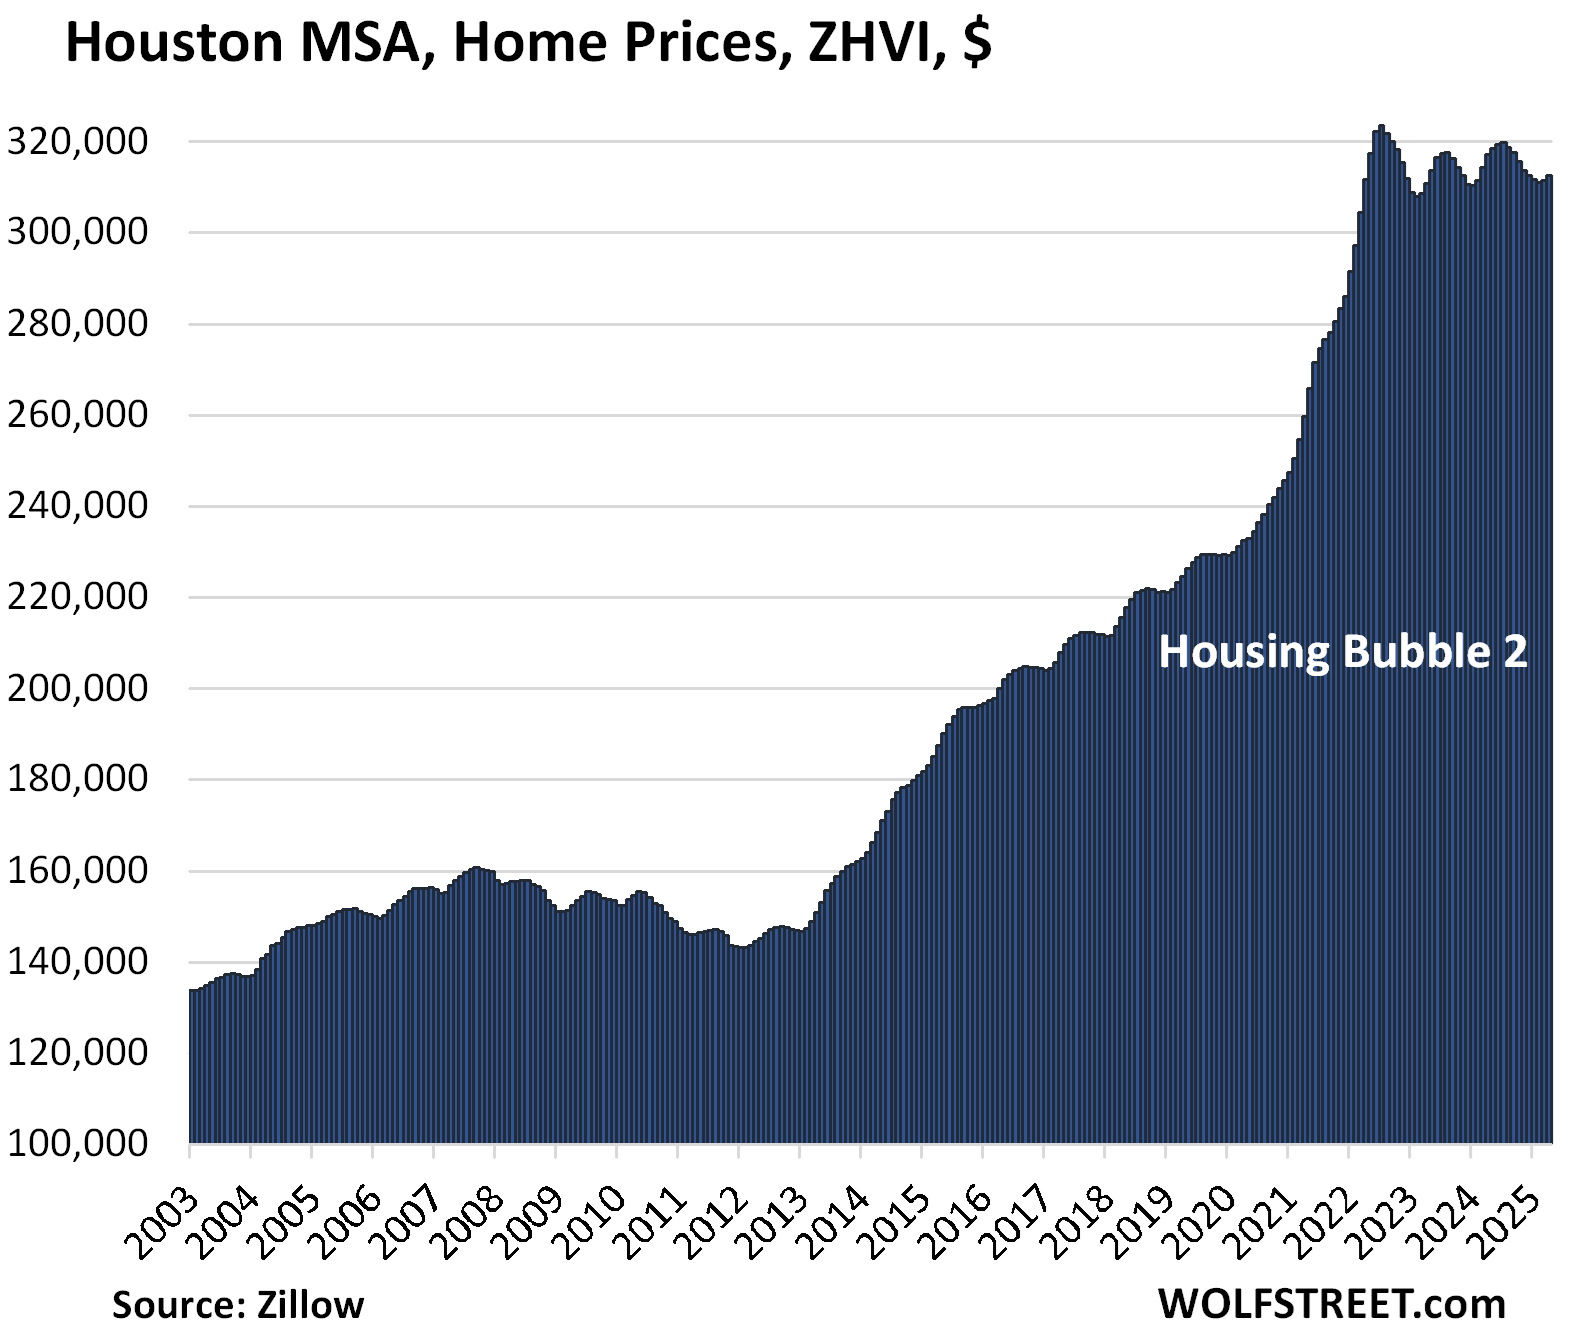
- Houston: -1.4%
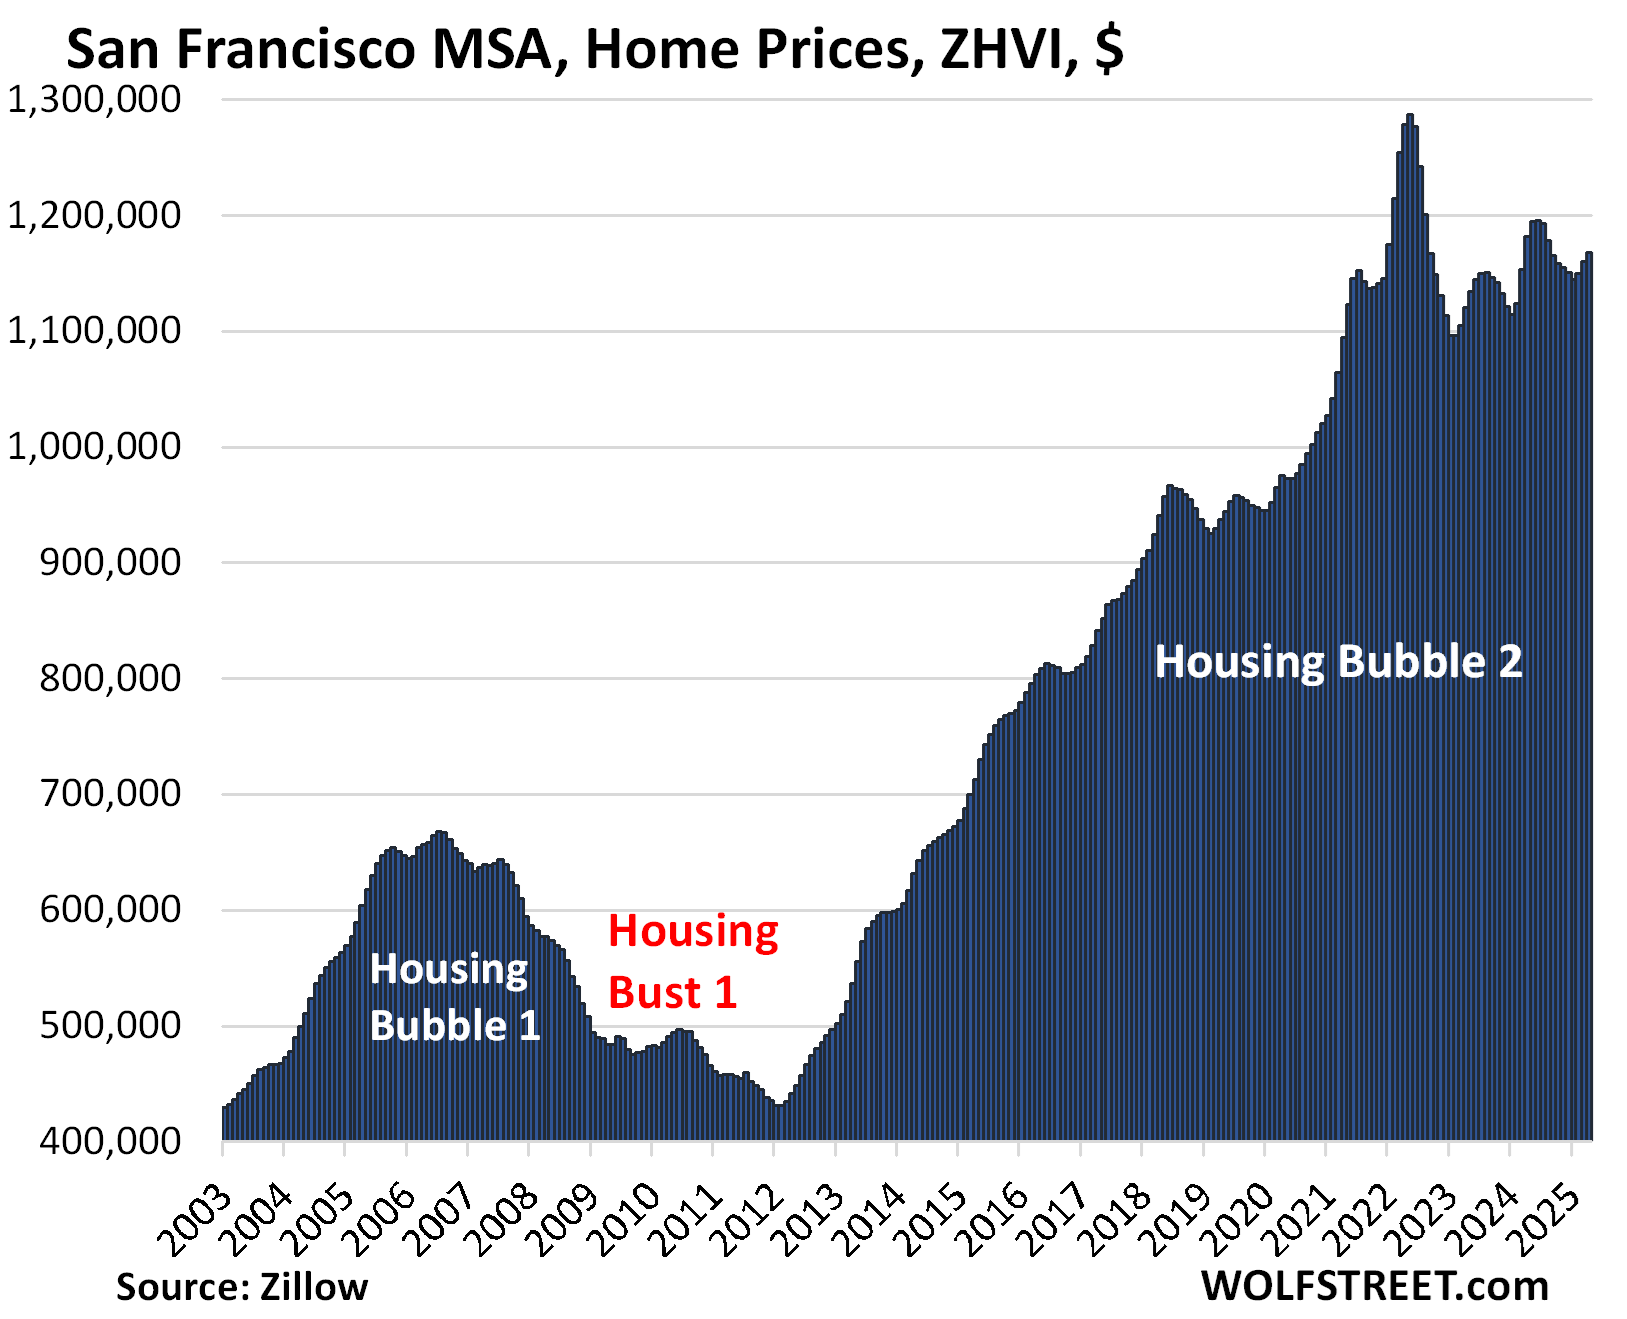
- San Francisco: -1.2%
- San Diego: -0.9%
- Charlotte: -0.6%
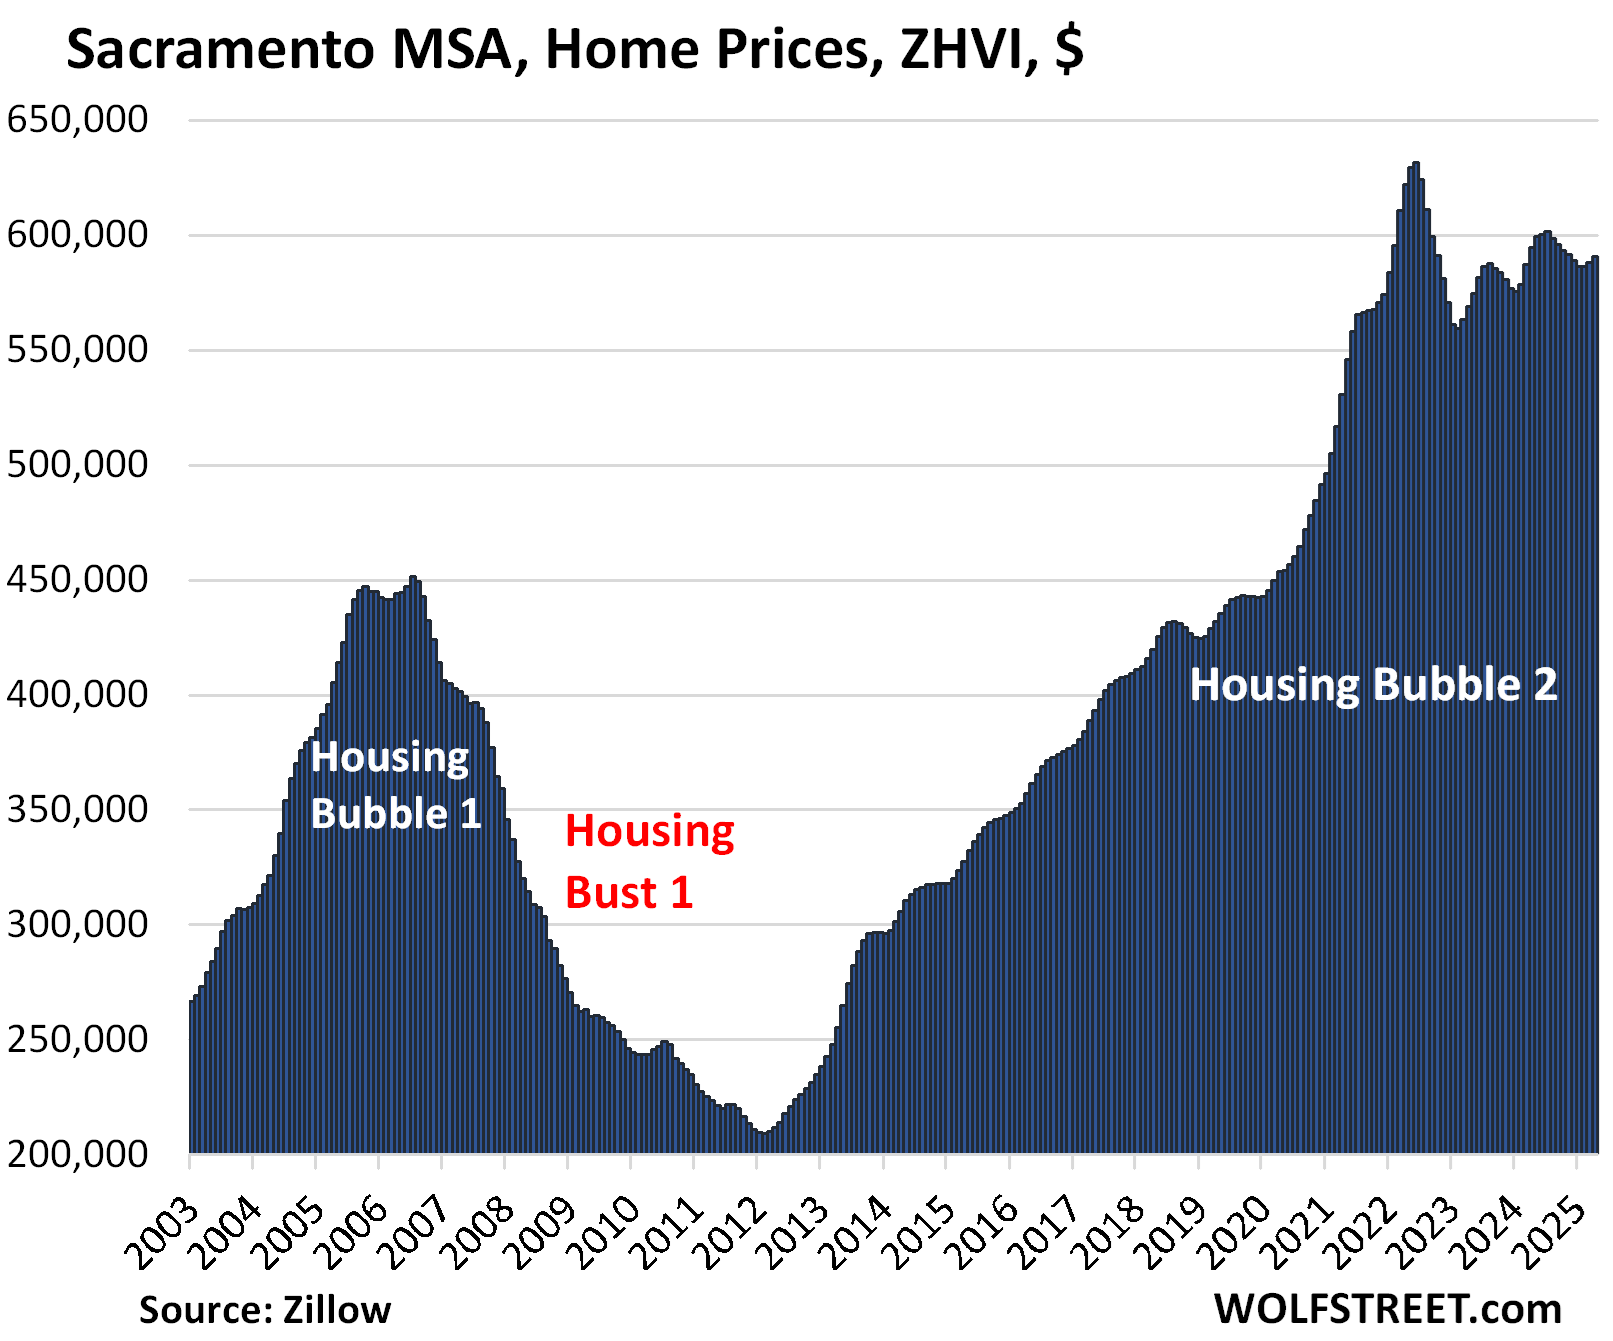
- Sacramento: -0.6%
- Birmingham: -0.3%
- Portland: -0.1%
Down from the 2022 peaks.
Prices in 19 metros of our 33 metros are down from their 2022 peaks, led by the metros of:
- Austin: -22.8%
- Phoenix: -9.9%
- San Francisco: -9.2%
- San Antonio: -9.1%
- Denver: -7.3%
- Dallas: -6.7%
- Sacramento: -6.5%
- Tampa: -6.2%
All data here is from the “raw” not seasonally adjusted mid-tier Zillow Home Value Index (ZHVI). The ZHVI is based on millions of data points in Zillow’s “Database of All Homes,” including from public records (tax data), MLS, brokerages, local Realtor Associations, real-estate agents, and households across the US. It includes pricing data for off-market deals and for-sale-by-owner deals. Zillow’s Database of All Homes also has sales-pairs data.
The 33 Most Splendid Housing Bubbles.
Here we track the prices of single-family houses, condos, and co-ops in 33 large MSAs. To qualify for this list, the MSA must be one of the largest by population and must have had a ZHVI of at least $300,000 somewhere along the line.
The metros of New Orleans, Oklahoma City, Tulsa, Cincinnati, Pittsburgh, etc. while large enough, don’t qualify in terms of their ZHVI, which has never reached $300,000, despite the massive surge of home prices in recent years, but from low levels.
Note that supply of existing homes for sale in the US jumped to the highest since 2016, with active listings exploding in Florida’s major markets. In California’s major markets, active listings have also ballooned – by 70% YoY in San Diego, for example; the San Francisco Bay Area reached the highest level in many years.
The 19 metros that are down from their all-time highs in 2022.
| Austin MSA, Home Prices | |||
| From Jun 2022 peak | MoM | YoY | Since 2000 |
| -22.8% | 0.5% | -5.1% | 155% |
The YoY decline has worsened for months. Prices are back where they’d been in April 2021.
The Austin MSA includes the counties of Travis (Austin-Round Rock), Williamson, Hays, Caldwell, and Bastrop.
Markets in Texas didn’t have much of a Housing Bubble 1 in 2002-2006, and then didn’t have much of a Housing Bust 1 either after 2006. They’d been through a huge bubble and bust in the 1980s, and it seems lessons were learned – and by 2015, forgotten.
| Phoenix MSA, Home Prices | |||
| From Jun 2022 peak | MoM | YoY | Since 2000 |
| -9.9% | 0.3% | -2.8% | 217% |
The year-over-year decline worsened from -2.5% in March and -1.6% in February. Prices are back where they’d first been in January 2022:
| San Francisco MSA, Home Prices | |||
| From May 2022 peak | MoM | YoY | Since 2000 |
| -9.2% | 0.7% | -1.2% | 296% |
The year-over-year price change flipped to negative, from +0.5% in March and +2.4% in February.
The MSA includes San Francisco, Oakland, much of the East Bay, much of the North Bay, and goes south on the Peninsula into Silicon Valley through San Mateo County.
| San Antonio MSA, Home Prices | |||
| From Jul 2022 peak | MoM | YoY | Since 2000 |
| -9.1% | 0.4% | -3.2% | 146.3% |
The YoY decline worsened from -2.7% in March and -2.0% in February. Prices are back where they’d been in January 2022.
| Denver MSA, Home Prices | |||
| From Jun 2022 peak | MoM | YoY | Since 2000 |
| -7.3% | 0.6% | -1.8% | 212% |
The YoY decline worsened from -1.1% in March and 0% in February. Prices are back where they’d first been in early 2022.

| Dallas-Fort Worth MSA, Home Prices | |||
| From Jun 2022 peak | MoM | YoY | Since 2000 |
| -6.7% | 0.3% | -3.0% | 191% |
The YoY drop worsened from -2.4% in March and -1.4% in February.
| Sacramento MSA, Home Prices | |||
| From July 2022 peak | MoM | YoY | Since 2000 |
| -6.5% | 0.5% | -0.6% | 245.7% |
The year-over-year price change flipped to negative in April, from +0.1% in March, and +1.3% in February.
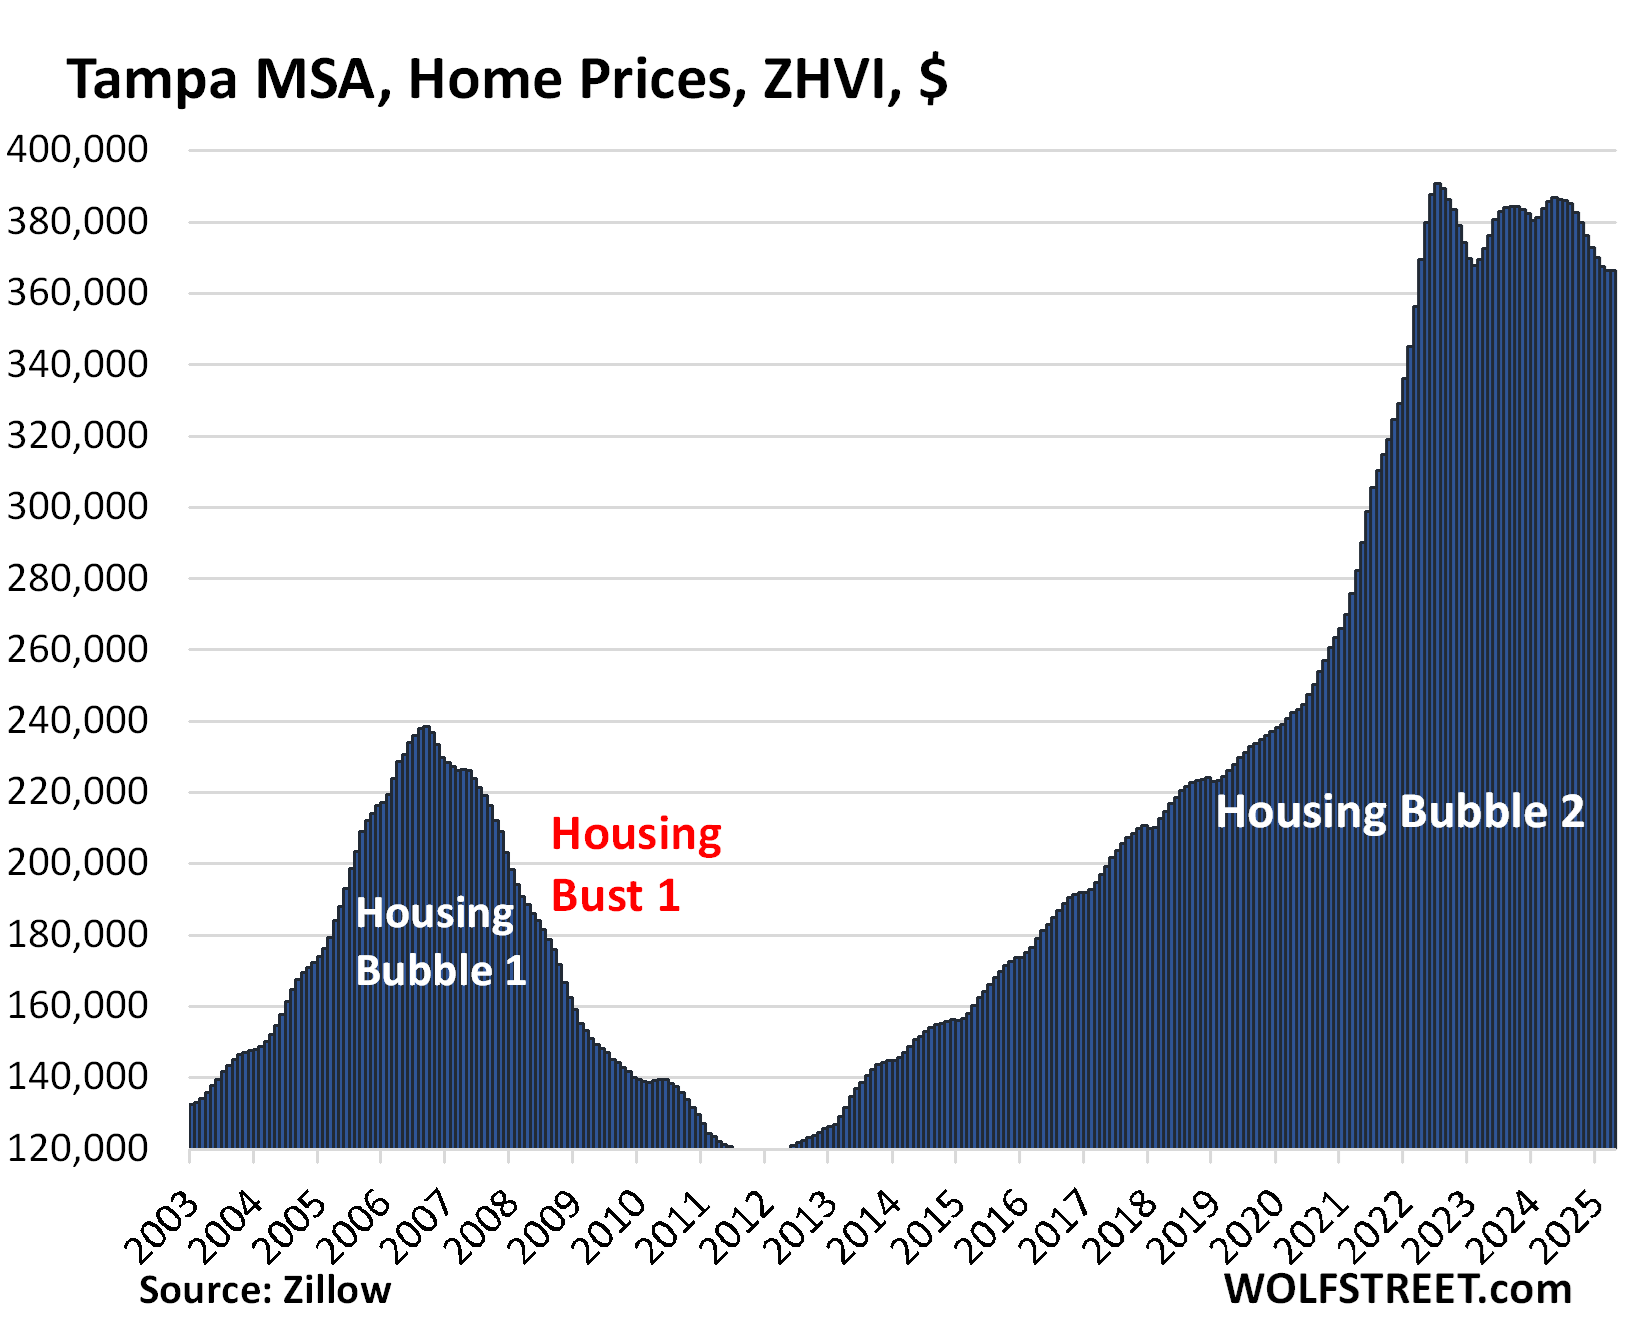
| Tampa MSA, Home Prices | |||
| From Jul 2022 peak | MoM | YoY | Since 2000 |
| -6.2% | 0.0% | -5.0% | 261% |
The YoY drop continues to worsen.
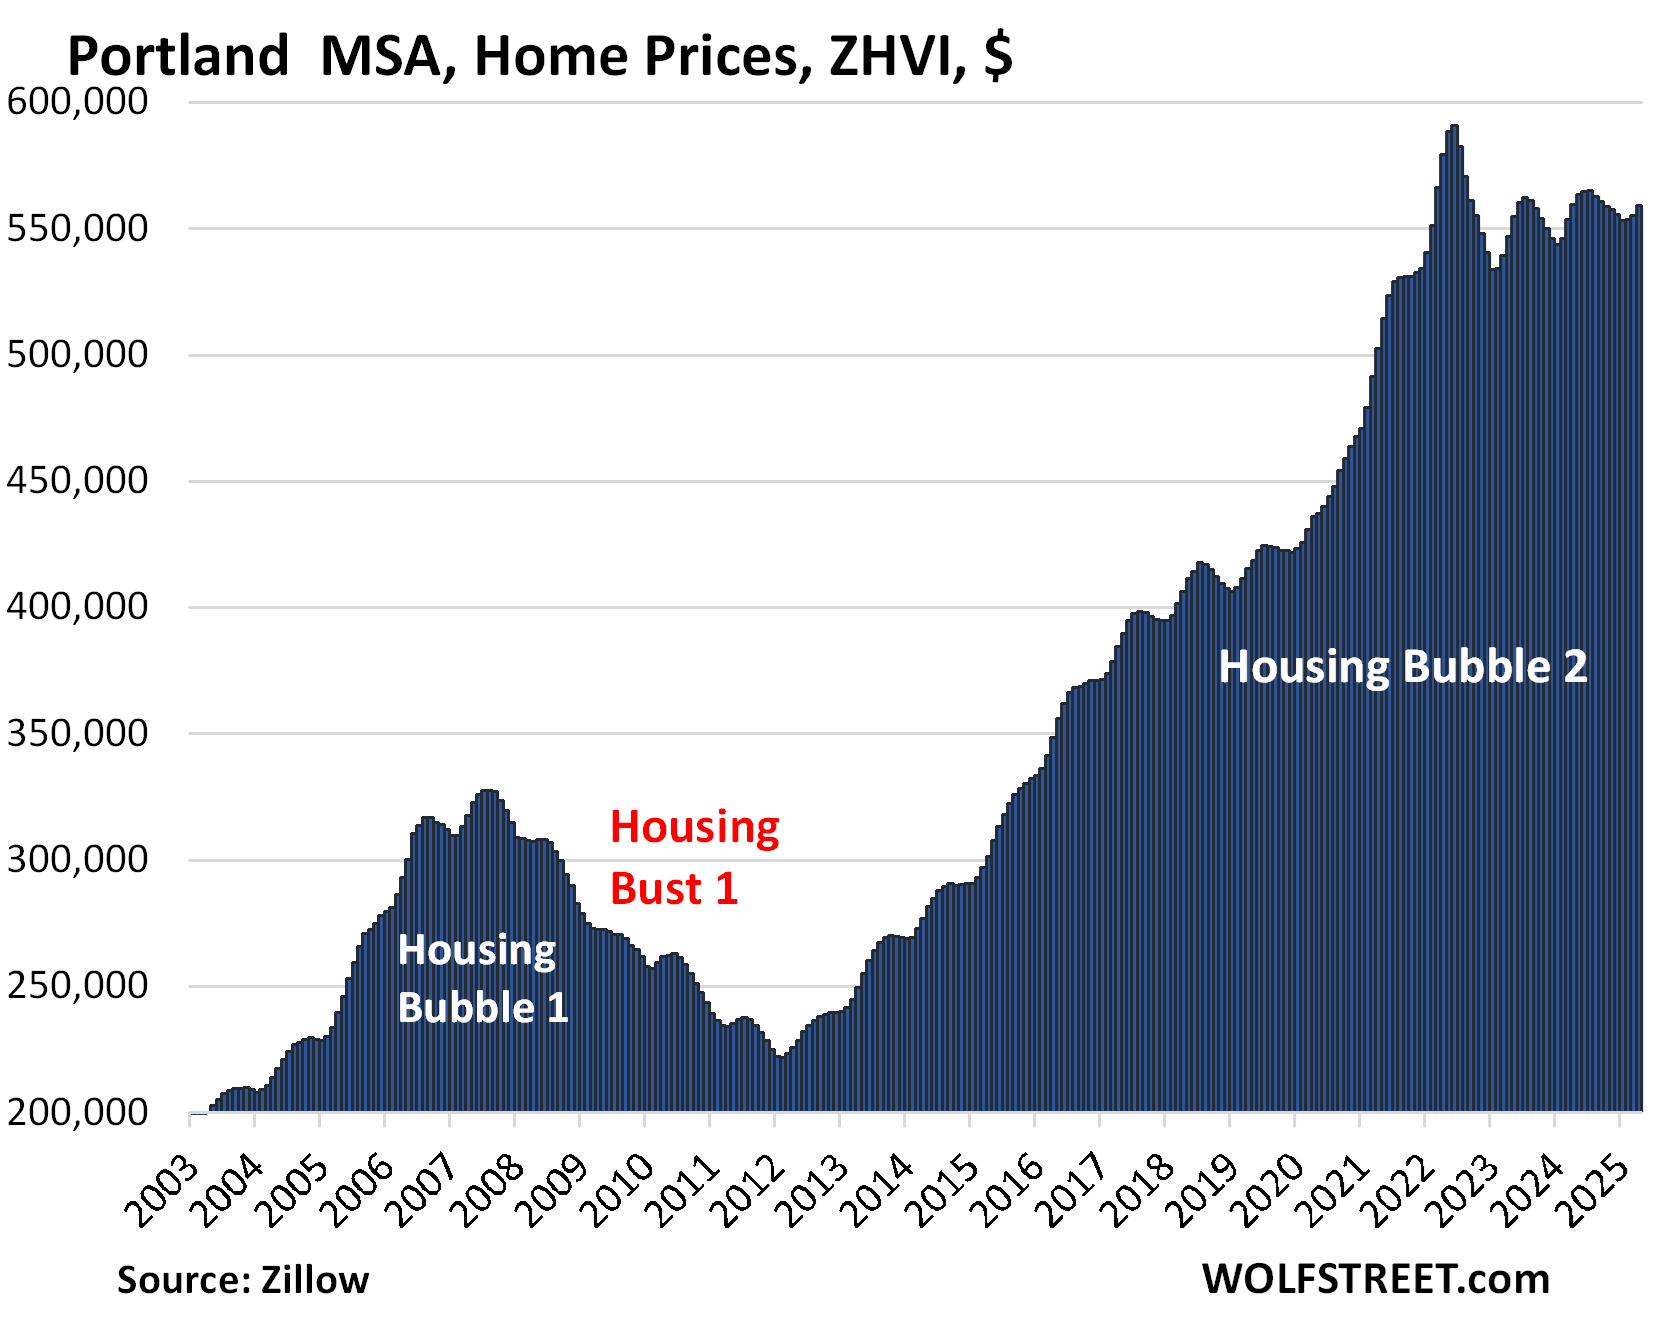
| Portland MSA, Home Prices | |||
| From May 2022 peak | MoM | YoY | Since 2000 |
| -5.4% | 0.7% | -0.1% | 219% |
The year-over-year price change flipped to negative in April, from +0.35 in March and +1.3% in February. Prices are back where they’d first been in early 2022
| Honolulu, Home Prices | |||
| From Jun 2022 peak | MoM | YoY | Since 2000 |
| -5.1% | 0.2% | -1.6% | 279% |
The YoY decline worsened from -0.8% in March, when it had flipped to negative from +0.6% in February.
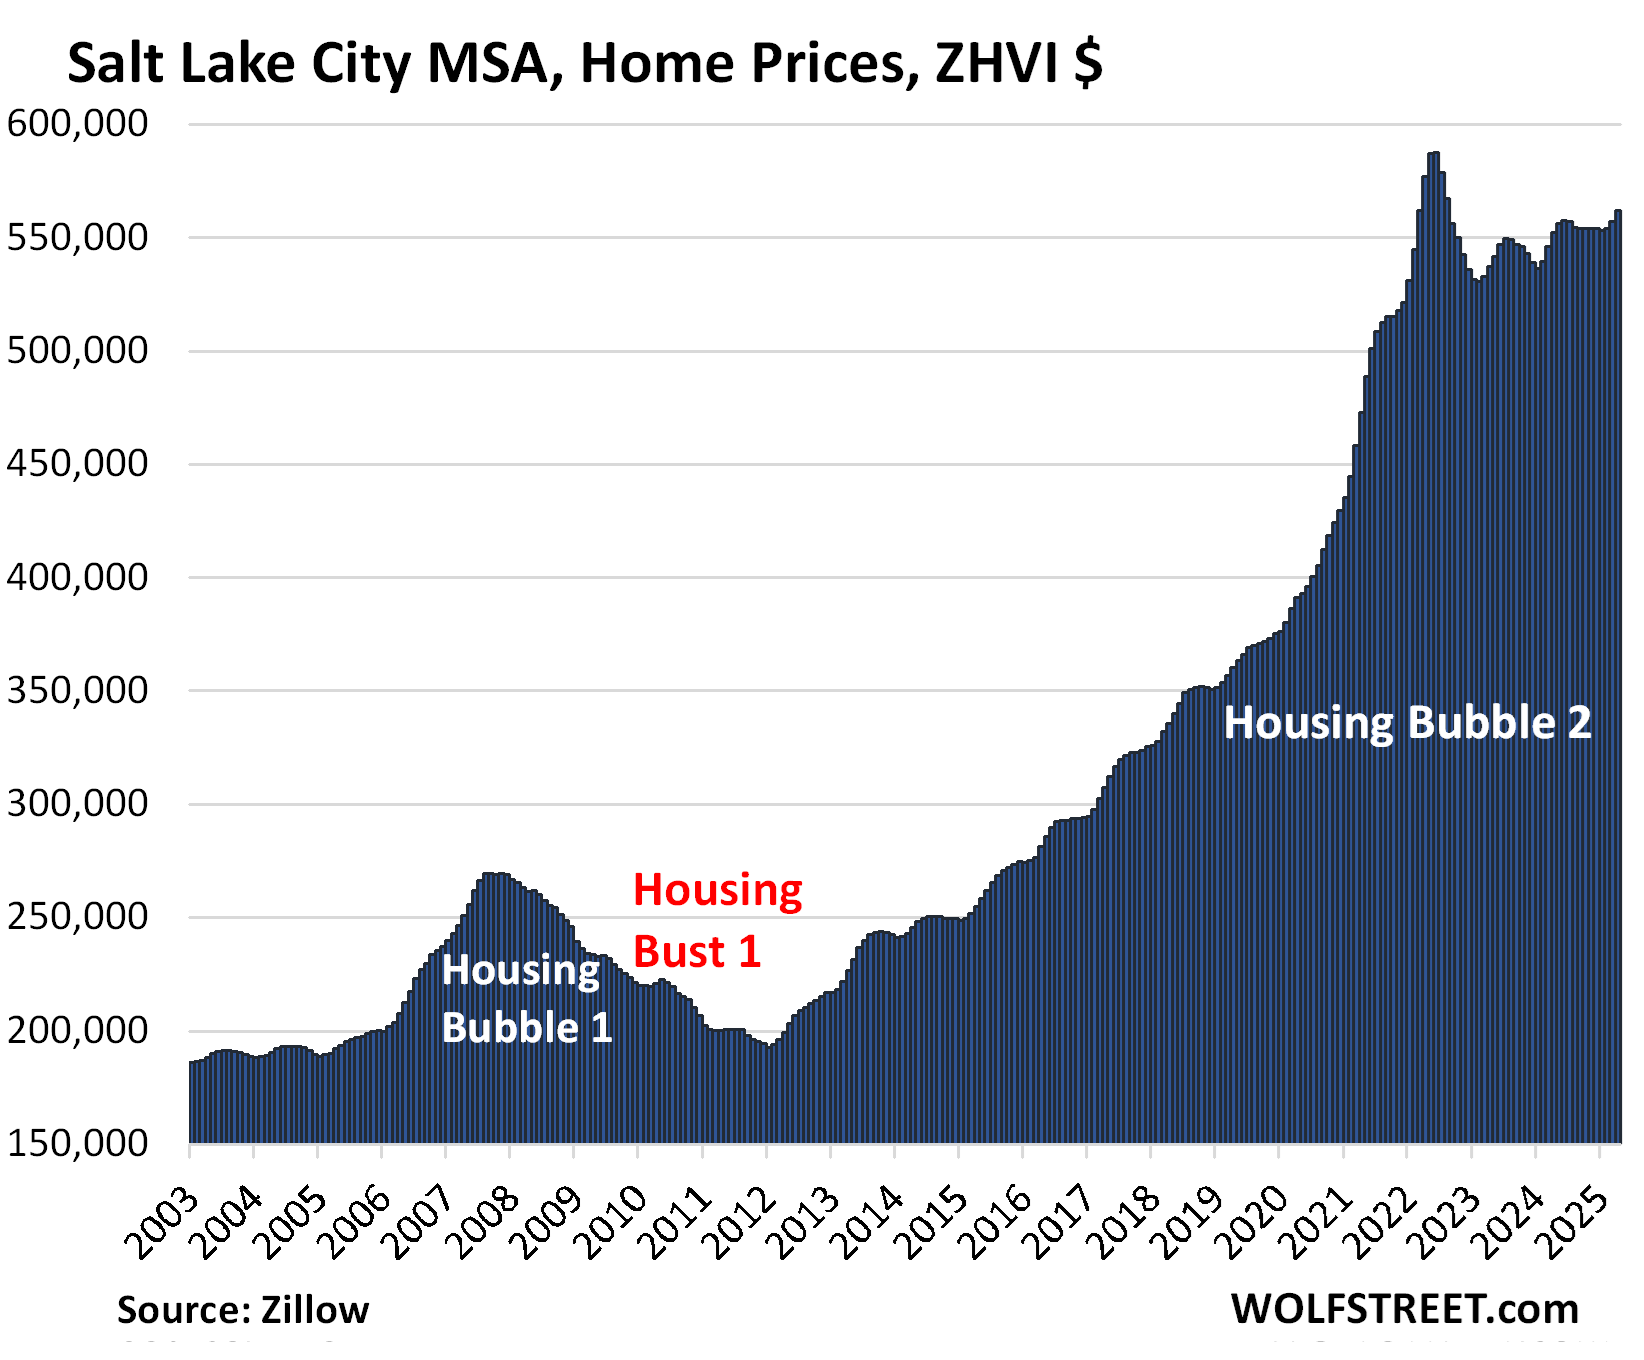
| Salt Lake City MSA, Home Prices | |||
| From July 2022 peak | MoM | YoY | Since 2000 |
| -4.4% | 0.9% | 1.7% | 218% |
The year-over-year gain declined from +2.0% in March.
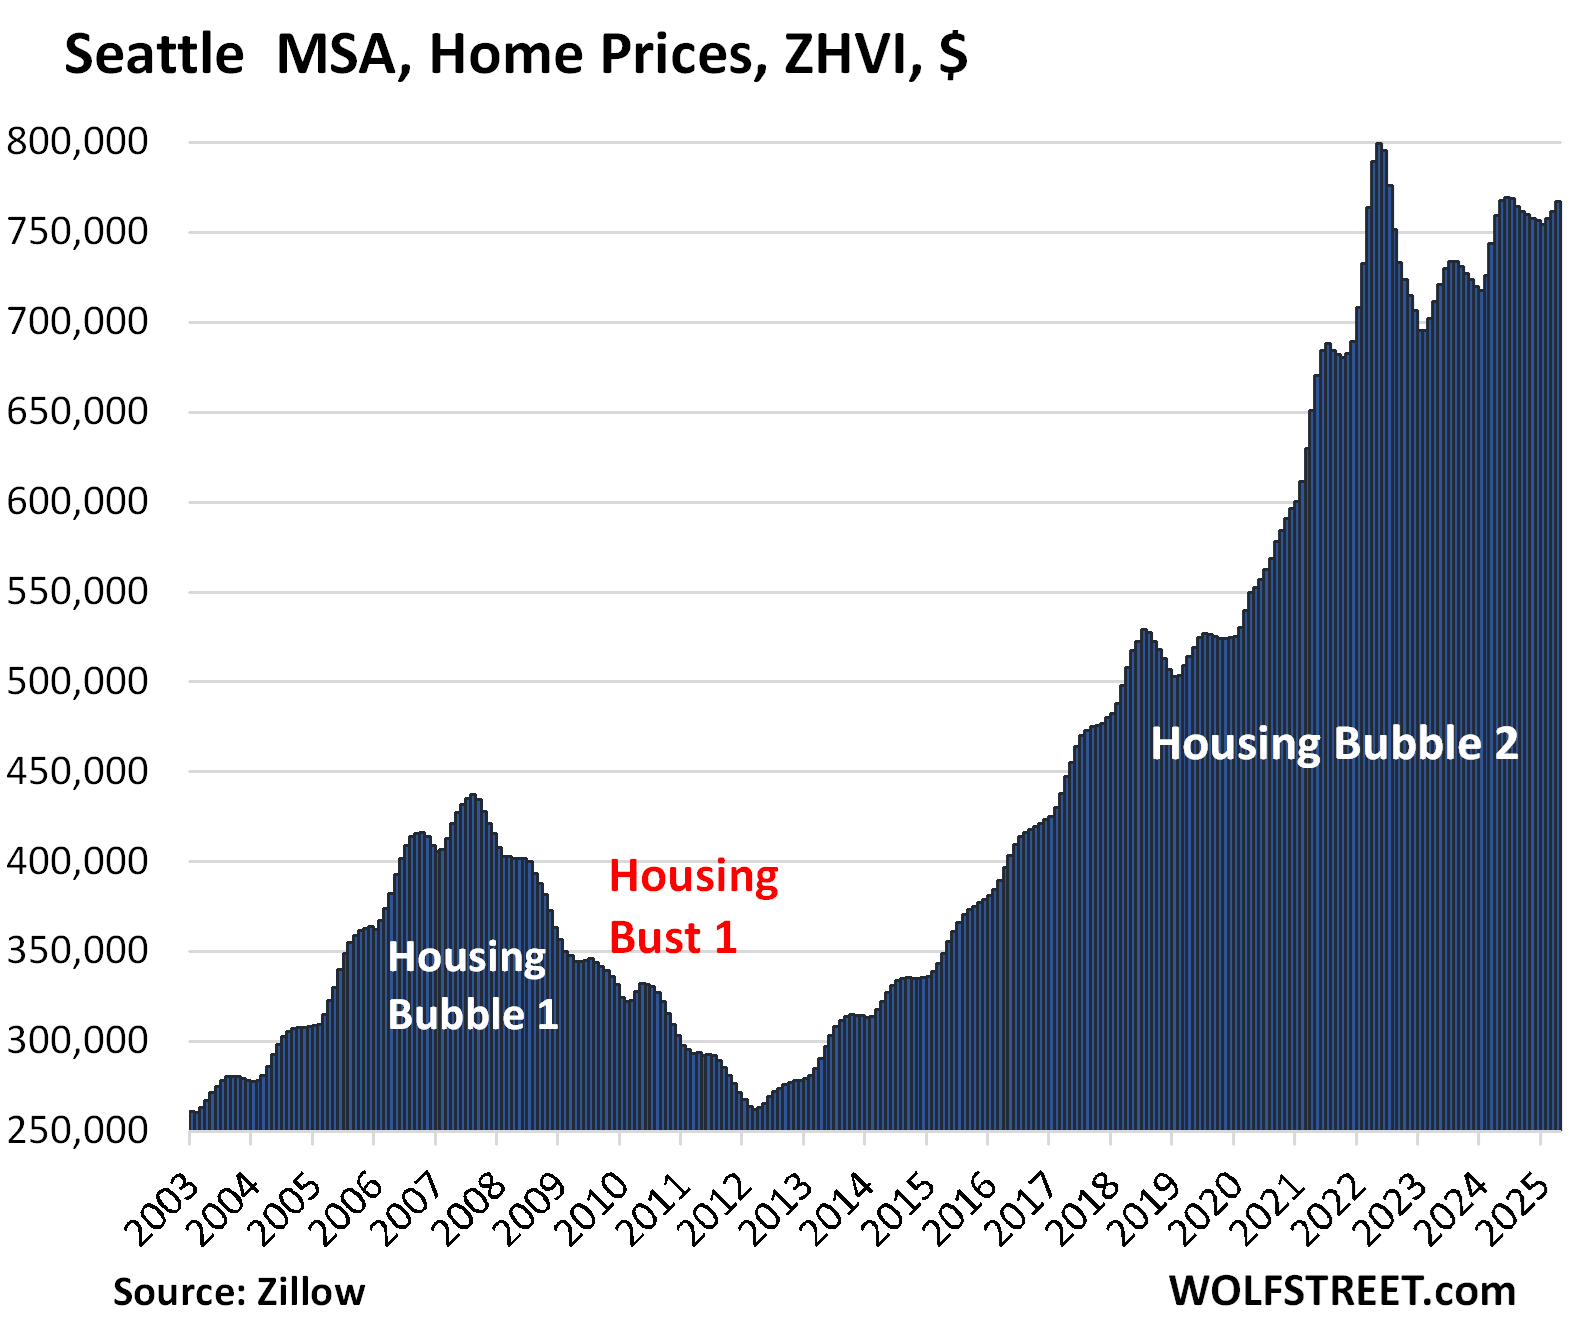
| Seattle MSA, Home Prices | |||
| From May 2022 peak | MoM | YoY | Since 2000 |
| -4.0% | 0.7% | 1.1% | 242% |
The YoY gain declined from +2.4% in March and +4.3% in February.
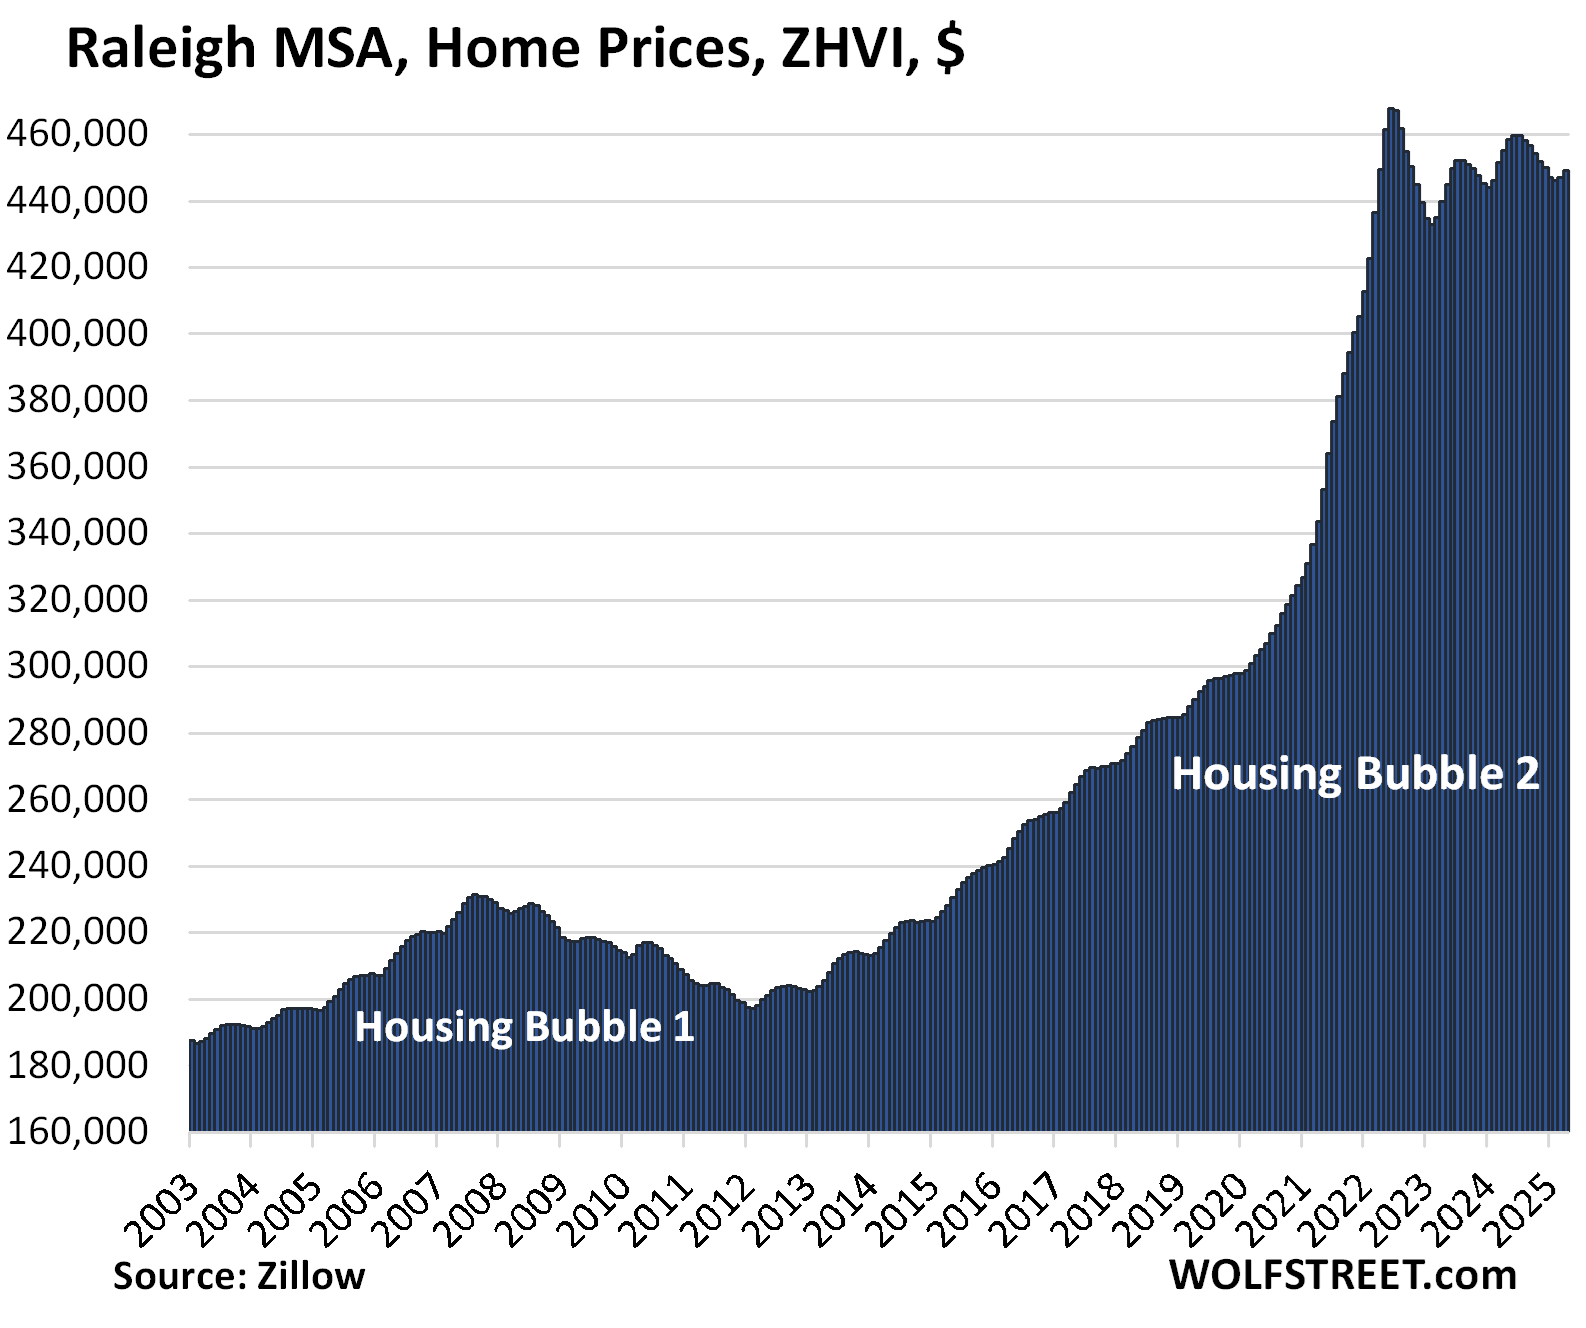
| Raleigh MSA, Home Prices | |||
| From July 2022 peak | MoM | YoY | Since 2000 |
| -4.0% | 0.5% | -1.4% | 157% |
The YOY decline worsened from 1.0% in March.
| Houston MSA, Home Prices | |||
| From Jul 2022 peak | MoM | YoY | Since 2000 |
| -3.4% | 0.4% | -1.4% | 150% |
The YoY decline worsened from -0.9% in March and -0.2% in February. The index is where it had first been in April 2022.
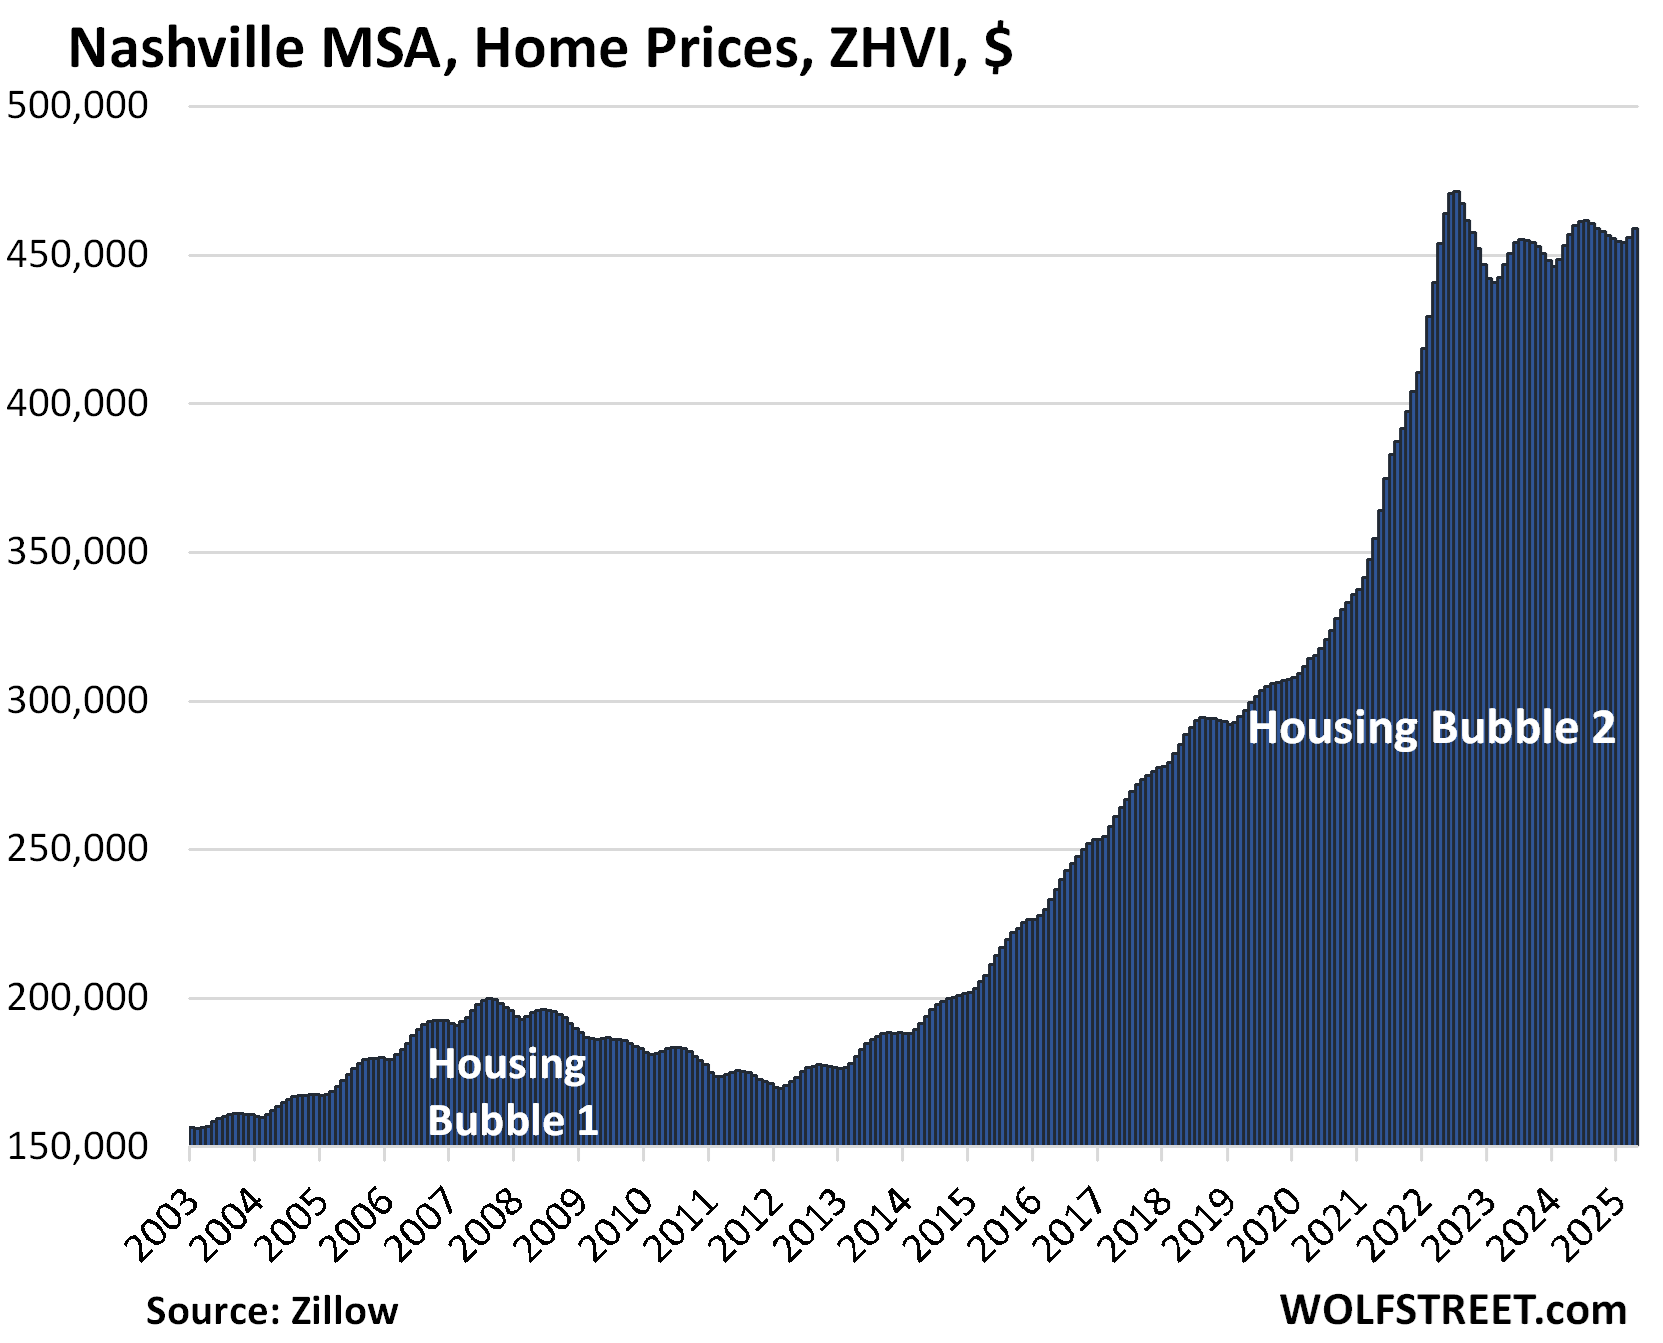
| Nashville MSA, Home Prices | |||
| From July 2022 peak | MoM | YoY | Since 2000 |
| -2.7% | 0.7% | 0.4% | 219% |
The YoY gains has continued to shrink. The index is where it had been in April 2022.
| Las Vegas MSA, Home Prices | |||
| From June 2022 peak | MoM | YoY | Since 2000 |
| -2.1% | 0.4% | 2.5% | 180% |
The YoY gain shrank from +3.3% in March and +4.25% in February.

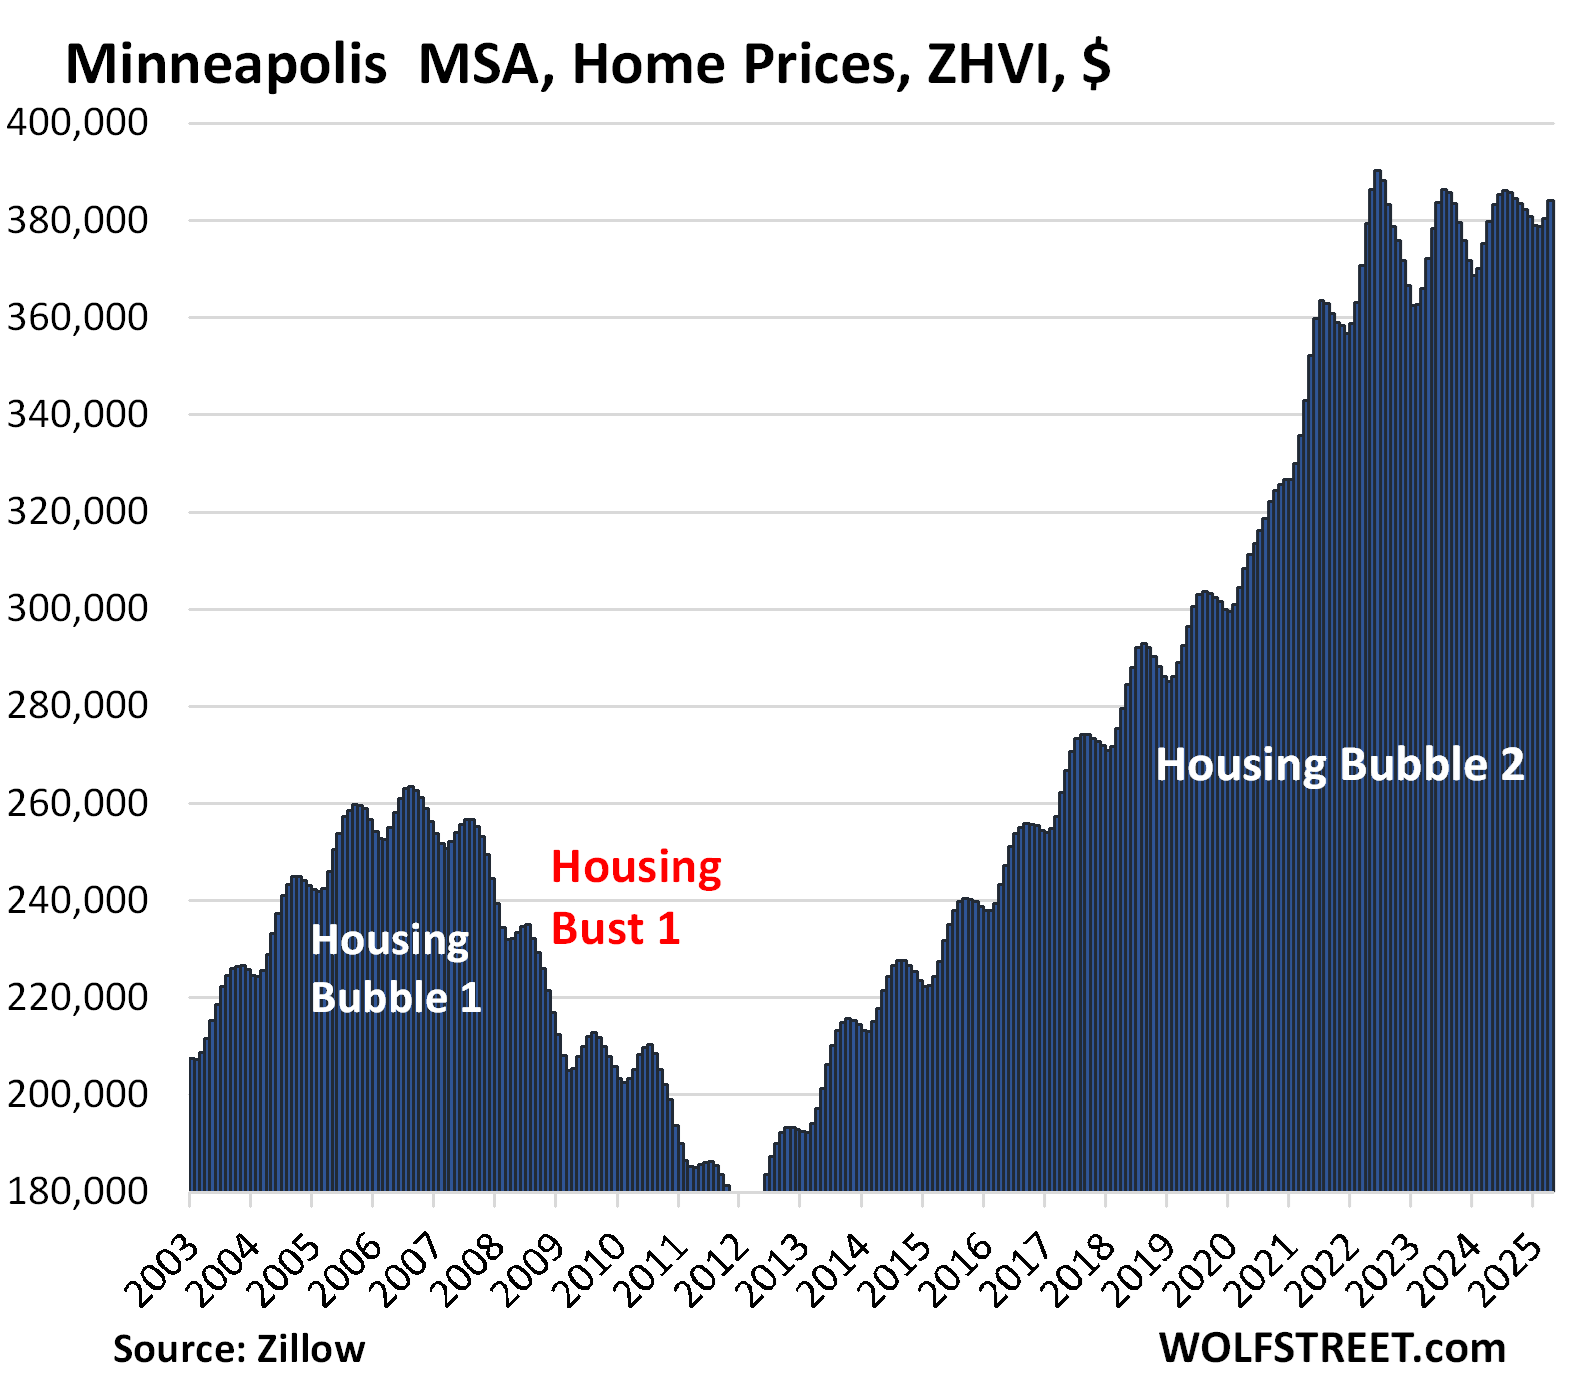
| Minneapolis MSA, Home Prices | |||
| From May 2022 peak | MoM | YoY | Since 2000 |
| -1.5% | 1.0% | 1.2% | 159% |
The YoY gain continues to shrink.
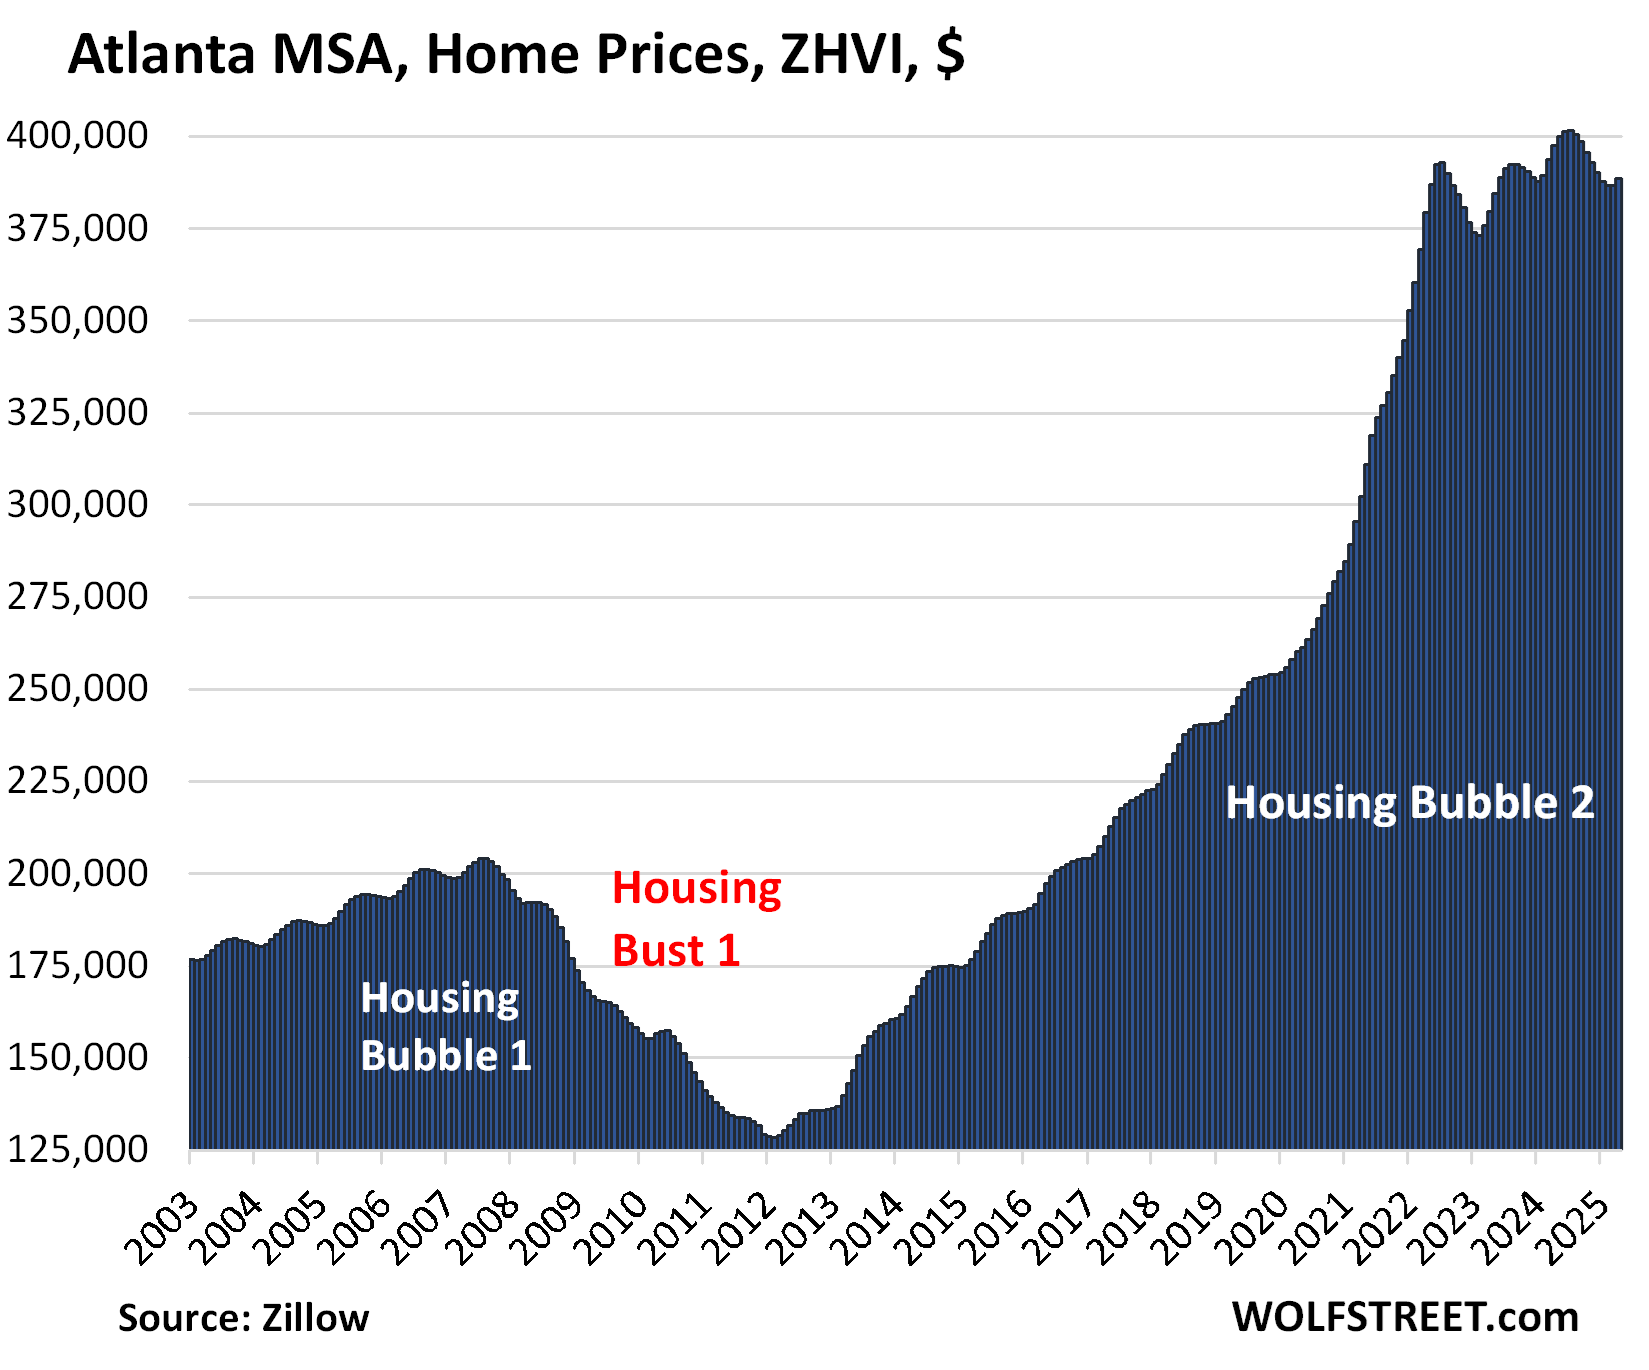
| Atlanta MSA, Home Prices | |||
| From July 2022 | MoM | YoY | Since 2000 |
| -1.1% | 0.4% | -2.3% | 159% |
The YoY decline worsened from -1.8% in March and -0.7% in February.
| Orlando MSA, Home Prices | |||
| From June 2022 | MoM | YoY | Since 2000 |
| -1.0% | 0.1% | -2.7% | 231% |
YoY decline worsened from -2.2% in March and -1.4% in February.
The 14 metros that are higher than in mid-2022:
| Miami MSA, Home Prices | ||
| MoM | YoY | Since 2000 |
| -0.1% | -2.3% | 324% |
The YoY decline worsened from -1.5% in March and -0.2% in February. Since the high in July 2024, the index has dropped by 3.0%.
| San Diego MSA, Home Prices | ||
| MoM | YoY | Since 2000 |
| 0.3% | -0.9% | 335% |
The YoY change flipped to negative from +0.5% in March and +2.3% in February.

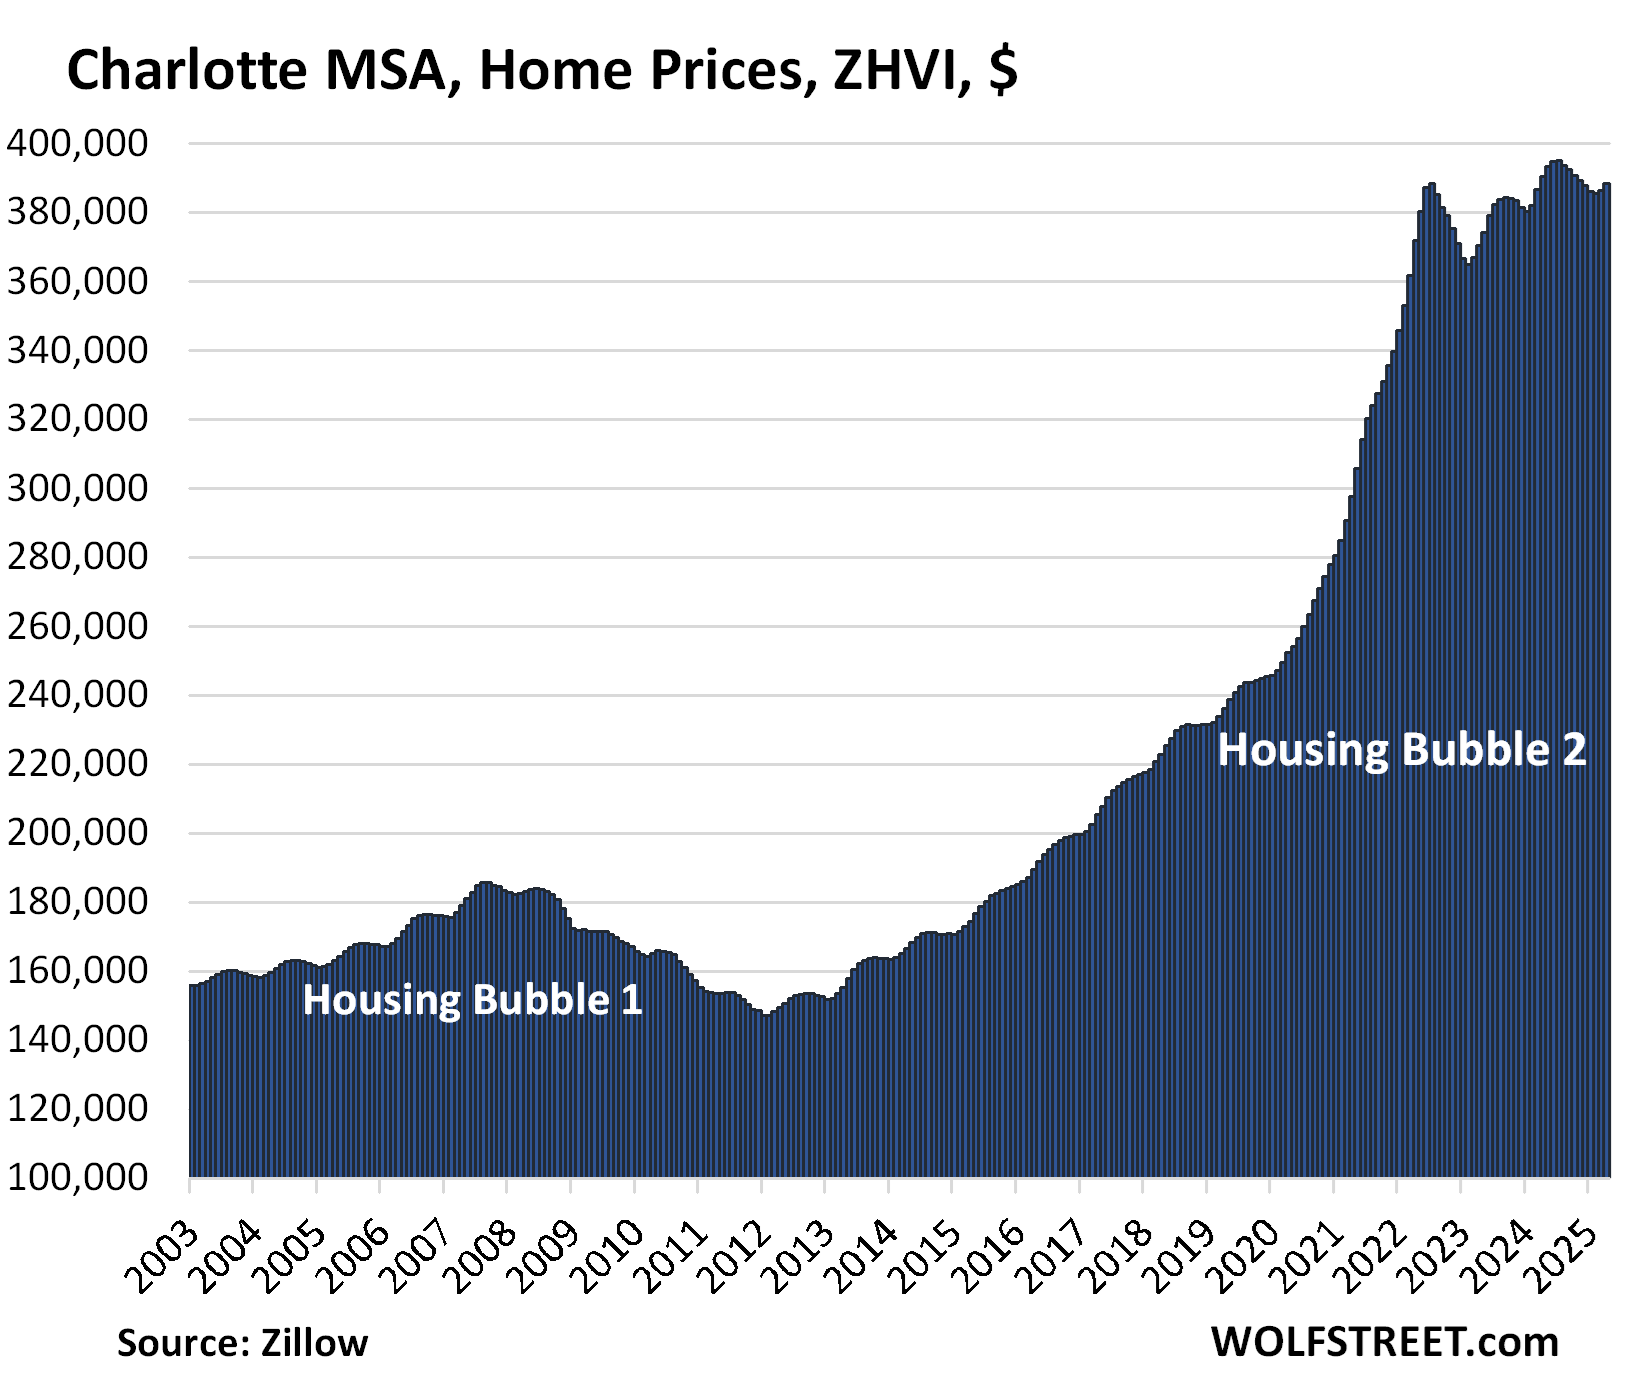
| Charlotte MSA, Home Prices | ||
| MoM | YoY | Since 2000 |
| 0.5% | -0.6% | 170% |
The YoY decline worsened from -0.1% in March when it had flipped from a gain of +0.9% in February.
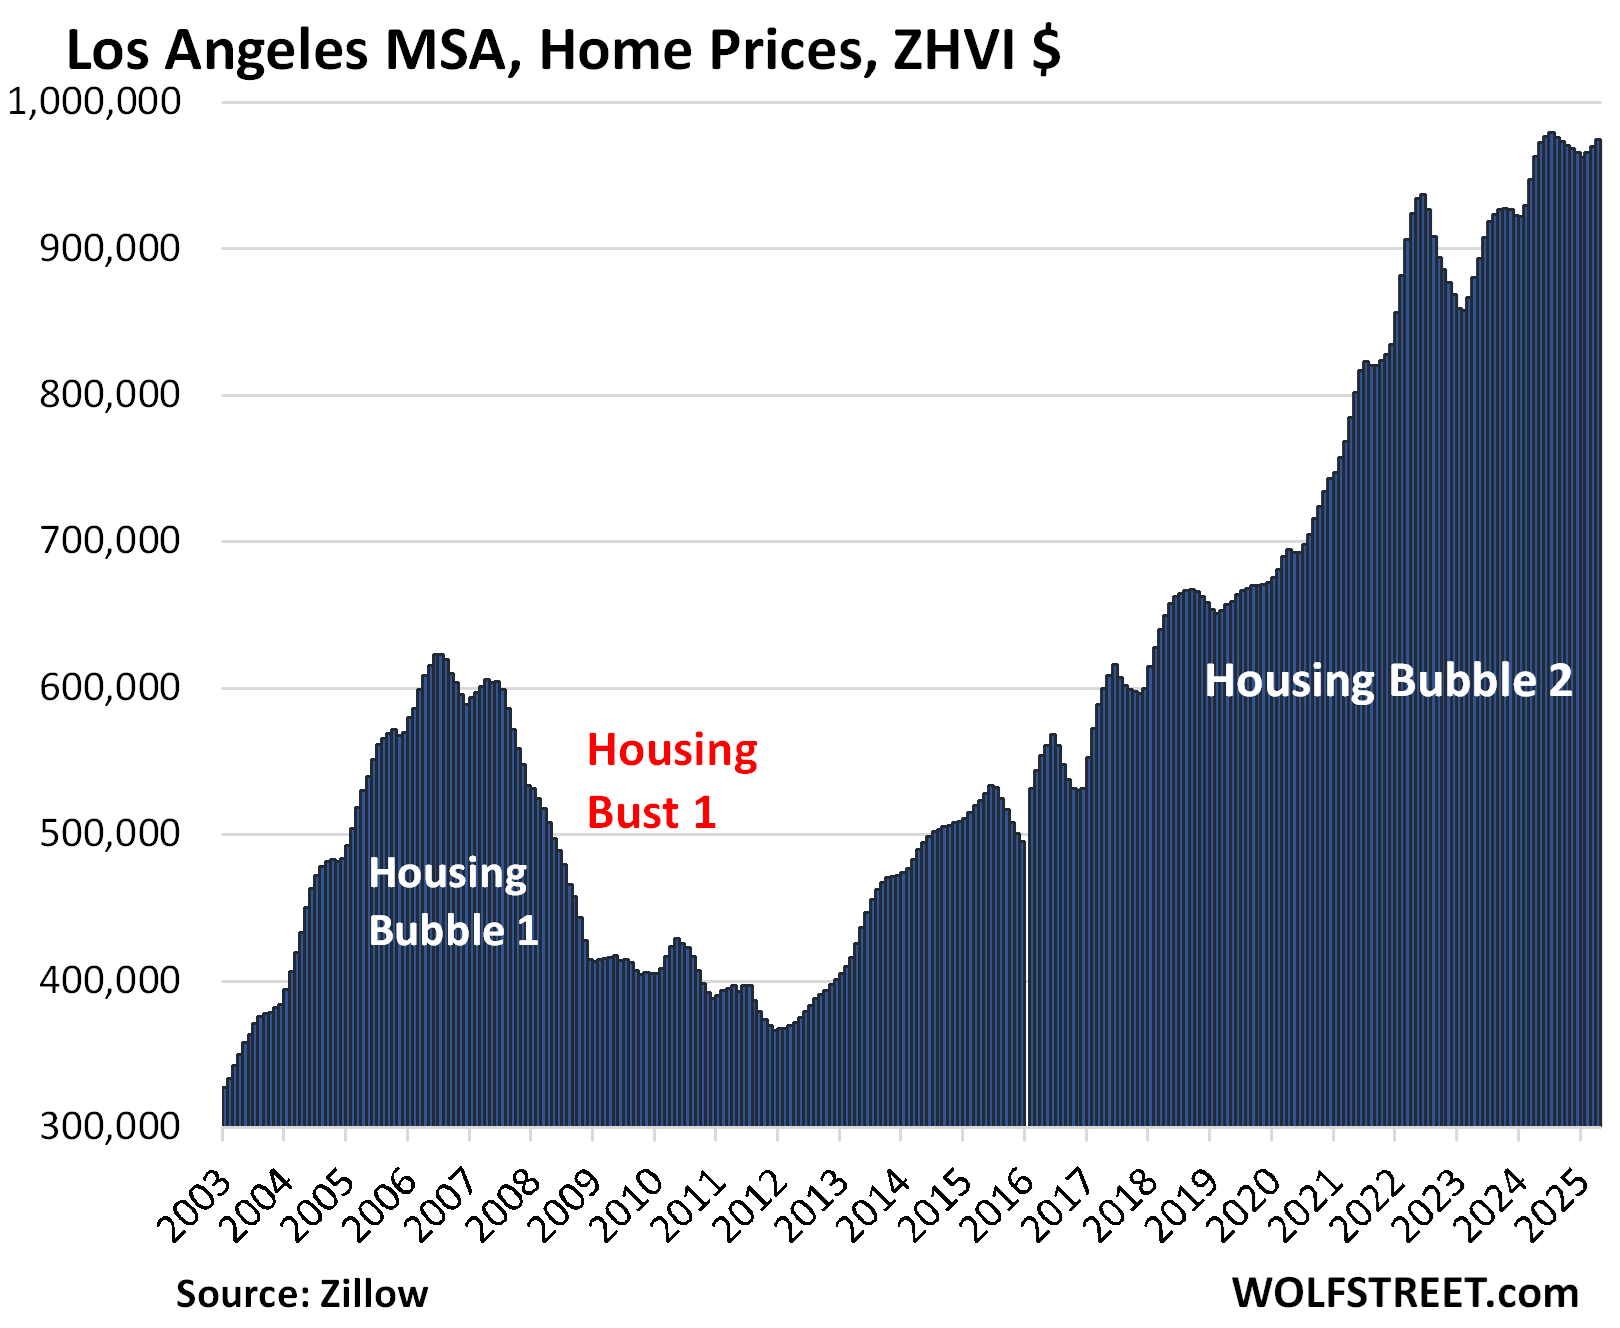
| Los Angeles MSA, Home Prices | ||
| MoM | YoY | Since 2000 |
| 0.5% | 1.2% | 333% |
The YoY gain declined from +2.4% in March and +3.9% in February.
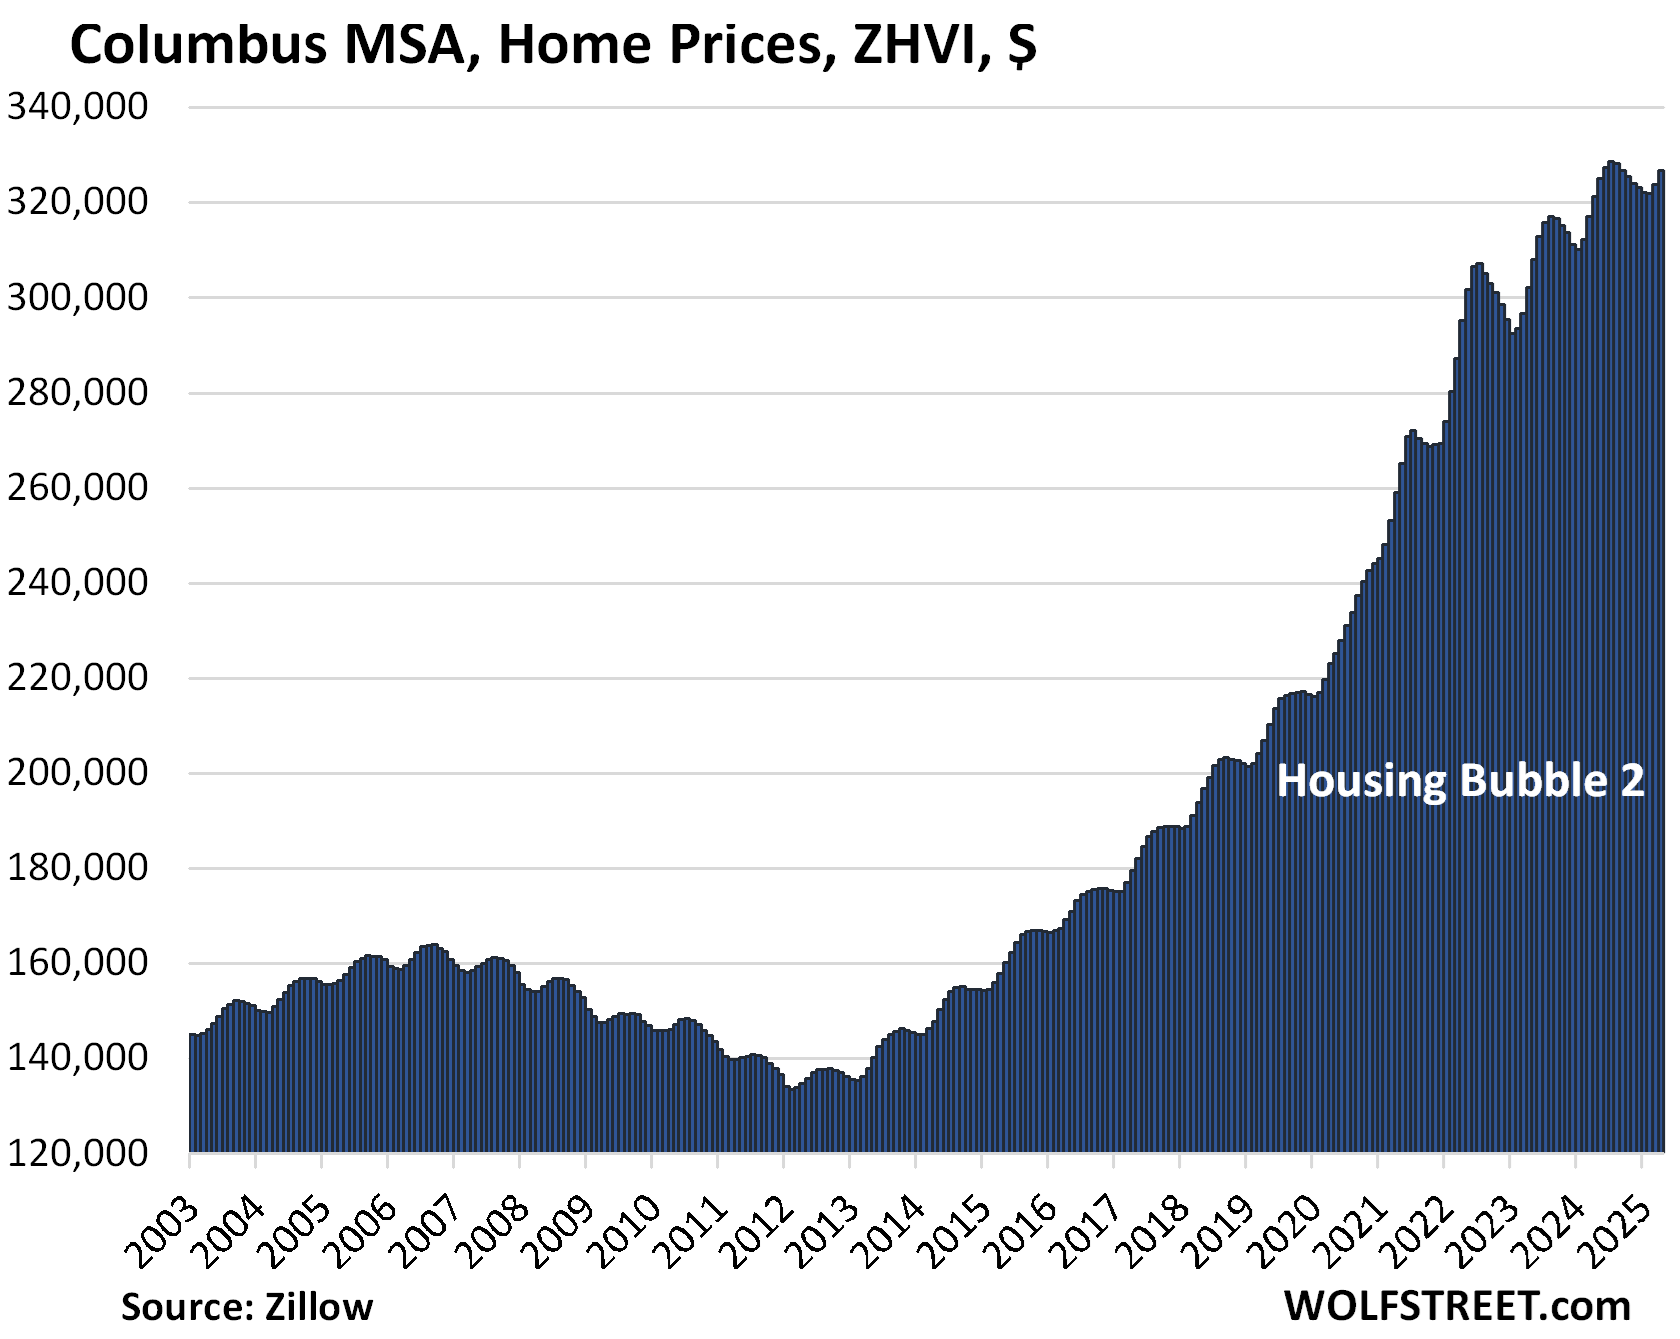
| Columbus MSA, Home Prices | ||
| MoM | YoY | Since 2000 |
| 0.9% | 1.7% | 155% |
The YoY increase shrank from +2.1% in March and +3.1% in February.
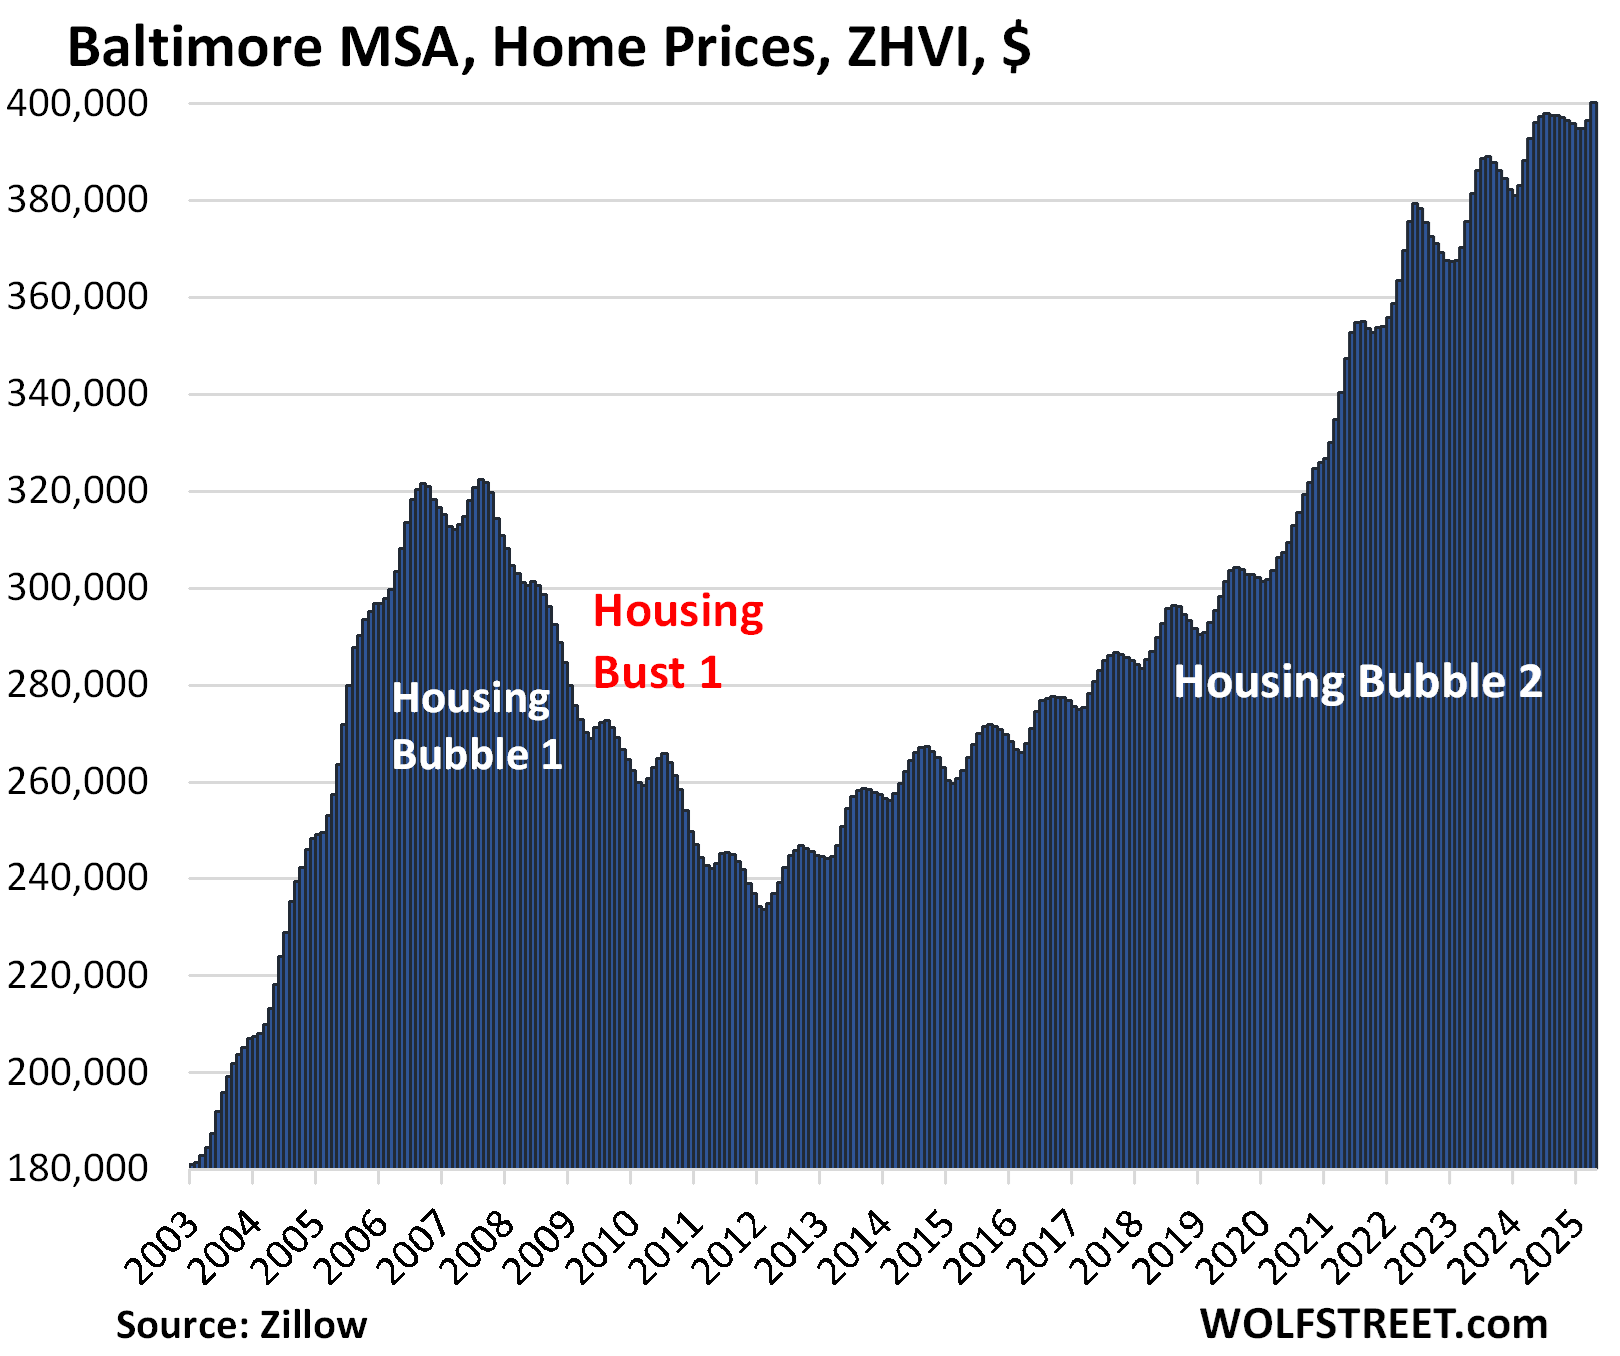
| Baltimore MSA, Home Prices | |||
| MoM | YoY | Since 2000 | |
| 0.9% | 1.9% | 176% | |
The YoY gain shrank from +2.25 in March and +3.1% in February.
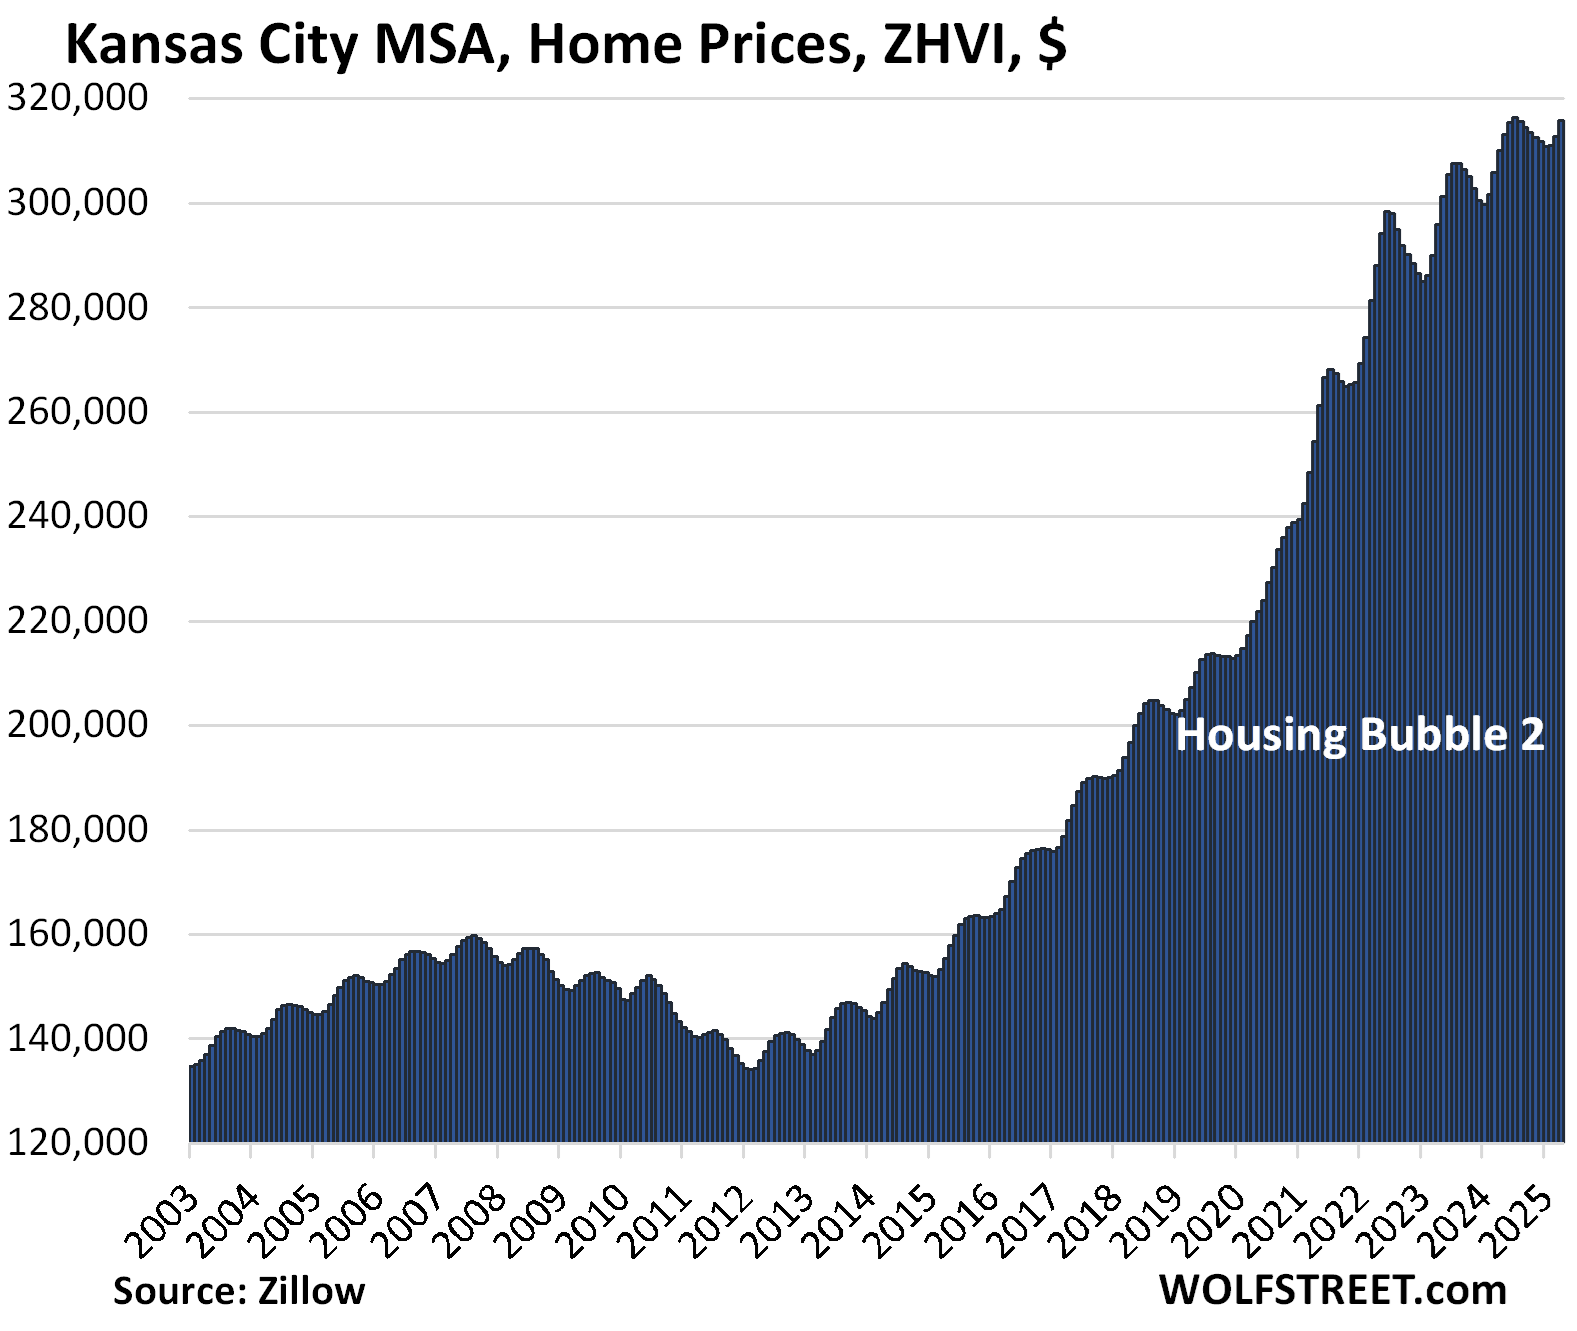
| Kansas City MSA, Home Prices | ||
| MoM | YoY | Since 2000 |
| 1.0% | 1.9% | 179% |
The YoY increase declined from +2.2% in March and +3.1% in February.
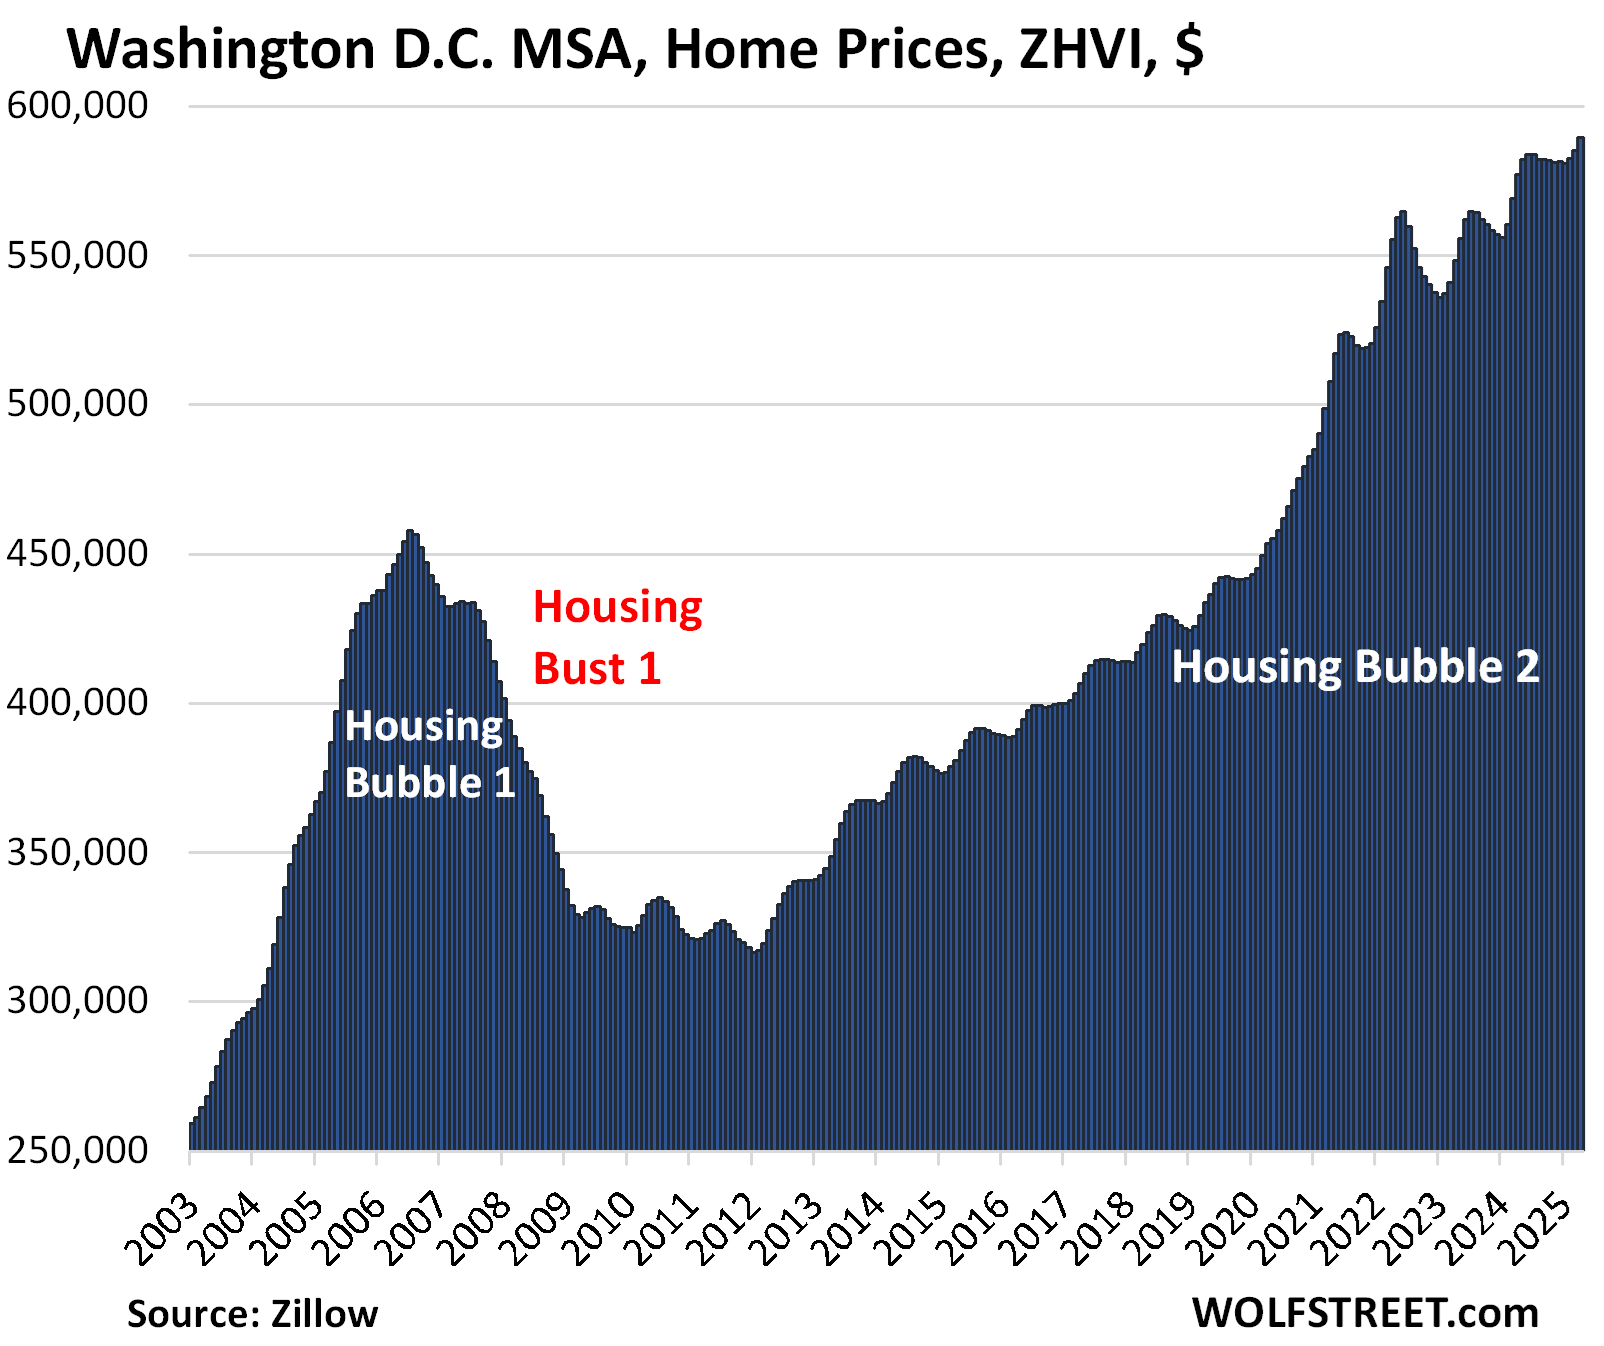
| Washington D.C. MSA, Home Prices | ||
| MoM | YoY | Since 2000 |
| 0.8% | 2.1% | 219% |
The YoY gain declined from +2.8% in March and +4.0% in February.
The vast and diverse metro includes Washington D.C. and parts of Maryland, Virginia, and West Virginia.
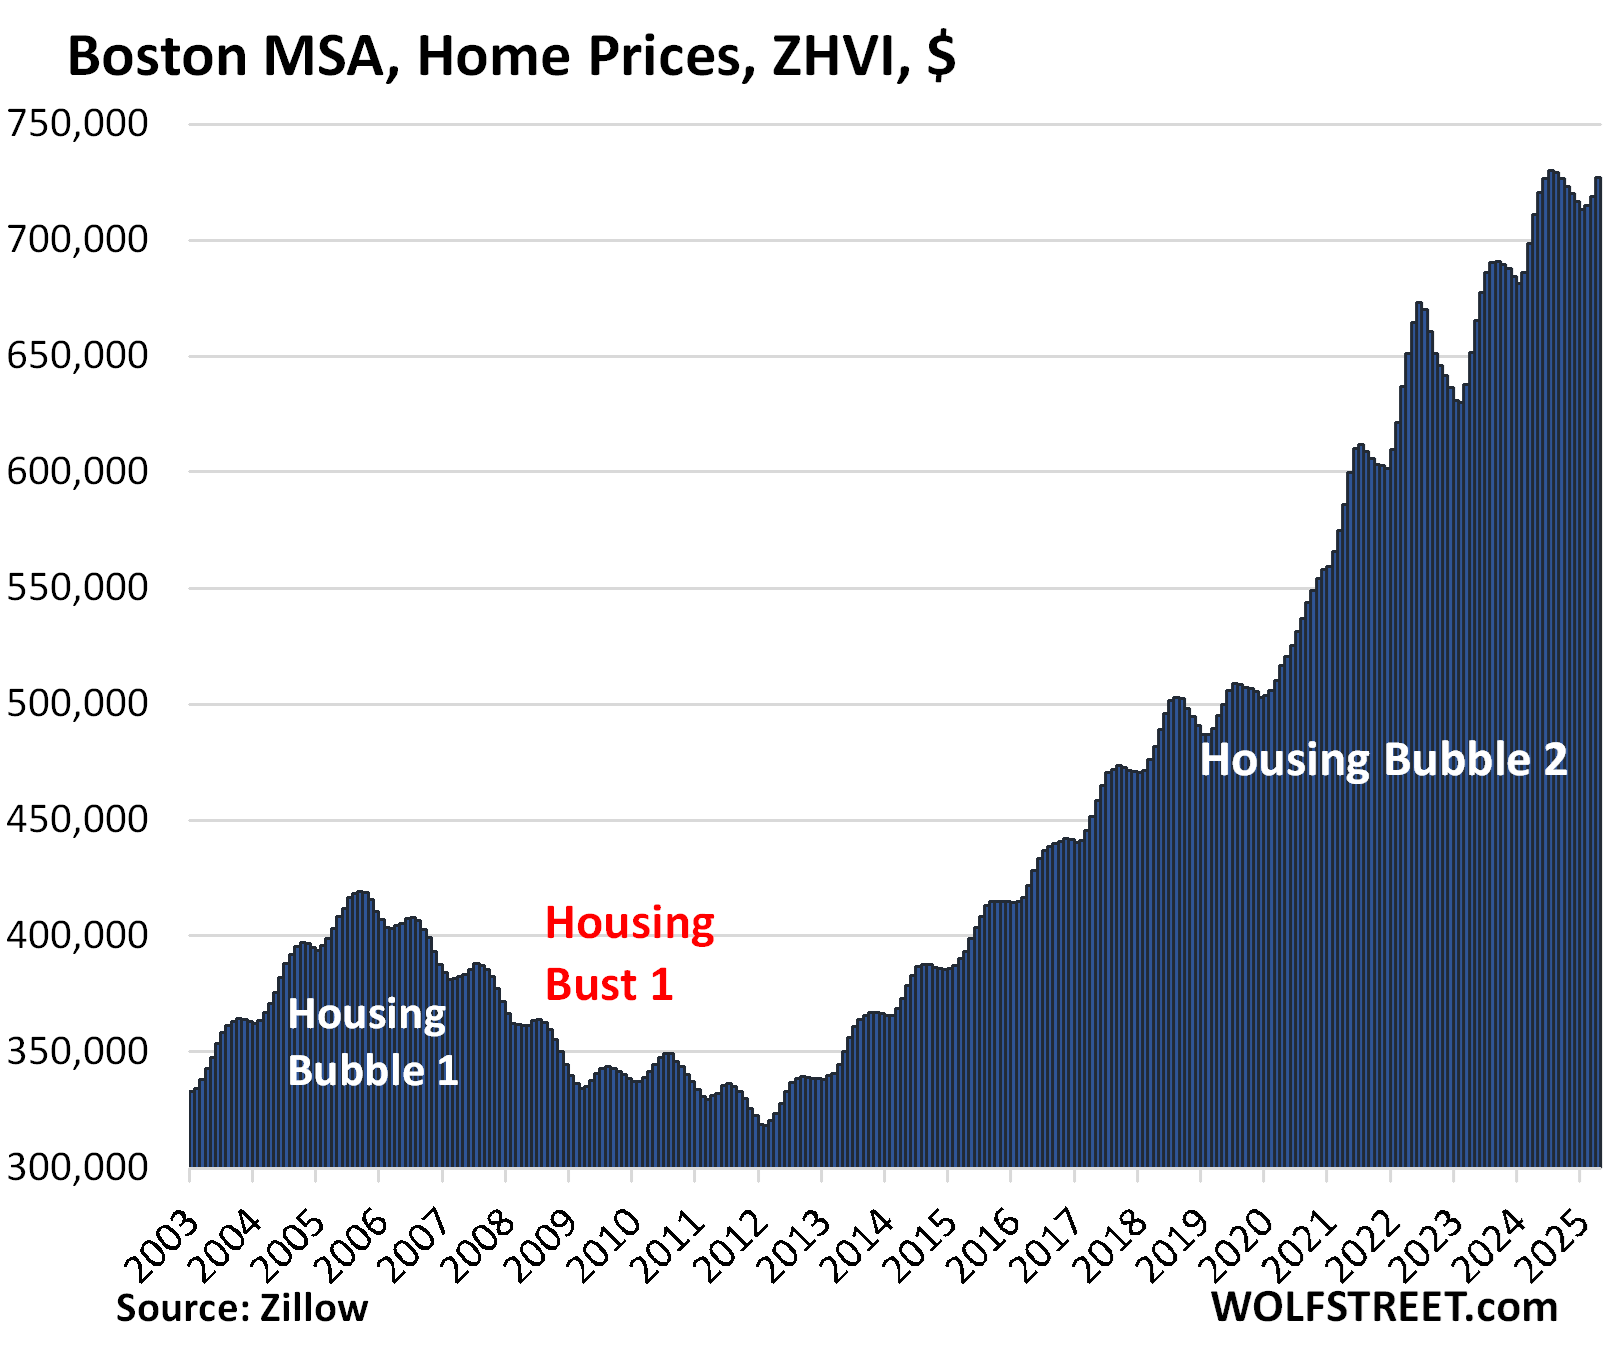
| Boston MSA, Home Prices | ||
| MoM | YoY | Since 2000 |
| 1.1% | 2.2% | 228% |
The YoY gain declined from +2.9% in March and +4.2% in February.
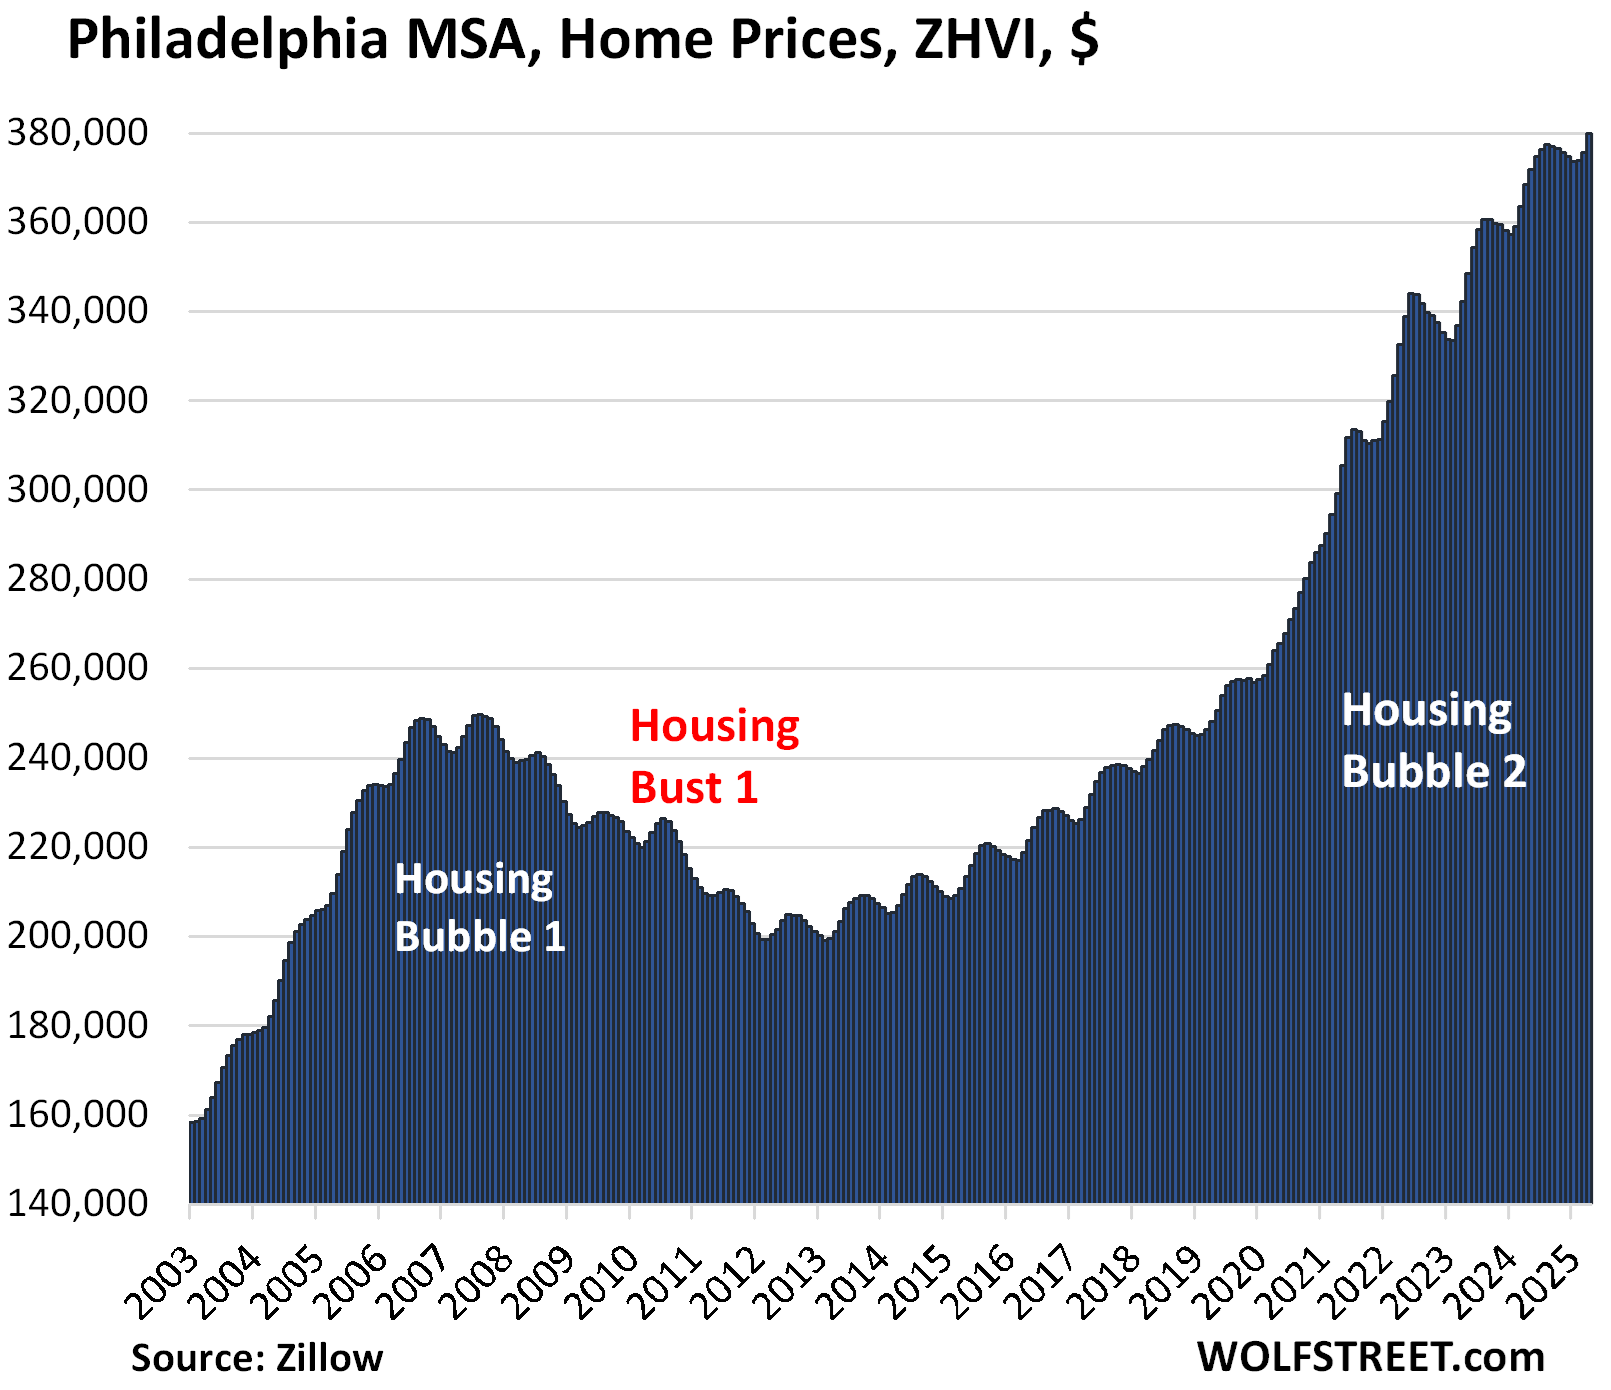
| Philadelphia MSA, Home Prices | ||
| MoM | YoY | Since 2000 |
| 1.1% | 3.1% | 204% |
The YoY gain declined from +3.3% in March and +4.1% in February.
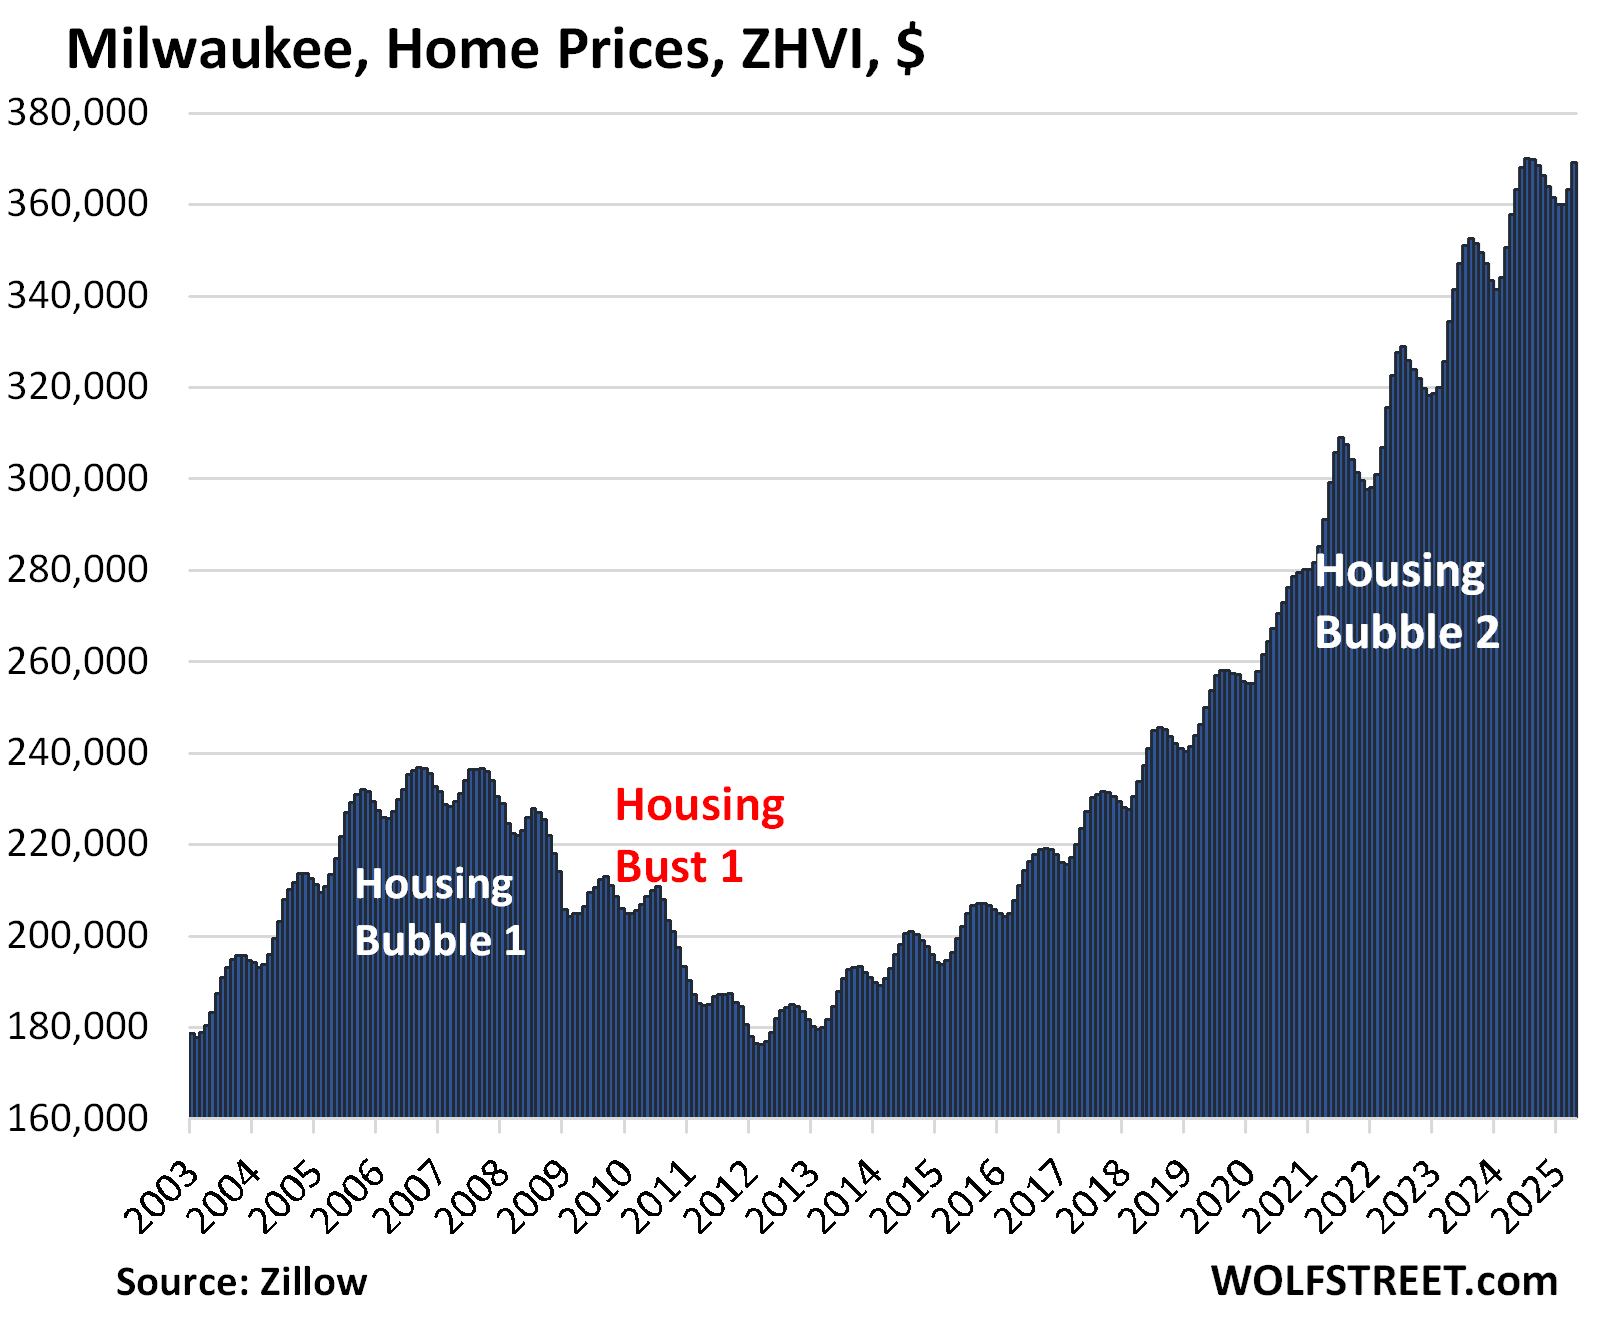
| Milwaukee MSA, Home Prices | ||
| MoM | YoY | Since 2000 |
| 1.7% | 3.2% | 147.5% |
The YoY gain declined from +3.6% in March and +4.7% in February.
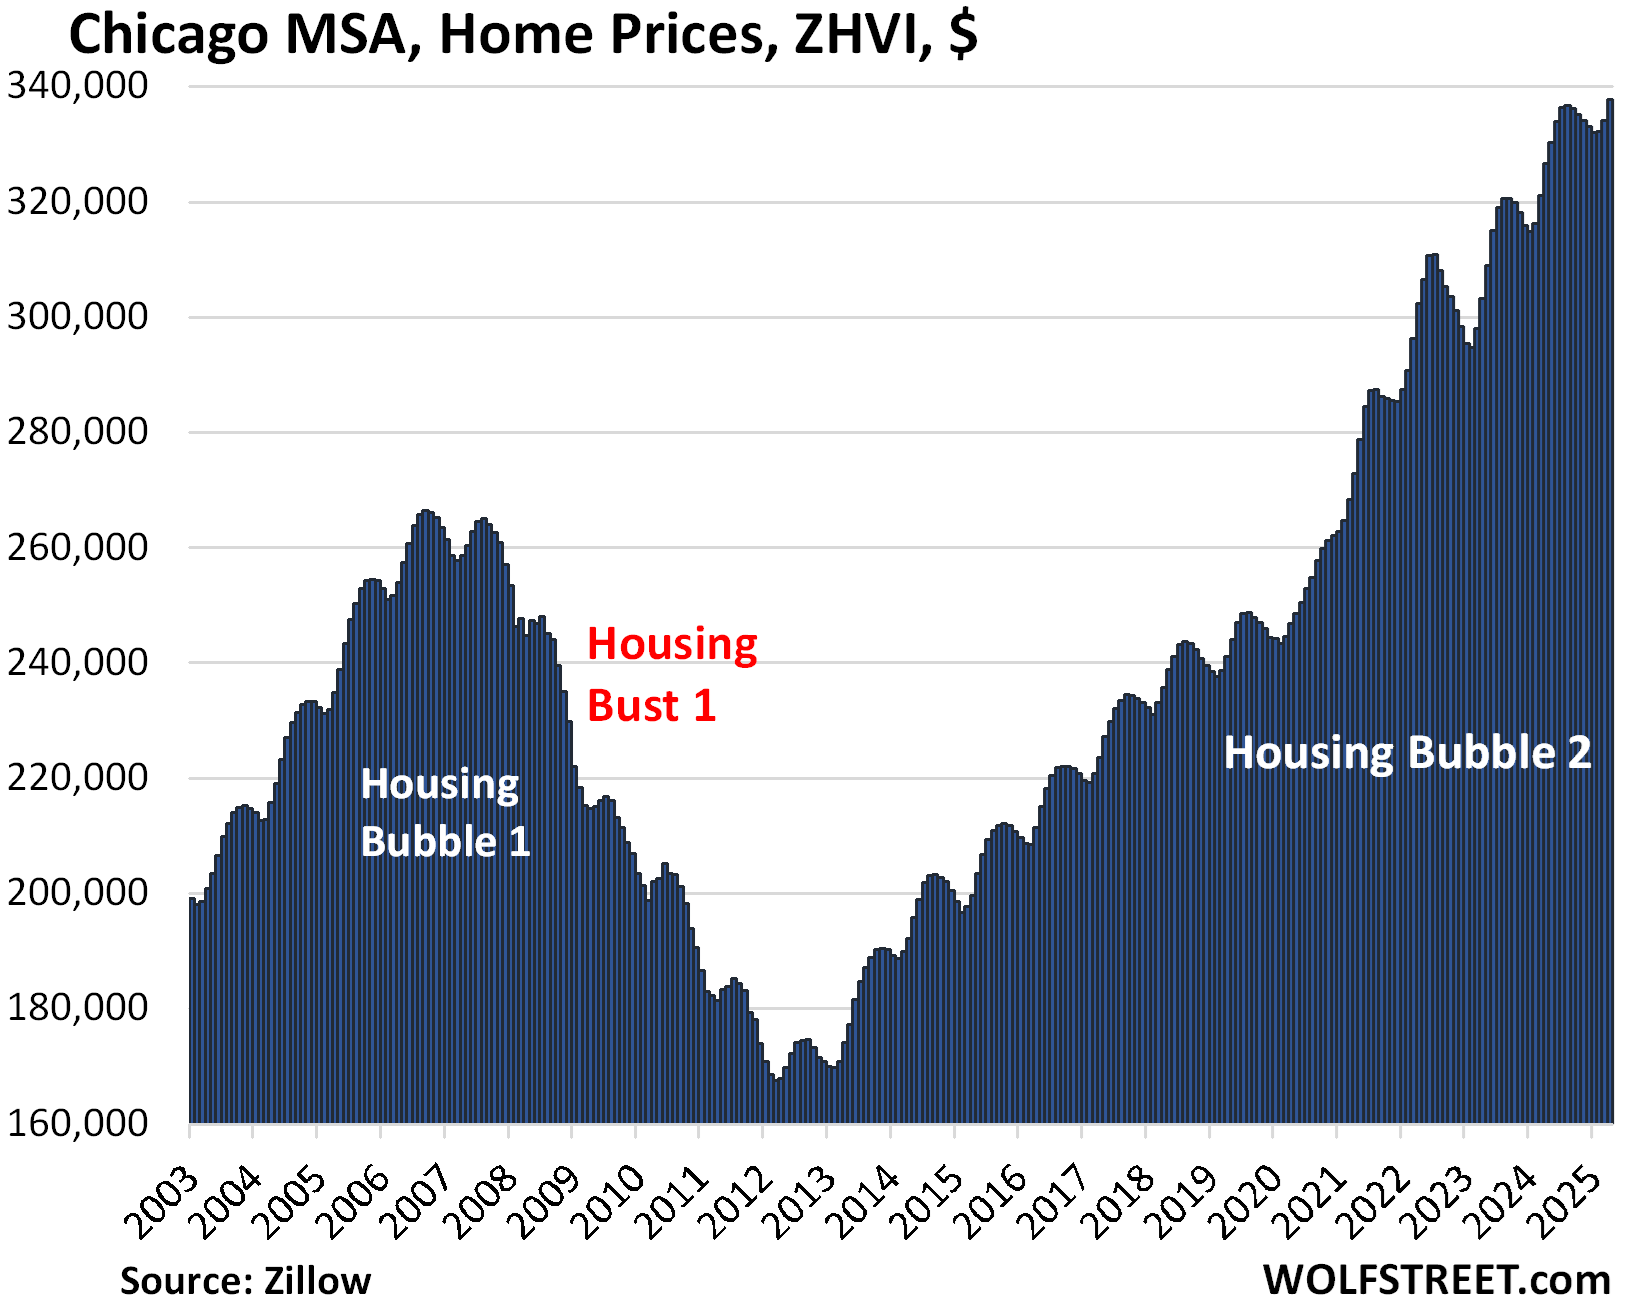
| Chicago MSA, Home Prices | ||
| MoM | YoY | Since 2000 |
| 1.1% | 3.4% | 115% |
The YoY gain declined from +4.1% in March and +5.1% in February.
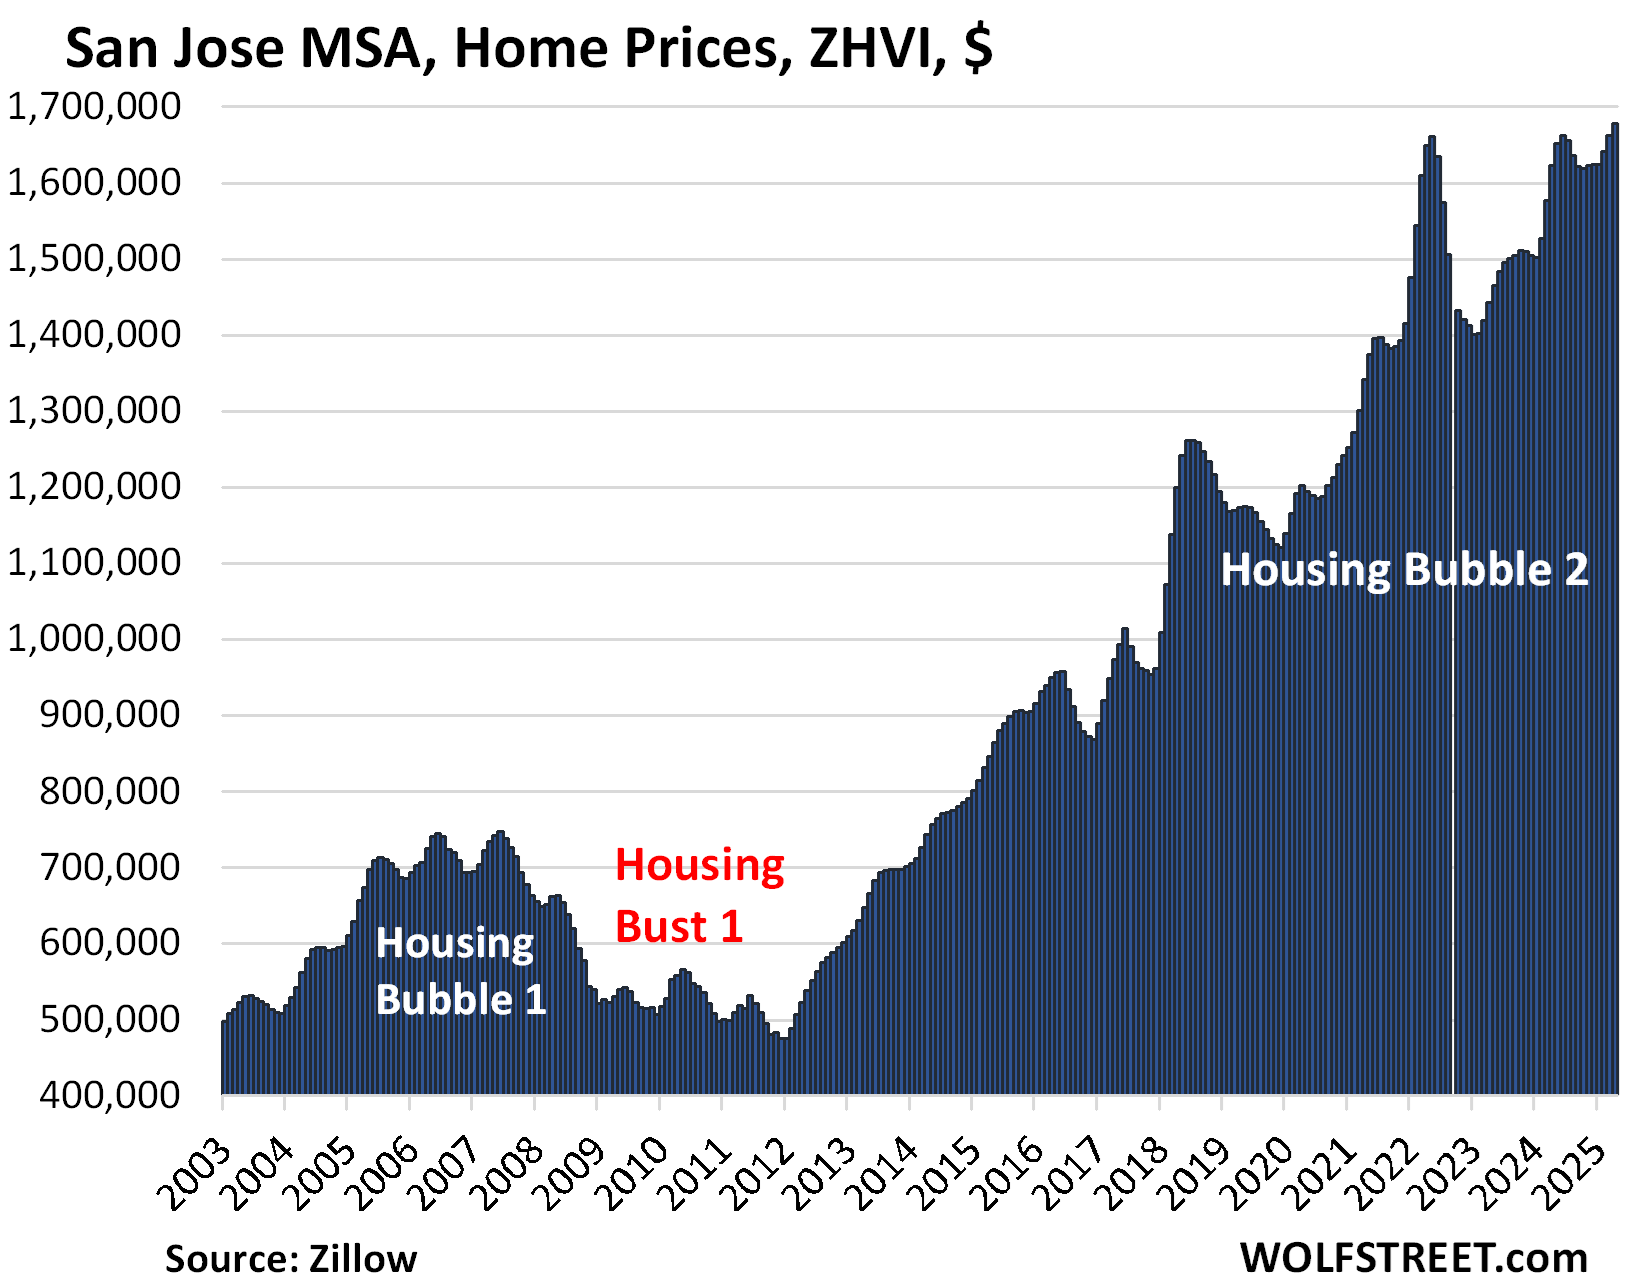
| San Jose MSA, Home Prices | |||
| MoM | YoY | Since 2000 | |
| 0.9% | 3.4% | 352% | |
Reached a new all-time high, squeaking past its previous all-time high in May 2022.
The YoY gain declined from 5.5% in March and +7.6% in February.
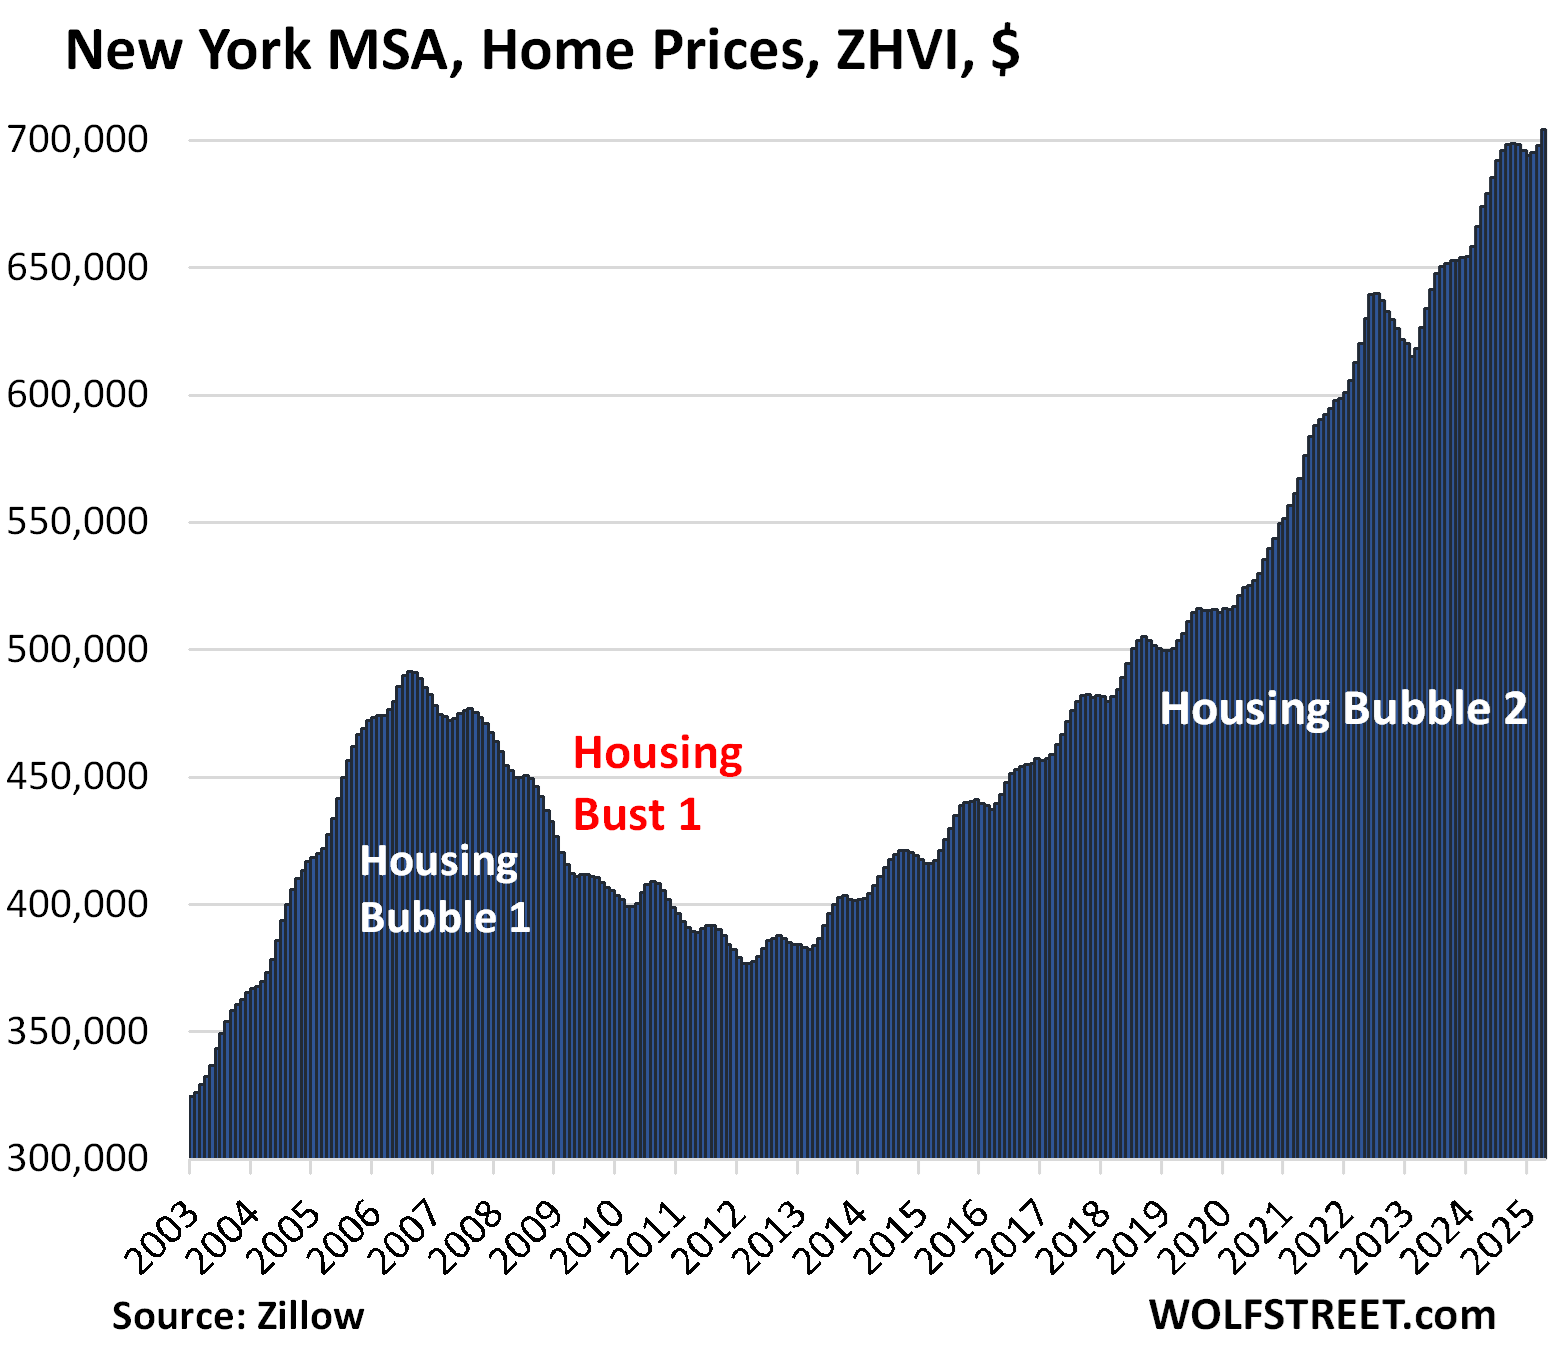
| New York MSA, Home Prices | ||
| MoM | YoY | Since 2000 |
| 0.9% | 4.4% | 214% |
The YoY gain declined from +4.8% in March and +5.6% in February.
Enjoy reading WOLF STREET and want to support it? You can donate. I appreciate it immensely. Click on the mug to find out how:

![]()
Be interesting how California budget issues impact parts of California. I am in Sacramento and it is pretty well expected no new hiring, cancelled projects and pay freezes or potentially even pay cuts, like when COVID hit. They are already “cooking the books” for 2024/2025 but that just leads to larger problems in 2025/2026. Given the large concentration of government workers that might hit the housing market, although guessing minimally. Bring in the DOGE!
“The metros of New Orleans, Oklahoma City, Tulsa, Cincinnati, Pittsburgh, etc. while large enough, don’t qualify in terms of their ZHVI, which has never reached $300,000, despite the massive surge of home prices in recent years, but from low levels.”
Would be curious about OKC and what you are seeing there, even though as you point out it didn’t quite qualify with the lower ZHVI
As I mentioned, and as you quoted, OKC had a “massive surge in home prices,” but that surge has run its course, and the YoY increases have been declining for months, and in April the YoY increase was just +1.0%. Just couple more months like the last few, and growth will flip to negative.
If spring season looks like this now, this fall and winter will be very interesting to say the least, especially seeing how many houses are now for sale coming out of a long slumber.
Disappointing to see LA and probably OC still YoY up, although encouraging to see SD did decline however tiny it is…
Given what we know about the economy, many of these listings will be pulled and return the following spring. The listings where owners have finally decided to convert their equity to liquidity, many of these people will not accept the idea of meeting demand at the correct price point, and they’re under no real financial pressure to do so. Only a recession and major job losses will do that.
I agree with you on this…I also think it’s likely these sellers if they can find the next sucker to buy their crapshack at over $1M+ (SoCal baseline apparently) they will throw a tantrum and retreat and hope for rate cuts or some other kind of magic to rescue them by next Spring. Time will tell if their tactic will pay off, either it will turn into a situation where they will chase the market all the way down or they might get rewarded for their patient. We do live in a very unusual time so anything can happen
You guys talk about sellers as though it’s a unified club. It isn’t. I’m looking around and see many listings by people who bought after 2020. Many of them are trying to sell now because the ownership costs are a lot higher than they are willing to bear. In some cases, the equity gains have already evaporated and there is a sense of panic, with a mortgage payment that is 50% of income.
How is the government going to head off a face melting bust like 07-12 when the Fed’s tools mainly juice assets for richer people to swoop up?
Even the idea of inflating or debasing everything for housing to have a saner price to income ratio would mean a flight to asset safety like…real estate.
What a time to be alive playing musical chairs
Appears that Housing Bubble 2 just flipped us the bird is is not intending to go anywhere anytime soon…
B.S.. My house in San Diego is up a whopping $100K YOY, more than 10%.
LOL, it’s not up or down (except in your mind) until you sell it. Prices aren’t set by wishful thinking. Prices are set by transactions that closed, and without transaction, you have no idea what your house is worth. So add it to the surging inventory and no demand in San Diego, and sell it, and then the transaction price is what it’s worth, and this transaction price then becomes part of the data.
The data here is based on transactions. They’re NOT estimates or hopes of what houses might bring if they sell.
“Prices aren’t set by wishful thinking” haha, tell that to Mag 7 stock price or majority of the market..even TSLA recent recovery are likely based on a lot of magical hopium thinking and as we all seen, things just tend to defy gravity for way longer than it should.
Not that I disagree with you but I do think housing is more entrenched in wishful thinking that stock market. Combine something that’s materially tangible and not just some numbers in the computer, add a giant surge up, naturally people are bound to be disconnected with what their house should truly be worth and hang onto the price will go up narrative like the gospel.
Even the Mag 7 stock prices are set by transaction prices and not wishful thinking.
anecdotal evidence: a limited selection of examples which support an argument but which are not supported by statistical analysis. Personal stories can lead to skewed perceptions which can result in misleading conclusions.
mr. wolf doesn’t do anecdotes.
My favorite comment. It explains so much.
I’m surprised prices are falling so slowly. I recently read an article that Denver housing inventory is up 90% yoy and sales are down yoy. Maybe people are waiting it out and won’t start panicking/price cutting until end of summer.
In other news though the neighbors house just listed at $1.6M, Zillow value $1.5M which seemed overpriced. It was on the market one weekend and got 2 offers over asking so then again plenty of rich buyers still out there willing to bid up prices.
Always plenty of suckers with money to burn.
Nothing new and it happens in every cycle.
Not suckers. Just One Percenters looking for a place to park all of the money they acquired during Covid. They are the ones bidding up assets.
You are 100% correct. I am in the Miami area. I’m not in the market for a house, but I went to an open house this weekend purely out of curiosity. This house was 3800 square feet with 5 bedrooms, so clearly intended for families, not single people or empty nesters. Most of the people at the open house were not young families, but people in their 50s-70s. I saw one drive up in a Porsche, one in a Bentley, and then a few others in more standard BMWs or Mercedes.
Whether they are buying to park their money, as you said, or buying houses for their adult children, the effect is the same. This illustrates perfectly the problem with QE and the damage it did. All along, Bernanke thought that the money would “stay in stocks,” and it would have no effect on CPI goods or services or things like housing. But of course it did, and it was obvious it eventually would. There is one way, and one way only, to fix this problem, and that’s to allow the stock market to crash. But I don’t believe the government will allow it to happen. Too many rich people in control.
But they’re NOT BUYING! Volume has collapsed.
They’re just looking, like you?
I guess we will see. This house was turnkey which seems to make a difference as to whether houses sit around here. If it goes pending right away and sells at anywhere near asking, we have our answer
I’ve been patiently watching condo and small homes for my adult daughter in northwest Denver, and inventory is way up and prices are coming down significantly. She’s going to be patient and rent another year or two while the prices coast down.
Yeah I’ve heard condo prices are collapsing because the HOAs skyrocketed. Single family homes still feel sticky depending on the area. West Denver people seem to be listing at new all time highs still. Some of those houses are selling, some aren’t. I think it’s neighborhood dependent. Hoping to see a more broad based correction soon.
Also anecdotally, I have a couple friends selling their houses. All listed above 2021 peak values. One says they just won’t move if it doesn’t sell. The is getting divorced and has to sell so they cut the price by 6% but that’s still above its peak 2022 value (appraised the first time they considered divorce) – they’ll need to sell at some point so TBD. In both cases there seems to be a lot of ego attached to how much their house is worth and not accepting less – which to me is funny because they did absolutely nothing, it was COVID that increased the house value by the insane amount it’s up.
Anyways what happens probably depends on what percent of listings need to sell and what percent can just pull their listing and try again next year. The nice part is Colorado is also seeing falling rents and a surplus of apartments so pulling it and renting it is a less and less appealing plan B.
The ZHVI used in the post and plots appears to include condos and single family homes. Condo prices are falling, which can drag down the YoY changes even if single family homes are stable or increasing.
There’s also the “mix” of housing within the measure. For a few years, high price homes have done well, even as low price homes have not.
This economy is very good to be in if you do not have to take out loans for large purchases. High interest rates slow the consumption of finance-dependent buyers first, and (maybe) trickle up to wealthier buyers.
“Condo prices are falling, which can drag down the YoY changes even if single family homes are stable or increasing.”
That’s not the math.
Nationwide, 90% of all sales are single-family sales and only 10% are condo sales. In March, in the US, there were 3,640,000 single-family sales and 380,000 condo sales (NAR, existing home sales).
In other words, in nearly all markets (with a very small number of exceptions), single-family houses BY FAR dominate the indices because there are FAR MORE single-family transactions in the index than condo/co-op transactions. So a disconnect between condo prices and single-family prices has very little impact on the overall index.
This is also why I post articles with condo prices separately, because condo prices get drowned out by single-family prices.
Since you mentioned Denver: single-family prices are also sagging. In some cities, single-family prices are sagging more than condo prices.
So below are single-family prices in Denver. Note, there are some data differences. This is in the “city” of Denver, not in the “metro,” and it is a seasonally adjusted three-month average (above is metro, raw, not seasonally adjusted, not three-month average). So this data here is from the “smoothed” ZHVI for cities. So if you smooth out the Denver chart above and seasonally adjust it, it will look very similar to the single-family chart:
Re:
Honolulu data…..
While the data is shown for Honolulu and is for mid- tier houses….
Honolulu really isn’t a good indicator of the the Oahu, or state of Hawaii real estate market.
Honolulu only has 251 houses for sale in the MLS right now. There are over 1700 condos in Honolulu listed for sale.
Waikiki had around 700 condos for sale with about 130 of those under contract.
The state of Hawaii has over 10,000 properties for sale in the MLS.
And from a price perspective, you aren’t going to get much for that Zillow shown price of around $850,000.
In fact, you probably wouldn’t want to be caught dead in a lot of those places. To be perfectly Frank a house under $1 million in Honolulu is a dump.
To get a decent house for around $1 million on Oahu you have to go far away from Honolulu.
What might be considered luxury in other US markets is about ordinary for Hawaii.
Nonsense. I told you maybe 1,000 times in the article, including on each chart, that these are metropolitan areas, not cities. There are 3,334 active listings in the metro of Honolulu, up by 49% year-over-year (Realtor.com). You just google around a little from your outpost in Australia without reading the article?
As much as I wish to see it fucking burn, a have to say – not enough, nothing happening yet..
People have been spoiled by cryptos that collapse overnight. Not going to happen in RE. Nothing happens overnight in RE. Last housing bust took 5-6 years, and that was a fast one. Many local housing busts took DECADES (including Tulsa).
Nominal house prices will likely trend sideways for a decade, as inflation causes real prices to continue falling.
Will be interesting to watch mortgage originations.
This is from Mortgage News Daily: “Home purchase demand improved improved last week according to the MBA mortgage application survey. The improvement over the previous week was fairly modest, but the index was already the 4th highest reading of the past 2 years. Now it’s the 5th highest and the latest update takes its place, moving within striking distance of longer term highs.”
This contextless stuff can drive you bonkers. Here are purchase mortgage applications, data from the MBA, same as Mortgage News Daily cites. In that week that you cited, they were down by 38% from the same week in 2019:
This is still a historic collapse of mortgage applications which remain well below the lockdown lows of April 2020 when the industry essentially shut down for a month. Mortgage applications have collapsed far more than home sales (-25% from 2019).
Indeed. According to *laughable* BLS inflation calculation, inflation since 2022 is 14% so pretty much every market has lost to inflation since then.
Inflation per the BLS CPI since beginning of 2021 = 22.6%
It was in early 2021 that inflation exploded, and it went into mid-2022 and then started cooling.
Look at all the blue going up from 2012 – when you see it going down mirroring the same fucking path, and digging lower – then it will be complete the way it should be.
What about Detroit?
If the current rate spike gets truly into orbit, then my 8% mortgage rate call for later this year should seriously dent housing.
If this continues, it will eventually have a huge moderating effect on inflation as owners equivalent rents will start decline, and housing is a huge chunk of CPI. This would be a most welcome development.
The CPI Owners Equivalent of Rent (OER) tracks the CPI “Rent of Primary Residence” very closely. It does not track home prices at all. It never did. Not on the way up, and not on the way down.
https://wolfstreet.com/2025/05/13/beneath-the-skin-of-cpi-inflation-services-inflation-bounces-back-no-signs-yet-of-tariffs-getting-passed-to-consumers/
Here are the CPIs for OER and Rent:
And here are CPI Rent and Home prices
Housing bubble #1 was driven by a wall street scam. Housing bubble #2 is being driven by main street economics. It’s going to take very long time (if ever) to correct itself.
Covid liquidity spiked housing in my view, I am listing a house for sale in june, private open house starts this week for invite realtors. Housing could easily correct to near pre covid levels, if rates spike, I am in the rare camp that the Fed will either raise rates to fight inflation assuming employment rate stays strong, I think closing the border will keep employment rate strong this year. Or the Fed does nothing all year and the 10 year goes up by itself and the 2 year heads up maybe 59 basis points from here. The 2 year is up 39 BP in May, yet no one is talking about that! I am in the 125 points up camp and I am sure I may in small company in that view
It’s really more like the tides returning, as people slowly return to where they came from before the pandemic kicked off, than it is some type of collapse. You can see that like in the DC MSA, and other similar markets that were a source of income for most of these remote job purchasers over the pandemic period. Even when you look back to that time frame Alexandria VA market, which is part of the DC MSA was having lower pricing because so many people were exiting the city for other remote locations.. now it’s flipped.. people always go where the jobs are, and were family and friends are to help support them in times of need.
30-year US Treasury passes 5% yield…
I look at 2006 prices and see that eventually prices dropped to 2002-2003 levels (-3 years from peak). If this repeats, we could return to 2018-2019 levels, which is generally ~30% to -40%. Seems about right, except that the dollar is worth less now, I wonder how that plays into prices.
Do you see any signs of home builders slowing their building?