Where inflation hit in April: Rent, motor vehicle insurance & maintenance, eating out, medical care services, rental cars, utility natural gas, electricity… But prices of apparel & shoes fell.
By Wolf Richter for WOLF STREET.
On a month-to-month basis, inflation bounced back in April, driven by core services and to a lesser extent by utility natural gas and electricity, according to data from the Bureau of Labor Statistics today. Food prices dipped. Prices of apparel and footwear also dipped.
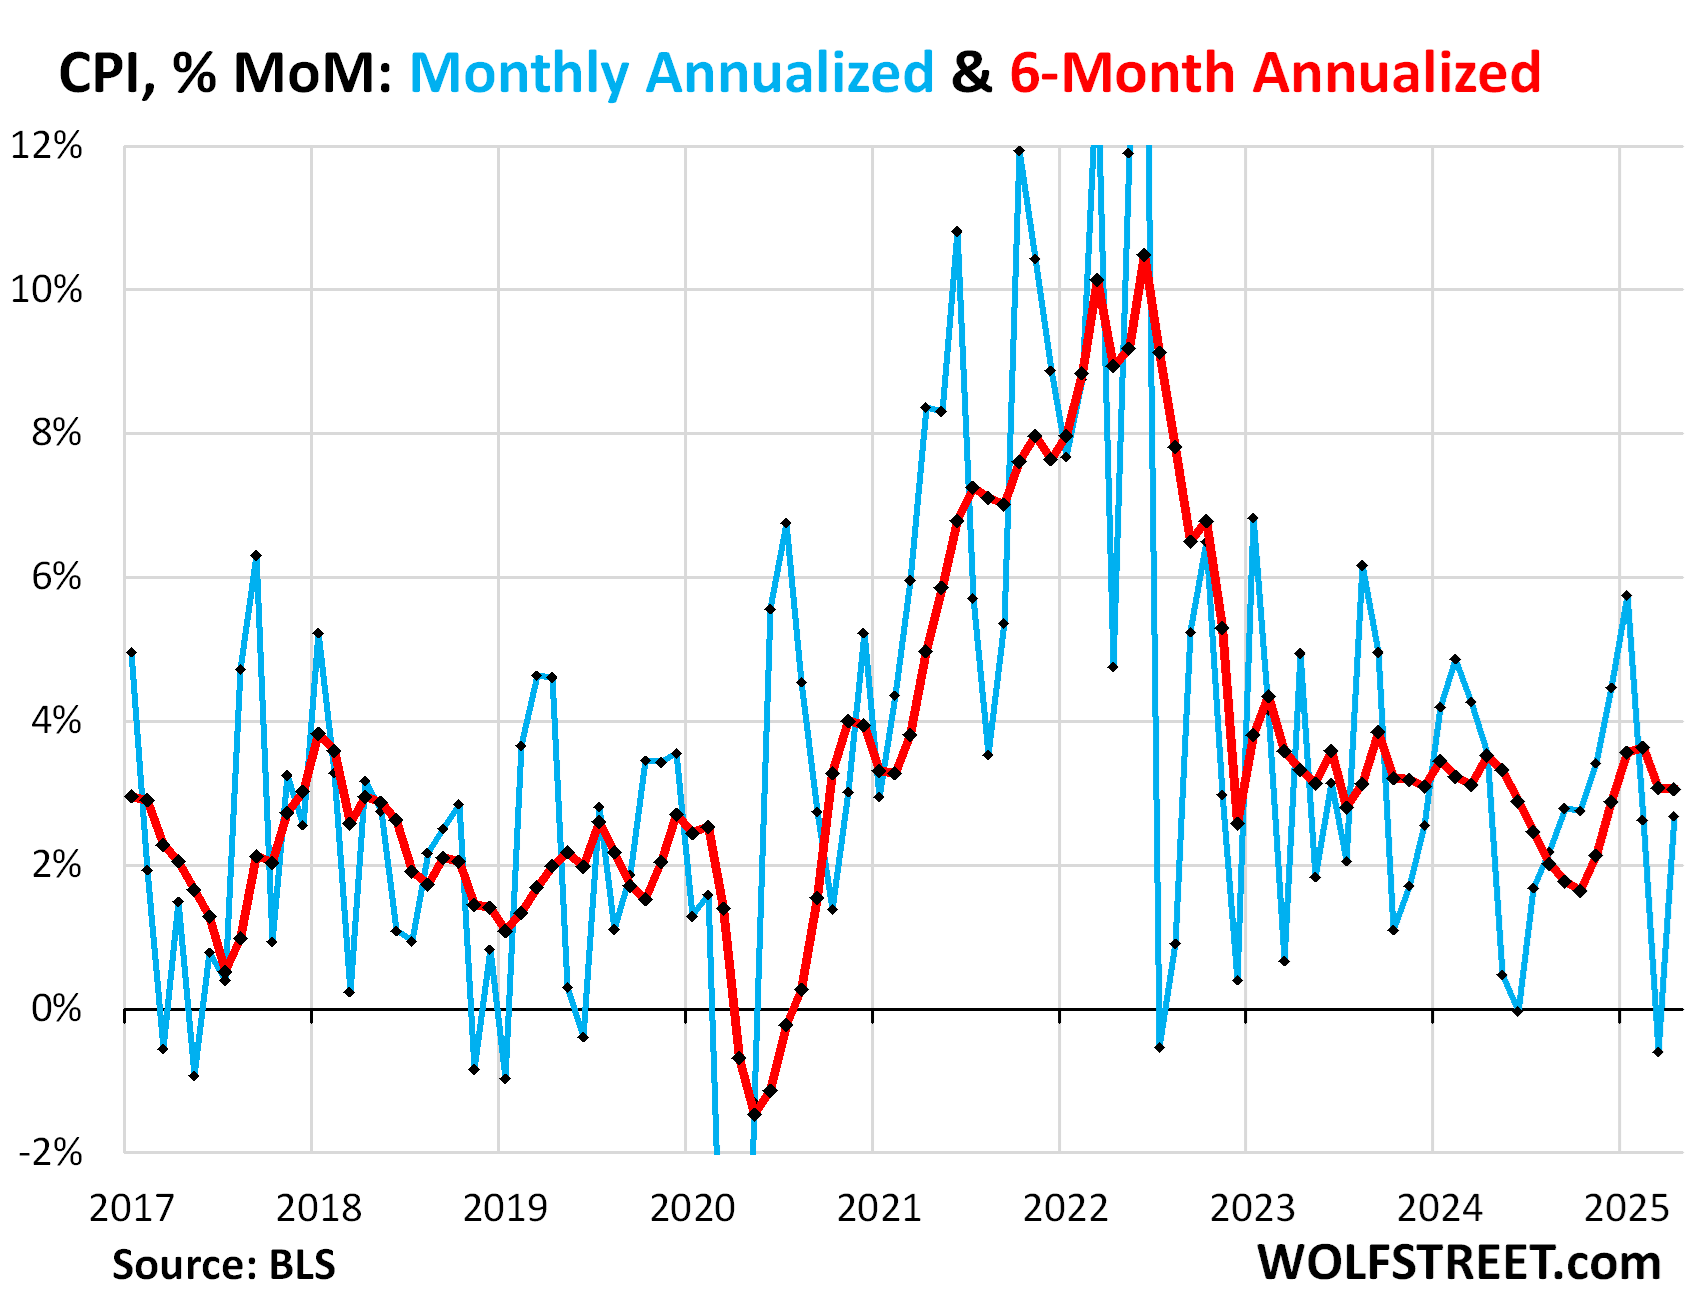
The Consumer Price Index bounced back and rose by 0.22% (+2.7% annualized) in April from March, after the 0.05% dip (-0.6% annualized) in March (blue in the chart below). There was no evidence of tariffs getting passed through to consumers. The inflation came from services, and also from utility natural gas and electricity.
This bounce-back from the drop caused the 6-month CPI to rise by 3.1% annualized, same as in March (red in the chart):
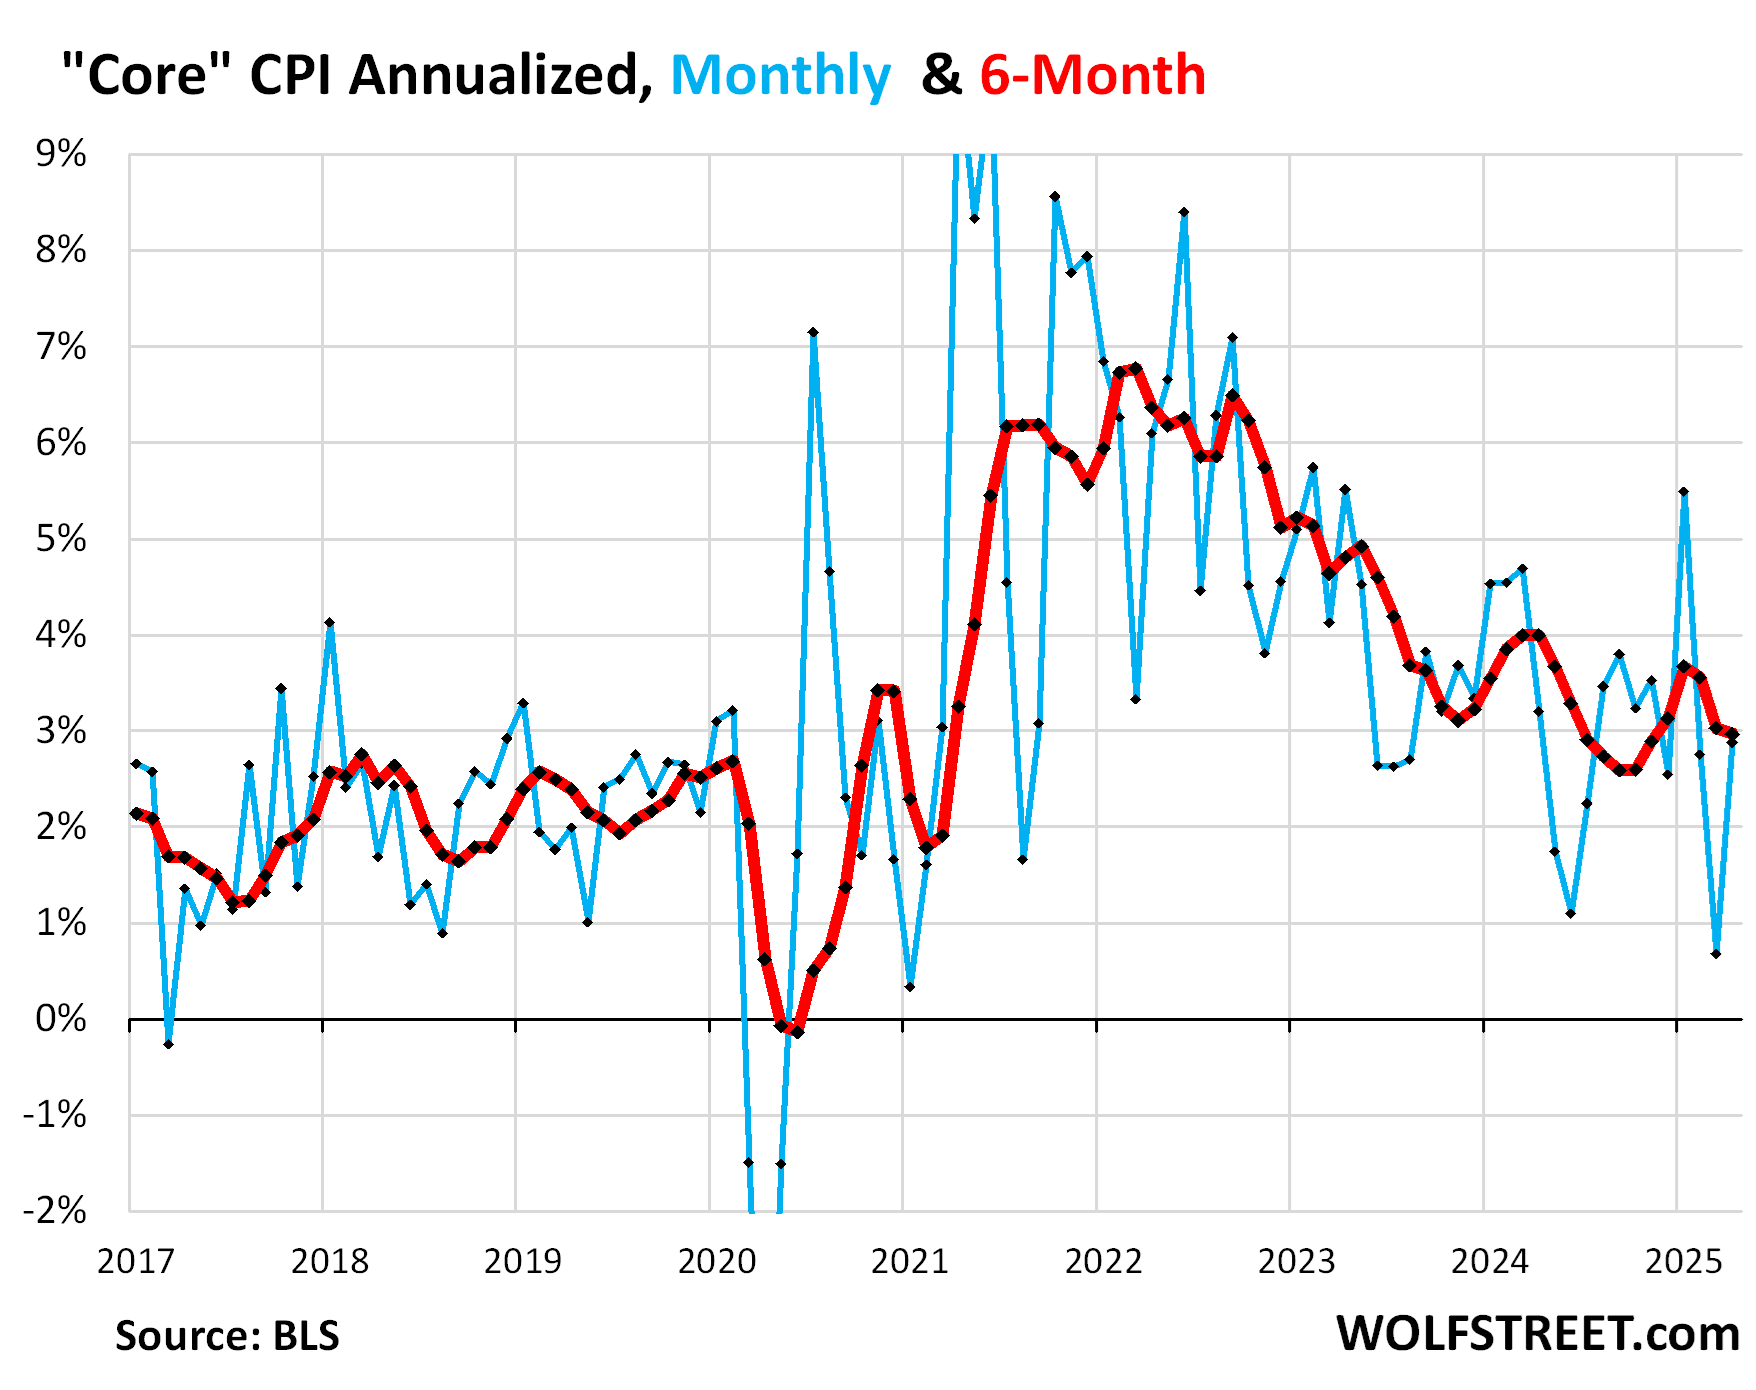
“Core” CPI, which excludes food and energy components to track underlying inflation, also bounced back, driven by core services, and rose by 0.24% (2.9% annualized) in April from March (blue in the chart below).
The 6-month “core” CPI rose by 3.0% annualized, essentially the same as in the prior month (red).
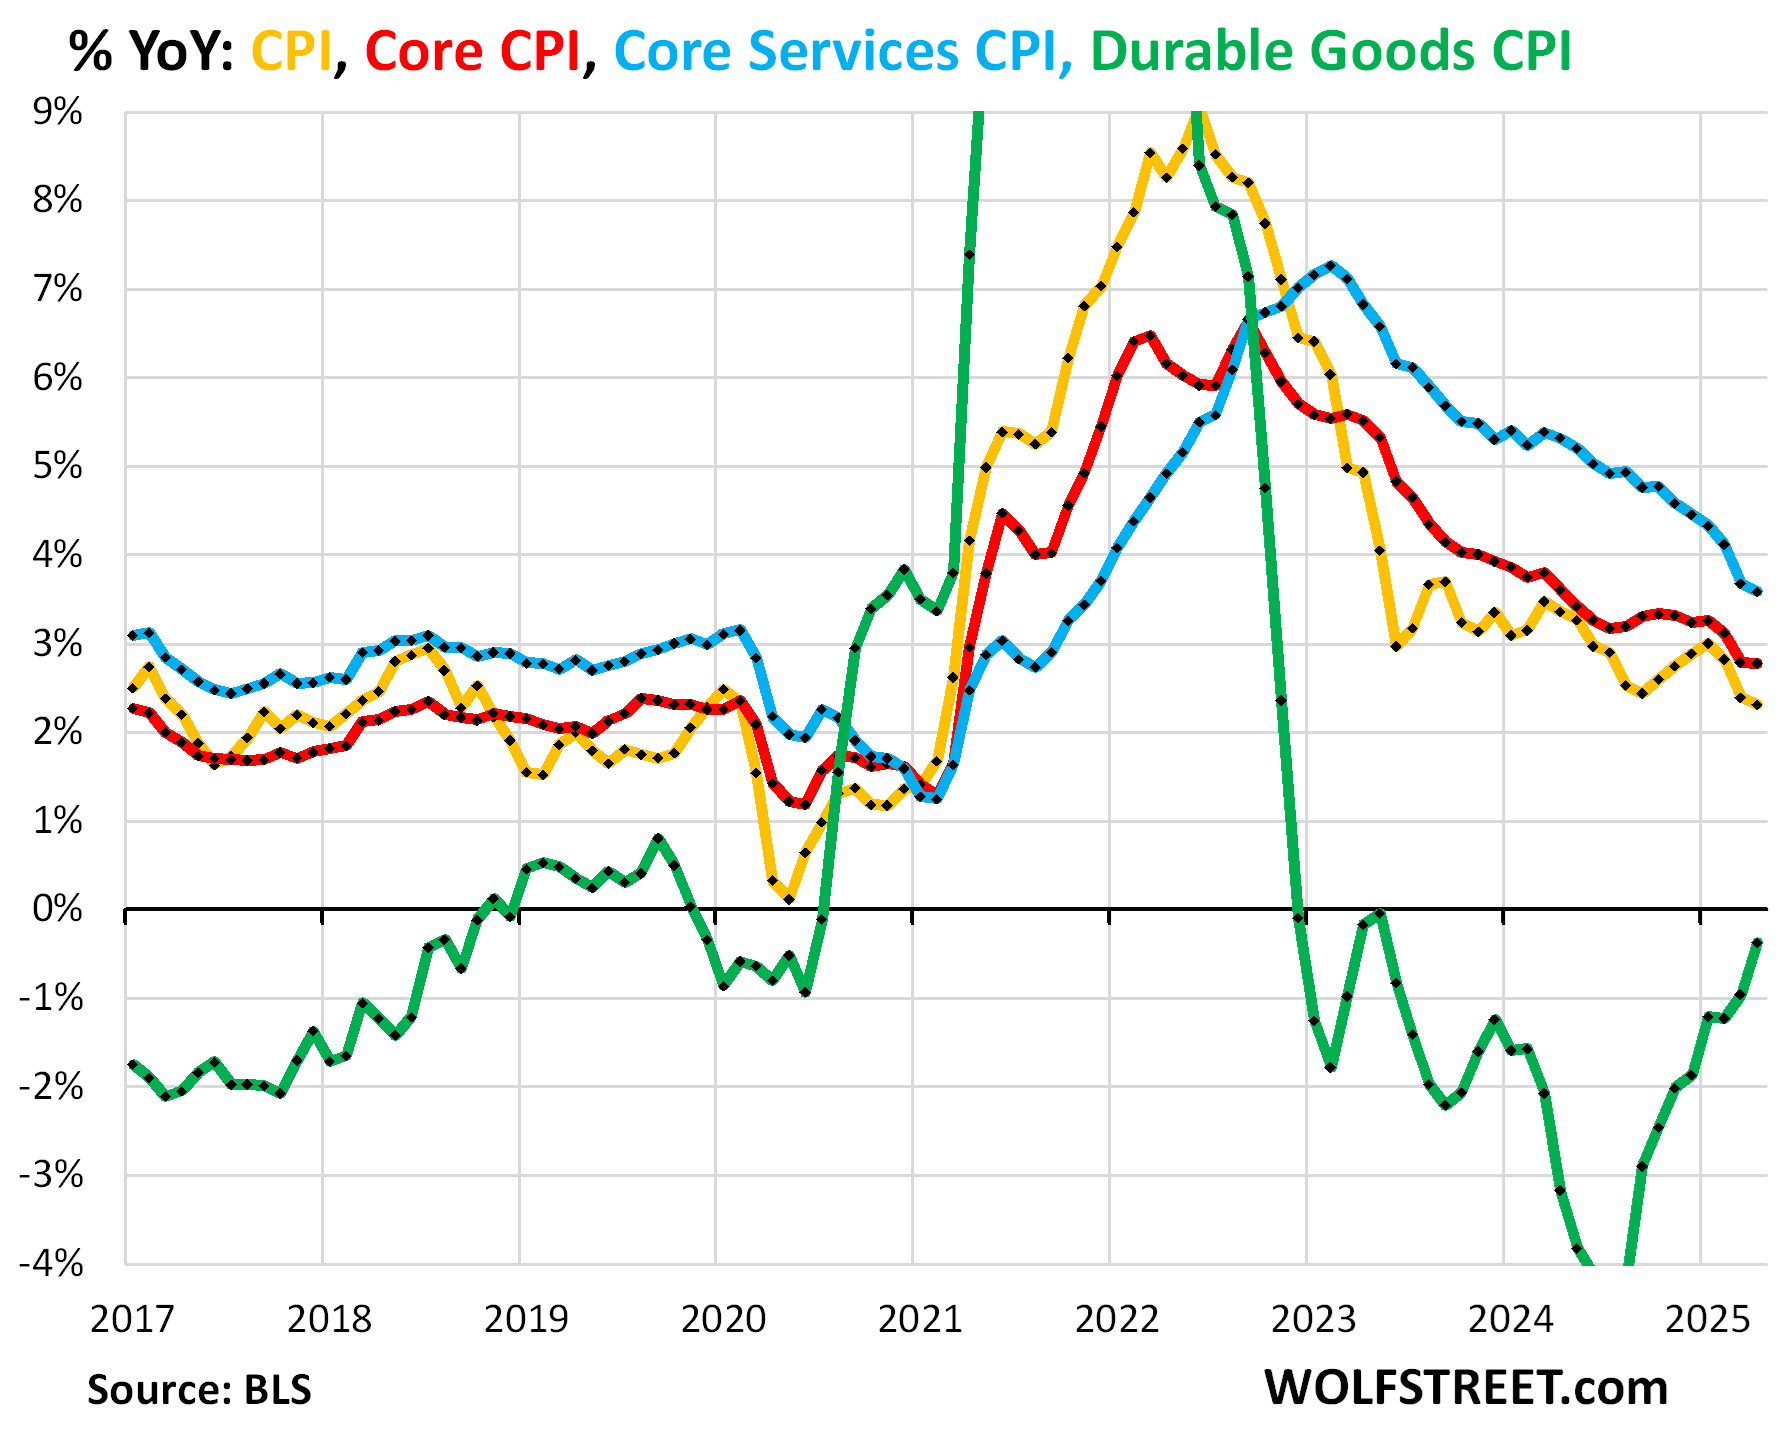
The major components of inflation, year-over-year price changes:
- Overall CPI: +2.3% (yellow), a slight deceleration from March.
- Core CPI +2.8% (red), essentially unchanged from March.
- Core Services CPI: +3.6% (blue), a slight deceleration from March.
- Durable goods CPI: -0.4% (green), continuing the trend of ever smaller year-over-year declines.
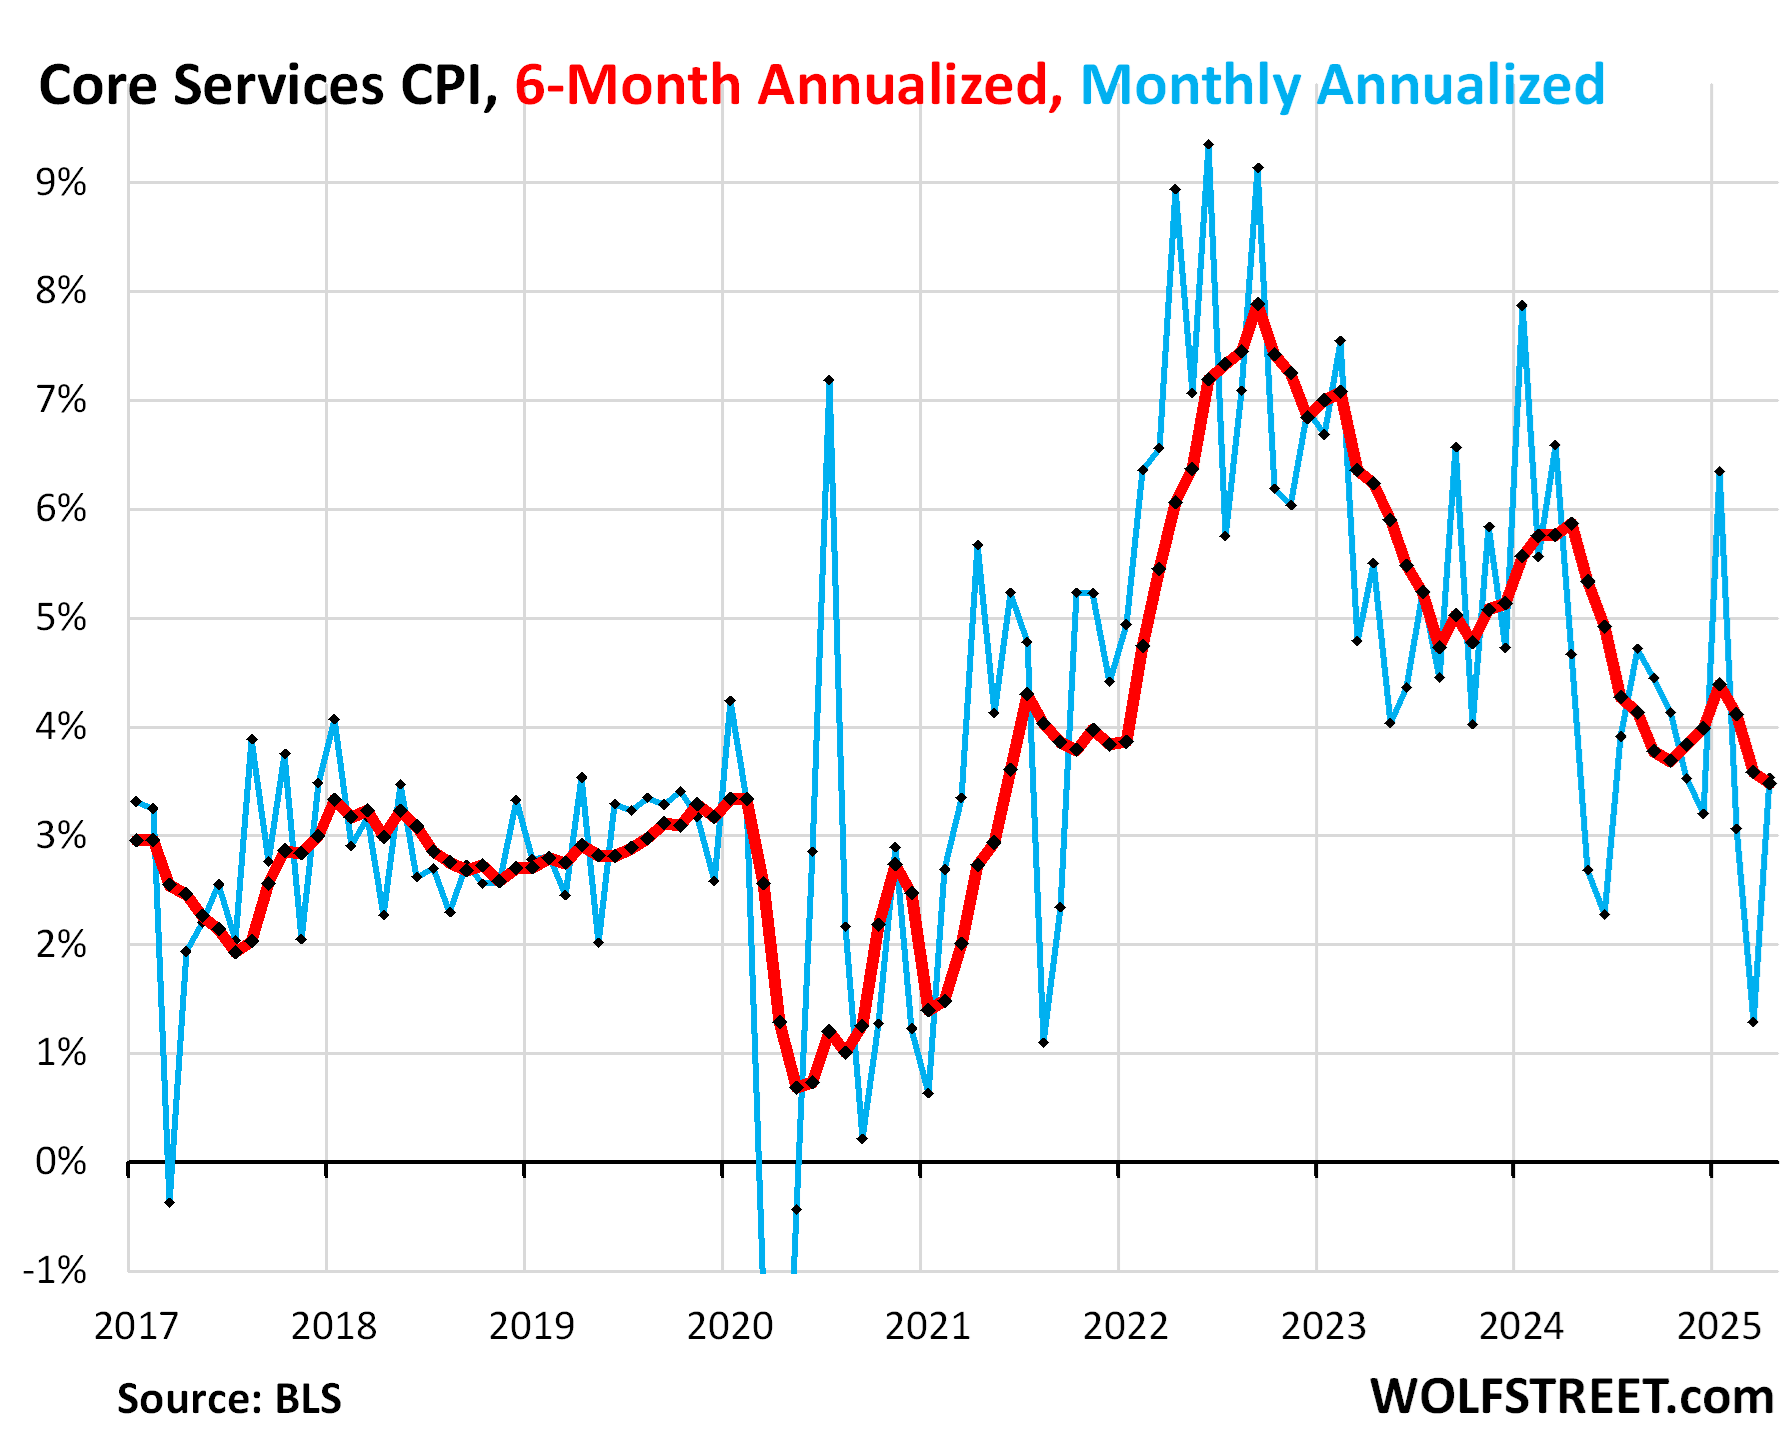
“Core services” CPI.
Core services CPI accelerated to +0.29% (+3.5% annualized) in April from March, the biggest month-to-month increase since January.
The 6-month core services CPI rose by 3.5% annualized, a slight deceleration from March (red).
Core services include all services except energy services and account for about two-thirds of the overall CPI.
Housing components of core services.
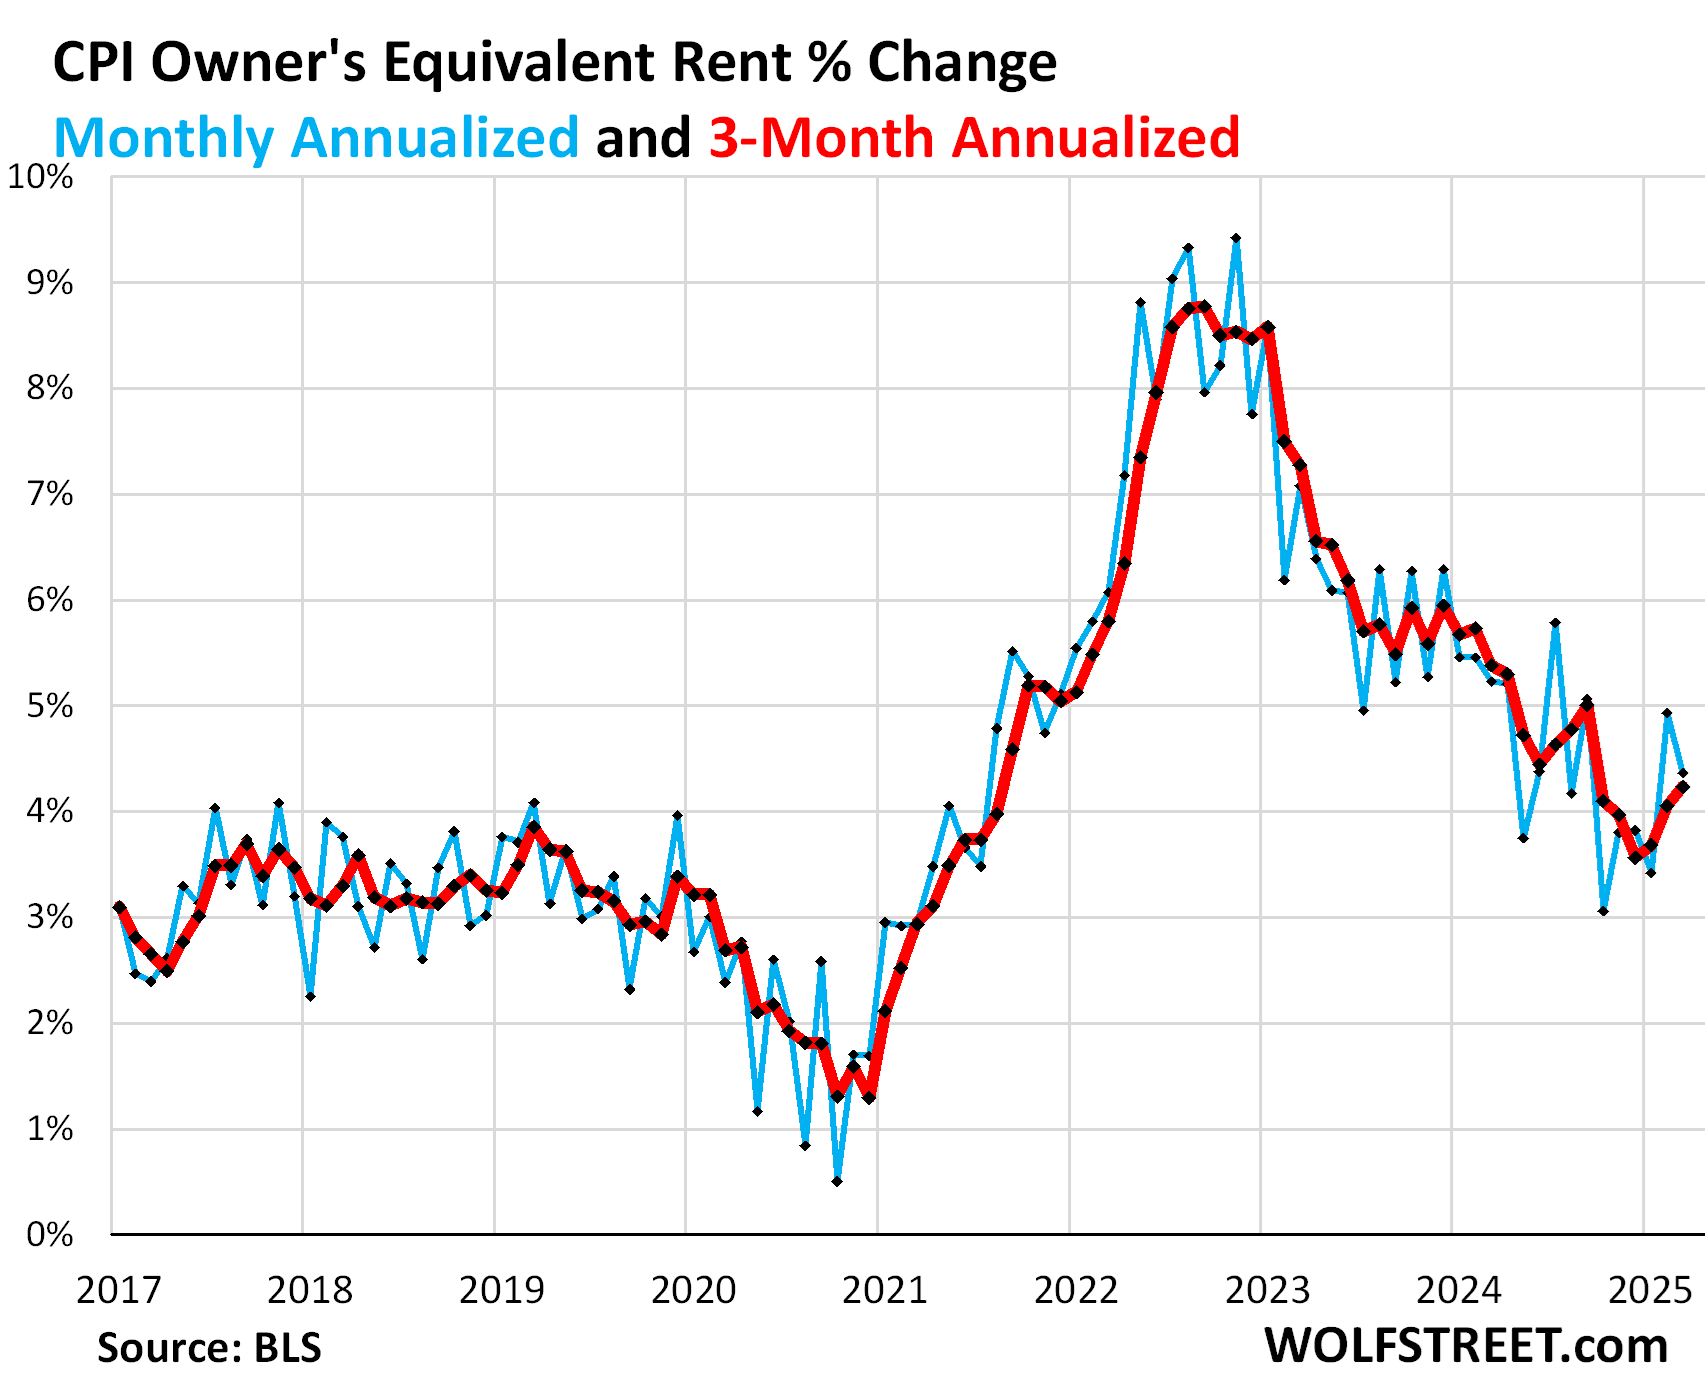
Owners’ Equivalent of Rent CPI rose by 0.36% (+4.4% annualized) in April from March, a deceleration from the jump in March (worst since October).
The three-month average accelerated further to +4.2% annualized, the worst increase since October.
OER indirectly reflects the expenses of homeownership: homeowners’ insurance, HOA fees, property taxes, and maintenance. It’s the only measure for those expenses in the CPI. It is based on what a large group of homeowners estimates their home would rent for, with the assumption that a homeowner would want to recoup their cost increases by raising the rent.
As a stand-in for homeowners’ insurance, HOA fees, property taxes, and maintenance costs, OER accounts for 26.1% of overall CPI and estimates inflation of shelter as a service for homeowners.
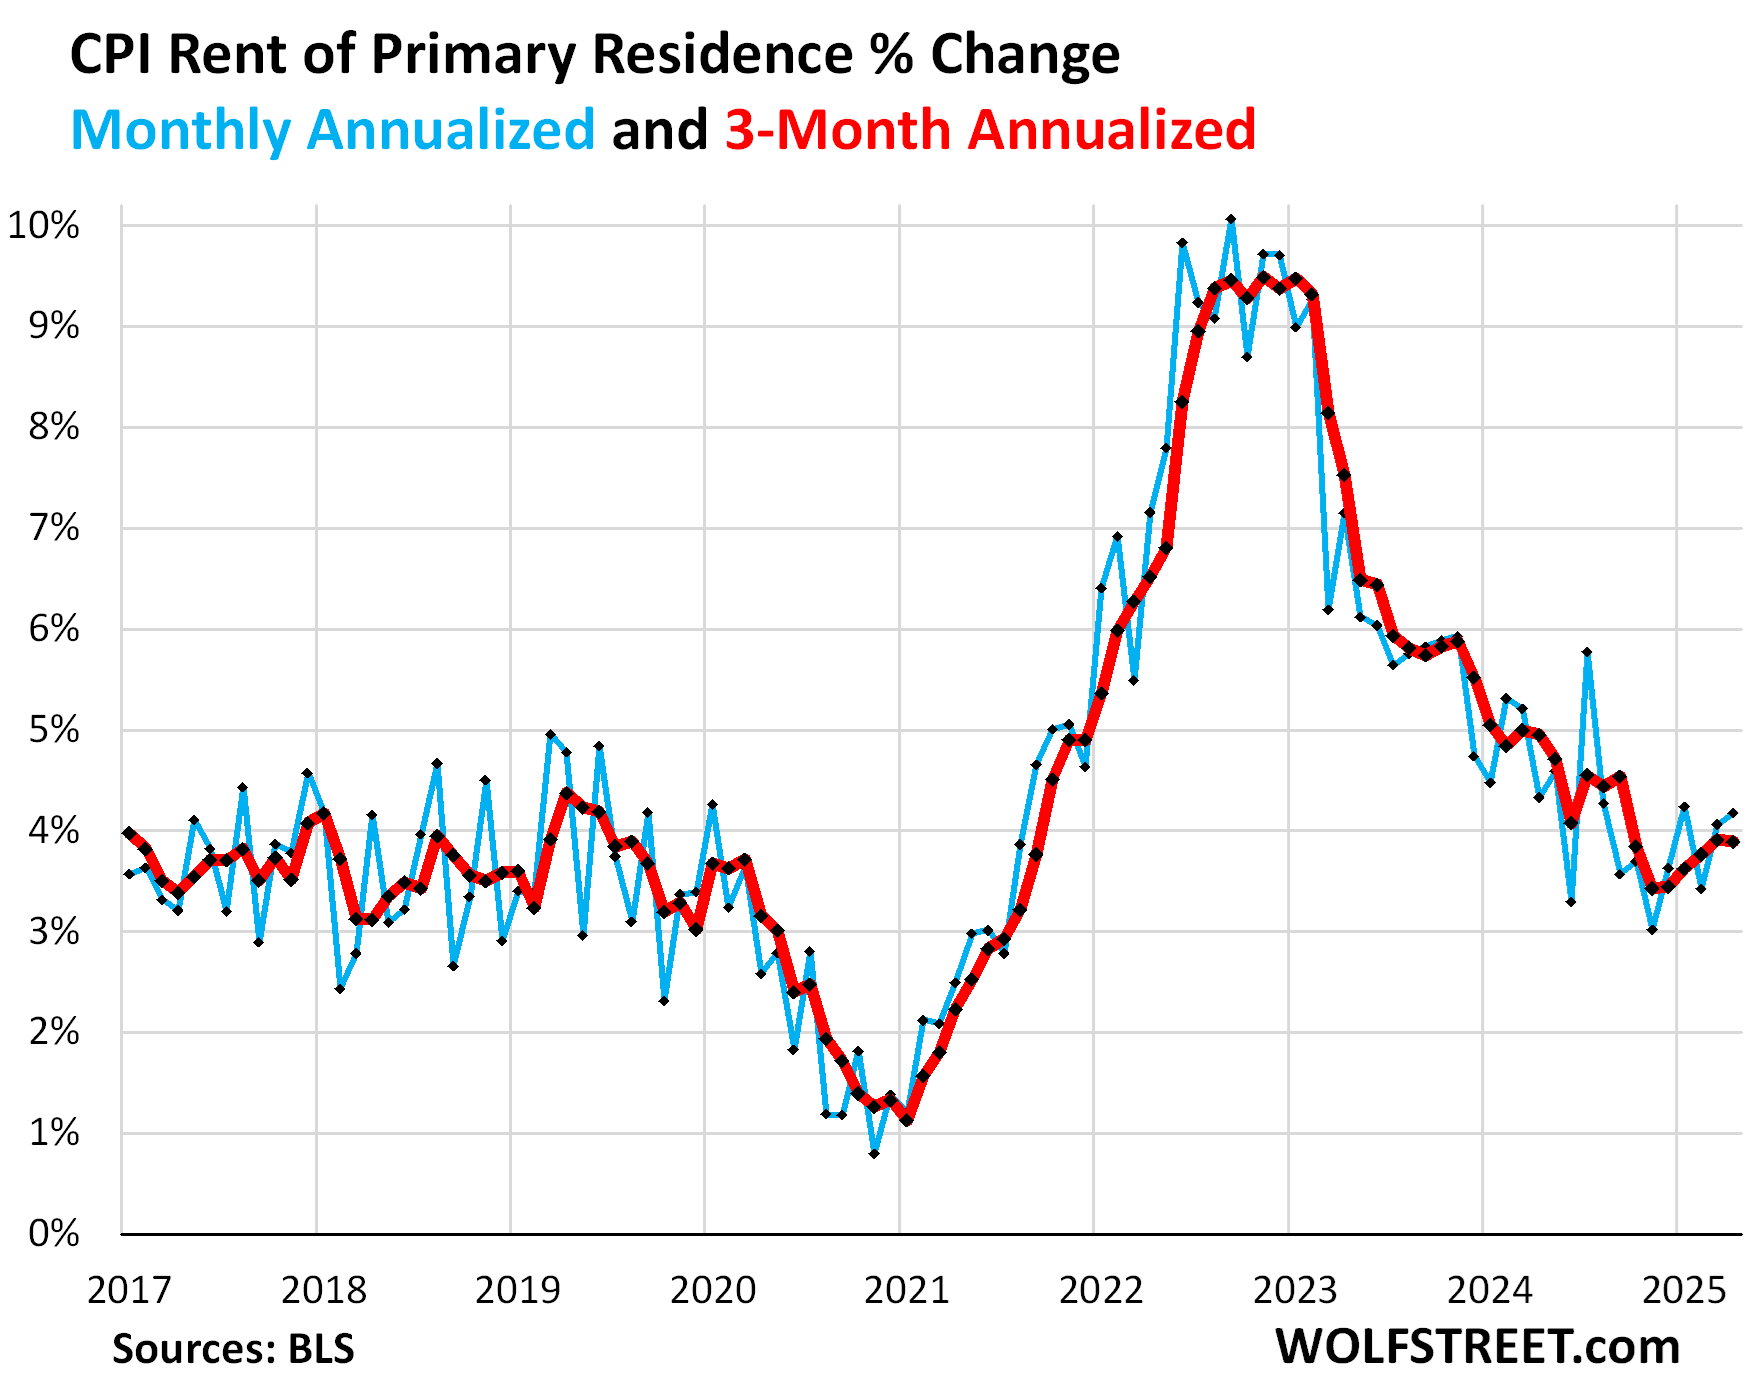
Rent of Primary Residence CPI rose by 0.34% (+4.2% annualized) in April from March, the second acceleration in a row.
The 3-month rate rose by 3.9% annualized, roughly the same rate as in March, and both were the worst increases since September.
Rent CPI accounts for 7.5% of overall CPI. It is based on rents that tenants actually paid, not on asking rents of advertised vacant units for rent. The survey follows the same large group of rental houses and apartments over time and tracks the rents that the current tenants, who come and go, pay in rent for these units.
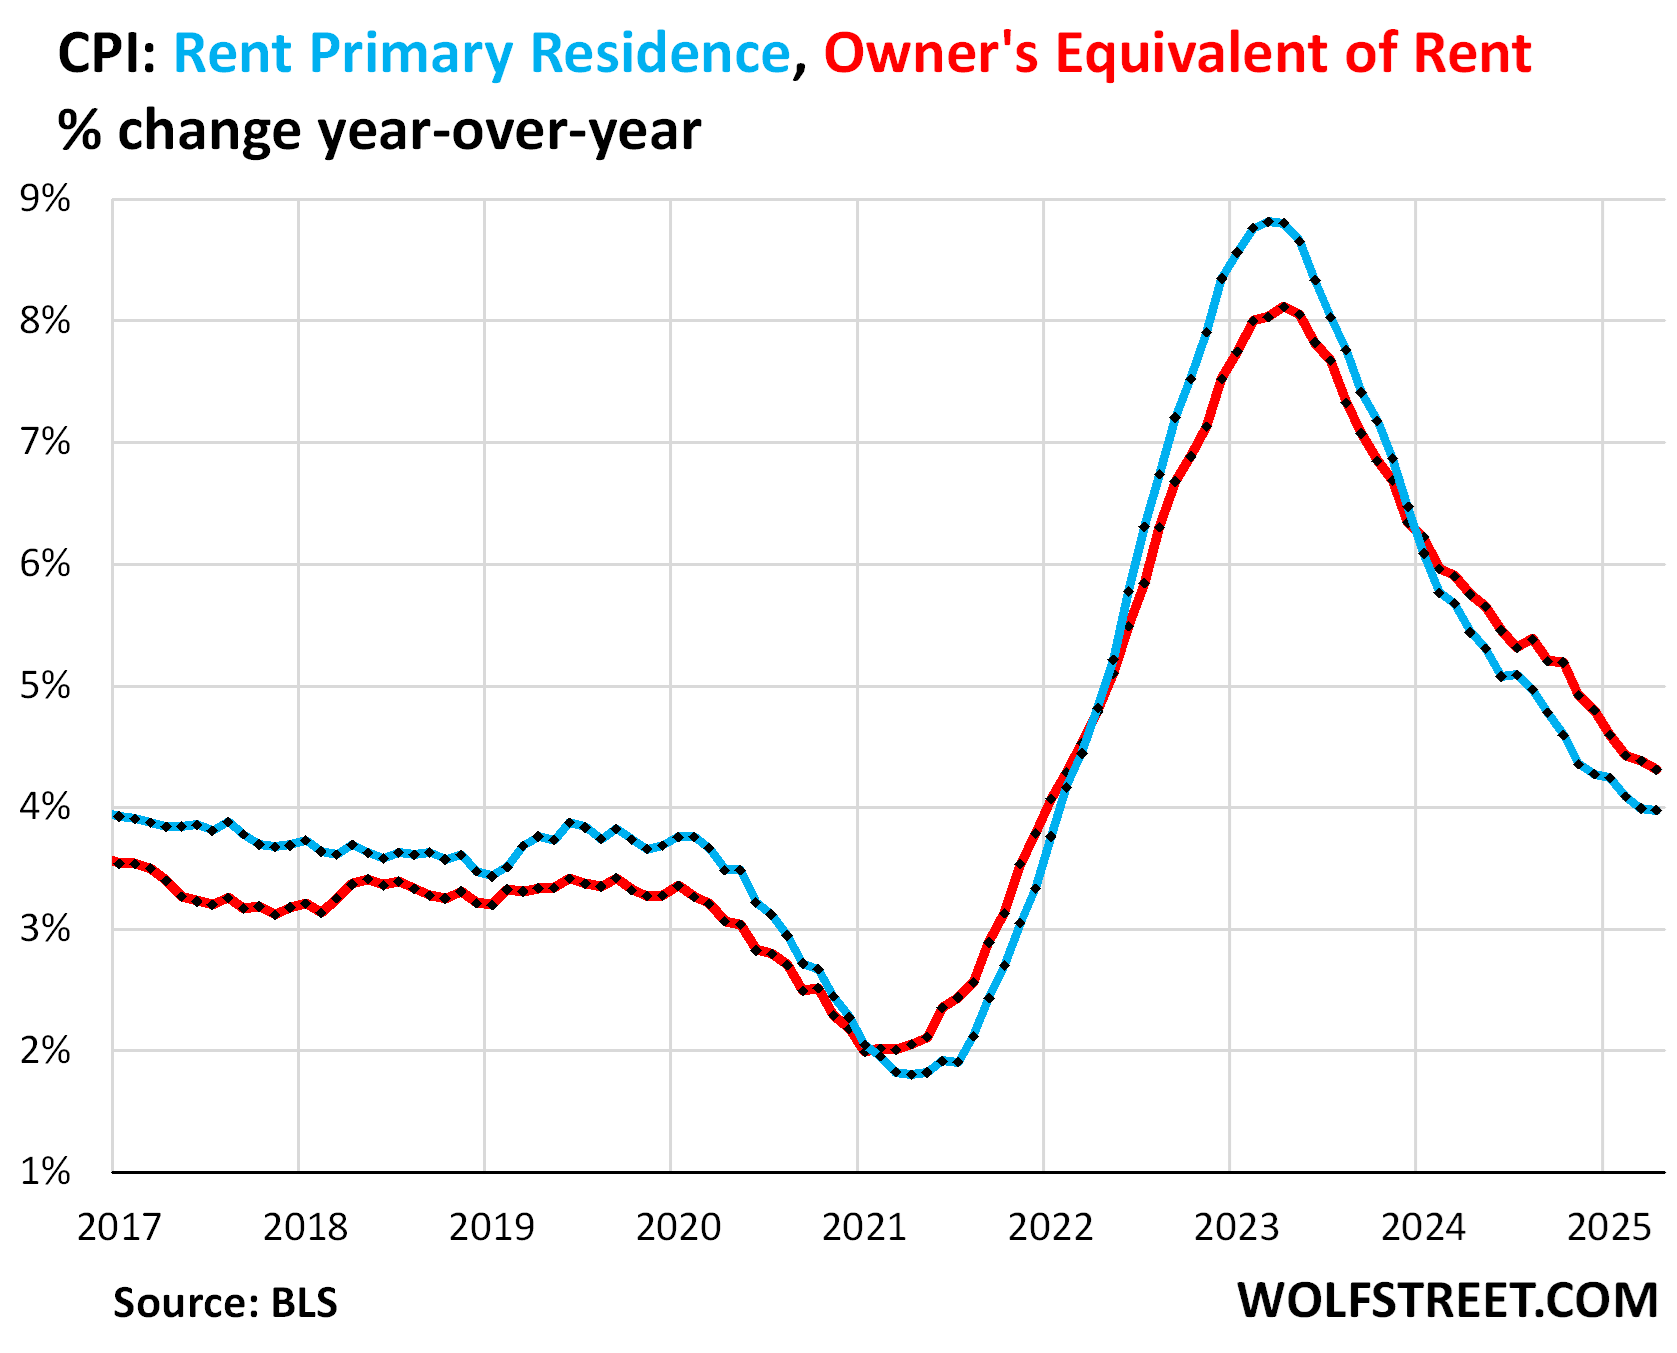
Year-over-year, rent CPI (blue in the chart below) rose by 4.0%, roughly the same as in March. OER rose by 4.3%, a slight deceleration from March (red).
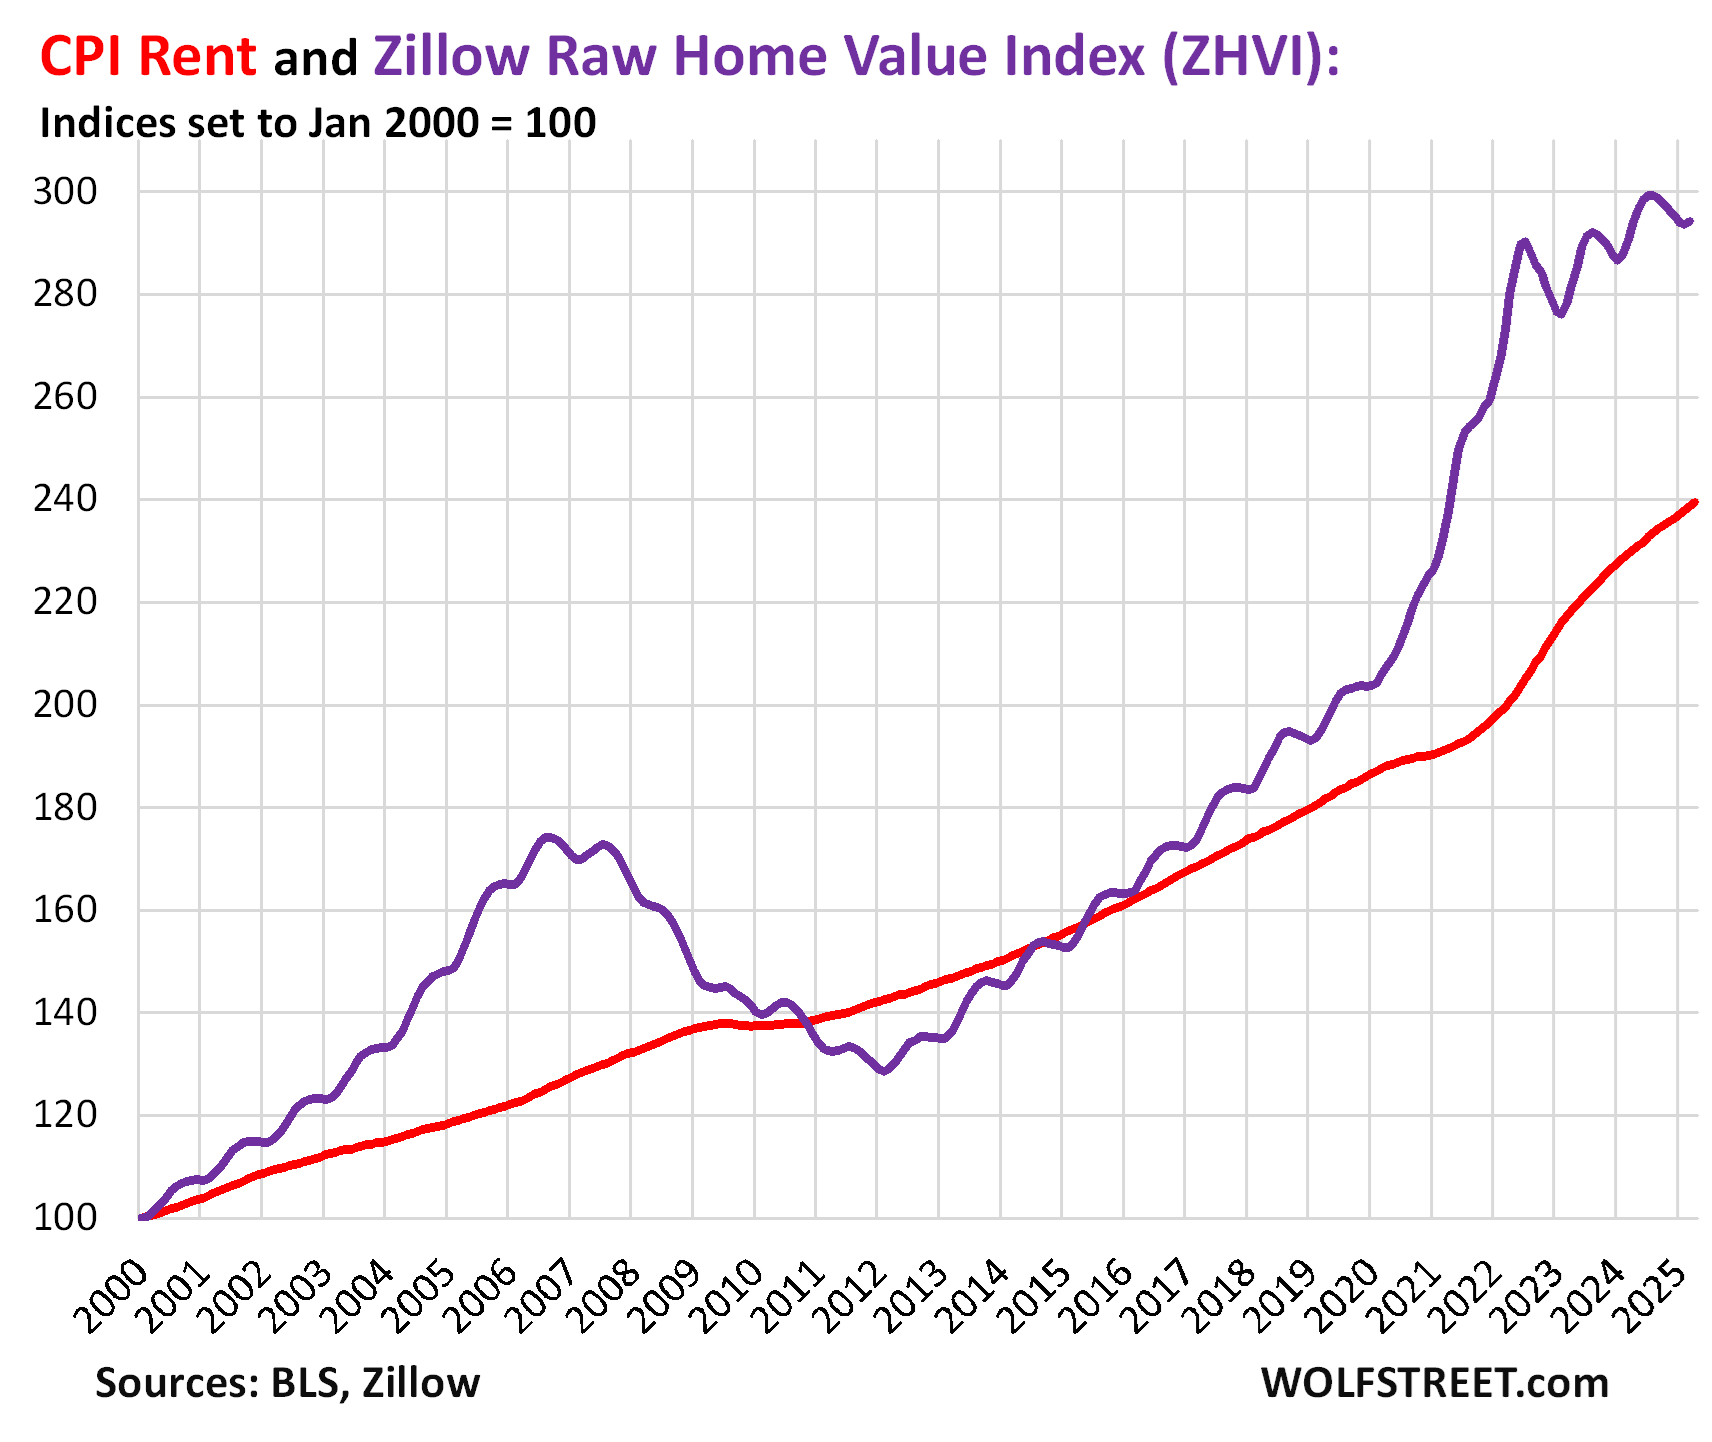
Rent inflation vs. home-price inflation: The red line in the chart below represents the CPI for Rent of Primary Residence as index value. The purple line represents Zillow’s “raw” (not seasonally adjusted) Home Value Index for the US through March. Both indexes are set to 100 for January 2000. But home-price changes vary by metro and range from steep declines to continued increases, see the 33 Most Splendid Housing Bubbles in America.
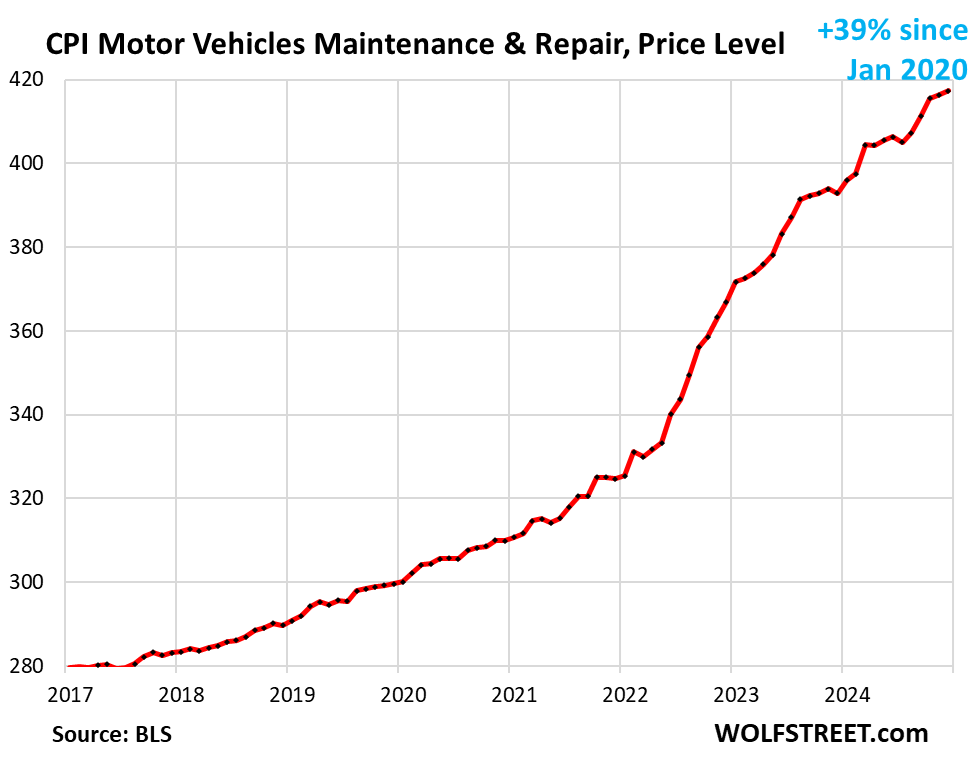
The CPI for motor-vehicle maintenance & repair jumped by 0.67% (+8.3% annualized) in April, the second-worst month-to-month increase since October, the worst having been in March.
Year-over-year, the index rose by 5.6%. Since January 2020, it has exploded by 42%. This chart shows the price level, not the year-over-year percentage change:
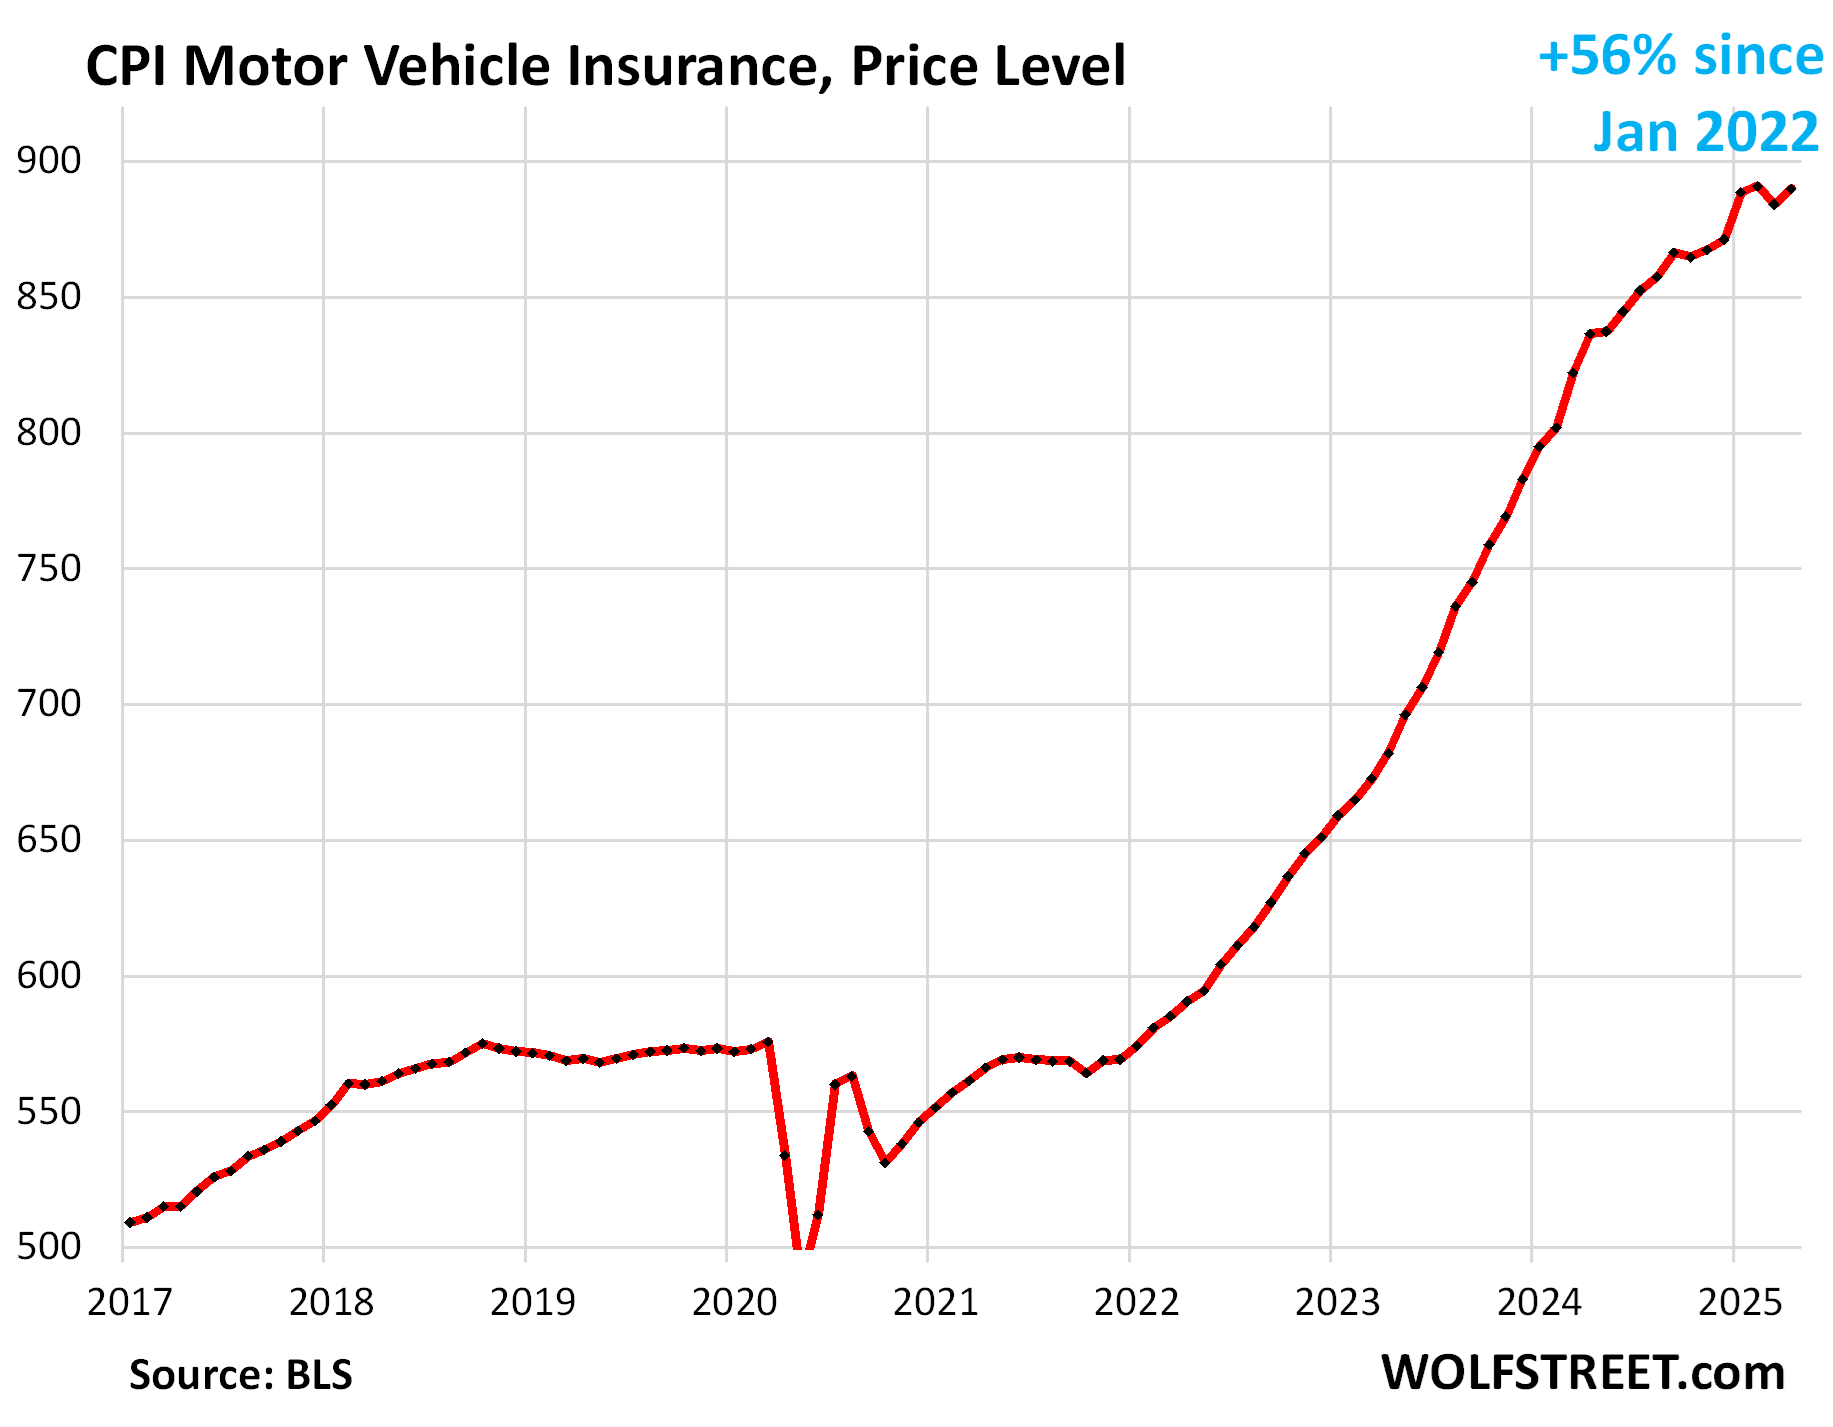
The CPI for motor vehicle insurance jumped by 0.65% (+8.0% annualized) in April from March, after a drop in February.
Year-over-year, the index accelerated to +6.4%. Since January 2022, motor vehicle insurance prices have exploded by 56%.
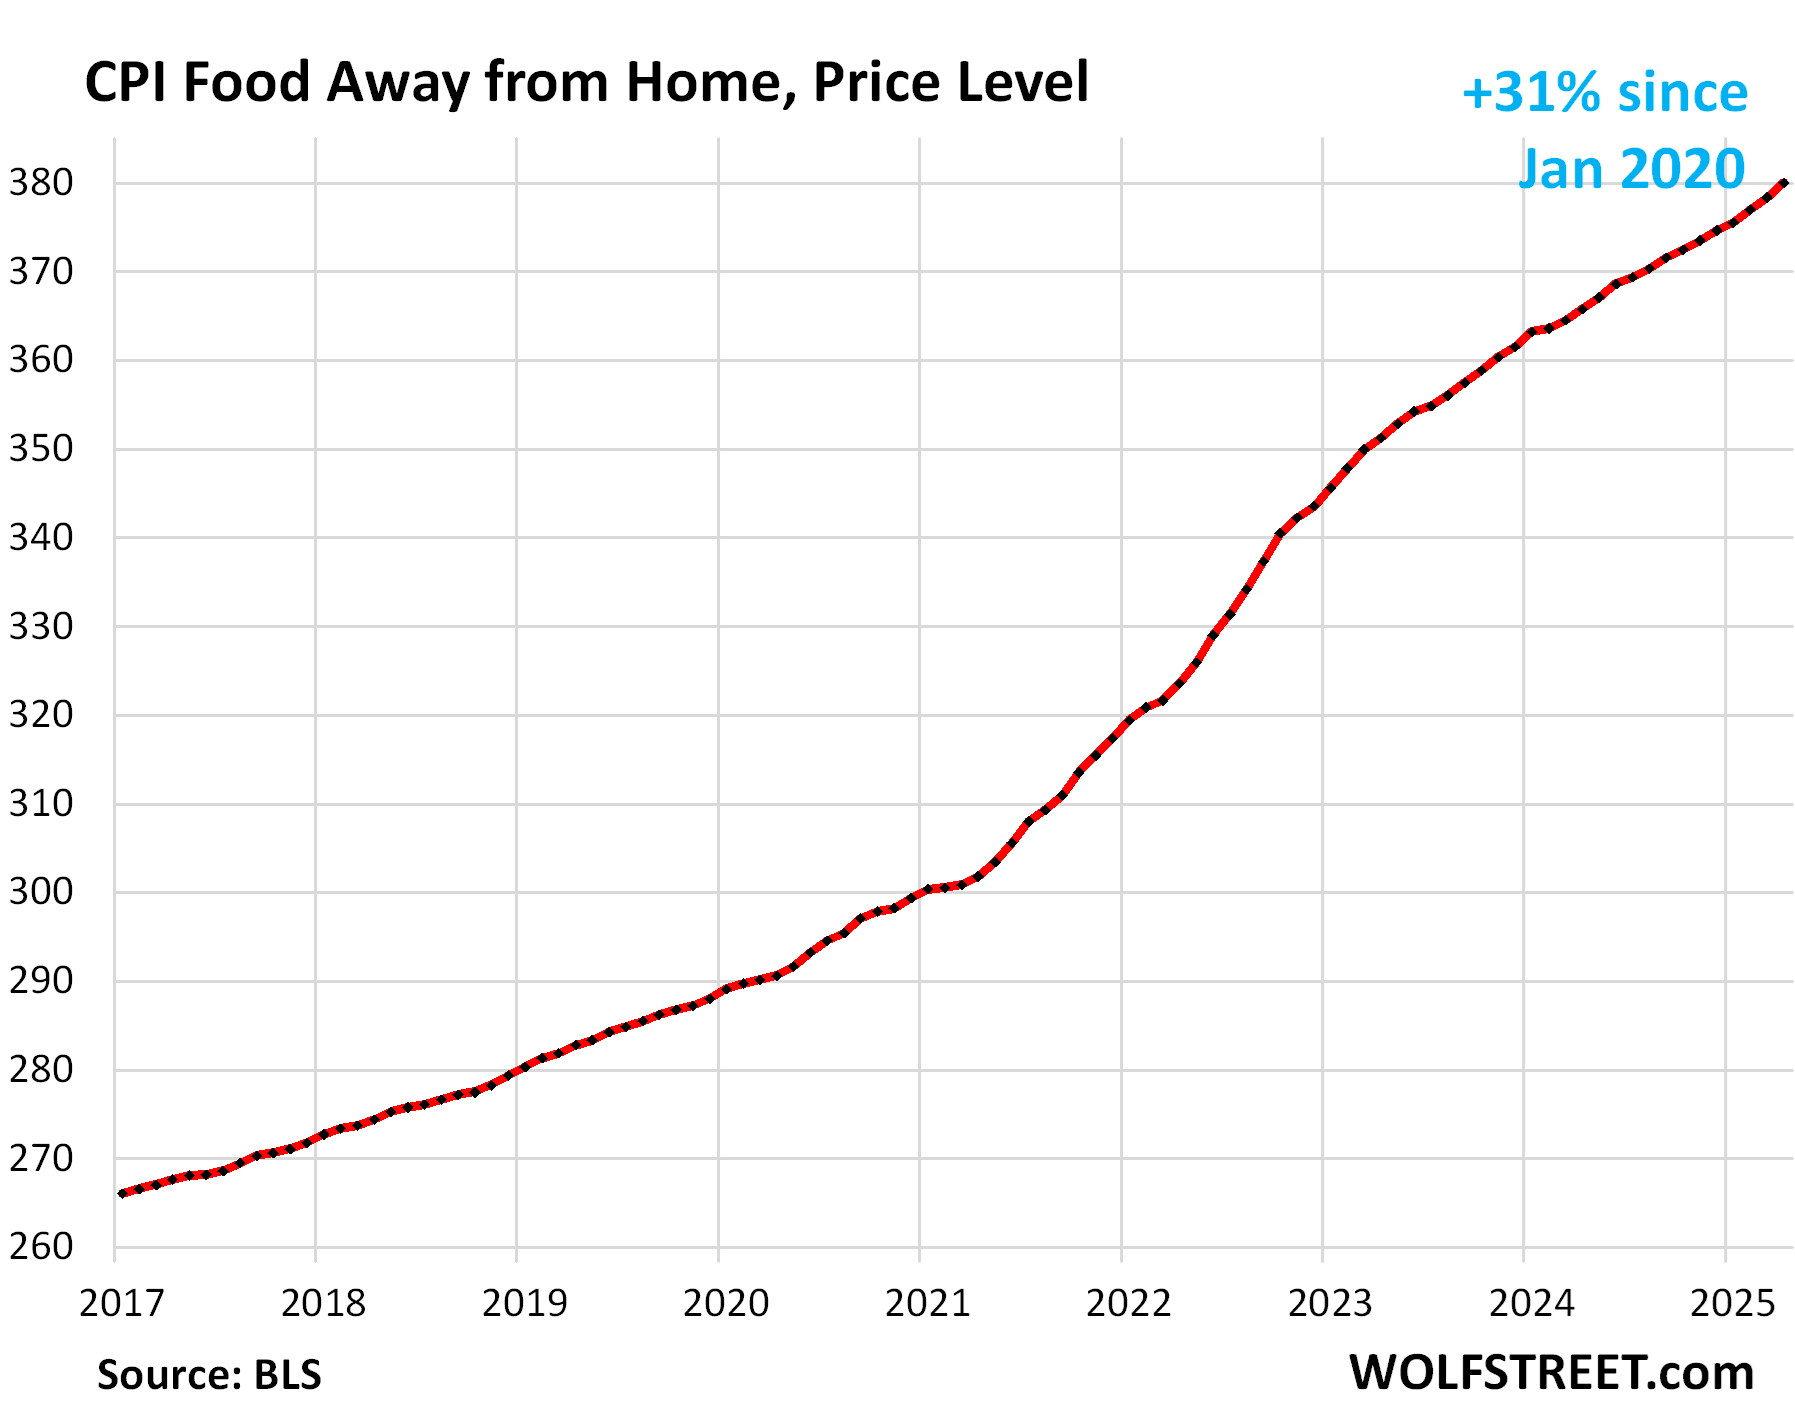
Food away from Home CPI rose by 0.44% (+5.4% annualized) in April from March, the worst increase in 16 months. Year over year, the index accelerated to +3.9%, worst increase since September.
These food services include full-service and limited-service meals and snacks served away from home in restaurants, cafeterias, at stalls, etc.
The table below shows the major categories of “core services.” Combined, they accounted for 64% of total CPI:
| Major Services ex. Energy Services | Weight in CPI | MoM | YoY |
| Core Services | 64% | 0.3% | 3.6% |
| Owner’s equivalent of rent | 26.2% | 0.4% | 4.3% |
| Rent of primary residence | 7.5% | 0.3% | 4.0% |
| Medical care services & insurance | 6.7% | 0.5% | 3.1% |
| Food services (food away from home) | 5.6% | 0.4% | 3.9% |
| Motor vehicle insurance | 2.8% | 0.6% | 6.4% |
| Education (tuition, childcare, school fees) | 2.5% | 0.1% | 3.6% |
| Admission, movies, concerts, sports events, club memberships | 2.1% | -0.2% | 5.1% |
| Other personal services (dry-cleaning, haircuts, legal services…) | 1.6% | 0.2% | 3.9% |
| Public transportation (airline fares, etc.) | 1.5% | -1.8% | -5.6% |
| Telephone & wireless services | 1.5% | 0.0% | 0.0% |
| Lodging away from home, incl Hotels, motels | 1.3% | -0.1% | -1.4% |
| Water, sewer, trash collection services | 1.1% | 0.3% | 4.9% |
| Motor vehicle maintenance & repair | 1.0% | 0.7% | 5.6% |
| Internet services | 0.9% | -1.5% | -2.9% |
| Video and audio services, cable, streaming | 0.8% | -0.6% | 0.6% |
| Pet services, including veterinary | 0.5% | 0.0% | 4.6% |
| Tenants’ & Household insurance | 0.4% | -0.3% | 2.6% |
| Car and truck rental | 0.1% | 4.3% | -2.1% |
| Postage & delivery services | 0.1% | 0.4% | 2.9% |
Prices of Goods.
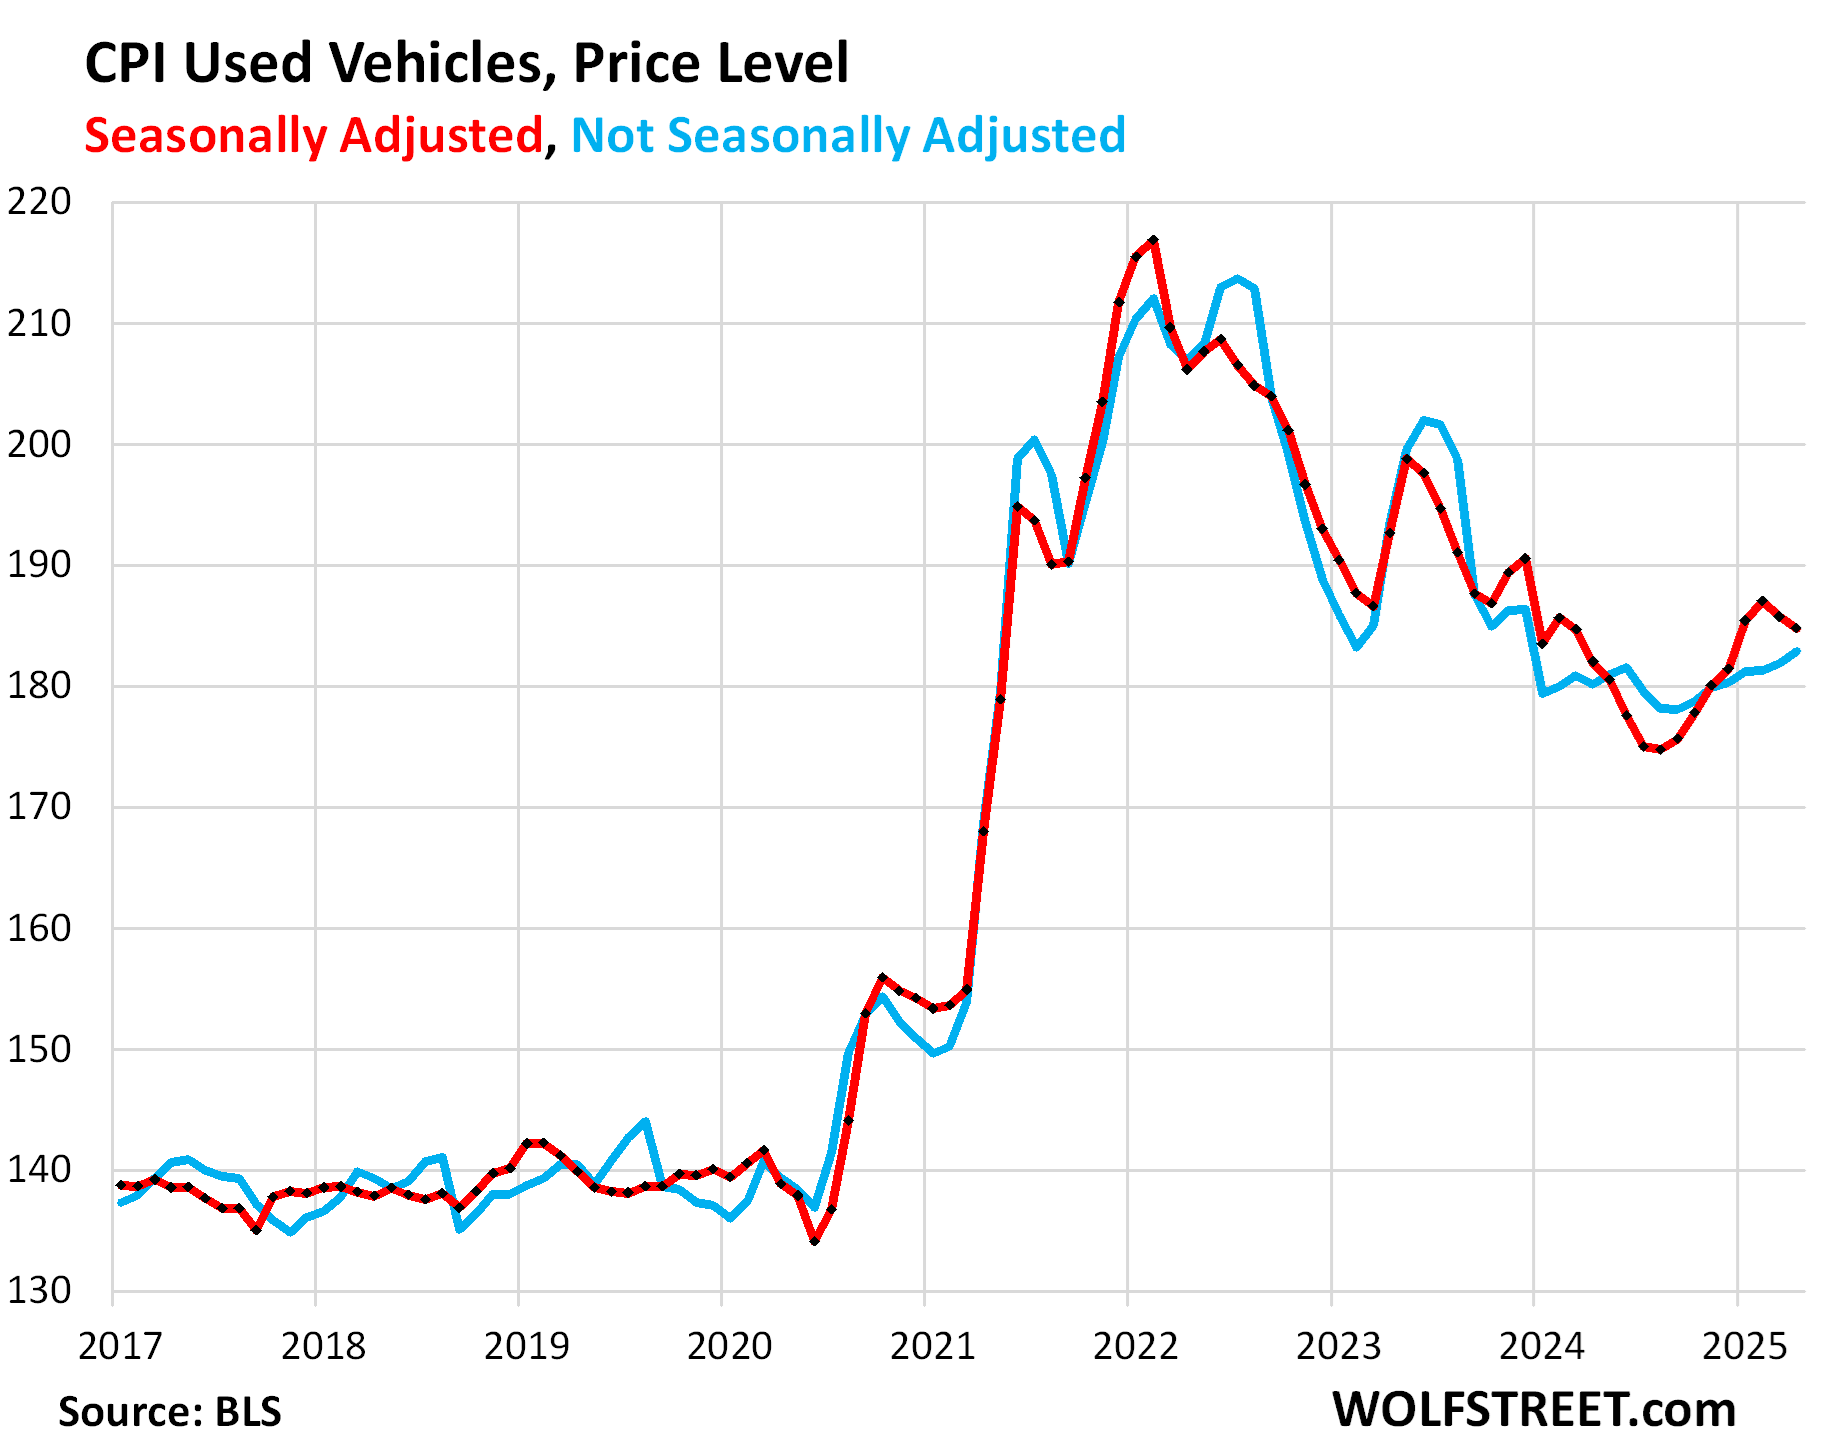
Used vehicle CPI: Not seasonally adjusted, prices continued to rise for the seventh month in a row, but in April, the increase of 0.51% (+6.1% annualized) was smaller than normally in April, and so on a seasonally adjusted basis, the index dipped by 0.53% (-6.2% annualized), the second month in a row of declines.
Year-over-year, used vehicle prices rose by 1.5%, the fourth month in a row of year-over-year increases.
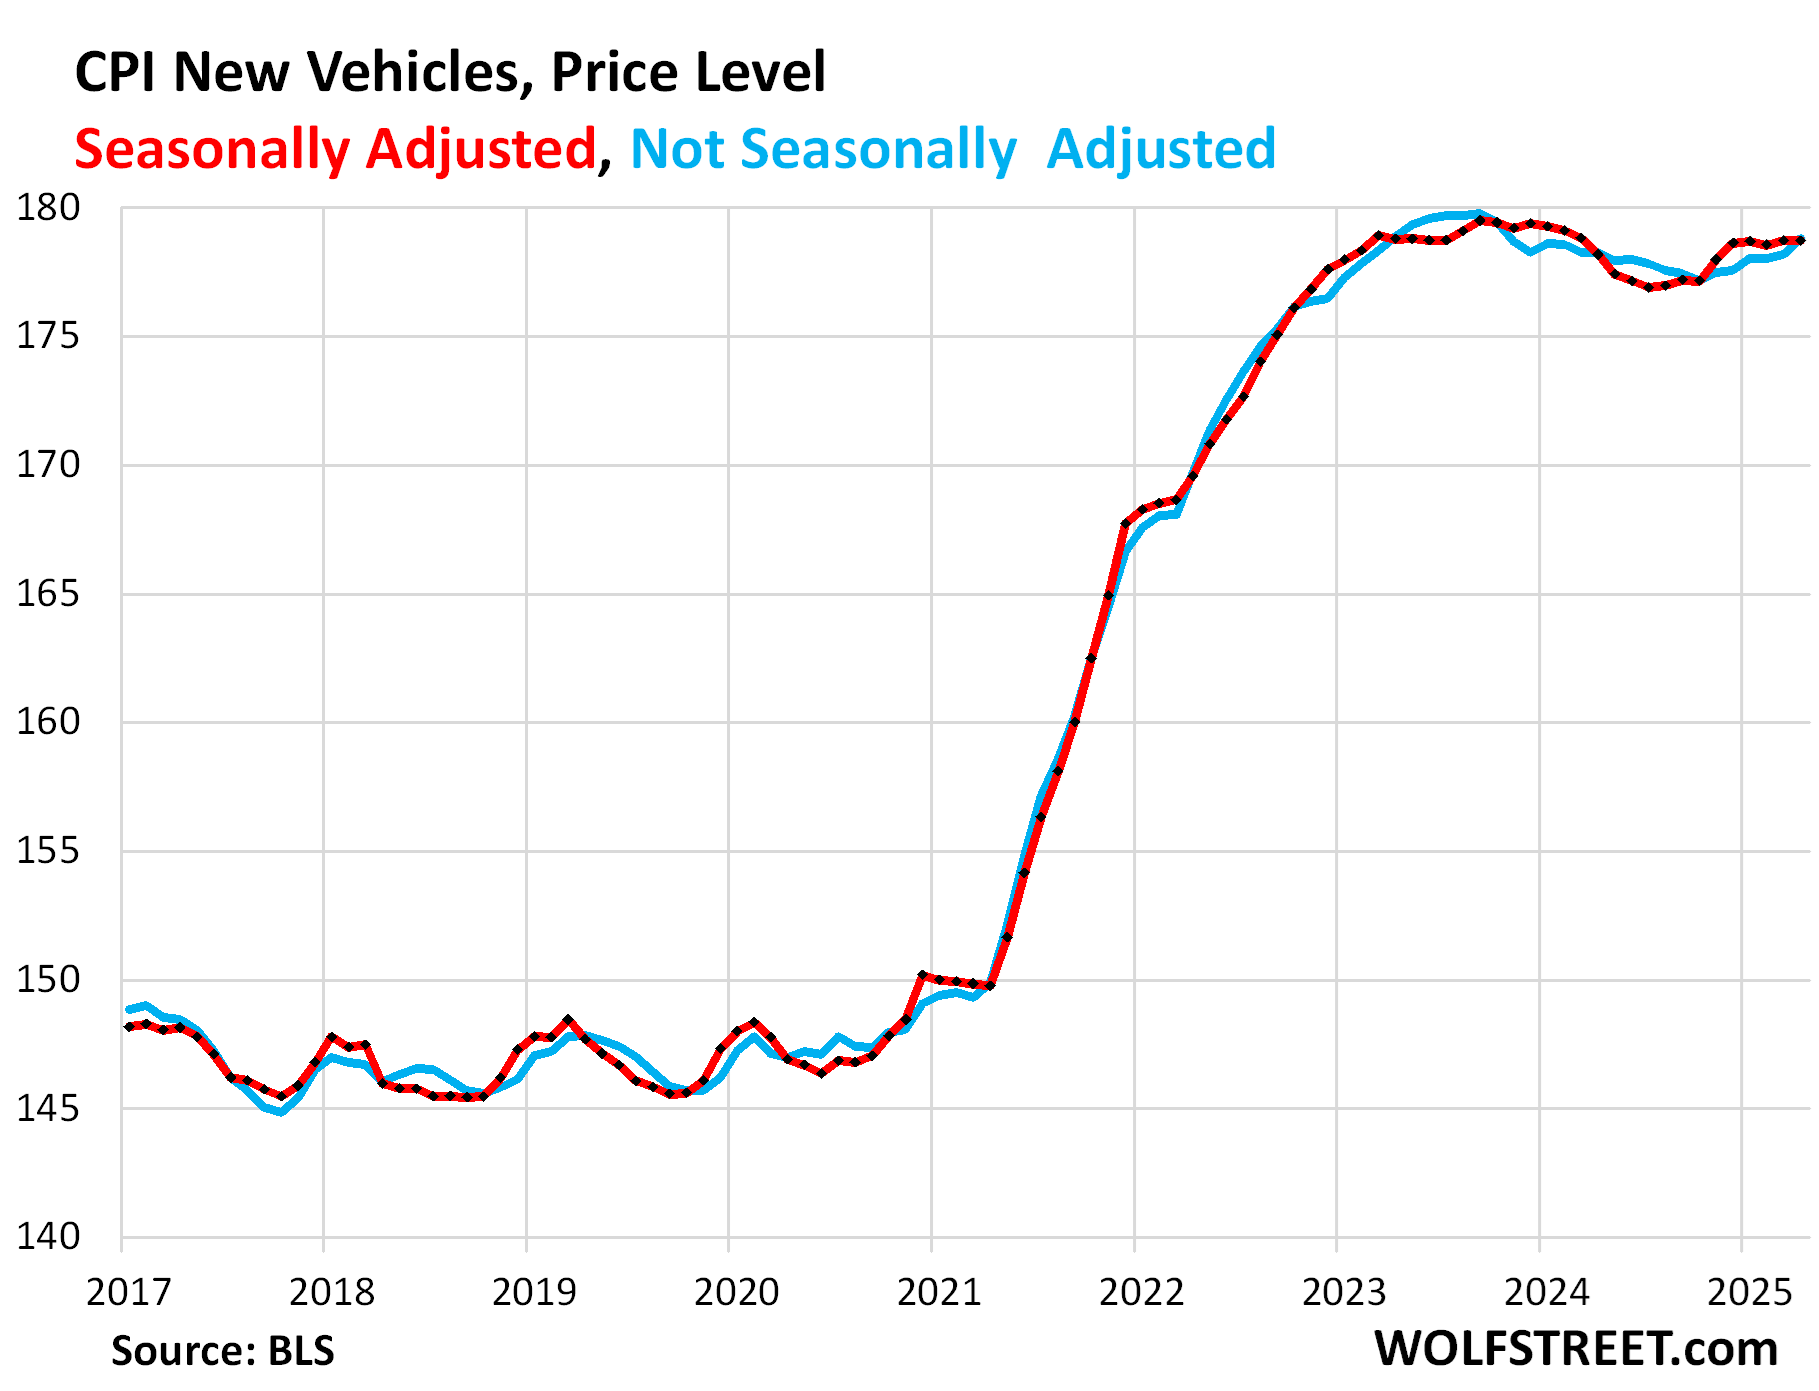
New vehicles CPI, not seasonally adjusted, rose month-to-month by 0.35%, but seasonally adjusted was essentially unchanged.
Year-over-year, the index edged up by 0.3%.
Unlike used vehicle prices, new vehicle prices have been sticky on the way down since the end of the spike in 2022.
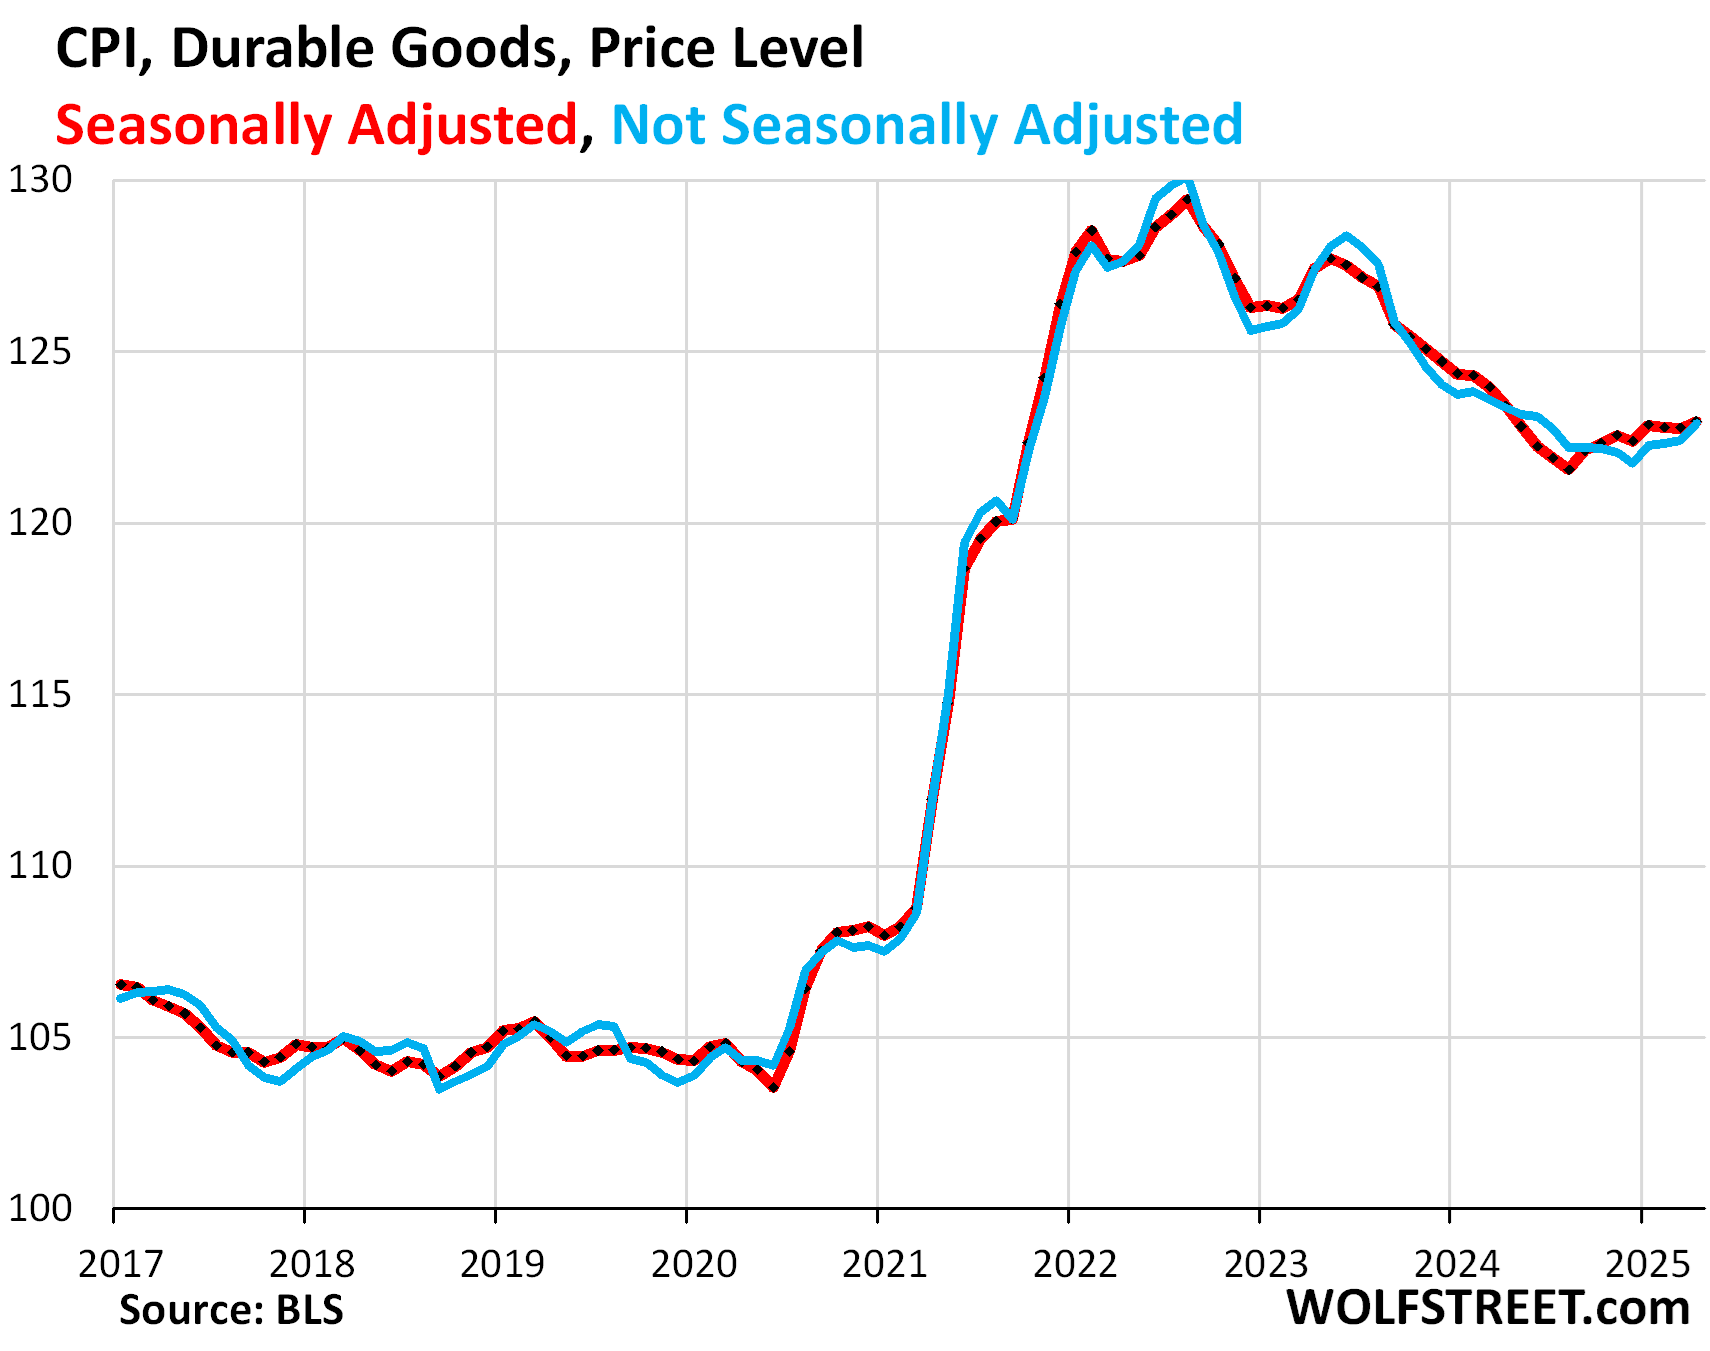
Durable Goods overall – dominated by new and used vehicles – experienced a huge spike of inflation from mid-2020 through mid-2022. And then prices declined (deflation) across the board through August 2024. In September 2024, prices began to meander higher, and April was the latest installment in that series. There is so far no sign of tariffs getting passed through to consumers. But the explosion of prices in 2021 and 2022 was historic:
| Major durable goods categories | MoM | YoY |
| Durable goods overall | 0.2% | -0.4% |
| New vehicles | 0.0% | 0.3% |
| Used vehicles | -0.5% | 1.5% |
| Household furnishings (furniture, appliances, floor coverings, tools) | 0.2% | 0.3% |
| Sporting goods (bicycles, equipment, etc.) | 0.6% | -5.2% |
| Information technology (computers, smartphones, etc.) | 0.3% | -6.8% |
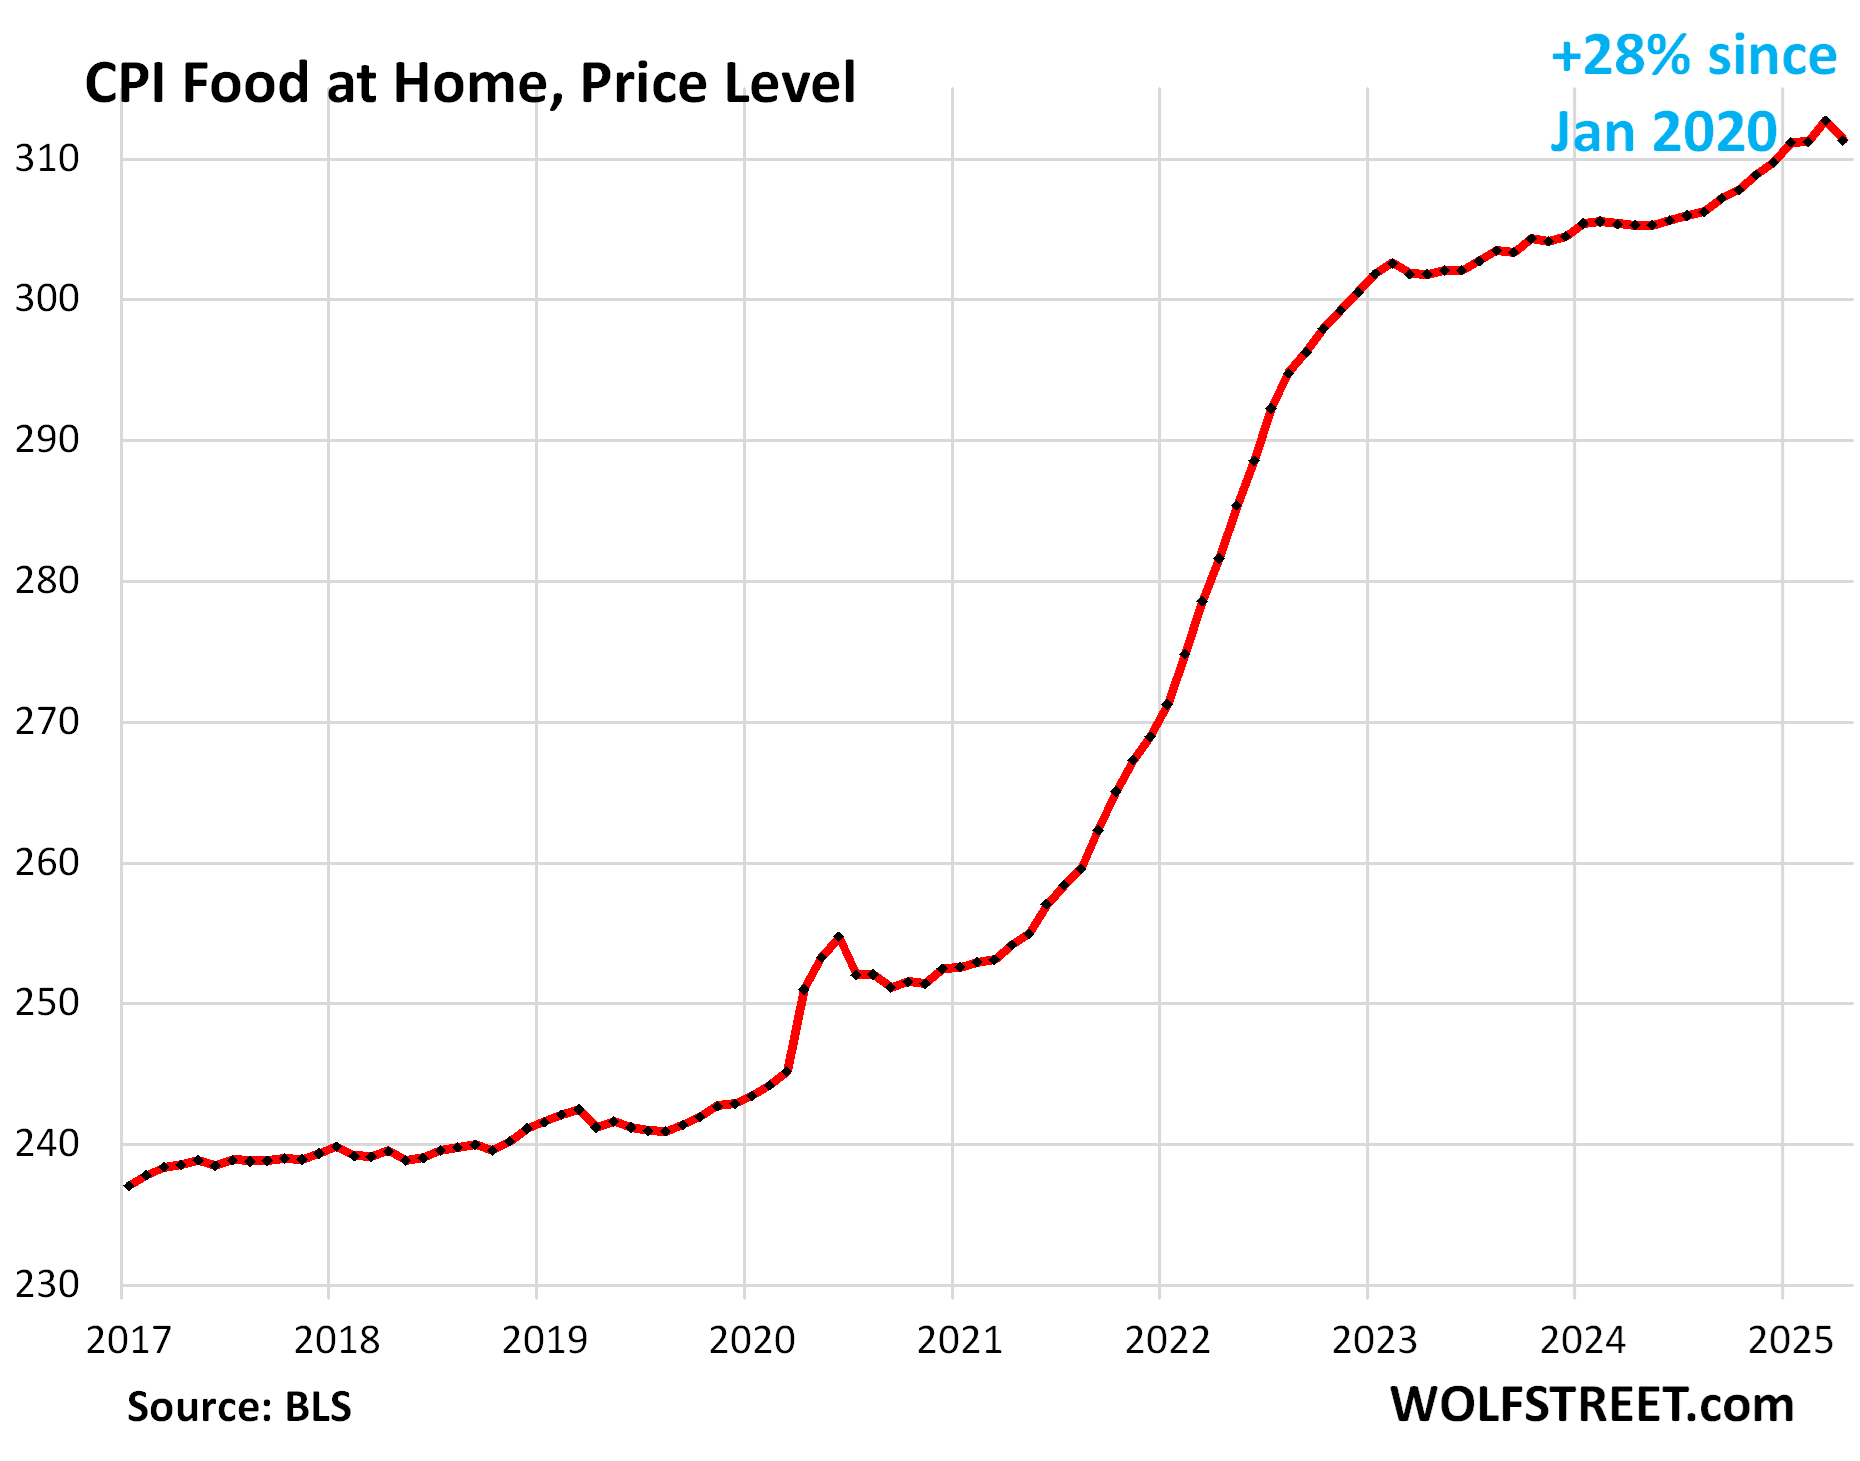
Food Inflation. The CPI for “Food at home” fell by 0.44% month-to-month (-5.2% annualized), driven by plunging egg prices, after the jump in March (worst since October 2022).
Year-over-year, the index rose by 2.0%. Since January 2020, food prices have surged by 28%. This is food purchased at stores and markets to be eaten off premises.
| MoM | YoY | |
| Food at home | -0.4% | 2.0% |
| Cereals, breads, bakery products | -0.5% | 0.0% |
| Beef and veal | 0.1% | 8.5% |
| Pork | -1.4% | 1.3% |
| Poultry | 0.2% | 2.4% |
| Fish and seafood | 0.7% | 0.7% |
| Eggs | -12.7% | 49.3% |
| Dairy and related products | -0.2% | 1.6% |
| Fresh fruits | -0.4% | -0.9% |
| Fresh vegetables | -0.1% | -2.9% |
| Juices and nonalcoholic drinks | 0.2% | 1.8% |
| Coffee, tea, etc. | 2.0% | 6.6% |
| Fats and oils | -1.5% | -1.6% |
| Baby food & formula | 0.9% | 1.2% |
| Alcoholic beverages at home | -0.1% | 0.8% |
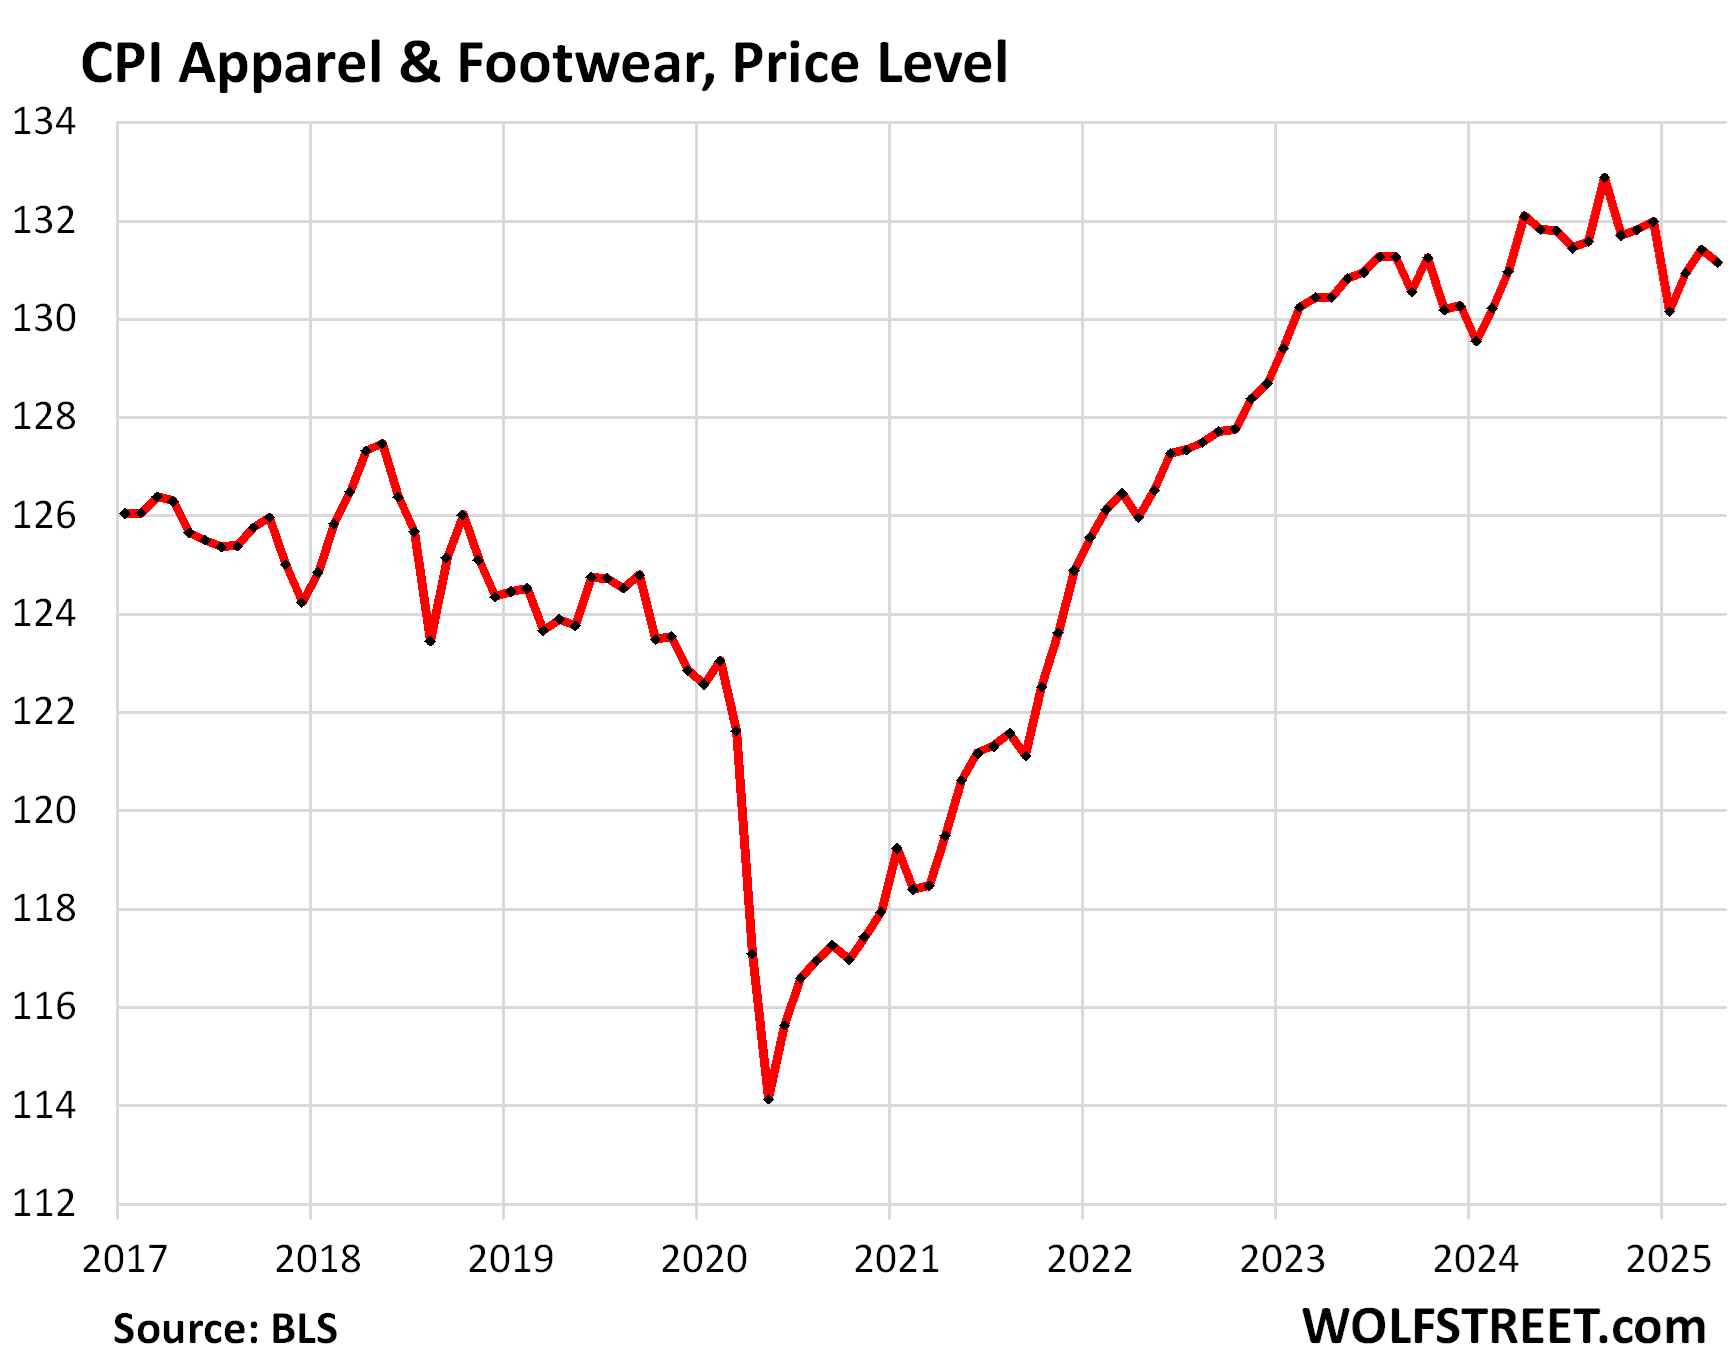
Apparel and footwear. The CPI for apparel and footwear, despite the manipulative fearmongering in the media about tariffs, fell by 0.2% month-to-month and was down by 0.7% year-over-year.
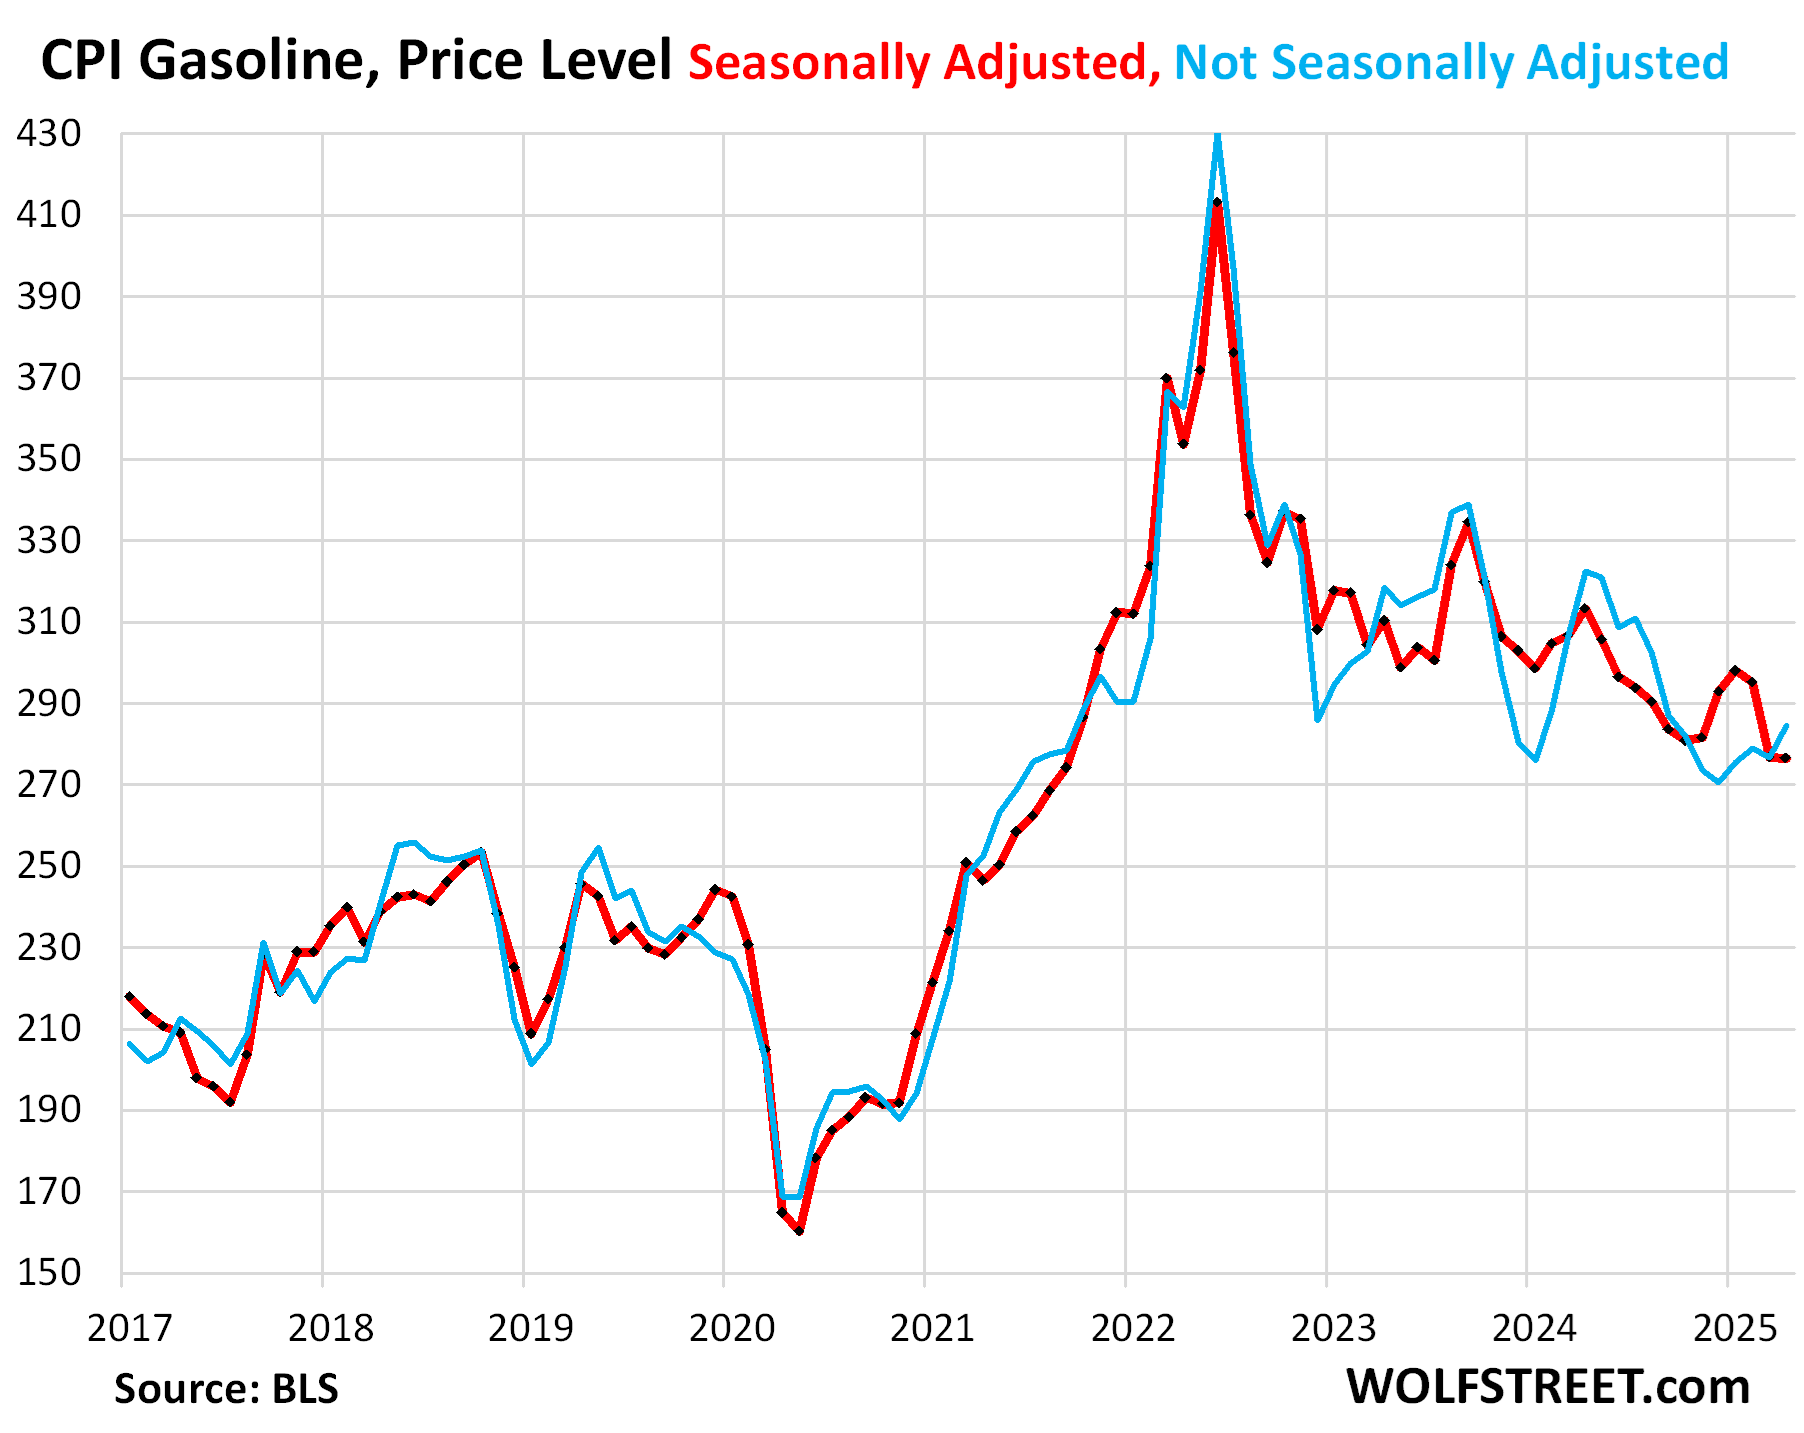
Energy.
The CPI for gasoline, not seasonally adjusted, rose in April from March, but it normally rises about that much in April, and so on a seasonally adjusted basis, the index was roughly unchanged and remained at the lowest price level since September 2021.
Year-over-year, the gasoline index plunged by 11.8%. The driver has been the drop in oil prices. Gasoline makes up about half of the overall energy CPI.
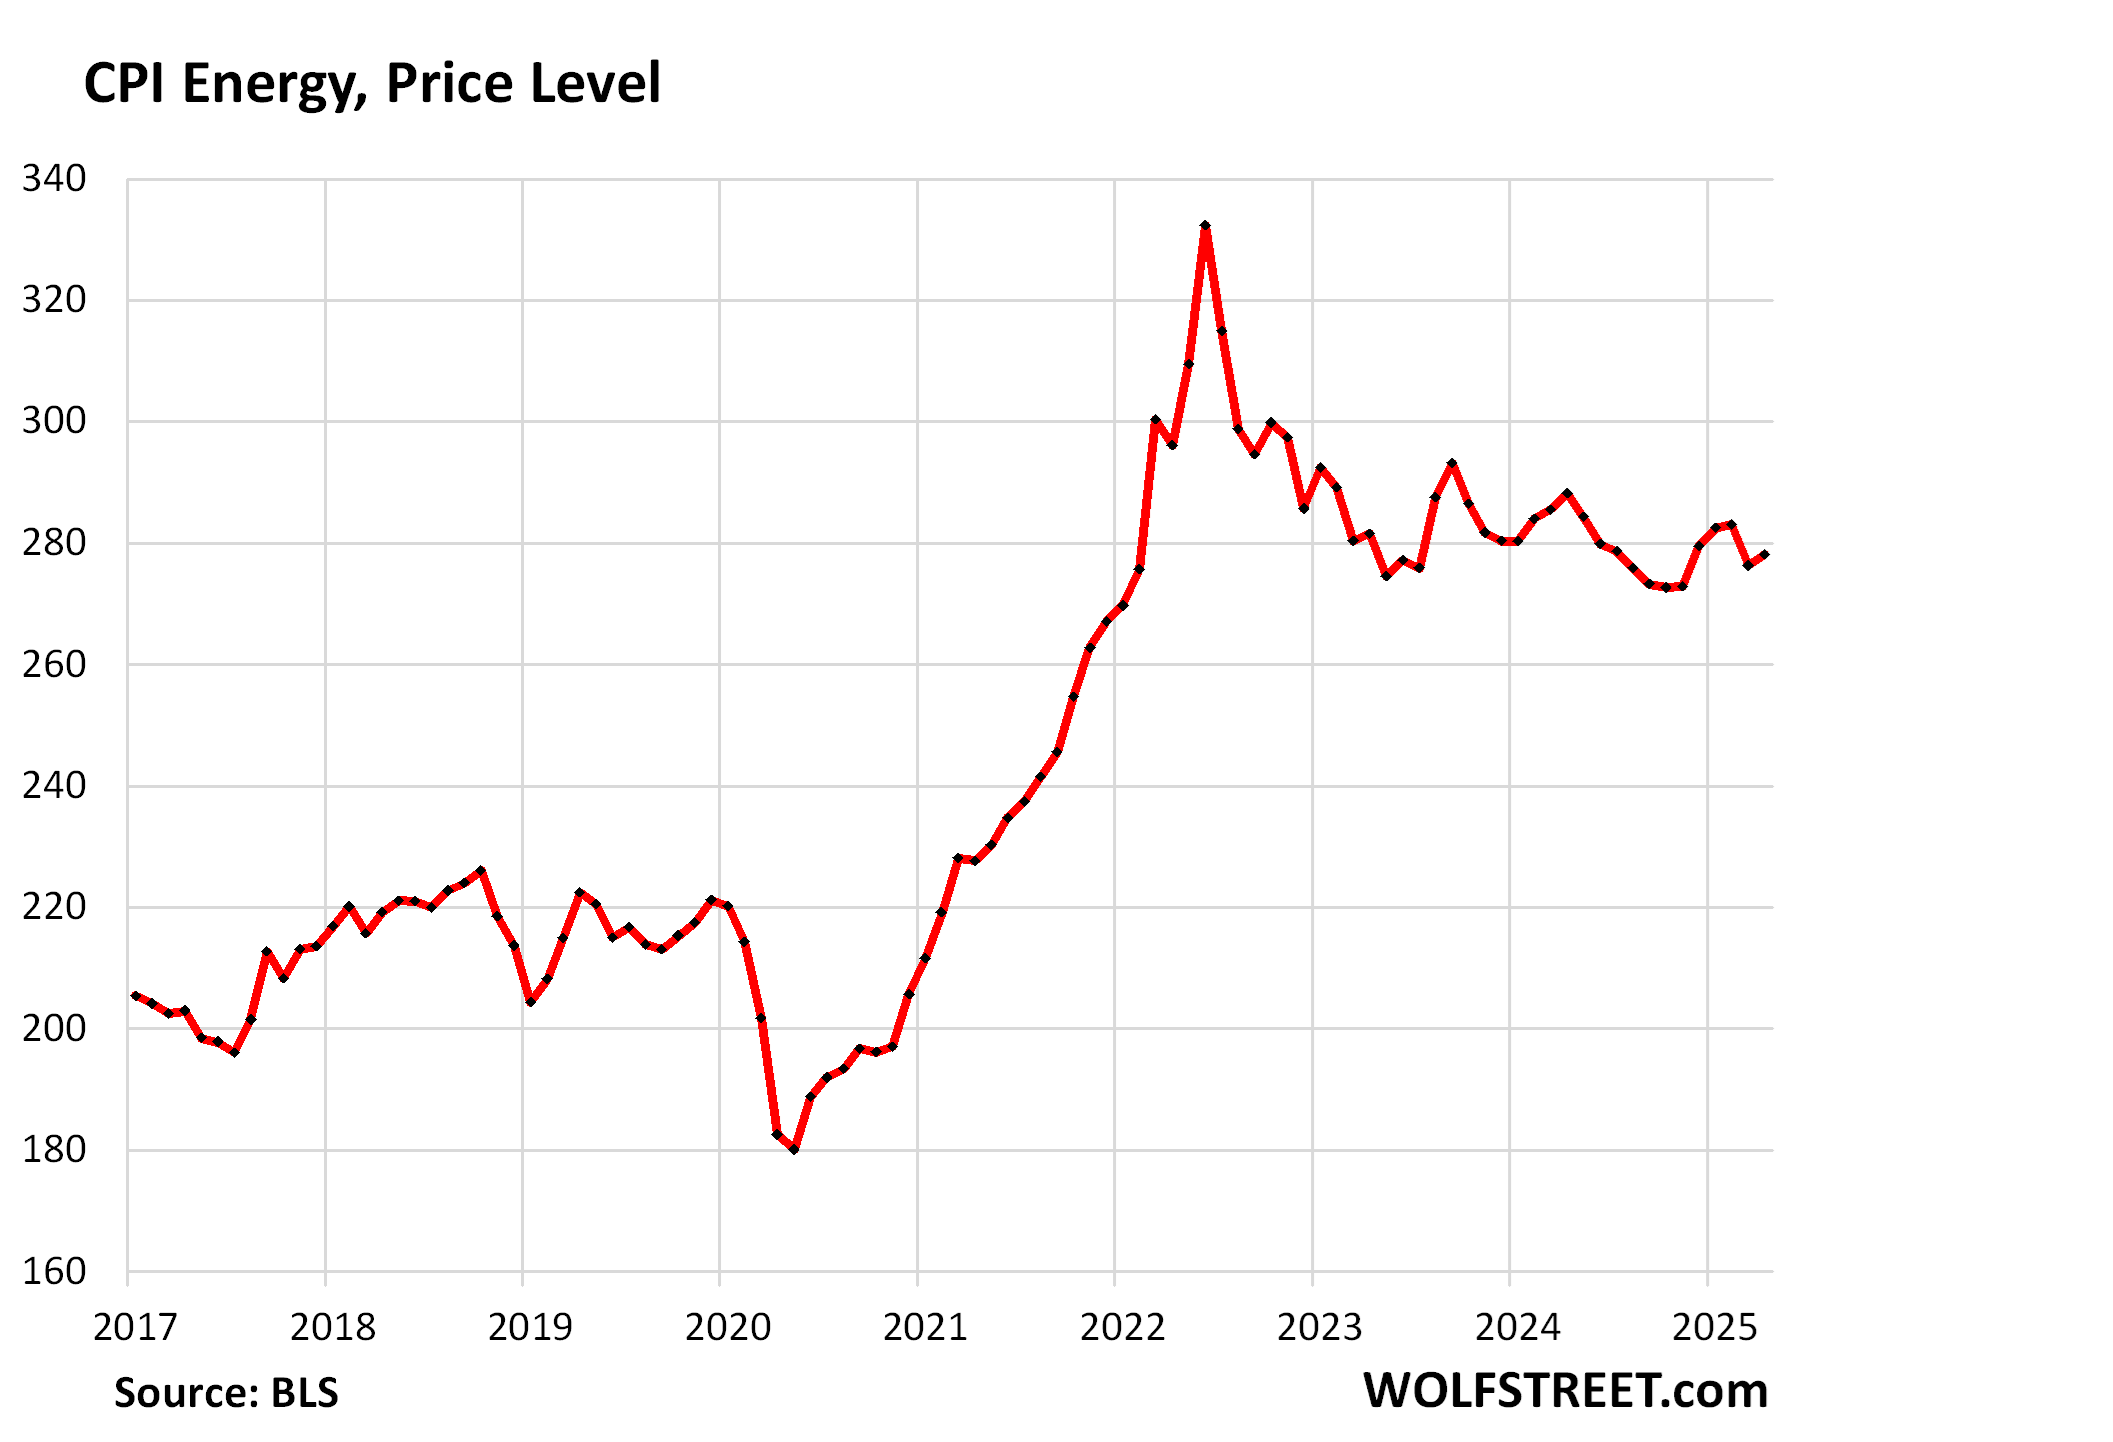
The CPI for energy jumped by 0.67% month-to-month, seasonally adjusted, driven by the surge in prices of utility natural gas and electricity service.
On a year-over-year basis, the index fell by 3.7%. Despite some ups and downs, the index has essentially been flat for two years (see chart below).
| CPI for Energy, by Category | MoM | YoY |
| Overall Energy CPI | 0.7% | -3.7% |
| Gasoline | -0.1% | -11.8% |
| Electricity service | 0.8% | 3.6% |
| Utility natural gas to home | 3.7% | 15.7% |
| Heating oil, propane, kerosene, firewood | -2.6% | -7.2% |
Enjoy reading WOLF STREET and want to support it? You can donate. I appreciate it immensely. Click on the mug to find out how:

![]()
So we’re still swomming around the 80s pool. It seemed then it (primarily Services inflation) was interminable. Years to go perhaps.
Sell both cars, buy triple-short ETF. Sell in 12 months, buy condo in Florida. Or wait another 12 months, buy two condos.
You will need a lot of money for insurance for those Florida condos!
You sell them to North North Dacotans (formerly Canadians), but only after QE 5 kicks in.
Insurance costs depend on where you are in FL. Insurance costs are coming down relative to the rest of the country, in many areas, due to new FL laws and insurance companies returning to FL. But live right on the coast and insurance costs can vary quite a bit.
Reckless gambling is never a good plan.
Above is a fairly prident aproach for this once in a generation oportunity. And your car depreciates every day.
Sell your cleverness and buy bewilderment.
That’s what all my working friends who rent from 25 year old crypto millionaires say.
/s. Kinda
“…25 year old crypto millionaires…”
$1,643 in a Coinbase account is not a millionaire.
You’re such a contratian, Depth, I hope you went all-in on stocks in mid-April when everyone was screaming that tariffs were going kill 300 million people.
Despite MSM’s deceptive headlines that inflation is cooling, Treasury traders are more convinced about increasing inflation, less about recession. T-bill yields are flat today, but bond yields are up, the 20 year approaching 5% again (4.97% as of this morning).
Yes, yields are certainly banging on the door.
re: “There was no evidence of tariffs getting passed through to consumers.”
At Costco, prices are already adjusting.
They have adjusted since 2020, by maybe 20-30%, some stuff more, and are still “adjusting.” And you thought 20% to 30% was OK? And didn’t say anything here?
And suddenly you make up stuff that you think Costco might do? What do you buy at Costco that’s imported and tariffed? French wine? Buy US wines. That’s what tariffs are all about. My Kirkland coffee didn’t go up, I know that. US beef at Costco has been going up for three years and is now very expensive, and you didn’t complain about that?
So you want us to stop buying French cheese, German beer, and instead buy Velveeta and Coors?
I’m sorry but while tariffs on “strategic” goods make a lot of sense, tariffs on foods make NO sense!
I’ll challenge anybody here to make the case for that!
LOL, no, you can buy California or Oregon wines, which are among the best in the world; and reasonably priced. You can buy craft brews from one of the thousands of American breweries around the USA, and they make the best beer in the world from the best specialty hop, grown in the USA, and from malted barley, grown in the USA (they taught German brewers how to make IPAs, and international BIG Beer bought a bunch of these small brewers); you can buy incredibly good artisanal cheeses from creameries in California, Wisconsin, Oregon, New England, and many other places in the USA (Costco carries some of them), etc. etc.
There are examples of things where the US no longer has a big presence in making them, such as plastic toys, but citing wine, beer, and cheese, or any top-notch food or drink, is just embarrassingly clueless.
Wolf covered it but this is dumb af
I’m less sanguine than Wolf, but even I think you picked some of the worst examples of products to have tariff worries about Steve. Not just the replacement aspect, but also discretionary.
Honestly, if drinking California wine and Wisconsin beer & cheese to save a few bucks is the worst impact of the tariffs on you (assuming they stick/return), then count yourself very lucky
I’m with you on this, Steve. American wines can be great, but the ones that don’t cost a small fortune are an instant headache.
I love Scotch and Mezcal. They simply can not be made here. Replicas, maybe. The real stuff, no.
Wisconsin cheese and cured ham knock-offs are OK, but simply not as good.
In general, I like local produce and food. But part of what was great about America was that we have access to all kinds of amazing food from around the world. (Try a burrito in Europe sometime…actually, don’t). It was already annoying when they’d mark up a bottle of Campari 300% to sell in America because somehow it’s a luxury, but forcing more expense on all this stuff is a quality of life issue, and that is very sad. I don’t need cheap plastic shit from China, but I want worldwide food products. DOP and equivalent food protections are there for a reason.
But you know, keep the people dumb, obedient, and with a limited world view, I guess.
And…Michoacan has the best avocados, period. You simply can’t change the concept of “terroir” to fit political views.
I am a fan of your excellent articles. Way better than mainstream news articles. Thanks for all the good work.
My question – where do you see 10 and 30 year yield by Dec 2025, June 2026 and Dec 2026?
Any guess – where do you see a slowdown vs tariff inflation vs asset bubble progress? Just a guess based on your analysis
Because these people are ideologically bankrupt
At certain point, I have to wonder if the numbers are being tweaked for the headlines and then will be revised (or not) later.
Coming from a background in finance/accounting plenty of companies can play with their numbers to target certain results with the bounds of the laws – why would or our govt be any different. With the mass layoffs I wouldn’t be surprised if people felt it was in their best interest not to make the current administration look bad.
Many of those who were, let’s just say not big fans of the previous administration, thought something like that. “Rigged” was the expression, I believe….
Except they did drain the strategic oil reserve and issue a negative 800k jobs correction… So…
They also issued a 2.2 million UPWARD jobs correction in February 2025. You people never talk about this — though it was four times as big but up — because it doesn’t fit into your narrative?
https://wolfstreet.com/2025/02/07/huge-upward-adjustment-of-employment-labor-force-as-wave-of-immigrants-is-finally-included-unemployment-drops-wage-growth-accelerates-the-annual-revisions-are-here/
Is that for me Wolf?
I’m mostly just saying that each administration adjusts numbers so it is silly to think one or not is being truthful or untruthful.
Or are you saying the Trump administration adjusted Biden numbers? Lol I’m confused
“Administrations” do NOT adjust the numbers. It’s the thousands of career people and computers that release early estimates to give us an idea of what is going on, and as they gather more data, the scheduled revisions are made.
The huge upward employment revision in February was something I started discussing in April 2024, and continued to discuss in follow-on articles.
Here is the April 2024 article; CLICK ON IT AND READ IT;
https://wolfstreet.com/2024/04/03/how-the-huge-wave-of-immigrants-into-the-us-in-2022-and-2023-impacts-the-employment-data-of-the-bls-household-survey/
I did this because I knew Census would update its population estimates before the end of 2024, as it does EVERY YEAR, but this time it would account for the flood of immigrants that hadn’t been accounted for, and then the BLS would take those updated population figures and adjust its employment figures.
Here is the December 2024 article (when Biden was President) about the Census revisions that predicted the BLS upward revisions in February (when Trump was President):
CLICK ON THIS ARTICLE AND READ IT ENTIRELY:
https://wolfstreet.com/2024/12/19/census-bureau-revises-up-population-growth-8-million-in-3-years-due-to-immigration-total-us-population-340-million/
You will find a series of articles about this right here on this site.
CLICK ON THE LINK I GAVE YOU in my comment above AND READ THE ENTIRE ARTICLE, AND THEN CLICK ON EACH LINK INSIDE THAT ARTICLE AND READ ALL THOSE ARTICLES.
And after you have done this, you will actually know something, and stop posting STUPID BS like you just did.
So we get an “advance estimate” of GDP,” which is what everyone writes about, and it says “advance estimate” right at the top of the BEA’s press release. Then there are scheduled revisions, three of them scheduled in advance and you can look up the schedule when the revisions will be released right here, for example:
“May 29: Gross Domestic Product, 1st Quarter 2025 (Second Estimate) and Corporate Profits (Preliminary)”
https://www.bea.gov/news/schedule
Then there are many more revisions of GDP over the years, going back five years. This is all scheduled and laid out, and you can just look it up.
If they wanted to wait till they had ALL the data before they published the jobs data, we’d have to wait three years to get monthly employment data. They provide us with advance estimates at first, and then as they get more data, the revise those estimates. It’s all spelled out in advance.
People in the media and social media who attach political motivations to this are just plain ignorant or malicious BS spreaders.
Yup. That’s how science works! The people to be skeptical of are those who DON’T change as more data (aka facts) arrive. When you see someone discard new facts because it doesn’t fit their previous statements, run away.
Chill bro. I’m not the one you should have a beef with lol.
What? Do you have any proof whatsoever?
True, they drained a modest amount from the SPR, more than Trump did. Revisions came and went both directions. I’m sure we’ll see similar again.
The dudes who assemble these numbers are not partisan. At least not in theory. And the methods are transparent. So I doubt either admin truly messes with the numbers.
I think MM1 meant that those who provide data, not those who assemble the data, might be motivated to soften up numbers. I highly doubt that one, despite this current behavioral climate.
Lol it was not a modest amount
https://www.eia.gov/dnav/pet/hist/LeafHandler.ashx?n=pet&s=mcsstus1&f=a
It was like 40% for no other reason than high oil prices.
Here is today’s headline from Yahoo “Finance”
“US Bonds Rise as Soft Inflation Backs Bets on Two 2025 Fed Rate Cuts”
Now if you bother to actually read past the propaganda headline:
(Bloomberg) — Treasury debt slipped as gains for US stocks reinforced the broadening conviction on Wall Street that Federal Reserve interest-rate cuts are unlikely before December.
Now what is being “tweaked” here? Yahoo has been and remains notoriously anti-Trump. Bonds had quite the dip today as the TYX and TNX are banging on 5% and 4.5% respectively. I find it odd that when Biden blew the doors off the debt ceiling the MSM finance sector was in heaven. Now Trump gives the MSM a dose of their own medicine and they’re outraged and double down on anything anti-Trump, no matter how much they have to fabricate the “facts”.
He’s President, let’s see what happens. We gave Biden 4 years
So it’s back to Wolfstreet for some actual facts.
That stuff is always so amazing to me. I don’t know how they get away with this.
Yahoo Finance is a joke. Used to be the best site to quickly check stock prices and charts but they keep doing “updates” that make their charts worse and worse. Enshittification of everything…
The Tesla board lady just sold a lot of her stock for $530 million .
That’s cashing out before the zeppelin crashes
Taking a step back, the US economy is approximately 1% agricultural (negligible), 19 to 24% industrial/production, with the remaining 75%+ service related (comprised of components noted by WR in this article such as insurance, rent, medical services, leisure/travel, entertainment, education, telecomm., etc.). These allocations are somewhat a matter of definition and source but for the most part, the US is a service based economy. This brings up two observations as follows:
First, even if tariffs end up raising the costs of certain imported goods, just how much of this will eventually show up in the overall inflation figures (which is dominated by the service economy)? Being overly simplistic (and just as an example), if tariffs raise imported prices by an average of 10% based on total annual imported goods of $3.5 trillion (estimated based on various data sources), this would raise prices by $350 billion. Compared to the annual USA GDP which is approximately $30 trillion, this amounts to an increase in inflation of just 1.17% ($350 billion divided by $30 trillion). The weighted average impact from tariffs on just imported products is not as significant as it seems. The ultimate impact from the tariffs mess has yet to be worked out and will most likely be spread out between different parties (based on which companies have purchasing power, pricing power, a combination of both, or neither, which means the company would eat the tariffs) but what appears to be a much larger problem is in my next point.
Second, with the US economy being primarily service based, the “stickiness” in service based inflation represents a much bigger problem that clearly is nowhere near being under control. Just when one or two components of the service inflation measurement appear to be cooling, two or three other components jump up driving the inflation measurement higher yet again. The dangers with inflation increasing in so many service based components would indicate that the challenges with inflation are both deeply rooted now (throughout the economy) and really nowhere close to be resolved anytime soon.
Honestly, I could care less about a one off product (e.g., eggs) that experiences a supply shock that eventually works itself out through the laws of supply and demand and basic business management. The bigger problem is when inflation pressures build throughout a wide range of measurement components that turns into a game of whack a mole by the government (whack one inflation mole and two other moles appear).
I don’t believe the FED or the federal government understand the gravity of the inflation problem yet as they appear to be fixated on using a set of tools that are too slow/too late (the FED with QT and interest rate increases) or simply misguided (government attempts to set price controls, such as prescription drugs, or taking credit for egg prices dropping, who cares). Once the inflation beast is set free, especially within services, its going to take a significant and coordinated effort between monetary and fiscal policy to tame it. At this stage, I don’t believe either the FED or the Federal Government have the stomach to launch the type of aggressive battle needed to tackle the deep rooted nature of inflation in the economy now.
I honestly think that both are trying to have wages rise ahead of inflation
Good luck with that.
Totally agree with you!
I concur. I don’t see large inflationary effects from a 10% or whatever tariff. Some, sure. Tons? No.
Not even clear how we would see when yet if they existed anyway. There was a huge spike in shipping before tariffs and of course filling of warehouses. This was followed by a significant slowdown in cargo containers which are just hitting West Coast and soon to be East Coast. Next of course is a massive increase in shipping as all cargo ships are booked with latest tariff reductions. In 90 days who knows but large companies may even try to stick for upcoming holidays. Nothing like stable policies to create a stable flow of products.
Soon the US .sy do what Australia does with regards to its CPI:
Every year they adjust the weights in the CPI to previous year spending data so that new consumption patterns/amounts get reflected in the numbers.
Consumers spending more on beef?
Increase the weight of beef in the CPI.
Makes previous CPI data totally incomparable.
They change the CPI basket because smartphones didn’t exist in 1990, and streaming didn’t exist, and broadband didn’t exist, nor did a gazillion other goods and services, or if they existed, it was in a different form. And a bunch of stuff that people bought back then, such as vacuum-tube TVs and PCs and dial-up modems and paper newspapers, are no longer bought today, or are bought only in small quantity and no longer matter, and they have to come out of the basket.
The CPI basket has to reflect the goods and services that consumers currently buy, in the proportion that they buy them in. That has always been the case, everywhere.
Not only that, but CPI includes hedonic quality adjustments, to account for changes in product quality and features over time. The complexity involved in the calculation is mind-boggling. Too bad they can’t present the data to two decimal places, like Wolf is now doing.
Yes, but the way Australia does it is probably unique.
They do it year to year and not based on new products, but categories within the CPI.
Again, for example, last year the amount people spent on international travel increased so the weighting in the CPI increased. I don’t know the exact change, but say it would increase from 1.2% to 1.5% of the weight in the CPI.
Next year the amount decreases so the year after the weighting will fall to reflect the reduced spending amount.
Then determine the change in prices and use the weighting. You could have falling prices with increased weighting giving an outsized fall to inflation. Or the opposite could happen too.
Australia is a relatively small economy in many ways so changes can affect these stats with ridiculous results.
Another example, Taylor Swift had a number of concerts in Australia and at the same time there were a couple of other big events.
This caused spending on recreation, tickets, meals at restaurants and domestic travel to increase.
These increases were big enough to increase the weight in not only the CPI, but resulted in a big one time increase in retail trade during the period.
Those events will not be repeated, but the data will be reflected in the year after the events occured in the new weightings.
IIRC it also caused per capita retail sales to increase.
To expand the effect that these changes have on other prices and impacts on inflation and the CPI you have to look at how they are used to set other price increases in Australia.
Student loan debt is increased by the increase in the CPI. If you have A$1000 in debt and the CPI increased by 5% then the principal amount in you owe the government increase by A$50. You now owe the government A$1050.
Alcohol, tobacco, gasoline excise taxes are also tied to increases in the CPI as well. Tobacco also gets hit with other tax increases as well.
Government sets increases in private medical insurance by looking at CPI as well as increases in university tuition.
These administered price increases are based on previous year CPI data and flow through to the next year.
That is why inflation in Australia has been sticky and taken longer to fall than in other countries.
Where’s my Whip Inflation Now button?
Just sold on ebay for $10,000.
CPI facts and data: points to wait and see, thanks Wolf for posting! $tnx is rising and that can’t be ignored. As Wolf said in a previous comment, When the 10-year auction produces a 5% yield sparks will fly! Bear market rally in stocks looks to be reaching or arrived today at its end destination. Yesterday we had 59 stocks in the SP 100(100 largest based on market cap) above its 200 DMA today we have only 56 on .88% up day Excited to see PPI tomorrow and read Wolfs take on the data.
“Bear Market Rally”
Did the market even drop 20%? I know the S&P didn’t. It’s now up 0.8% for the year
SP 500 high 6147 low this year 4835 equals a 21.4% drop, 20% drop is a bear market! Text book bounce! Every trader has buy order around ~19% down from top and it pierced through and went to 21.4%. It’s action on UST and USD on April 7 and 8th that deserves respect.
Wolf, are bond prices dropping (or yields rising) from folks rotating from bonds during tariffs back to equities?
Yield rise because they’re too low given inflation and other risks, in the perception of investors.
“No Signs yet of Tariffs Getting Passed to Consumers”
Ok, here’s your first sign. From an email today regarding a tech toy I have been waiting on for a while:
With the reduced tariff how much will my [tech toy] cost?
The margins we have on the [tech toy] manufacture are already thin and so we are not able to absorb the entire cost of the 30% tariff. As a result the cost of the [tech toy] in the US will rise to $415. [from original $350]
Just raising a price is not inflation. It’s like the asking price of a house. It’s meaningless. What counts are TRANSACTION PRICES. So if your sales collapse after you raise prices, then that item weighs less in the inflation calculus, and the competitor, who didn’t raise the price and whose sales jumped, weighs more.
Transaction prices that consumers pay is what matters to inflation, not the price you’re trying to get. And that makes a huge difference. Last time there was some widely publicized washing machine retailer that raised prices a bunch, and all the stupid-ass media said, “see how tariffs double the price of washing machines,” but their sales collapsed, and then they had to roll back the price increases, which is why it never made a dent in the inflation figures.
When you raise prices, you risk a collapse of your sales!
So, what if we’re all Drunken Sailors and Hammered Airmen, and decide we’re just going to buy, buy, buy regardless of price, since we’re still flush with cash from the Free Money Era? In this scenario, no companies eat any of the tariffs since consumers are happy to do so. Will that amount to inflation?
Because I don’t see any restraint in Millennials. And Boomers raked in even more Free Money than the rest of us…
So, cancel your doctor appointment and buy a pair of shoes instead.
“But prices of apparel & shoes fell.”
Time to go summer shopping!
The major impact is obviously in the rental tariffs. Damn imported housing!
Who can complain? All the headline metrics are squarely below the target 3-3.5%!
/S