Active listings in San Diego +70% yoy, Los Angeles +50%, San Jose & Silicon Valley +67%; San Francisco metro +43% (highest April since at least 2016)
By Wolf Richter for WOLF STREET.
It’s not that new listings are that high; they’re not. It’s that the homes that have been listed for sale aren’t selling, and the new listings pile on top of it, and overall inventory is suddenly ballooning at an astonishing rate. The same dynamic is taking place in other markets, and we discussed the the situation in Florida the other day. Now we’ll look at four major markets in California – Los Angeles County, San Diego County, the San Francisco metro, and San Jose metro (which include Silicon Valley) – and California overall.
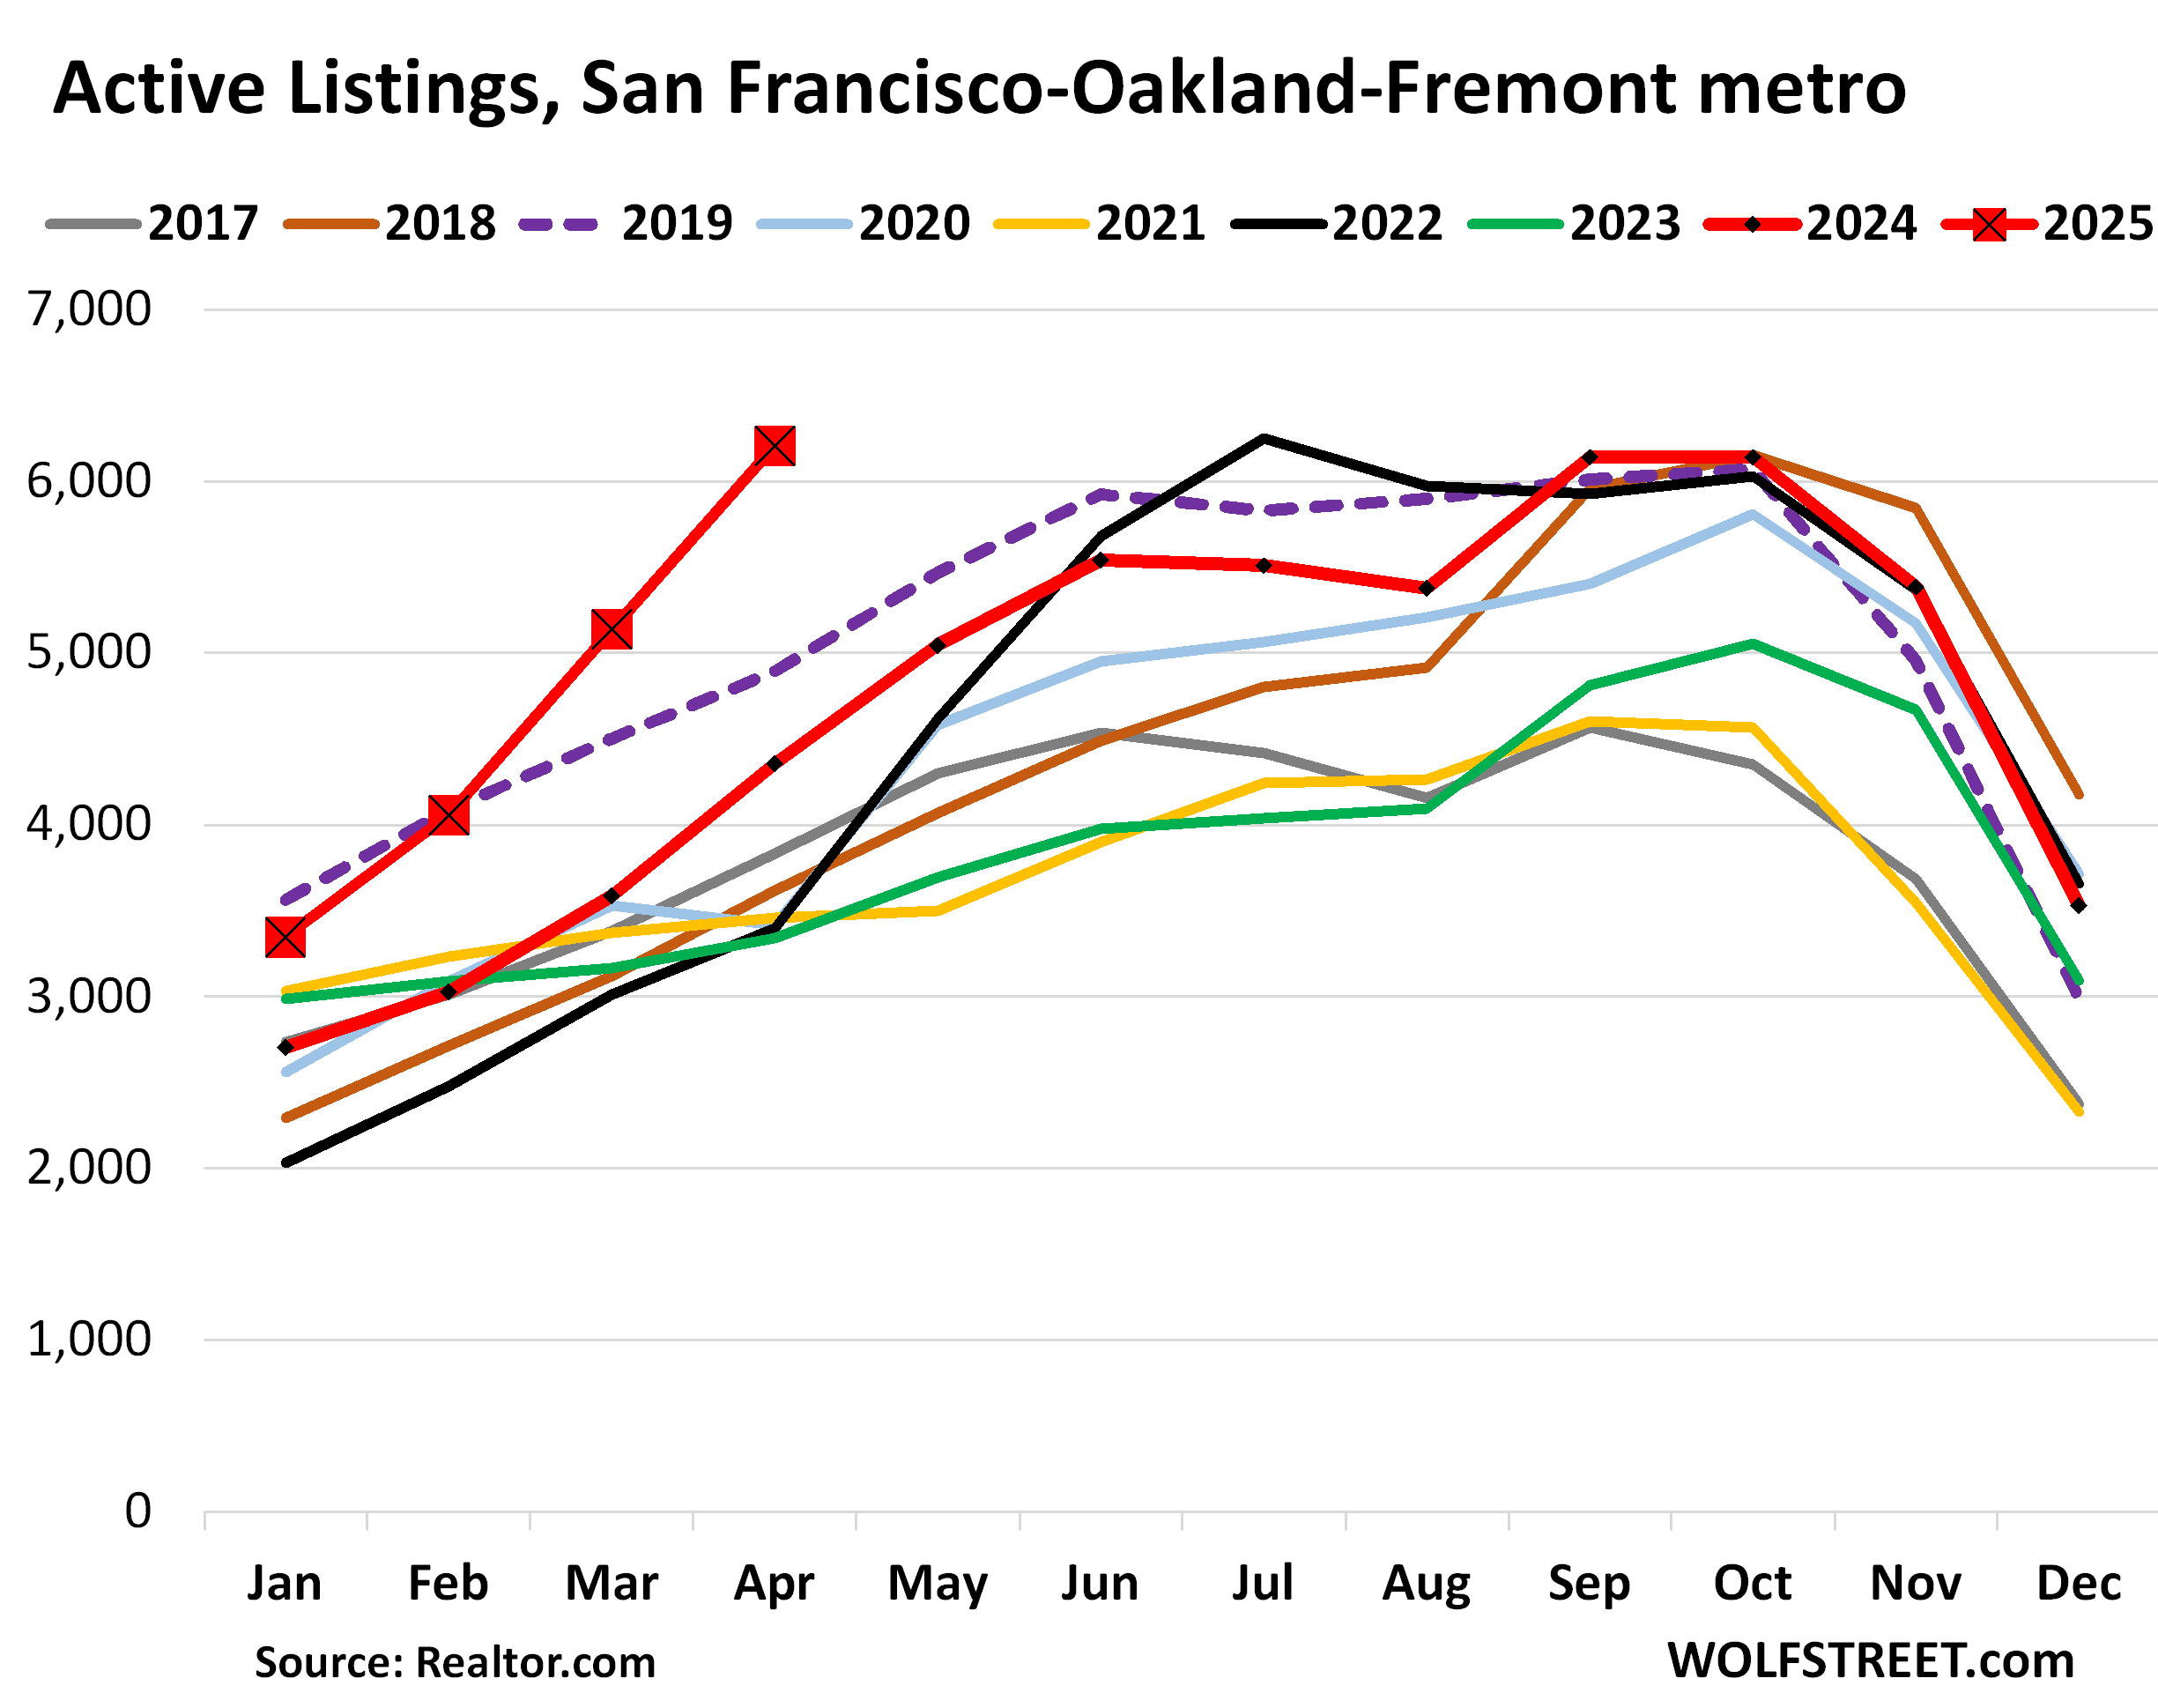
San Francisco-Oakland-Fremont metro: Year-over-year, active listings jumped by 43% in April, after three massive month-to-month spikes in a row of +21% in April, +27% in March, and +21% in February. The 6,208 homes for sale were by far the most for any April in the data from realtor.com going back to 2016. Compared to April 2019 (purple dotted line), active listings were up by 27%. That was quick, how fast that endlessly hyped “housing shortage” has evaporated.
This metropolitan statistical area (MSA) includes the counties of San Francisco and San Mateo (which includes the northern portion of Silicon Valley), part of the East Bay, and part of the North Bay.
Active listings are homes for sale that do not have a pending sale. They’re the “unsold” inventory. Total inventory, on the other hand, includes active listings (unsold inventory) plus inventory with a pending sale (sold inventory).
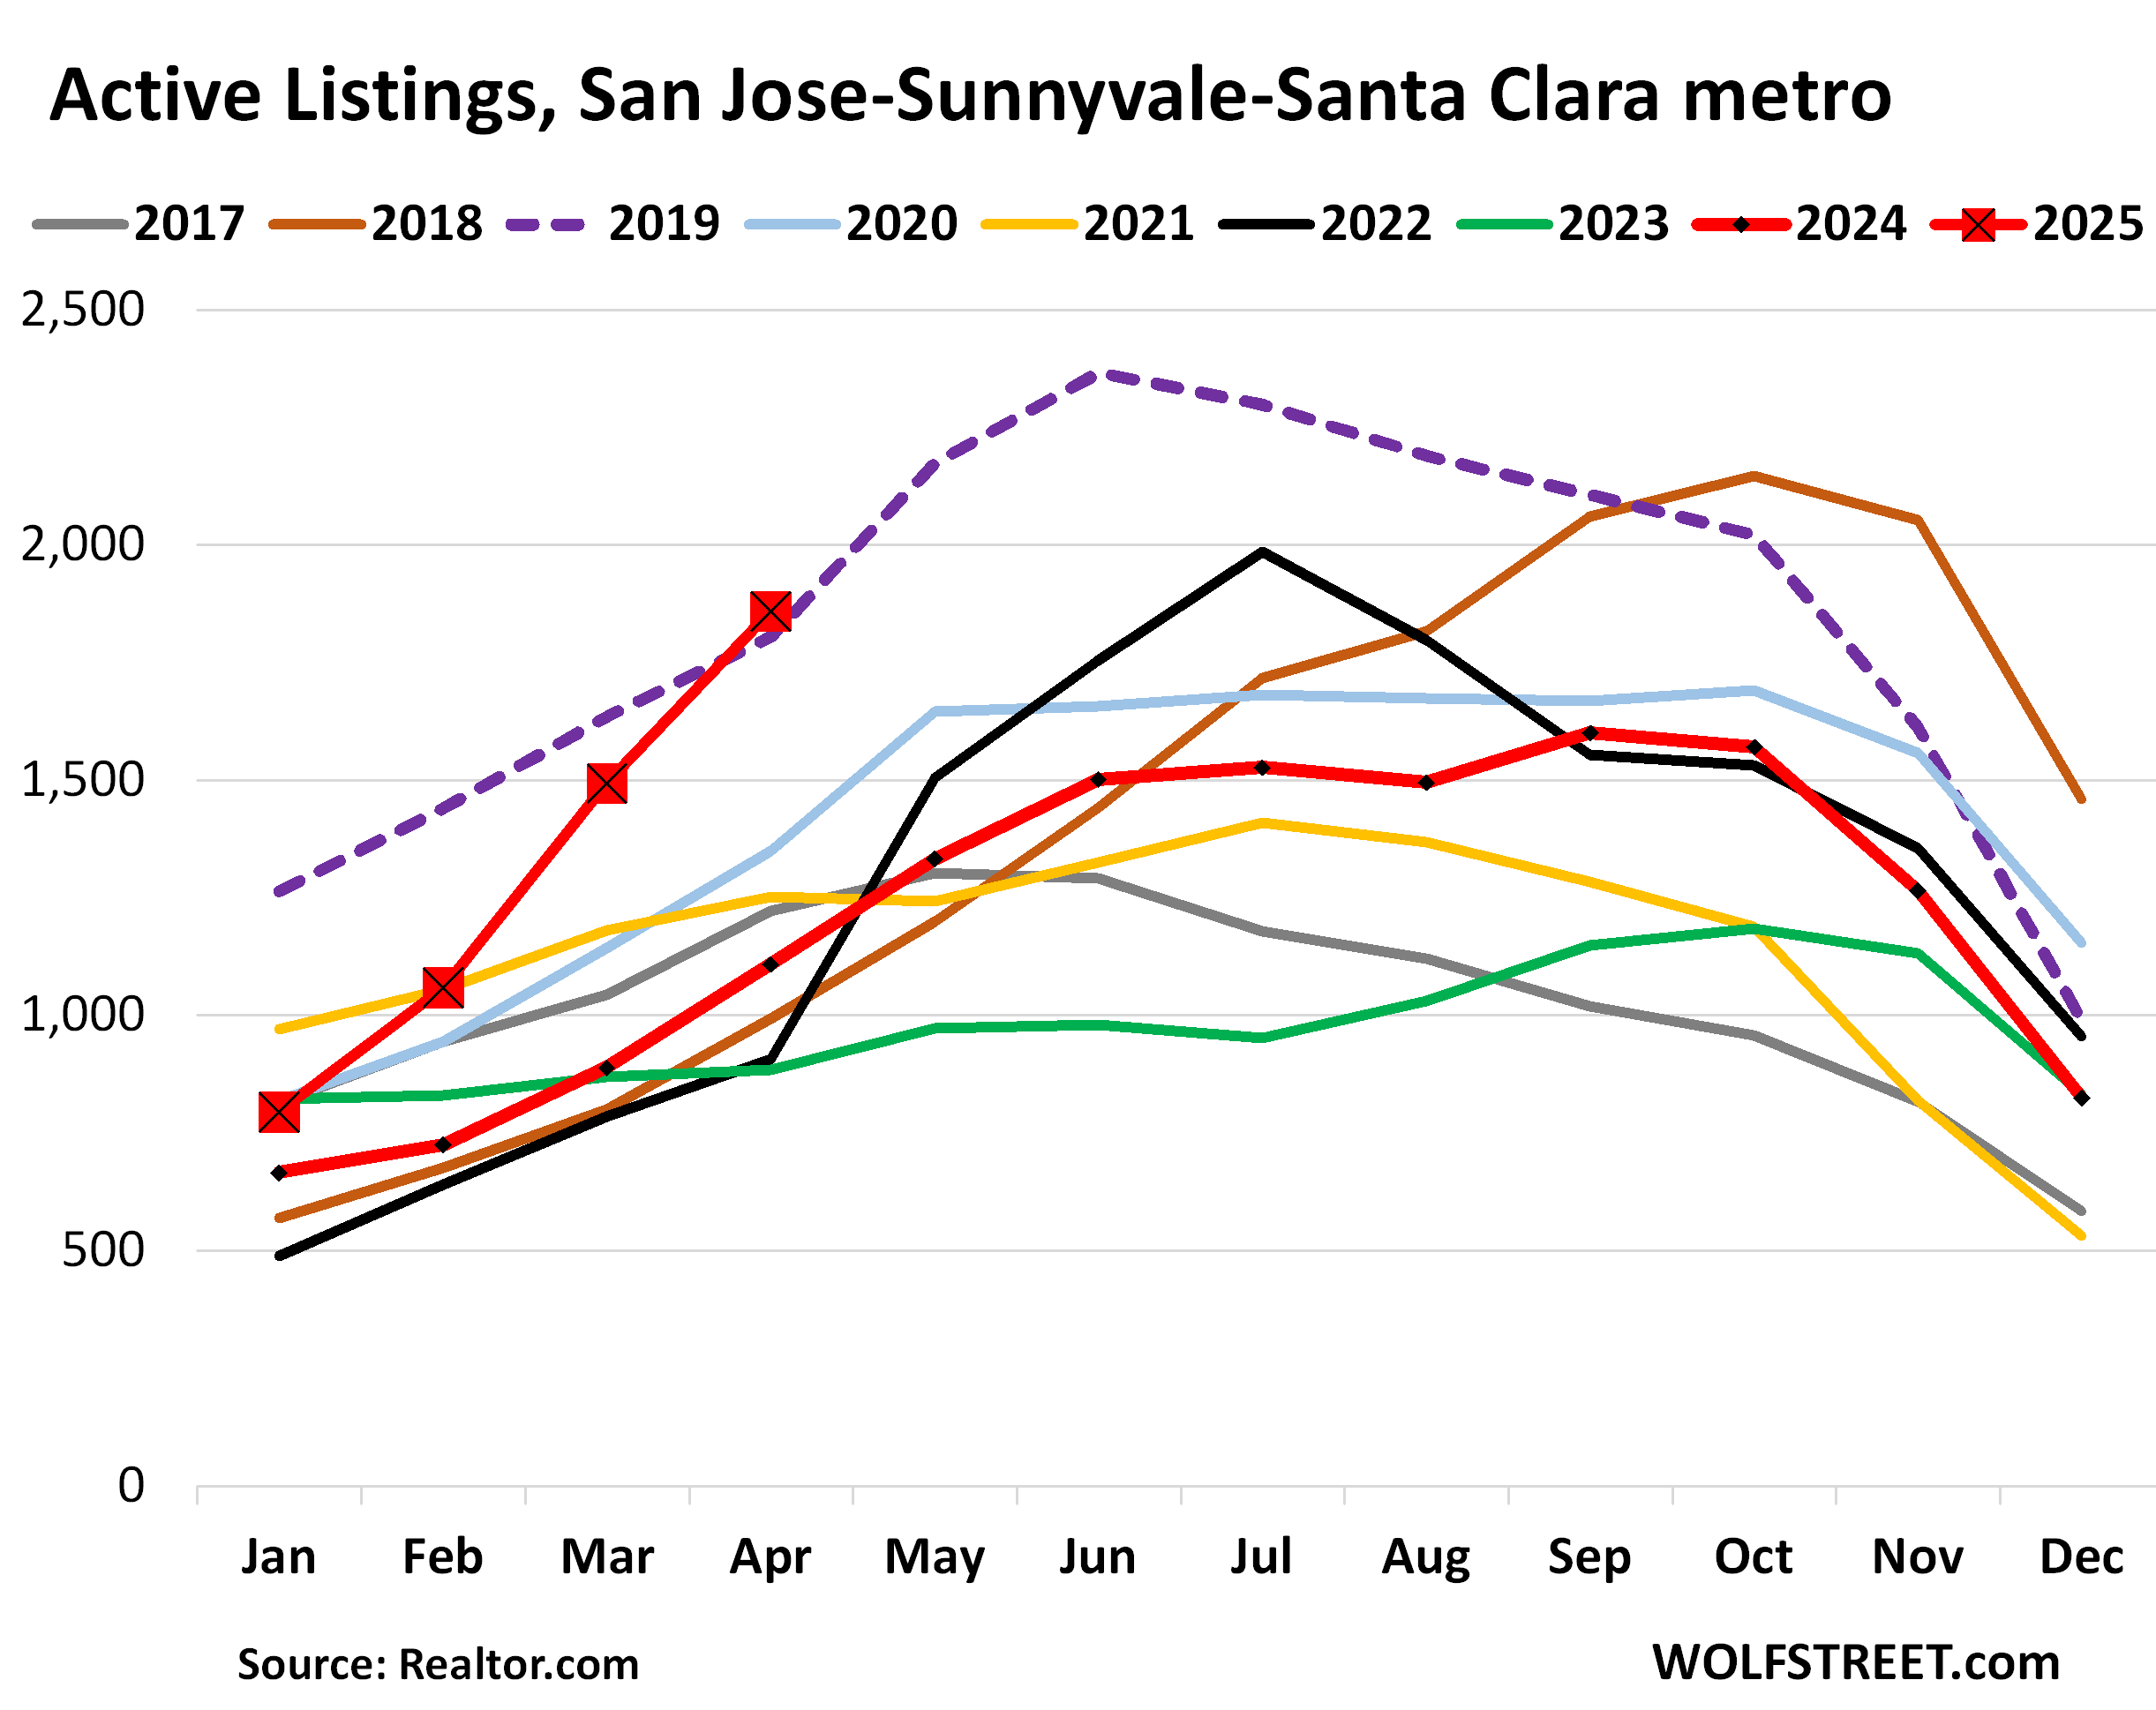
San Jose-Sunnyvale-Santa Clara metro: Active listings spiked by 68% year-over-year in April, after the three month-to-month spikes in April (+25%), March (+41%), and February (+33%). The 1,859 homes for sale were the most for any April in the data from realtor.com going back to 2016.
Compared to April 2019, active listings were up by 3%. In April 2024, active listings were still down by 39% from April 2019. That’s how fast inventory changed.
The MSA includes Santa Clara County (San Jose and the southern part of Silicon Valley) and goes south into rural areas.
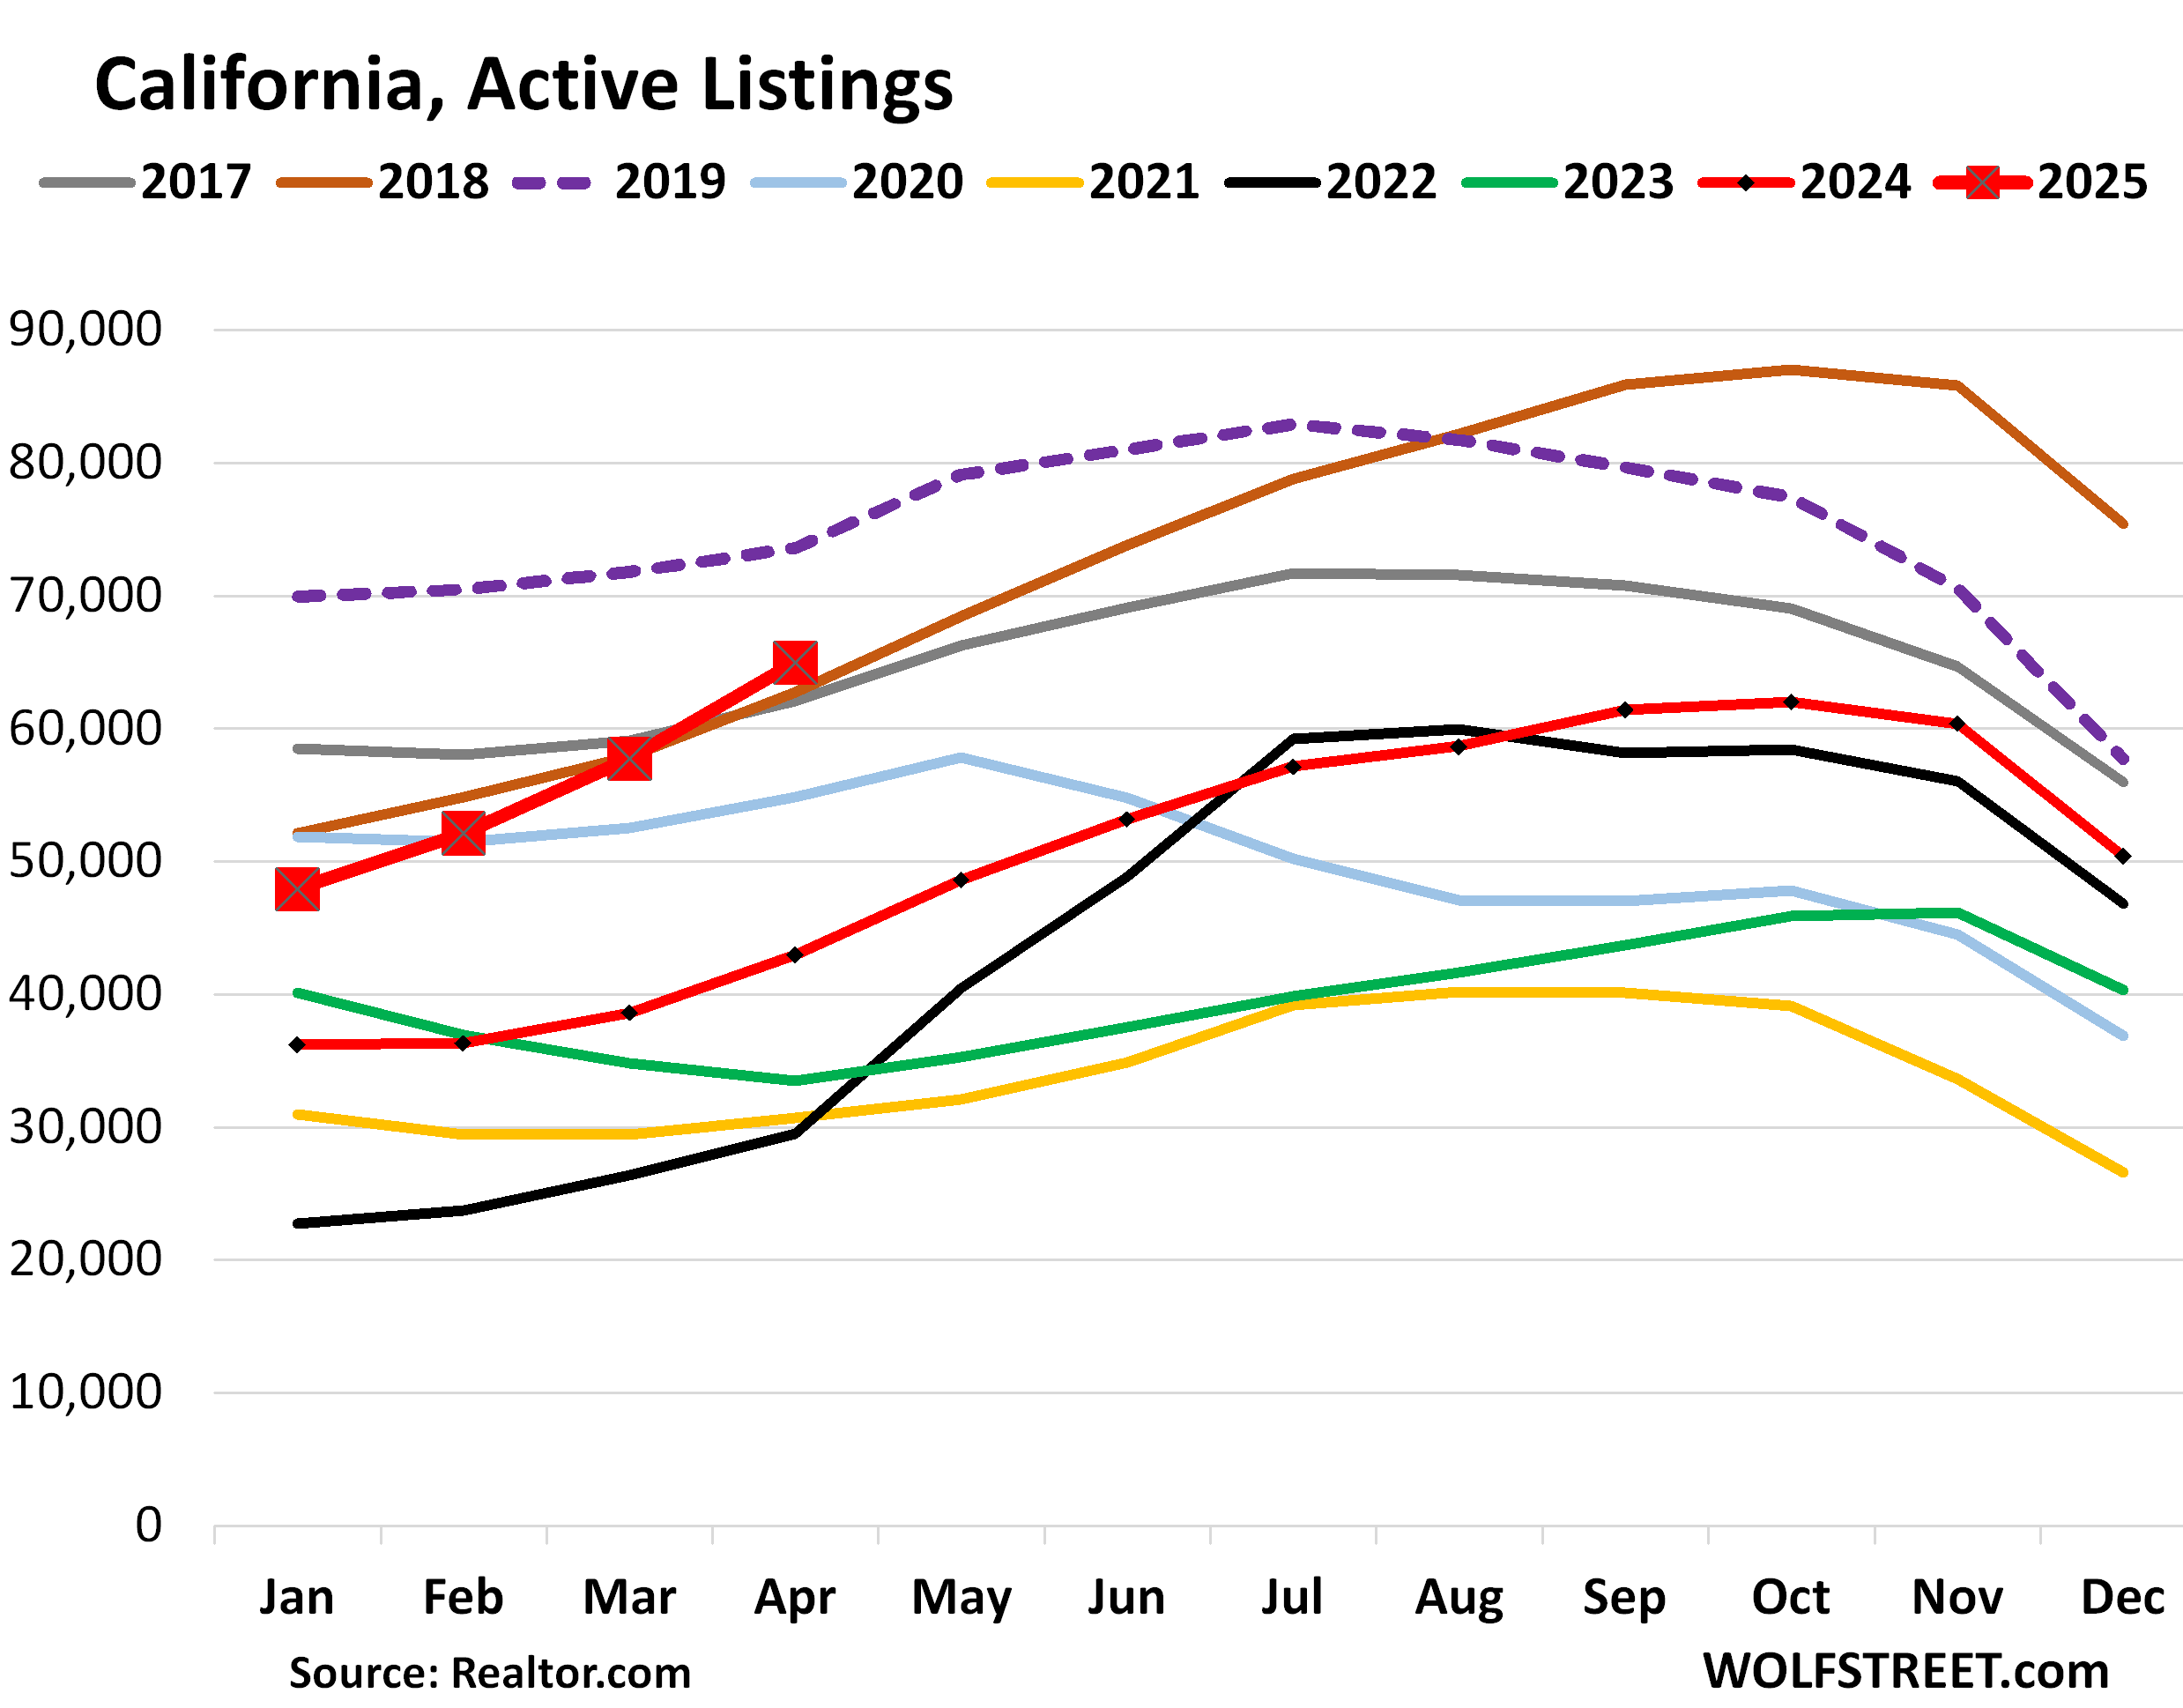
In late 2018, amid the Fed’s slow rate-hike cycle back then, the average 30-year fixed mortgage rate rose to 5%, after having surpassed 4% earlier in 2018, and home sales stalled, and inventories rose sharply in the second half of 2018 (brown line) and into 2019 (dotted purple line). It’s this inventory pileup of 2019 that the current inventory has now surpassed:
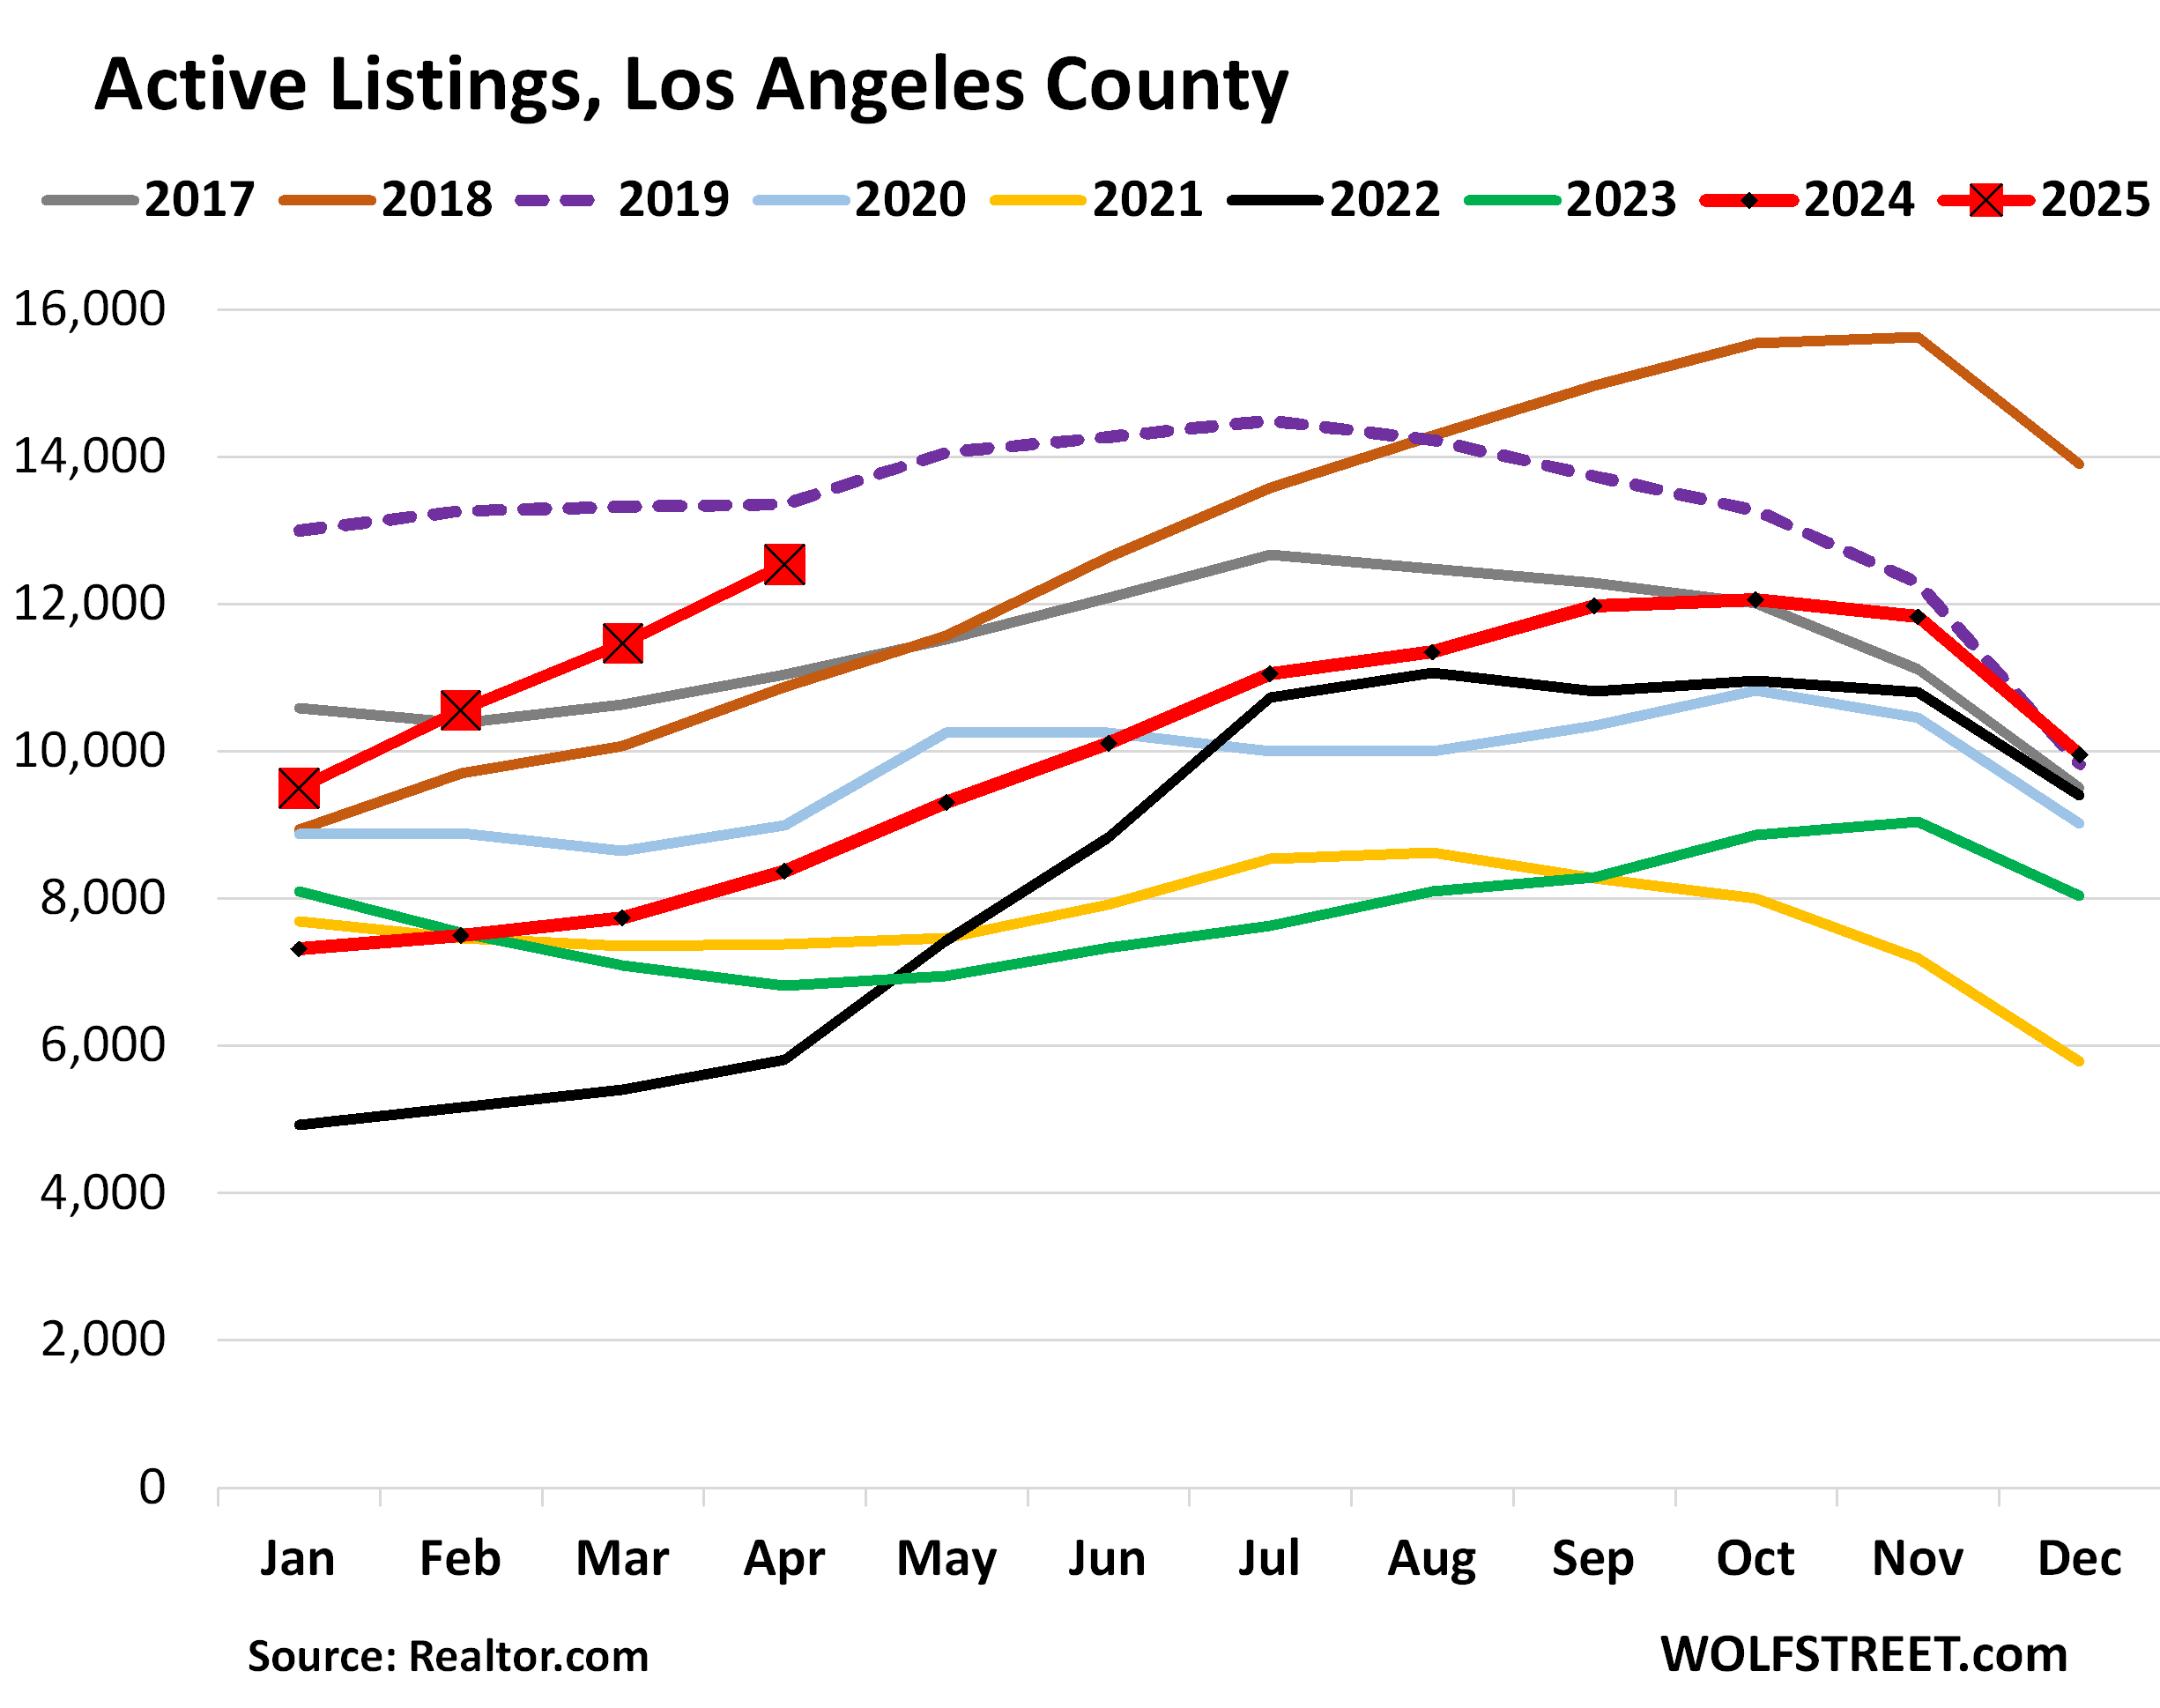
Los Angeles County: Active listings spiked by 50% year-over-year in April, to 12,535 homes for sale, the most for any April in the data from realtor.com going back to 2016, except 2019 (purple dotted line).
Active listings were 6% below April 2019, but have been rapidly catching up, from being 27% below in January, and given the trend in 2025 so far, may surpass 2019 over the next few months.
Note the inventory pile-up in the second half of 2018 (brown line), when mortgage rates hit 5%, and into 2019. That’s the inventory level that 2025 is now lining up to surpass.
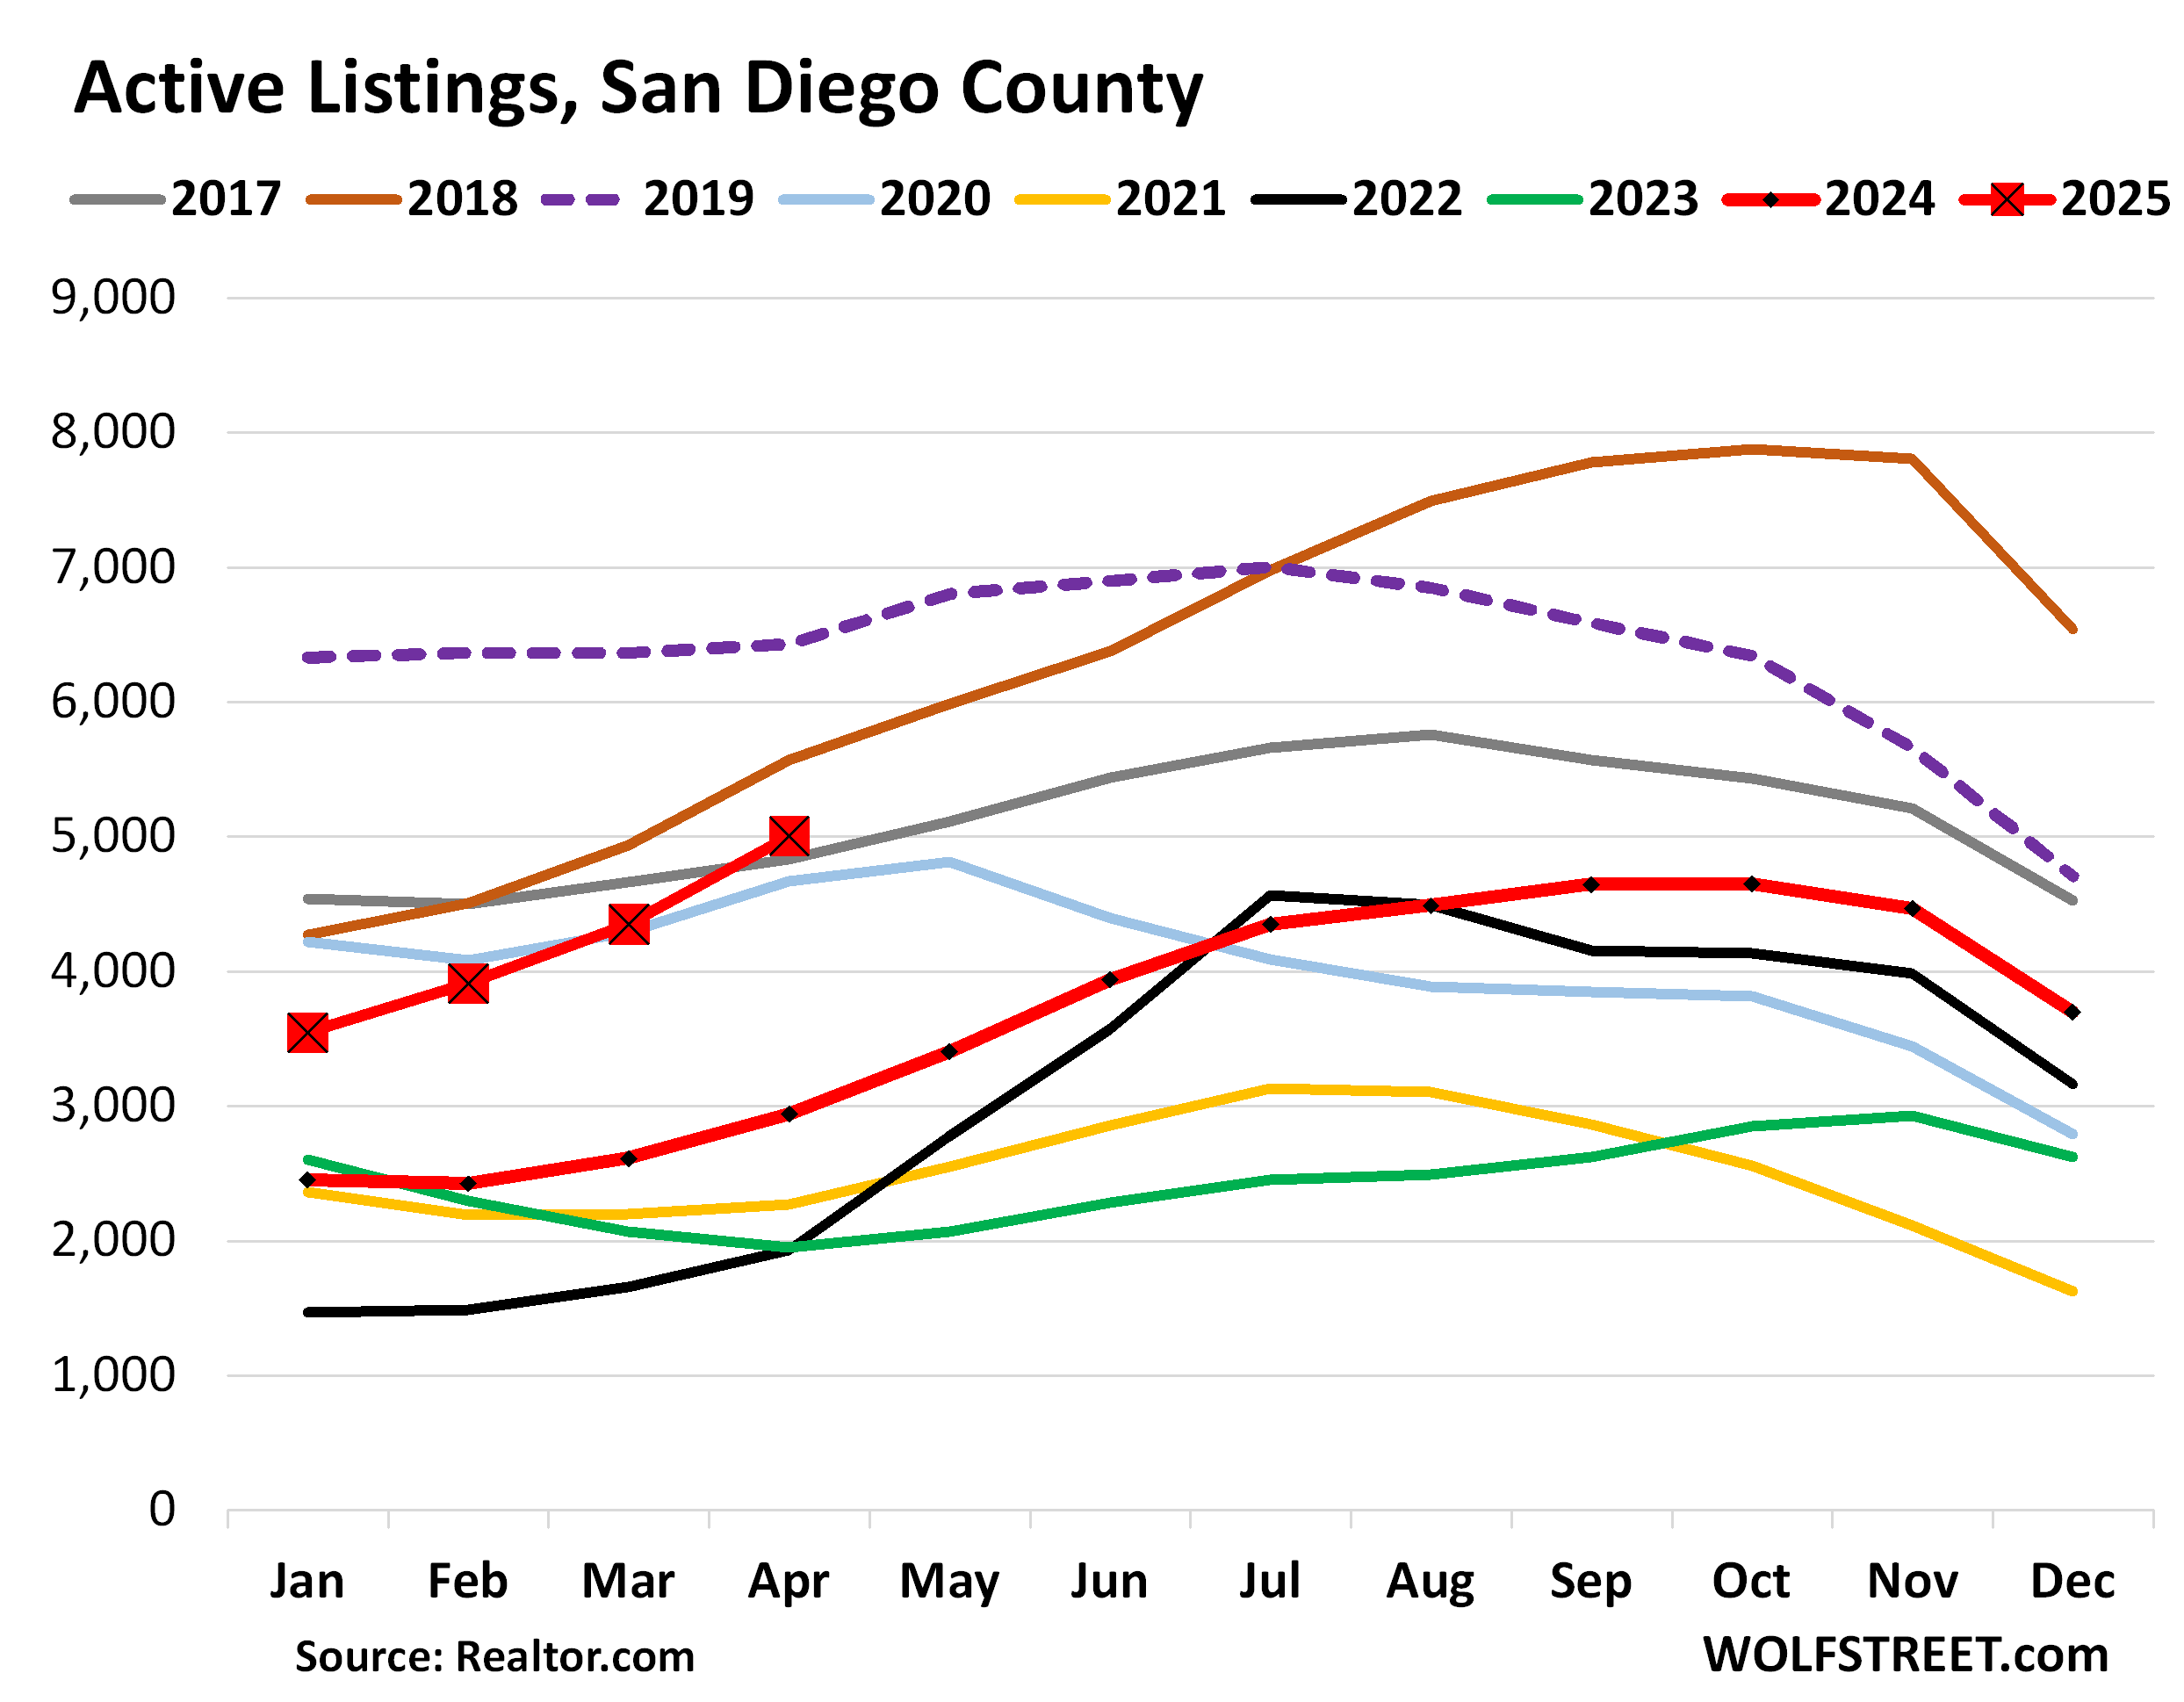
San Diego County: The surge of active listings got a late start, but it’s making up with a vengeance. Active listings spiked by 70% year-over-year, to 5,004 homes for sale, the highest for any April since 2019 and 2018, but higher than 2017, in the data going back to 2016.
Compared to 2019 (dotted purple line), active listings in 2025 halved the gap over the past four months, from being 44% below in January to being just 22% below in April.
State of California: Active listings spiked by 51% year-over-year, to 64,963 homes, the highest for any April in the data going back to 2016, except 2019 (dotted purple line).
Compared to 2019, active listings in 2025 went from being 32% below in January, to being just 12% below in April.
Not every market moves in lockstep, some are the first movers, others lag behind, but the inventory pile-up is now starting to play out all major markets in the state.
Obviously, a flood of inventory on the market is a good thing for this broken and frozen market of existing homes – it’s broken and frozen nationwide, with a generational multi-year plunge in sales volume – and maybe it can jar the market loose finally.
Enjoy reading WOLF STREET and want to support it? You can donate. I appreciate it immensely. Click on the mug to find out how:

![]()
Looking at that data, it appears that is the highest slope in the last 8 years. Why the rush to the exit?
Investors are watching the market and figure that the top is in and it’s time to get out.
Also, with travel being down and Canadians deciding the US is no longer a nice place to winter, the profitability of short term rentals is in decline. So, lots of folks taking their profits and heading to the exits.
Economic policy uncertainty has spiked more than 2x the previous record at the start of the pandemic. Inventory pileup is a decline in buyers, not an increase in sellers. Same story across the economy as those with capital sit on it due to uncertainty.
Three questions:
1) how much of a price decrease is needed to compensate for the extraordinary uncertainty increase?
2) what does the govt need to do to restore economic confidence?
3) if economic confidence restored, how quickly do buyers return to buying?
I think the reason is very simple: Buyers are not on strike but they are priced out. I know a lot of my friends wanting to buy even with this economic un certainty but they can as they are priced out due to high prices and escalating cost of owning a home other than mortgage.
It’s the same thing. The Fed took the free money away.
great
I live in SOCAL and people have been waiting for rates to drop. The whole date the rate scheme. People are now realizing Jpowell wasn’t joking when he said higher for longer.
The top is in. What could possibly happen in the next few months that would push this insane market higher?
Interesting timing, Nick from Reventure just posted a video about this. Sadly looks like OC is still the exception or hold out in comparison to LA or Riverside inventory spike. Plenty of delusional asking price to go around.
Make sense inventory is going up, as I said before, all of a sudden I am getting on average 5-10 emails from Redfin daily now on houses for sale on arras that I searched for from like ccouple of years ago…if these sellers keep asking for price like below for shoebox, it will be a giant inventory pile up very soon. Wonder if this time around, they will tried the same tactic as last year or two and pull houses off the market and wait for better day. Also interesting is that we are supposedly in prime Spring selling season…wonder what this Fall/Winter will look like
$560,000 $579,500
1 Beds · 1 Baths · 546 Sq. Ft.
Long Beach, CA 90804
I hear you but rest assured if LA, Rside or SD has inventory spiking, then OC would have the same. OC is not a magical place shielded from all these.
Just an anecdote: Got a flyer from realtor, saying in my neighborhood in SD, he sold a home for $500K more than asking price. Just can’t believe this madness.
Thanks WR for this report.
Phoenix_Ikki
“Sadly looks like OC is still the exception…”
No, OC is not the exception. It got started a little late, but is now making up for it: in April, active listings spiked by 75% yoy🤣
There are no exceptions.
Let me do a Mr Burns impression to no exception in OC…”Excellence…..” :)
Nick called the top a year early in June ‘21. And has been calling an imminent crash nationwide ever since. He’s an idiot and frustrated renter who doesn’t ‘consult’ for anybody. He has just managed to build a YouTube following by cherry picking data, saying it’s the eve of 2008 every week for 4 years now, and even gets quoted by the media as an expert. Stick with Wolf.
Why did you leave out Orange County CA?
Why did I leave out the other 60 counties?
Some because I don’t have all my data sets yet together — the five you see are the five I’ve put together so far; and others because they will never be included because I cannot put up 65 charts. So don’t even ask me.
But like I said, to make you fell better, OC active listings spiked by 75% yoy.
Oh no, not San Diego…I am sure someone will chime in and tell us not in that specific area of SD and price still going up and people sell overbidding…
I live in San Diego. Nothing is selling.
It comes on the market and sits, goes pending so agents can send out notifications to smart phones thinking we are all tooooo stooopid to know their game. Then it goes off market when people didn’t line up to buy their home for a price that is 100% higher than 2019.
It was just a matter of time before the housing inventory floodgates opened in CA.
You can already see the spike in #s and price cuts in the surrounding areas like LV and Phoenix where clownifornians love to “invest” in get rich quick schemes.
I just moved to San Pedro and home prices for shacks are insane here. Waiting patiently for the bottom to fall out.
A lot of listings on Zillow and Redfin in certain cities in SoCal are now showing up with price drop label, although the cut is still pretty pathetic.
It’s funny though once in a while, even now to see something sold with price increase and the previous wasn’t cheap .it will be something like listed for $1.15M but sold for $1.2m. I do wonder what’s going on with those and if there’s any funny business going on..
@wolf
“It’s not that new listings are that high; they’re not. It’s that the homes that have been listed for sale aren’t selling, and the new listings pile on top of it, and overall inventory is suddenly ballooning at an astonishing rate”
Is the average number of days on the market increasing? I’m curious if you happen to have that data too.
Very good article, thank you!
Yes it is, 43 days in April up from 37 days a year, and from 27 days in April 2022. But it’s a false measure of activity because it’s determined by two factors, one of which has nothing to do with sales:
1. how quickly sellers pull their homes off the market when it doesn’t sell;
2. how quickly homes that did sell, sold.
When sellers are aggressive in pulling their unsold homes off the market, the median days on the market declines. When sellers leave homes on the market for longer when they don’t sell, the median days on the market rises. It’s more of a psychological measure of seller confidence-frustration.
I wonder how 2019 compares to a “normal” market. Was 2019 just a standard pre-covid year in terms of listings?
As I explained in the article a COUPLE OF TIMES, active listings in the second half of 2018 and going into 2019 ballooned because of the Fed’s rate-hike cycle pushed mortgage rates to 5% for the first time in 10 years, and sales stalled and inventories ballooned. You can also see that in the charts how listings came up from 2017.
Not many will agree but for SoCal one can argue that it’s been in a bubble since probably after 2014 and beyond with 2012 being the somewhat return to norm after GFC…then Covid brought it to next level of insanity and all of a sudden majority think pre Covid is some kind of bargain fair value, smaller bubble for sure but not fundamentally cheap or affordable by conventional measure like income to home price ratio..etc.
We need a new business model for designing, building, financing, marketing, selling, and insuring homes. The current system is a broken, chaotic mess.
We also need a paradigm shift in our value system, which suggests that a fancy, big house with a fancy view is the epitome of success.
Wolf,
What do you think will break the the damn in regions such as the Mid Atlantic (western PA) and Ohio in terms of inventory? I know Pittsburgh doesn’t qualify for your price index tracking but am curious if you track any data from there.
I will eventually build a similar set for the key East-Coast markets and Midwest markets. But this stuff is tedious to set up and takes forever. So patience please.
I’d be more concerned about the number of houses for sale in California than in Florida.
One has a movement of people out and the other has an increase in population.
One is a high cost, high tax area and the other isn’t.
More people, lower costs, and less crazy government involvement will take care of the overhang in inventory over time.
The other…..