Homebuilders get more aggressive to sell the inventory, but prices are still far too high.
By Wolf Richter for WOLF STREET.
Despite huge inventories of new houses for sale, including completed houses, homebuilders have continued to build homes at an aggressive pace. Some of the big homebuilders, such as Lennar, have cut prices and thrown large incentives on the market, and their sales increased; while other homebuilders, such as PulteGroup, have been less aggressive on pricing and incentives, and their sales fell.
That kind of mix seen in Q1 earnings reports is also what the data from the Census Bureau today show: Inventories for sale are sky high, even of completed spec homes, but sales overall grew and were decent, while prices continue to wobble lower.
Single-family houses for sale at all stages of construction in March remained at 493,000 houses, roughly unchanged for the fifth month in a row, up by 8.4% from the bloated levels a year ago, and up by 49% from March 2019. All five months were the highest since November 2007. Inventories reached this level for the first time in October 2005, on the eve of the Housing Bust when oversupply and lack of demand nearly wiped out the homebuilders.
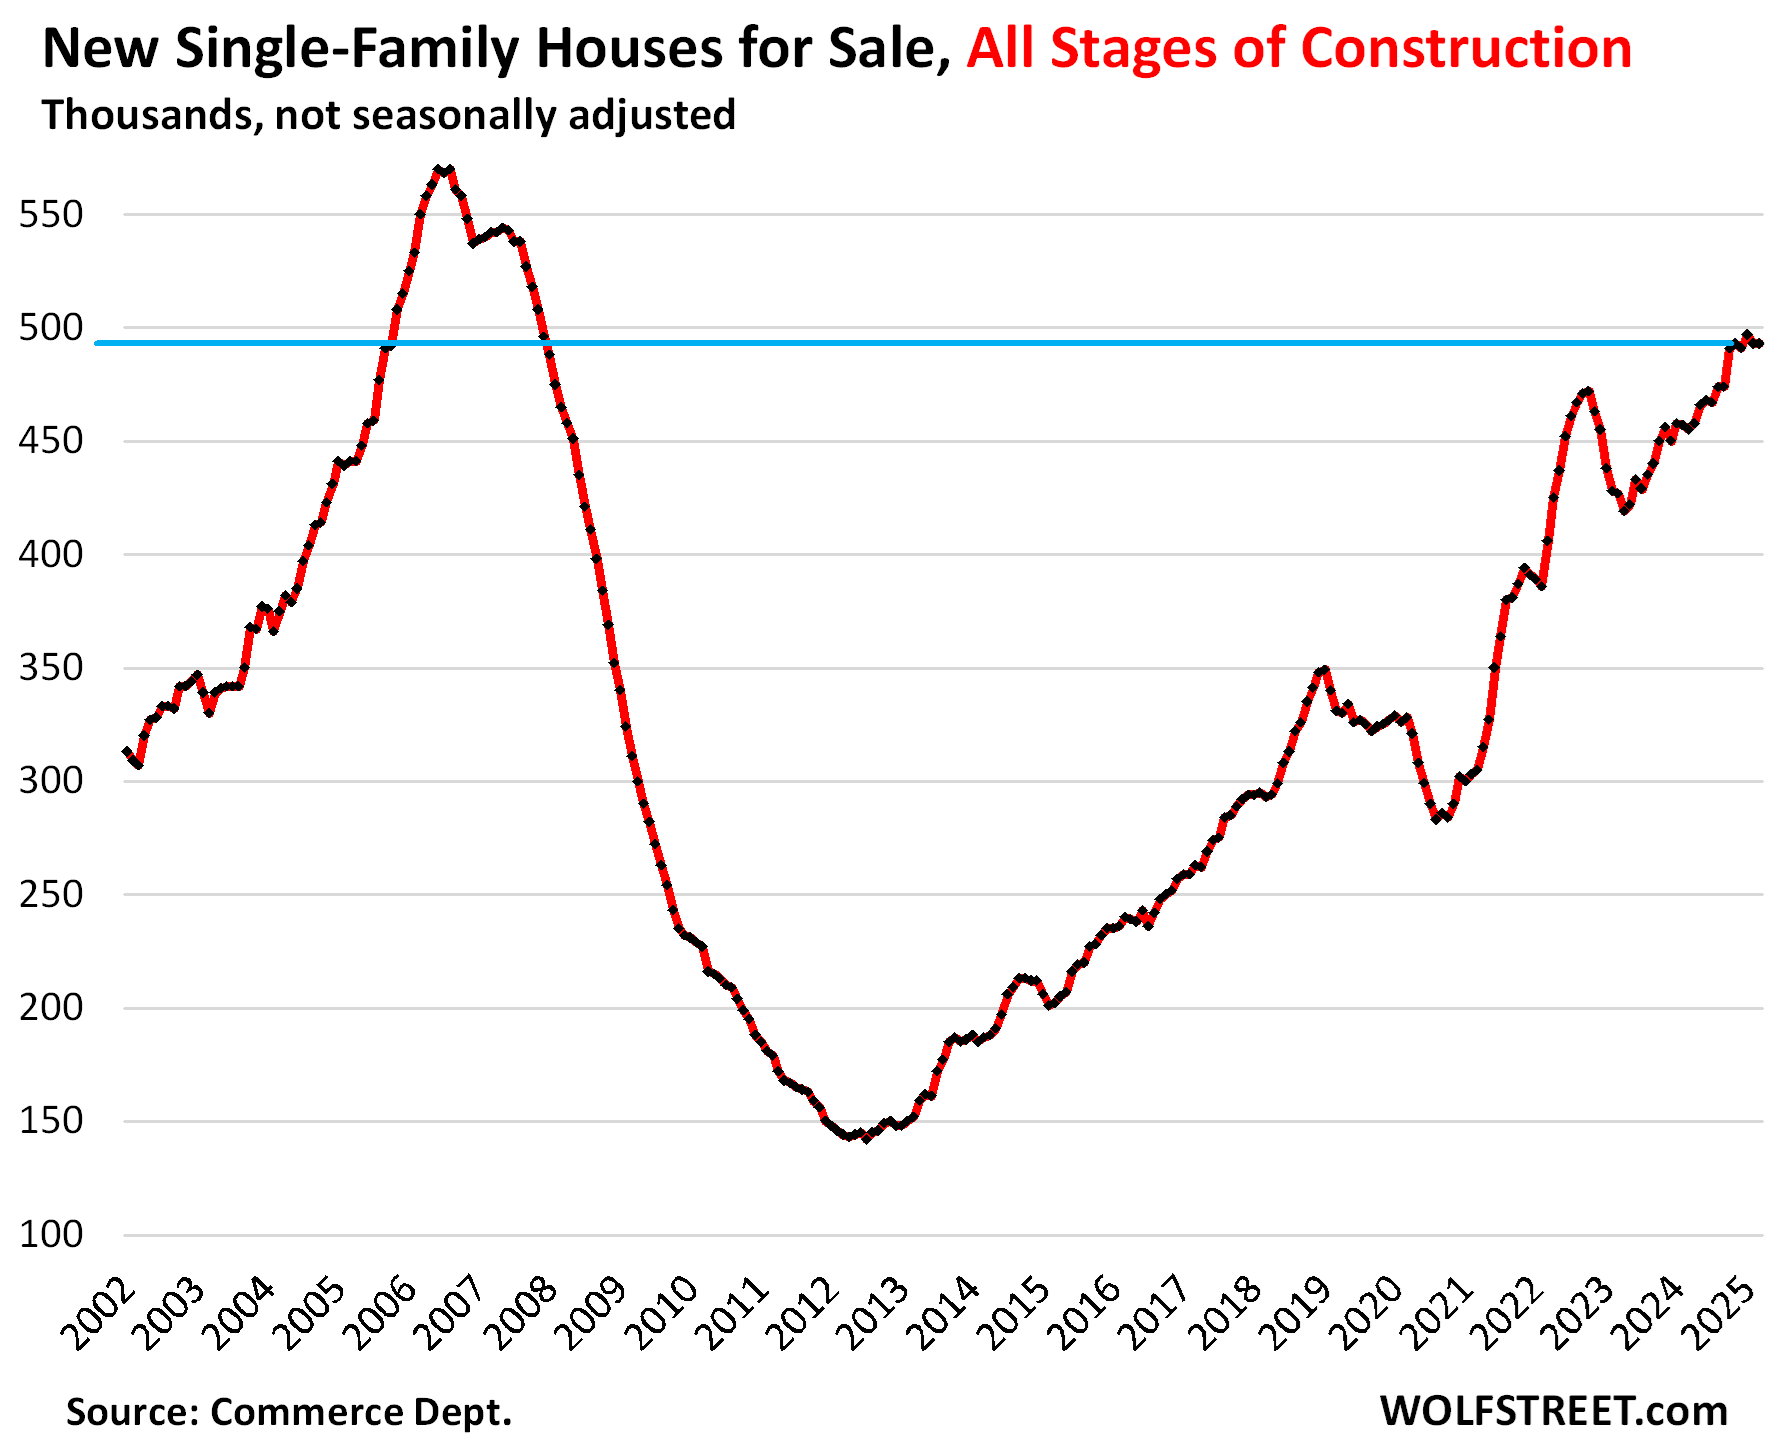
Inventory in relationship to demand: Thanks to brisk sales in March (see further below), supply improved to 7.1 months at the March sales pace.
A glut of new houses on the market is exactly what this overpriced housing market needs. And lower prices will bring out more buyers.
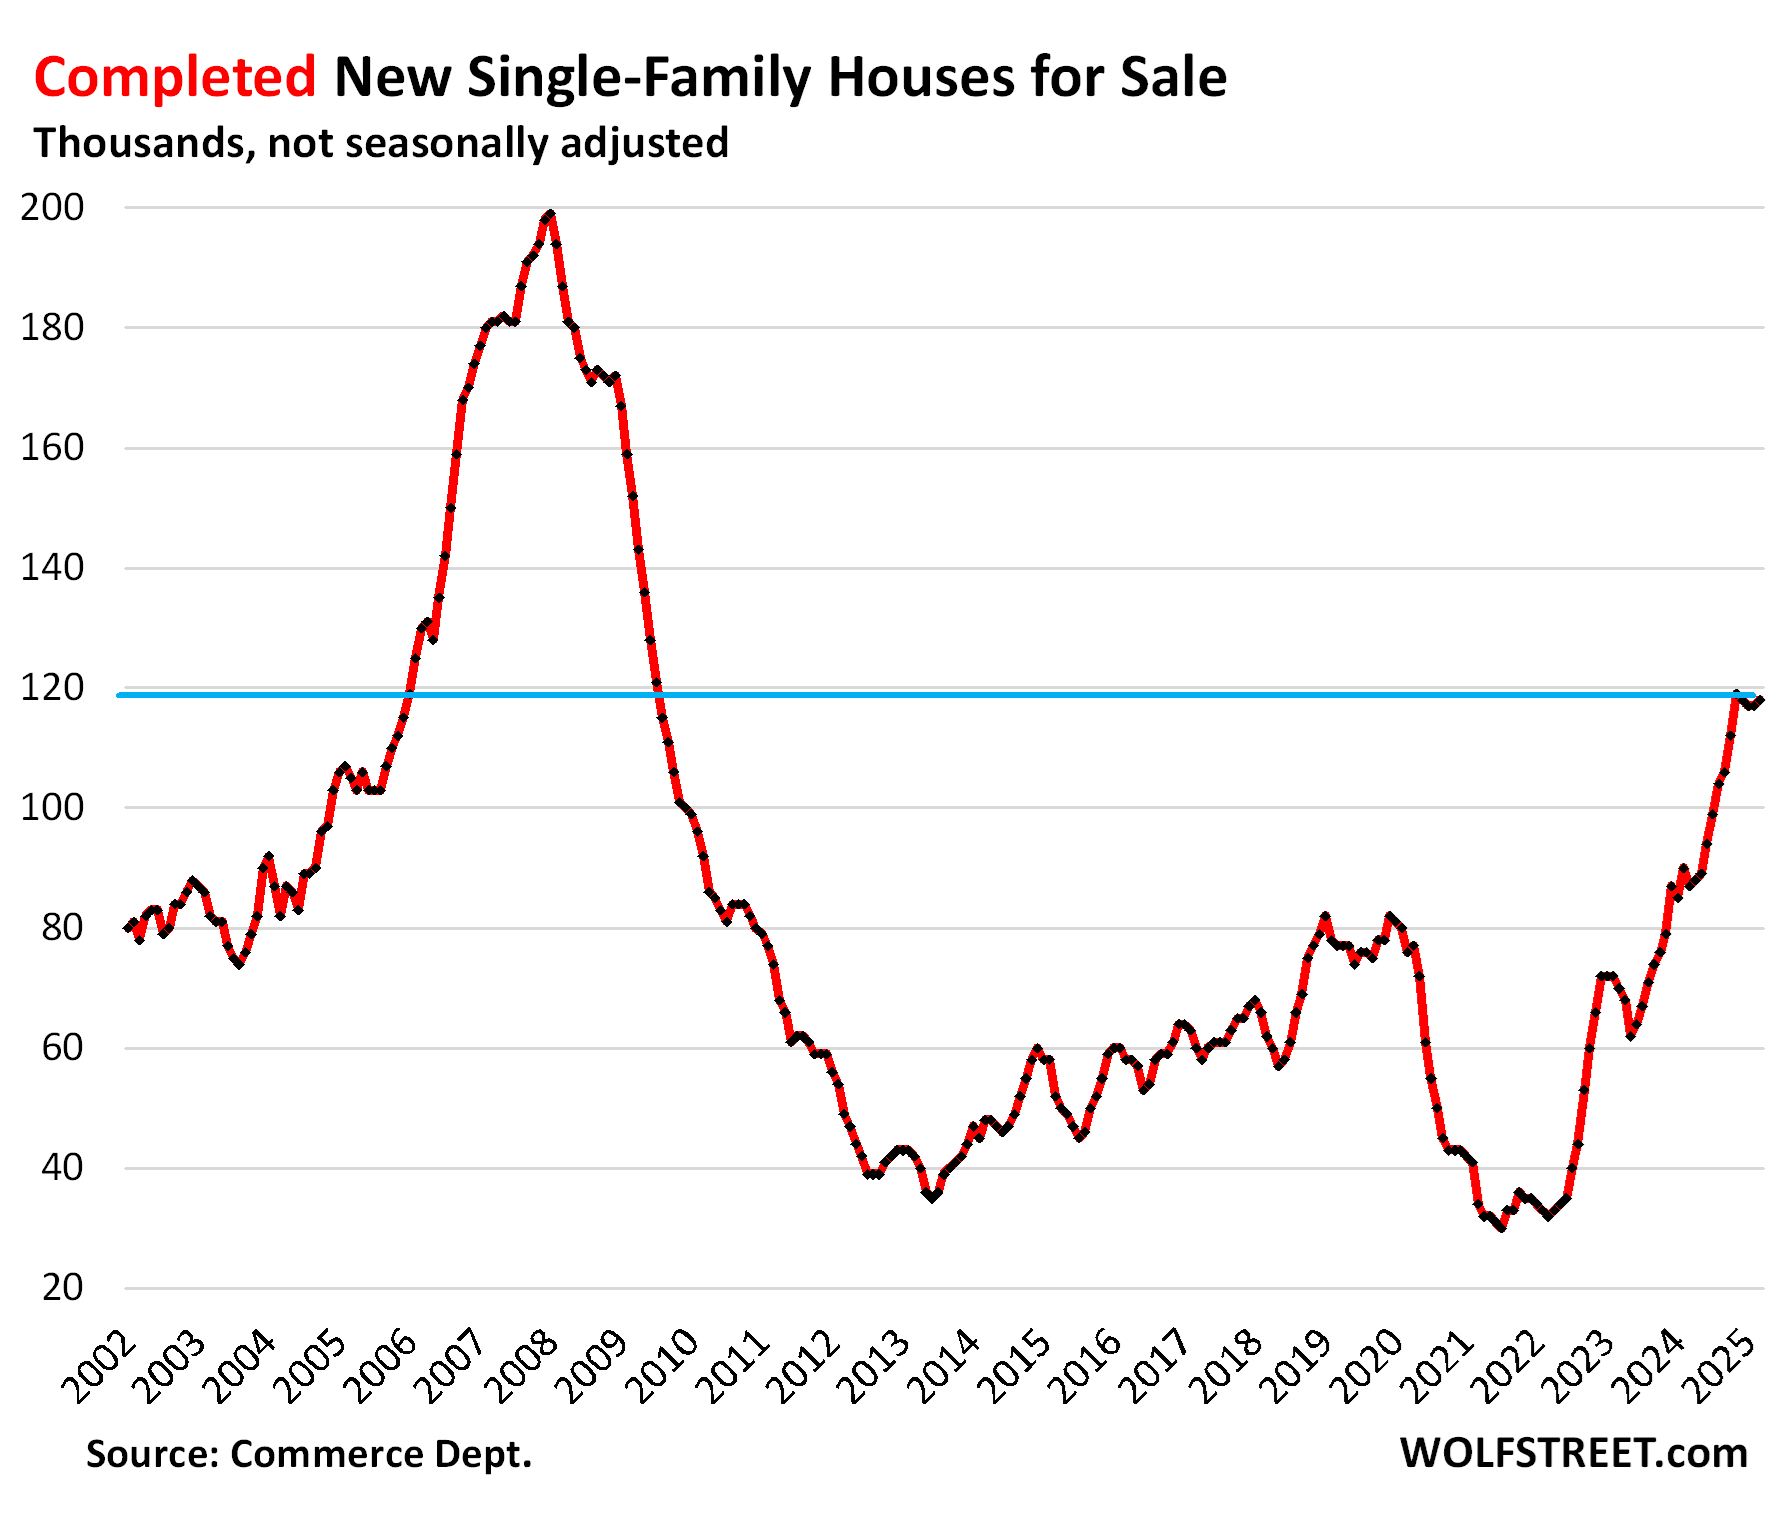
Inventories of completed new single-family houses for sale ticked up for the month and jumped by 36% year-over-year, and by 53% from March 2019, to 118,000 houses, roughly where inventories had been in January 2006, on the eve of the Housing Bust.
Homebuilders are motivated to sell spec houses quickly because they’ve sunk a lot of capital into them.
The homebuilders in Q1…
The publicly traded homebuilders have been shedding some light on how they’re dealing with this market, and their shares have zigzagged down from their highs in September, for example: DR Horton [DHI] -36%, Lennar [LEN] -39%, KB Home [KBH] -40%, and PulteGroup [PHM] -32%.
Lennar is an example of a builder that’s using lower prices and bigger incentives to increase sales, while sacrificing some of its profit margin. In Q1, year-over-year, according to its 10-Q filing on April 4:
- Average selling price (does not include costs of mortgage-rate buydowns): -1.2% to $408,000 “primarily due to continued weakness in the market.”
- Number of homes delivered: +6.2%, to 17,834 homes.
- Revenues from home sales: +5.1%.
- Gross margins: 18.7% compared to 21.8% a year ago.
“Gross margins decreased due to an increase in land costs year over year, as well as a decrease in revenue per square foot, which was partially offset by a decrease in construction costs as we continue to focus on construction cost savings,” Lennar said.
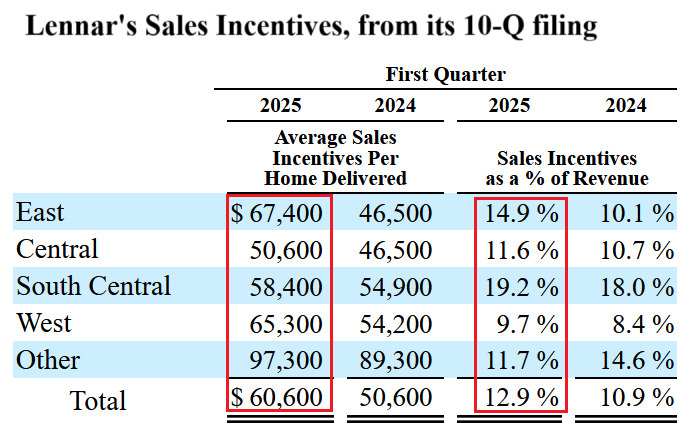
Lennar also lists its sales incentives per home sold by region. This includes the costs of mortgage-rate buydowns. Average incentives rose to $60,600 per home across the US, or 12.9% of the average selling price. These are huge incentives:
PulteGroup went the other way: higher prices, but lower unit sales, and lower revenues. It reported in its 10-Q filing on April 22:
- Average selling price: +6% to $570,000.
- Unit sales: -7.3% to 7,765 homes.
- Revenues from home sales: -1.8%.
- Gross margin 27.5% compared to 29.6% a year ago.
Homebuilders still have big-fat profit margins and net incomes — though they’ve come down — and have lots of room left to cut prices if the market forces them to before they start booking losses. For example, Lennar still booked $519 million in net income in Q1, though that’s down by 28% from $720 million a year ago. PulteGroup still booked $523 million in net income in Q1, though that’s down by 21% from $663 million a year ago. They’re not at the end of their rope of price cutting.
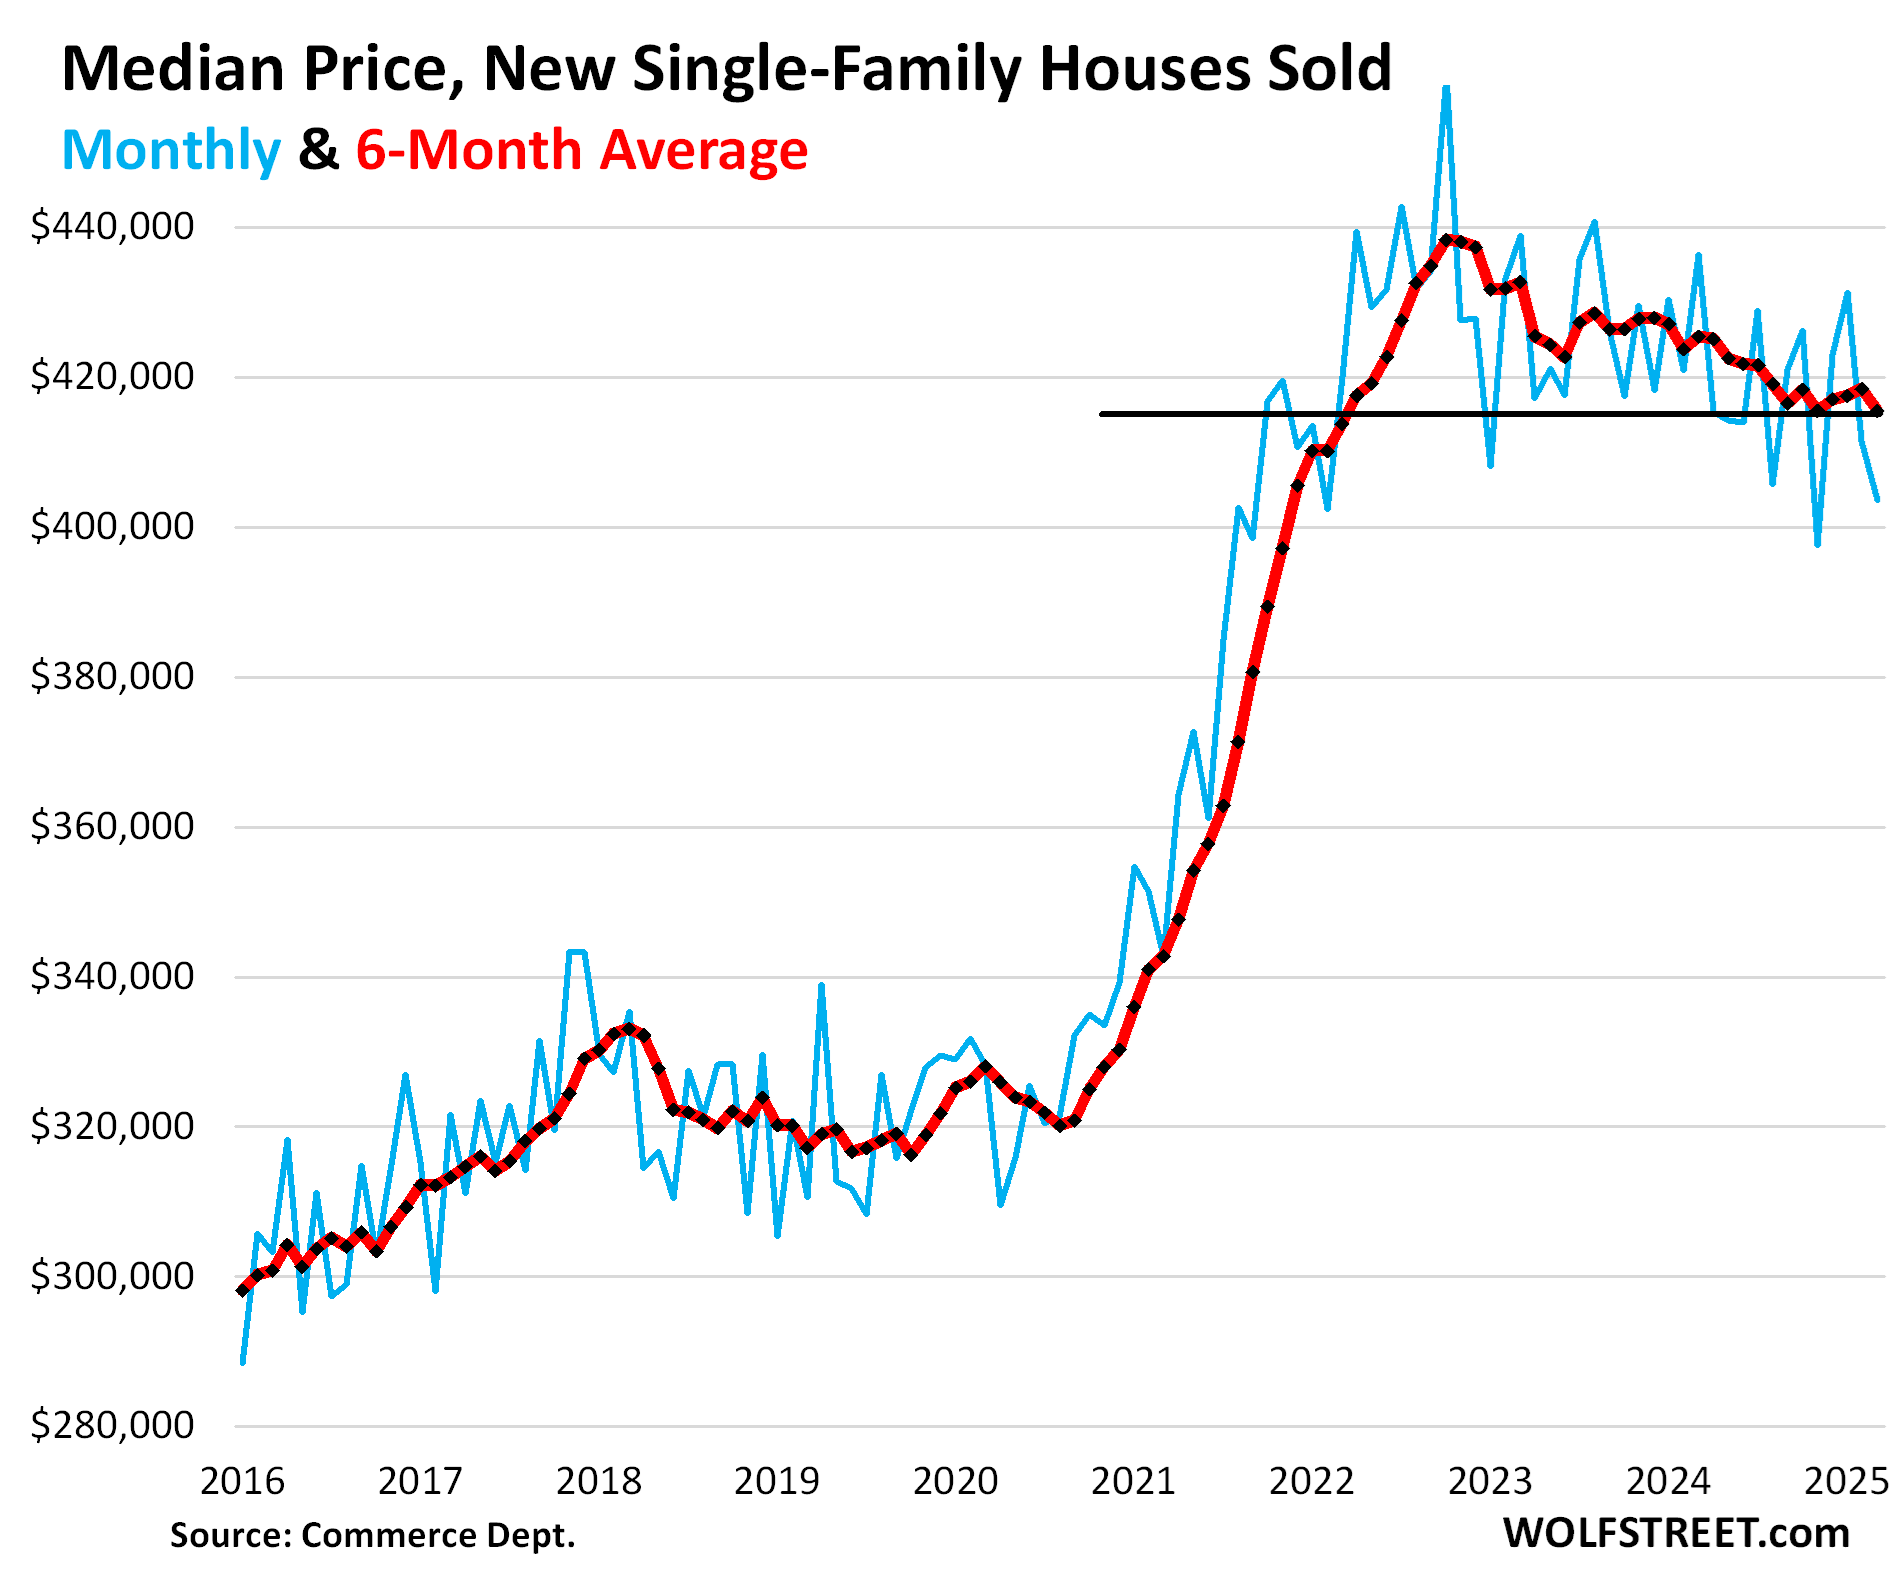
Overall prices continue to wobble lower.
The median contract price of new single-family houses at all stages of construction that sold in March fell to $403,600, down by 7.5% year-over-year, down by 8.0% from two years ago, and down by 12% from the peak in October 2022, according to the Census Bureau today (blue).
The six-month average, which irons out the random monthly ups and downs and includes the revisions, fell to $415,567, the lowest since March 2022 (red).
But these contract prices do not include the costs of the mortgage-rate buydowns and certain incentives, such as free upgrades. On the builders financial statement, some incentives show up in the price of the home sold, the remainder, such as mortgage rate buydowns, is taken against its gross margin
Lennar’s breakout of incentives (see table above) sums the total costs of all incentives, including mortgage-rate buydowns that are not part of the contract prices reflected here.
Inventory for sale by region.
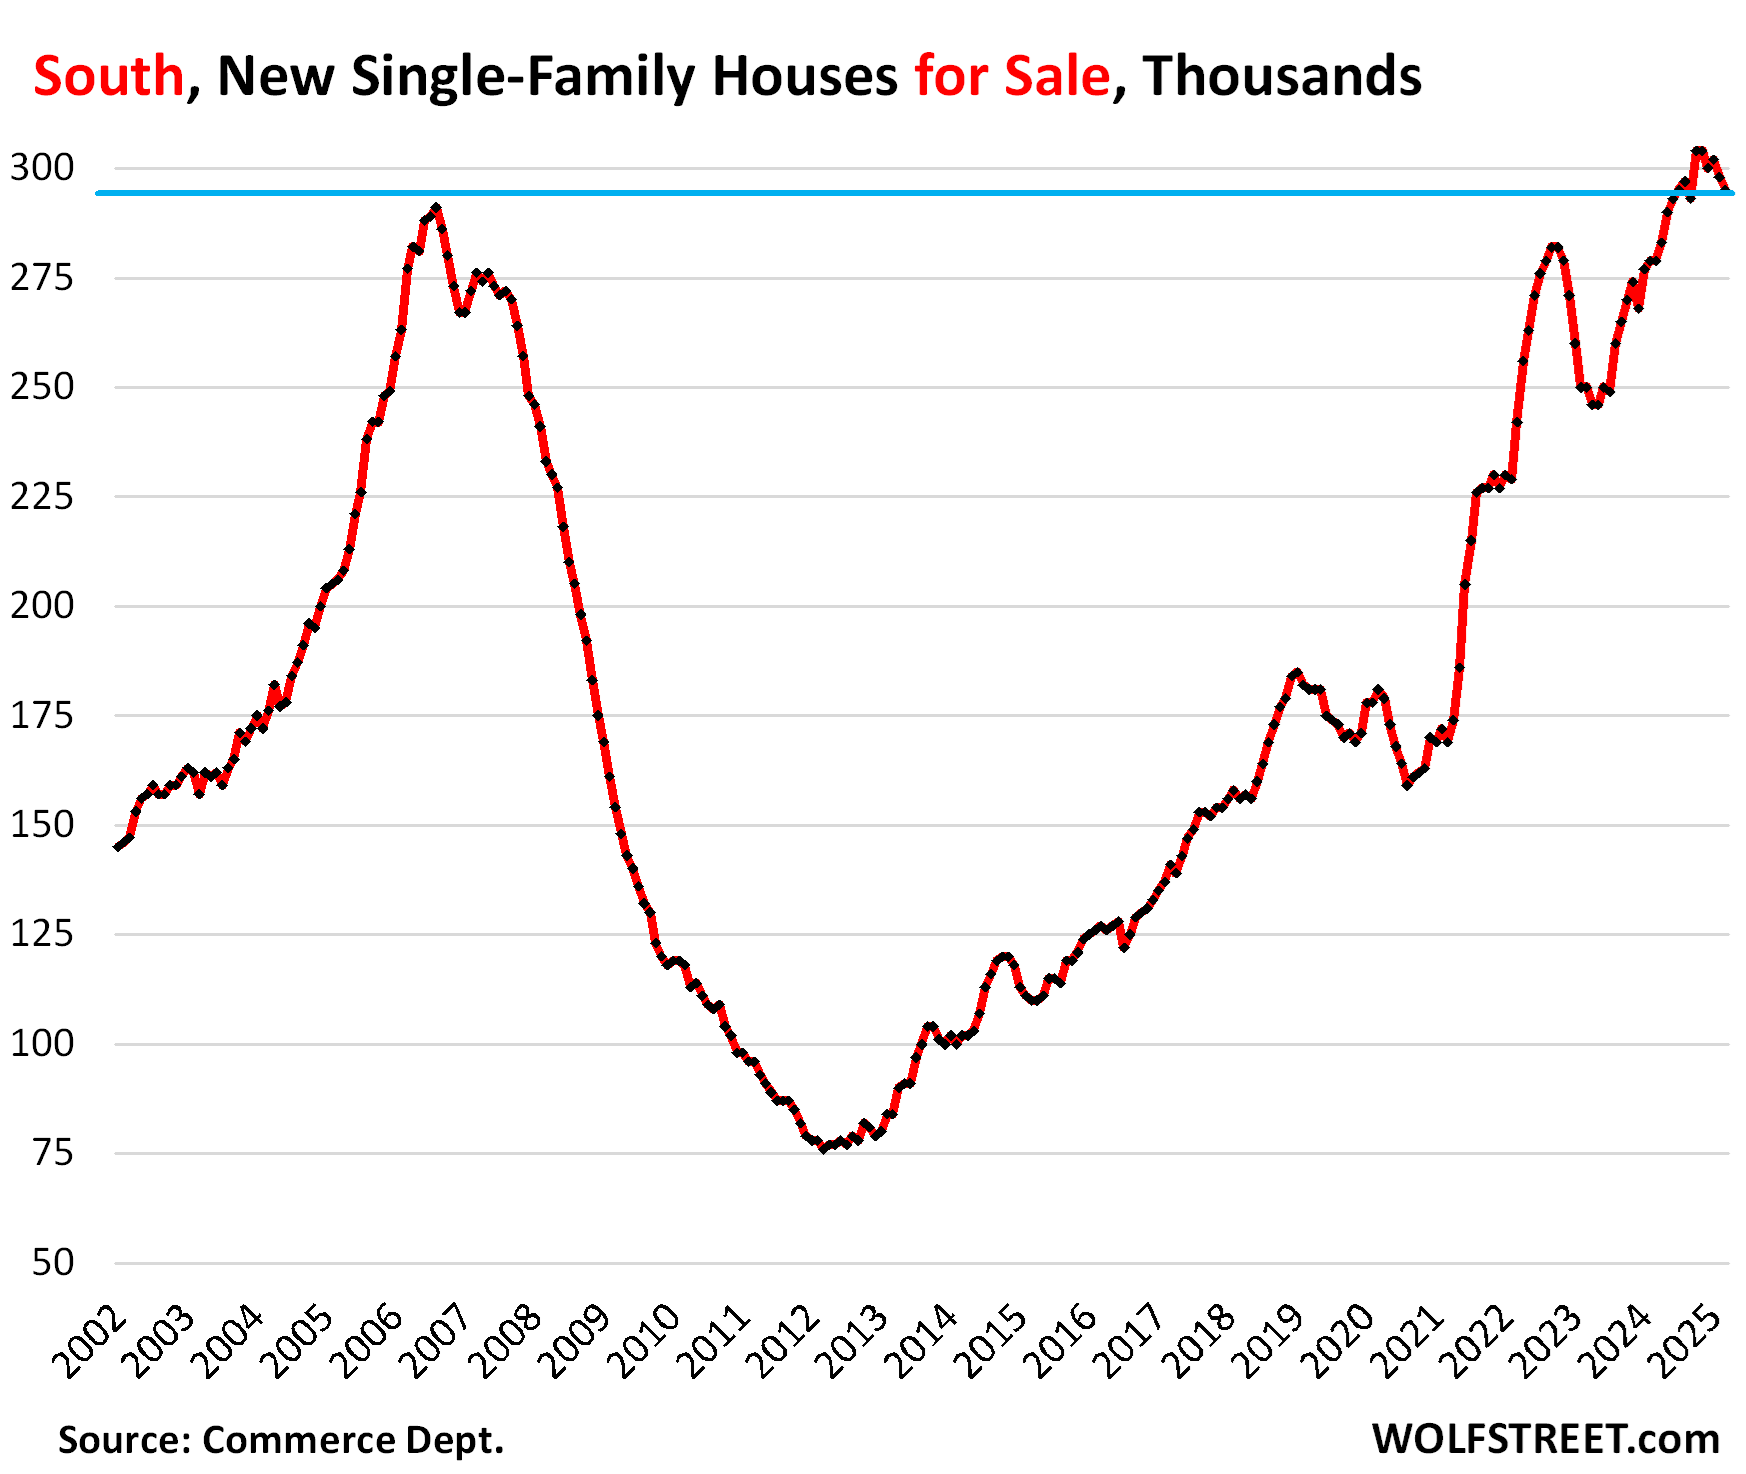
In the South, inventories of new houses for sale at all stages of construction dipped to 295,000, still above the peak levels during the Housing Bust, up by 5.7% from the bloated levels a year ago, and by 63% from March 2019!
Inventory for sale has been above the Housing Bust peak since May 2024.
The huge Census region, dominated by Texas and Florida, is by far the largest market for new houses in the US, accounting for 60% of US inventory, and for 67% of US sales (a map of the four Census regions is below the article at the top of the comments).
Large incentives and lower prices by homebuilders stimulated sales, which jumped by 21% year-over-year and also by 21% compared to March 2019. Supply declined to 6.4 months, but was still 35% higher than in March 2019.
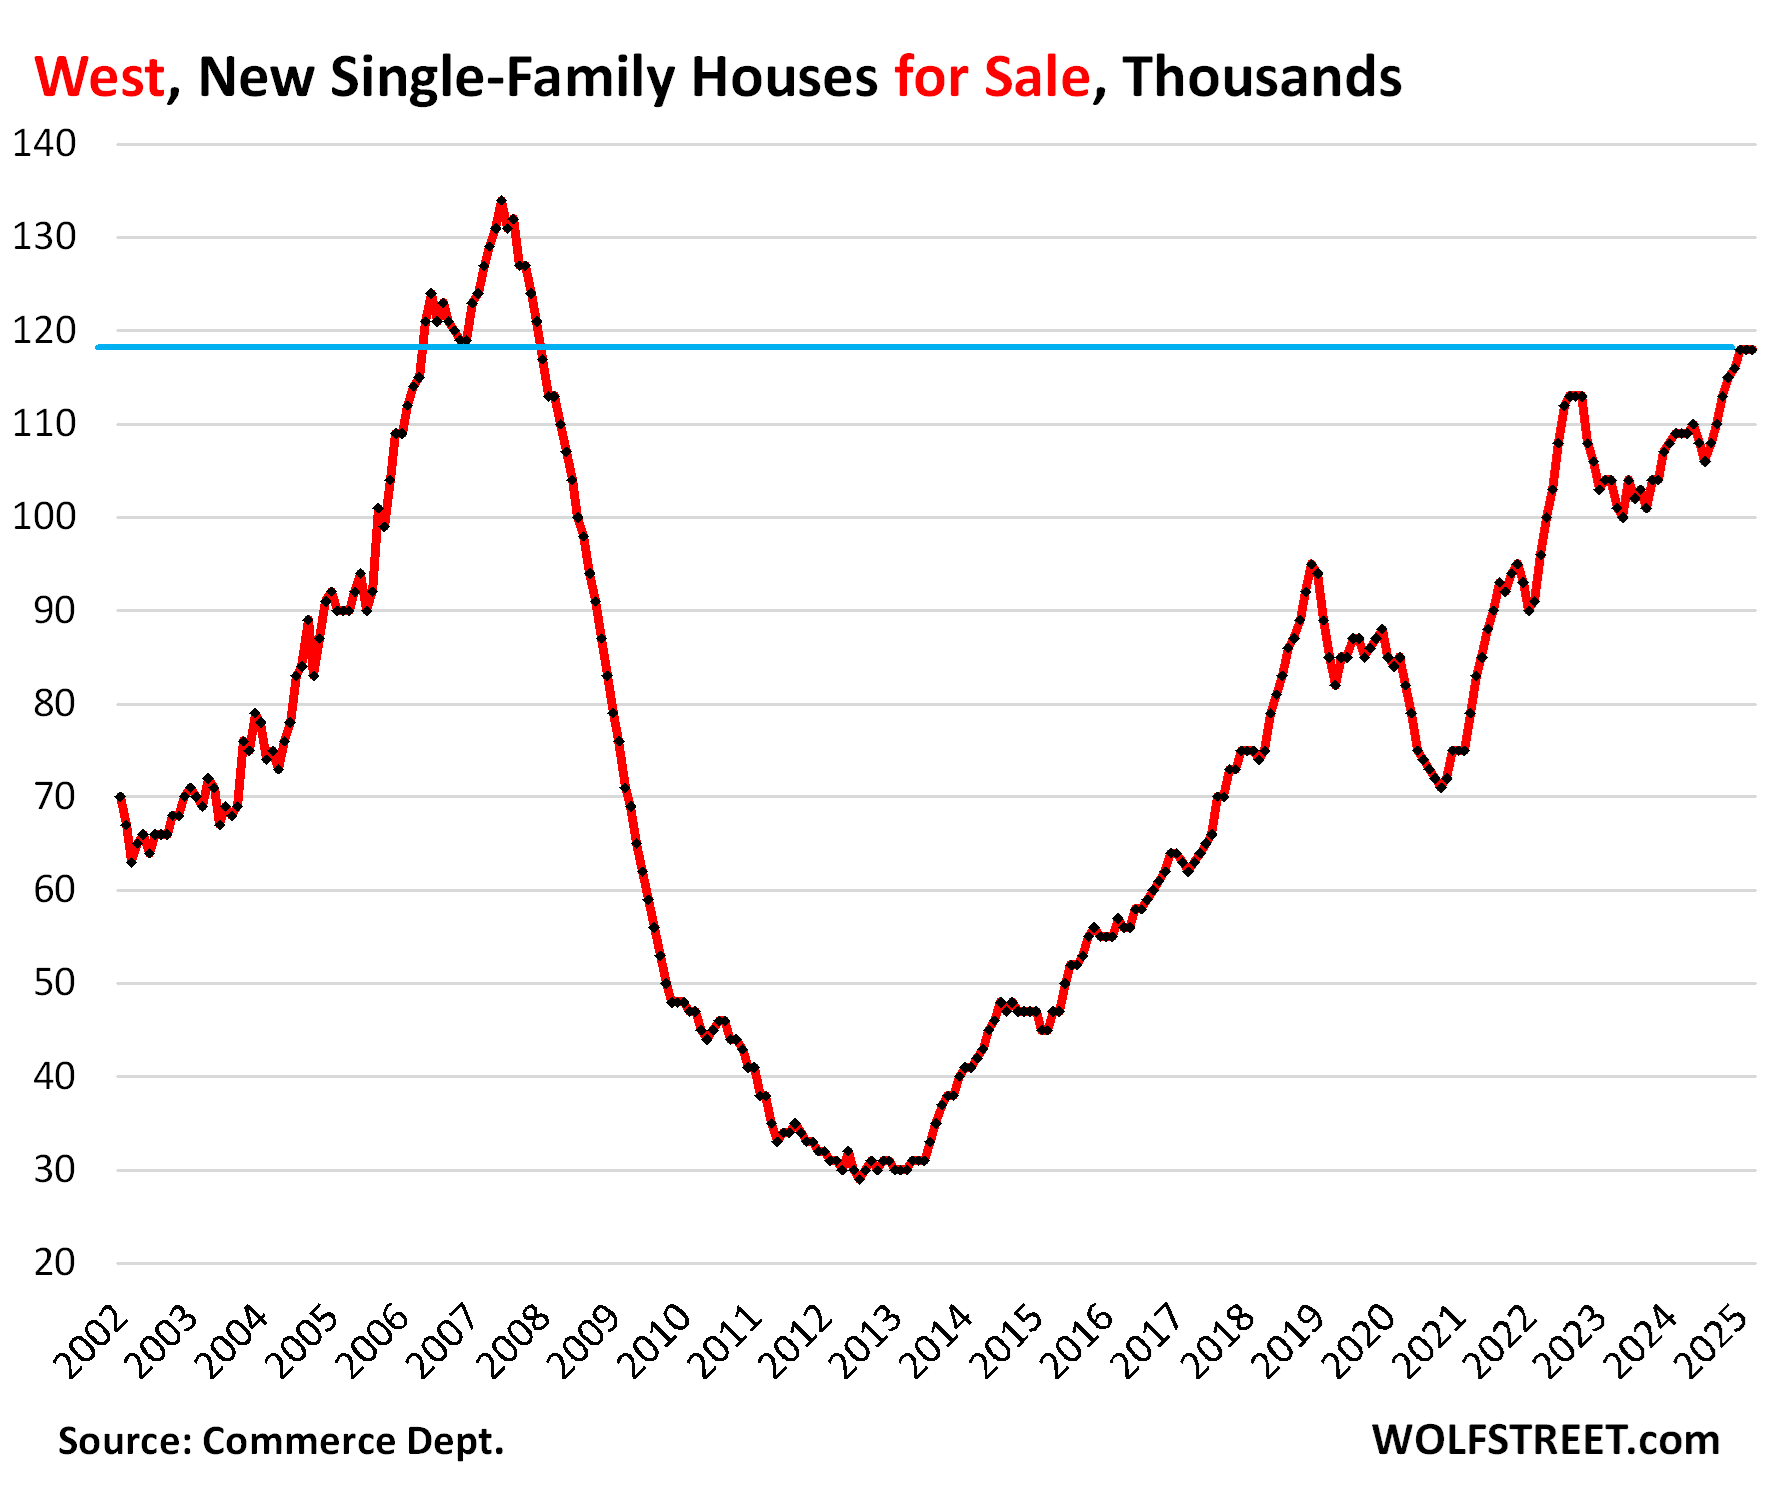
In the West, inventories of new houses for sale at all stages of construction remained at 118,000 for the third month in a row, up by 8% year-over-year, up by 39% from March 2019, and where they’d been in December 2006 as the Housing Bust was getting going.
The West accounted for 24% of the US inventory and for 19% of US sales in March.
Sales in the West fell by 13% from the already depressed levels a year ago, and by 35% from March 2019.
Supply remained at 9.1 months, up by 25% from a year ago, and more than double (+114%) where it had been in March 2019! Clearly, the price cutting needs to get serious to simulate sales and work down this inventory:
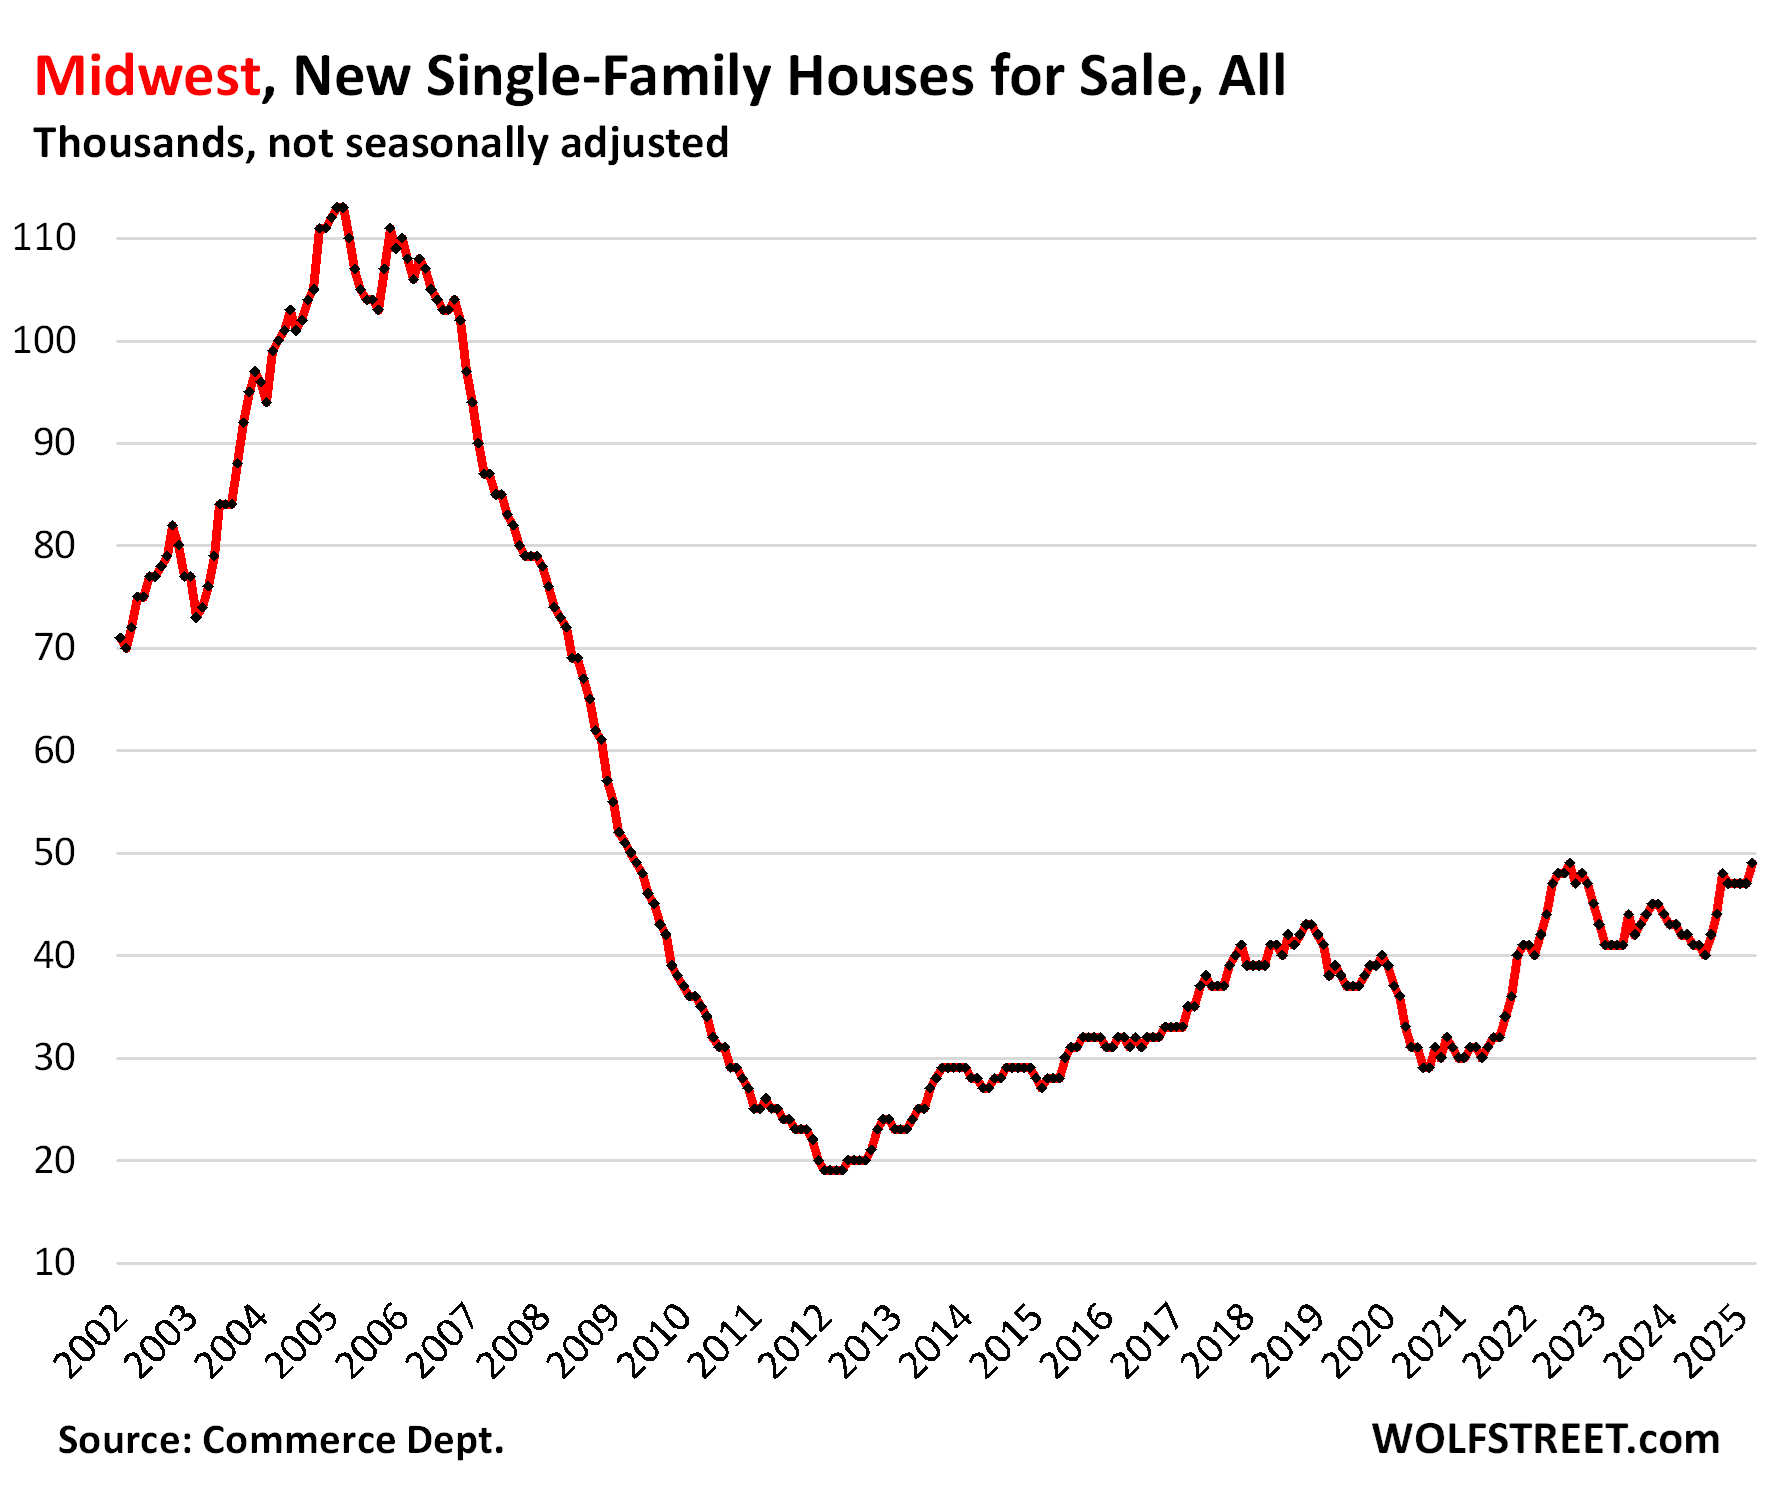
In the Midwest, inventory rose to 49,000 new houses for sale, up by 17% year-over-year and up by 29% from March 2019.
Sales, at about 7,000 houses, were down about 12% from a year ago and from 2019. Supply dipped to 7 months.
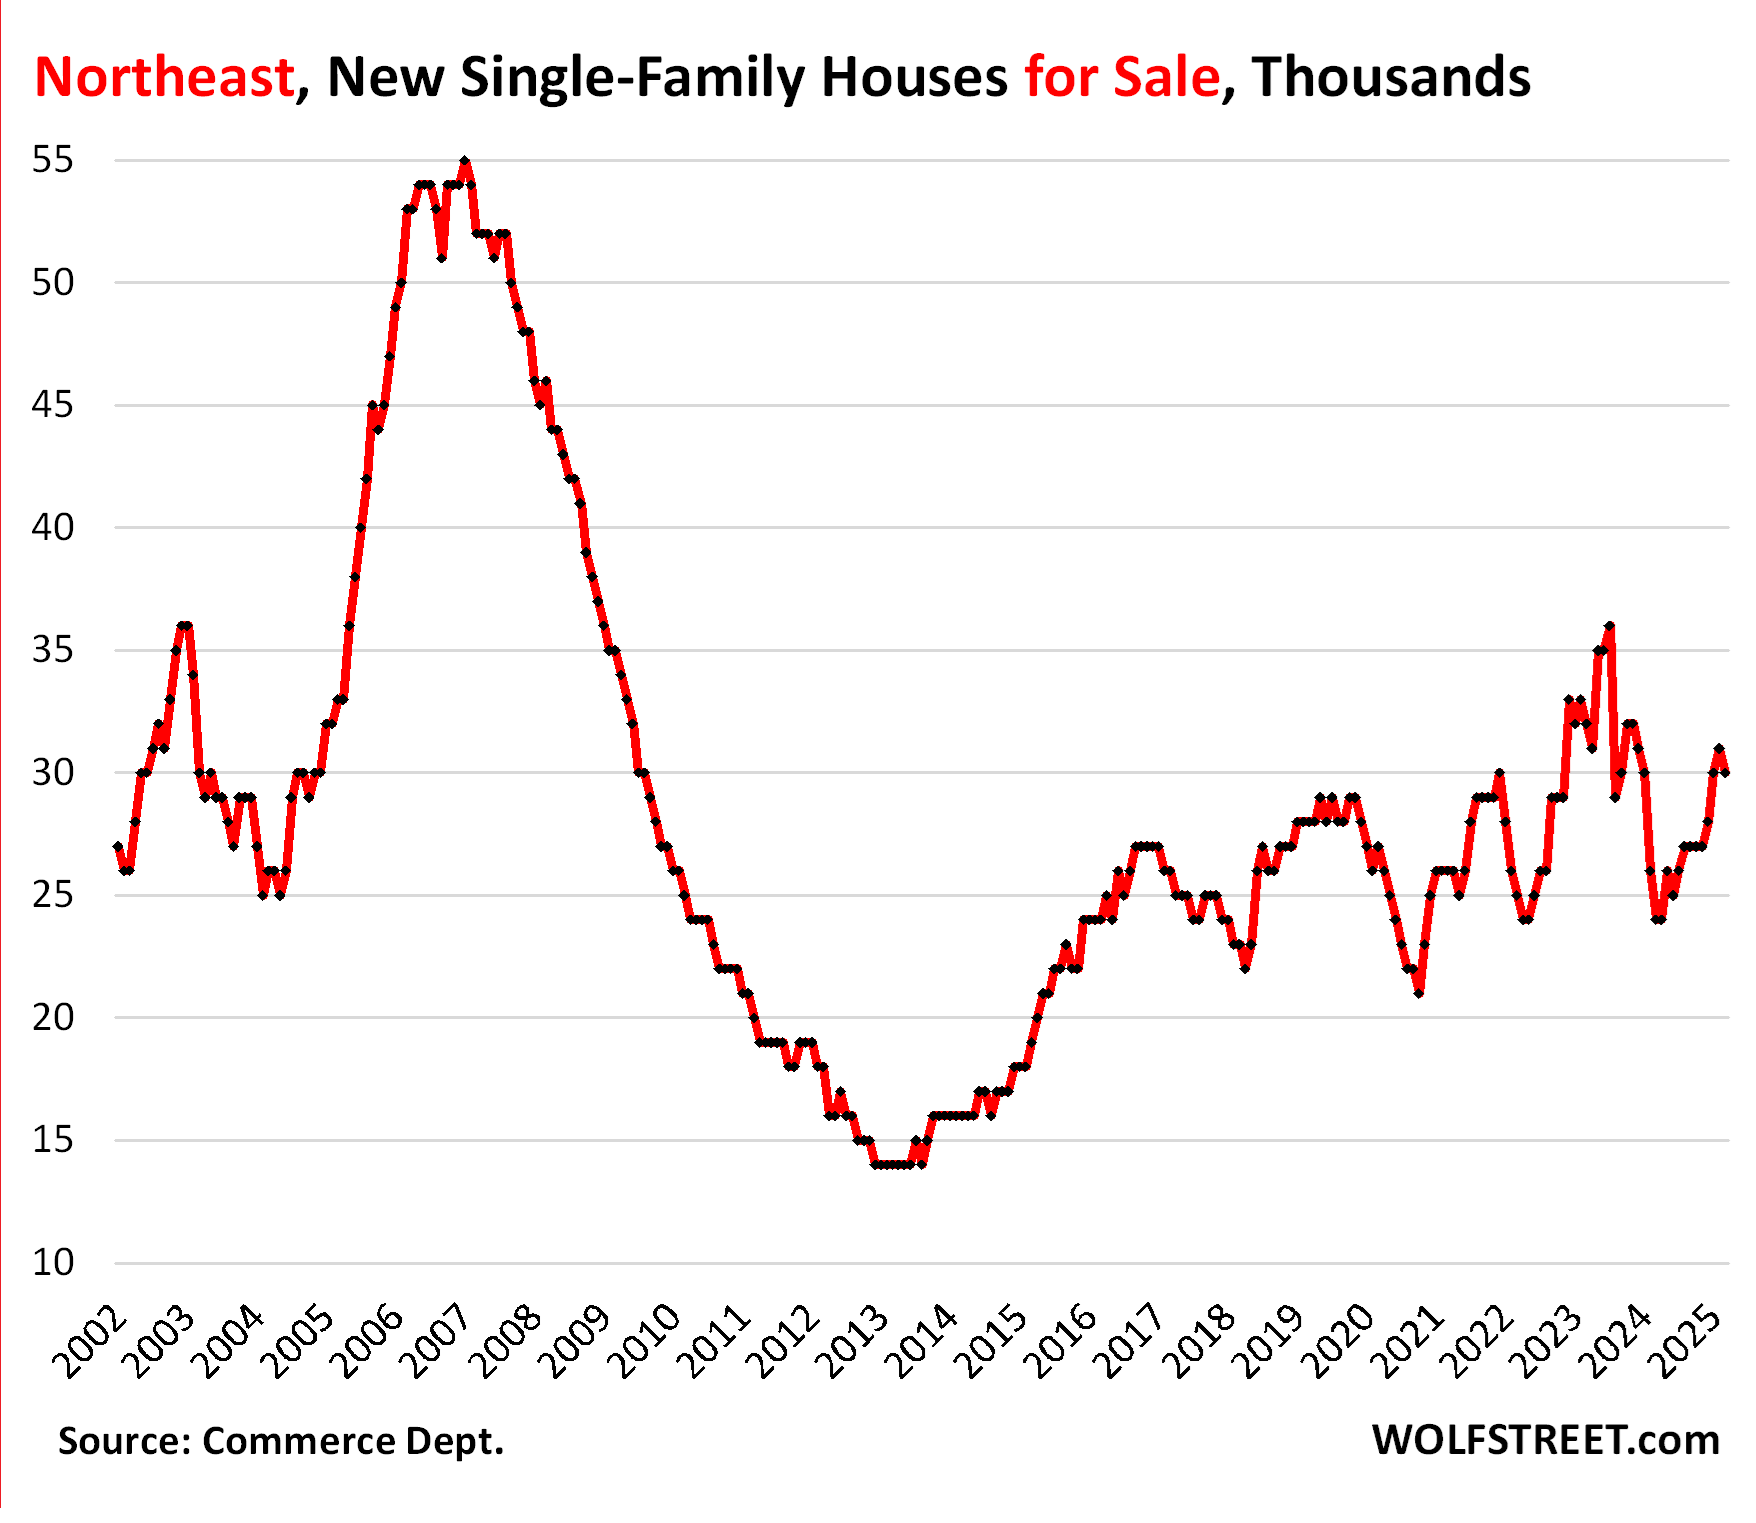
In the Northeast, inventory at 30,000 new houses for sale, was up by 25% year-over-year and by 7% from March 2019.
Sales of about 3,000 houses in February were down from a year ago. Supply rose to 10 months.
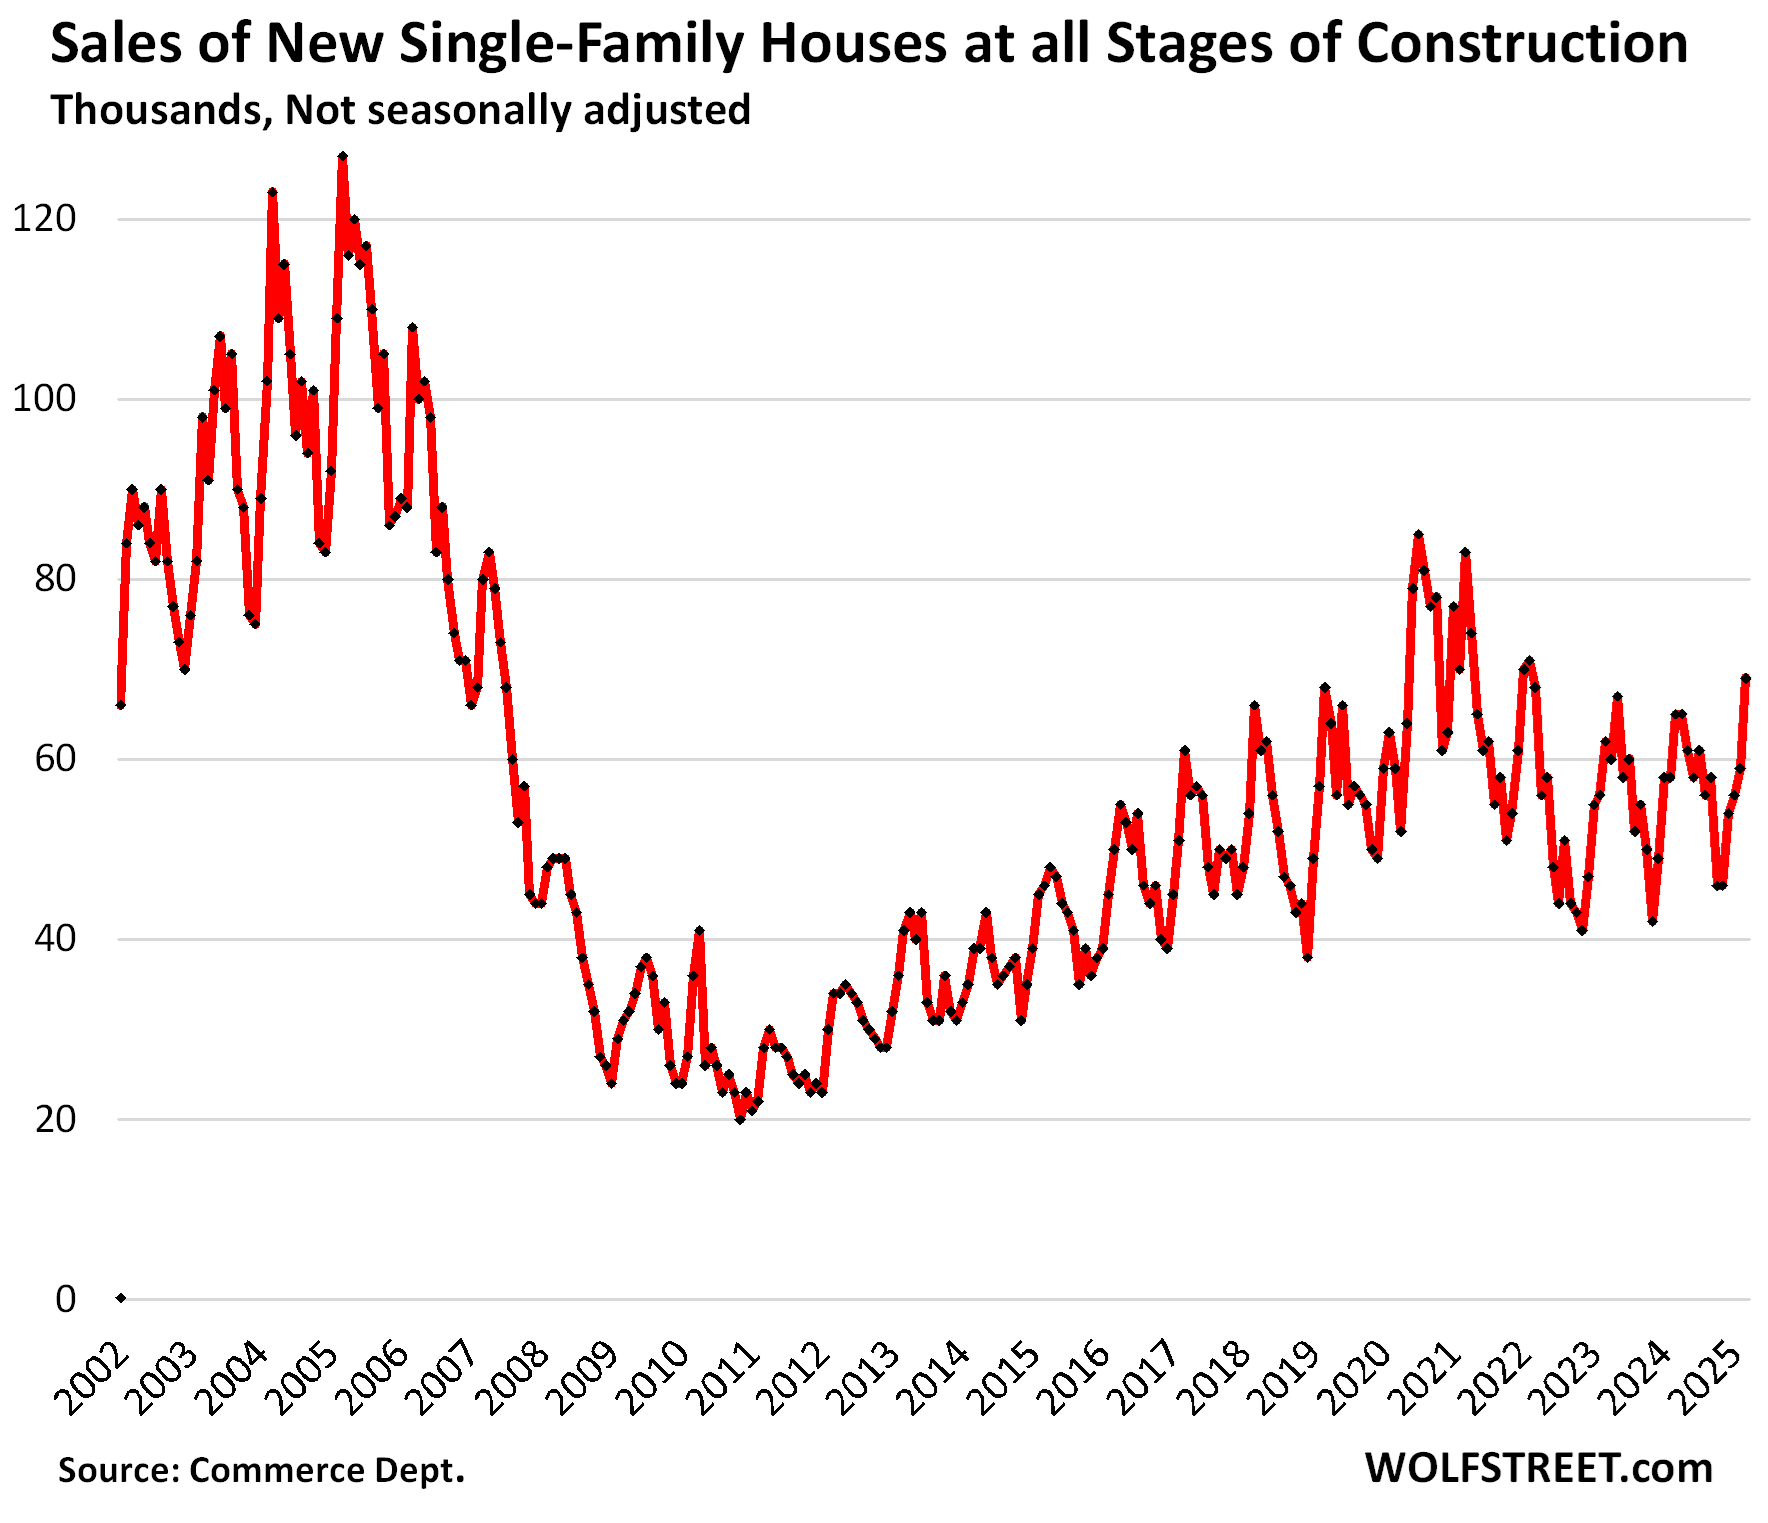
Sales overall rose to decent levels.
Sales of new houses at all stages of construction rose by 6.2% year-over-year, to 69,000 signed contracts, not seasonally adjusted, the best March since 2021. The sales increase in the South (see above) overpowered the sales decline in the West. Compared to March 2019, sales were up by 17%.
Supply dipped to 7.1 months at the strong March pace of sales, down from 7.6 months a year ago.
Overall, the builder strategy of cutting prices and throwing incentives at the market, such as mortgage rate buydowns, has been working, compared to existing homes sales that have remained at collapsed levels for over two years.
Enjoy reading WOLF STREET and want to support it? You can donate. I appreciate it immensely. Click on the mug to find out how:

![]()
The promised map of the four Census regions of the US:
It’s going to take a while to bounce back
A slow grind downward will explode the myth that owning a house creates “generational wealth”…
Takes a little bit of luck. Bought in July of 2012. My kids are all set.
Nice work wolf, is there a way to adjust the charts by households? There are a lot more households now than in 2006-2008 so maybe the housing glut is a bit overestimated, but it is definitely there.
I also wonder about the comparison to 2008. 2008 it was just build build build build. Now we are building but the demand has dropped because prices and mortgage rates are insane.
Something has to break, but I don’t think the break will be that bad. As you have pointed out, sellers will still make money or at least break even.
“Sellers will still make money” as long as they didn’t do a cash-out refinance to keep the pandemic spending spree going.
eric,
“…is there a way to adjust the charts by households?”
The number of households is irrelevant. Not many households will ever buy a new house. Most will buy an existing house, or a condo, and many rent. So forget households. It’s a nonsense comparison. I don’t know why this keeps coming up. I sound like a broken record. Is someone circulating some BS out there about it?
What matters is DEMAND = sales. And this is a big part of the article. See the sales figures, and see the “supply” figures which express inventory in relationship to sales, such as 7.1 months supply at March sales pace for the US overall, 6.4 months in the South, and 9.1 months in the West.
Ahhh thank you!
I judge my understanding of the concepts in Wolf’s articles when I know which comments he’s going to respond to and how he’s going to respond.
make money in real terms or in nominal terms?
I don’t think they’ll be a big foreclosure crisis is what I mean
So what exactly do you think is going to happen to the 1 million FHA loans in serious default?
Let’s not talk about any other type of loan, just FHA that is the biggest government fraud ongoing right now with many people now just walking away from their mortgage payment.
Do you think these homeowners, some of which have not made a payment in 4+ years under the last president, are just going to get a free ride for the next 20 years without ever paying a single payment? And they are just going to get repeat loan forbearance and modification until the day they die?
The can kicking has been going on since the GFC. The rug pull is coming. Its a matter of when, not if.
Same BS over and over again (you saw it on YouTube, right?). You people have to understand that when property prices shoot up 50% in three years – most of these mortgages are pre-pandemic mortgages – and if there is a default, the homeowner can sell the home, pay off the mortgage, pay off the arrearage, pay the fees, and walk away with plenty of cash for down payment on another home. If they do that, there is zero impact on the housing market: add one unit, take one unit off (+1 -1 = 0). During forbearance or mortgage modification, they tack on the missed mortgage payments to the end of the mortgage, and when the borrower sells the home at current price, the above happens. That’s why there is no push to foreclose on these owners. They’re still in the money with their homes despite the arrearages. Home prices will have to plunge a whole lot to cause problems with this.
What wolf said lol
chicken and egg. with prices where they are, foreclosures won’t happen because as wolf said, they can sell and pay back their loan.
but if prices start to drop, it could cause a snowball effect where people do walk away from their homes, especially if unemployment ticks up too. then those sale prices drop and the loans can no longer easily be paid back with the proceeds.
https://www.financialservicesperspectives.com/2025/04/updates-to-the-updates-of-fhas-servicing-loss-mitigation-and-claims-processes/
Some important changes to FSH foreclosure process is coming in September 2025. Going back to prepandemic rules!
If new home is in la la land with their high price and growing inventory…the used home market is in next level la la fantasy land, especially seeing how sellers don’t have special incentives like home builders can throw in. Case in point below, had a good chuckle at some of the used home prices in SoCal from Redfin email blast….they are all hanging onto those 2022 prices with kung fu deathgrip..
$1,465,000
4 Beds · 3 Baths · 2,111 Sq. Ft.
Long Beach, CA 90815
$1,675,000
3 Beds · 2.5 Baths · 1,745 Sq. Ft.
Long Beach, CA 90804
$824,888
2 Beds · 3 Baths · 1,026 Sq. Ft.
Long Beach, CA 90804
$1,198,000
4 Beds · 2 Baths · 1,945 Sq. Ft.
Placentia, CA 92870
The sad part (for the obstinate owners) is that when this thing blows over, those houses will be selling for less than half of those prices. Less than half! Kung Fu death grip. 😁 🥋
I’ll take the other side of that bet. You need a crisis of forced sales and major build up of months supply to get prices to drop even modestly. I don’t see how nominal home prices decline 50% while the US continues to run 2 trillion dollar a year deficits, which more or less eliminates the possibility of fully curbing inflation in the near term. The thing that blows my mind is how out of wack home prices are relative to renting the equivalent dwelling in the SF Bay Area. Yet still, buyers are lined up locally to incur 3x the carrying cost to buy something instead of rent it.
If this has been the case then Austin won’t have dropped more than 22 percent from its peak.
Cracks are forming everywhere.
jon, i’m watching, and cracks are certainly forming in arizona and florida.
prices haven’t dropped much yet, but a ton of is just sitting on the market, and the sellers are wondering why they’re not selling. i’m hearing this a lot from real estate agent acquaintances.
the pathetic thing is, these people could sell them easily, and still at a huge profit, if they toned down their greed.
in the markets where a $500,000 house in 2018 was up to $1 million in 2022, they could sell it for $800,000 today easily. but they feel entitled to “get what it’s worth,” which in their minds is peak 2022 pricing when rates were 2.8%, and would rather let it sit at the $1 million indefinitely. sometimes they’ll drop the price to $975,000 and brag in the listing about a “huge price reduction.”
these people are pathetic.
That’s just the Great Nation of California!
Due to exchange rates, the USD is only about 1/3-1/2 the value it has, across the river in Az.
As a South Park episode put it: It’s due to the smug!
I honestly do not understand the demand in SOCAL.
I rent a home in San Diego that is appraised at $1.5M. I pay $4500 per month in rent. The monthly payment to purchase would be $12K at current rates and you’d pay almost $100K in interest each year.
And home prices have essentially traded sideways since Sep 2022. So it isn’t like buyers should have FOMO. Why would anyone sign up for that?
It would.take sometimes for buyers in socal to realize that it’s a losing proposition.
So cal residents have been made to believe that home prices never go down and so cal is the place where everyone wants to own and live .
This myth needs to be broken again in so cal.
I don’t expect big price drops unless we have recession and job losses .
I have friends buying a million dollar home to rent out for 3k or so . Such is the craziness.
But things are moving in right direction
On of San Diego s cities Chula Vista condo prices have come down by 20 percent or so from its peak and that too in a robust economy.
Think what would happen when the economy is not that great.
Condo prices are the first to crater
Just like your screen name implies…in SoCal it’s not FOMO? but more like FOMO! Plus there’s this herd mentality and almost regligious like zealots in predominately Asian heavy neighborhood like Irvine, Diamond Bar, Rowland Heights..etc that housing will NEVER NEVER go down and it can only go up indefinitely even outpacing inflation..If you don’t buy now then you’re stupid, even though if the math ain’t mathing..
What you outlined above is exactly why I am on a buyer strike and no not one where I am force to be on the sideline because I can’t afford or qualify. IF I really want, I can pay 60-70% down even at these insane price without draining all my accounts…heck if I want to go tighter, maybe even buy without mortgage…I just have a giant problem with paying over $1M for some tiny place with a fresh coat of paint. Not paying Wagyu price for a piece of frozen burger meat, that’s how I look at it…
Plus T-bill and chill isn’t too bad right now, was better when it was close to 5% that’s for sure..
Maybe I’m missing something, but those new home inventory numbers probably don’t mean much in urban areas that are substantially built up already.
San Diego or Long Beach aren’t building large numbers of new single family homes in established neighborhoods, and the neighborhoods where the new homes are being built tend to be 30-60 minutes farther away from job centers than existing neighborhoods.
In the SF Bay Area the new home areas are more like 60-90 minutes further away.
@FOMO?…
“The monthly payment to purchase would be $12K at current rates and you’d pay almost $100K in interest each year.”
Lots os buyers in that price range have $500k (or whatever) downpayments. Some all cash. I’d guess relatively few are buying with near-minimum downpayment in scenarios like you describe.
yeah but do the math, even putting $500K on a $1.5M house, with homeowner insurance on average and property tax, you’re looking at ~$8K a month for 30 yrs not counting other expenses…this is the part where math ain’t mathing..sure maybe it make sense if you continue to expect housing to go up 10% or more every year…otherwise $500K in Tbill is now about $1800 a month pre-tax that you collect…
To each its own I guess, I guess the high people get from finally made it to the owner class instead of poor renter class gotta count for something..
High margins for home builders for sure . Some room to drop prices but not a lot . 10 year Rates today opened down 15 basis points but ended the day down 2 basis points Rates sure appear like they are headed higher which will be headwind for housing stocks. The rise in new home inventory looks like the price increases from 2020 until 2022 one would think QE was back instead of QT
Home builders have been thriving for a long time on the North American continent with the explosion in the population. There was a time when there was only 3 million people in the American colonies, hard as this is to believe. Since then, the doubling and redoubling of population has meant a need for new accommodations. Plus older homes have been gradually phased out. For the foreseeable future, home building will be a fine area to be in, and many young men should think about going in the trades.
True enough DS,,, and I can remember when the population of the flower state was 3MM! Now about 20+
Twenty years ago, it was becoming clear that the greatest challenge to the construction industry was lack of qualified help; that tendency has increased, but there are now movements in many areas to ramp up apprenticeship and other trades educational efforts as should be done always to provide the skilled labor always needed.
I get the idea that builders are getting by with unskilled labor and people are putting up with the resulting crap shacks. So, if we, as a country, start minting more quality skilled laborers, will they get hired and put to work, or will they be shunned by the big builders for cheaper unskilled laborers since crap shacks are becoming the new norm?
Serious question. I see no end to corporate greed.
Cheaper, unskilled laborer will always win out. Why would a builder ever pay more for skilled workers? With an arbitration clause, its not like the buyer could ever sue for substandard work.
For MS:
Don’t know about everywhere, but in FL and CA where I have worked extensively as framer and GC and municipal inspector, they are damn sure ”NOT building them like they used to.”
In fact, anything built at least since ”Loma Prieta” earthquake in CA, and codes adopted in FL after Andrew ‘cane are built a hell of a lot better,,,
I was working in various venues and saw the huge difference those natural events made in codes, though to be sure, the SoCal quake in ’70s certainly started the improvement of codes in CA…
And, anecdotally for sure, the hood we are in is going through serious changes as the 1950s 7-900 SF 2&1s are demoed and 2700–3000 SF two story homes, 4&3++ take their place; I have been allowed to check them out, and find the framing, connectors, etc., very much better than even 1994 code, the last one I inspected for.
…might venture that the declining number of the citizenry in the manual trades has resulted in a loss in the general population of the ability to adequately judge quality in manufacture or construction…
may we all find a better day.
VV: the entrance exam to be a licensed GC in Florida is the most challenging in the nation. And I’m sure their codes are strict. But they’re still built by amateurs, and the GC isn’t there to see most of it. And even if he sees it, good luck getting your tradespeople to come neck and fix it. The homes are a tragic accumulation of errors by the time they’re built.
My in laws own a home in northern FL. It was built in 2017 and went for about $2m. Roof junctions don’t have kick out flashings. Last year a sheet of their ceiling drywall just fell, supposedly because of condensation from an HVAC duct. Their James Hardie siding is starting to swell at the edges.
Strict building codes and entrance exams help, but crappy workers can undo all the good planning in the world.
I like the timeline years going backward to last peak, as in, “since Lehman”.
Current Fred housing supply nationally
892,000
We have added 60,000 homes to the market so far in 2025 during the first 3 months of the year when national housing supply is supposed to be going DOWN this time of year, not up.
I predict that we are going to be close to 2016 housing inventory levels by early next year, upwards of 1.4 million homes for sale.
That wont include any of the homes that people bought illegally with FHA that were actually 2nd homes and vacation homes and not owner occupied. When the new home owners insurance premiums come into full swing with massive year over year price increases, massive default will continue to follow.
I predict that by early 2026, the Fred housing supply will be very close to 2016 levels. And if a recession hits this year, it will blow past 2016 levels.
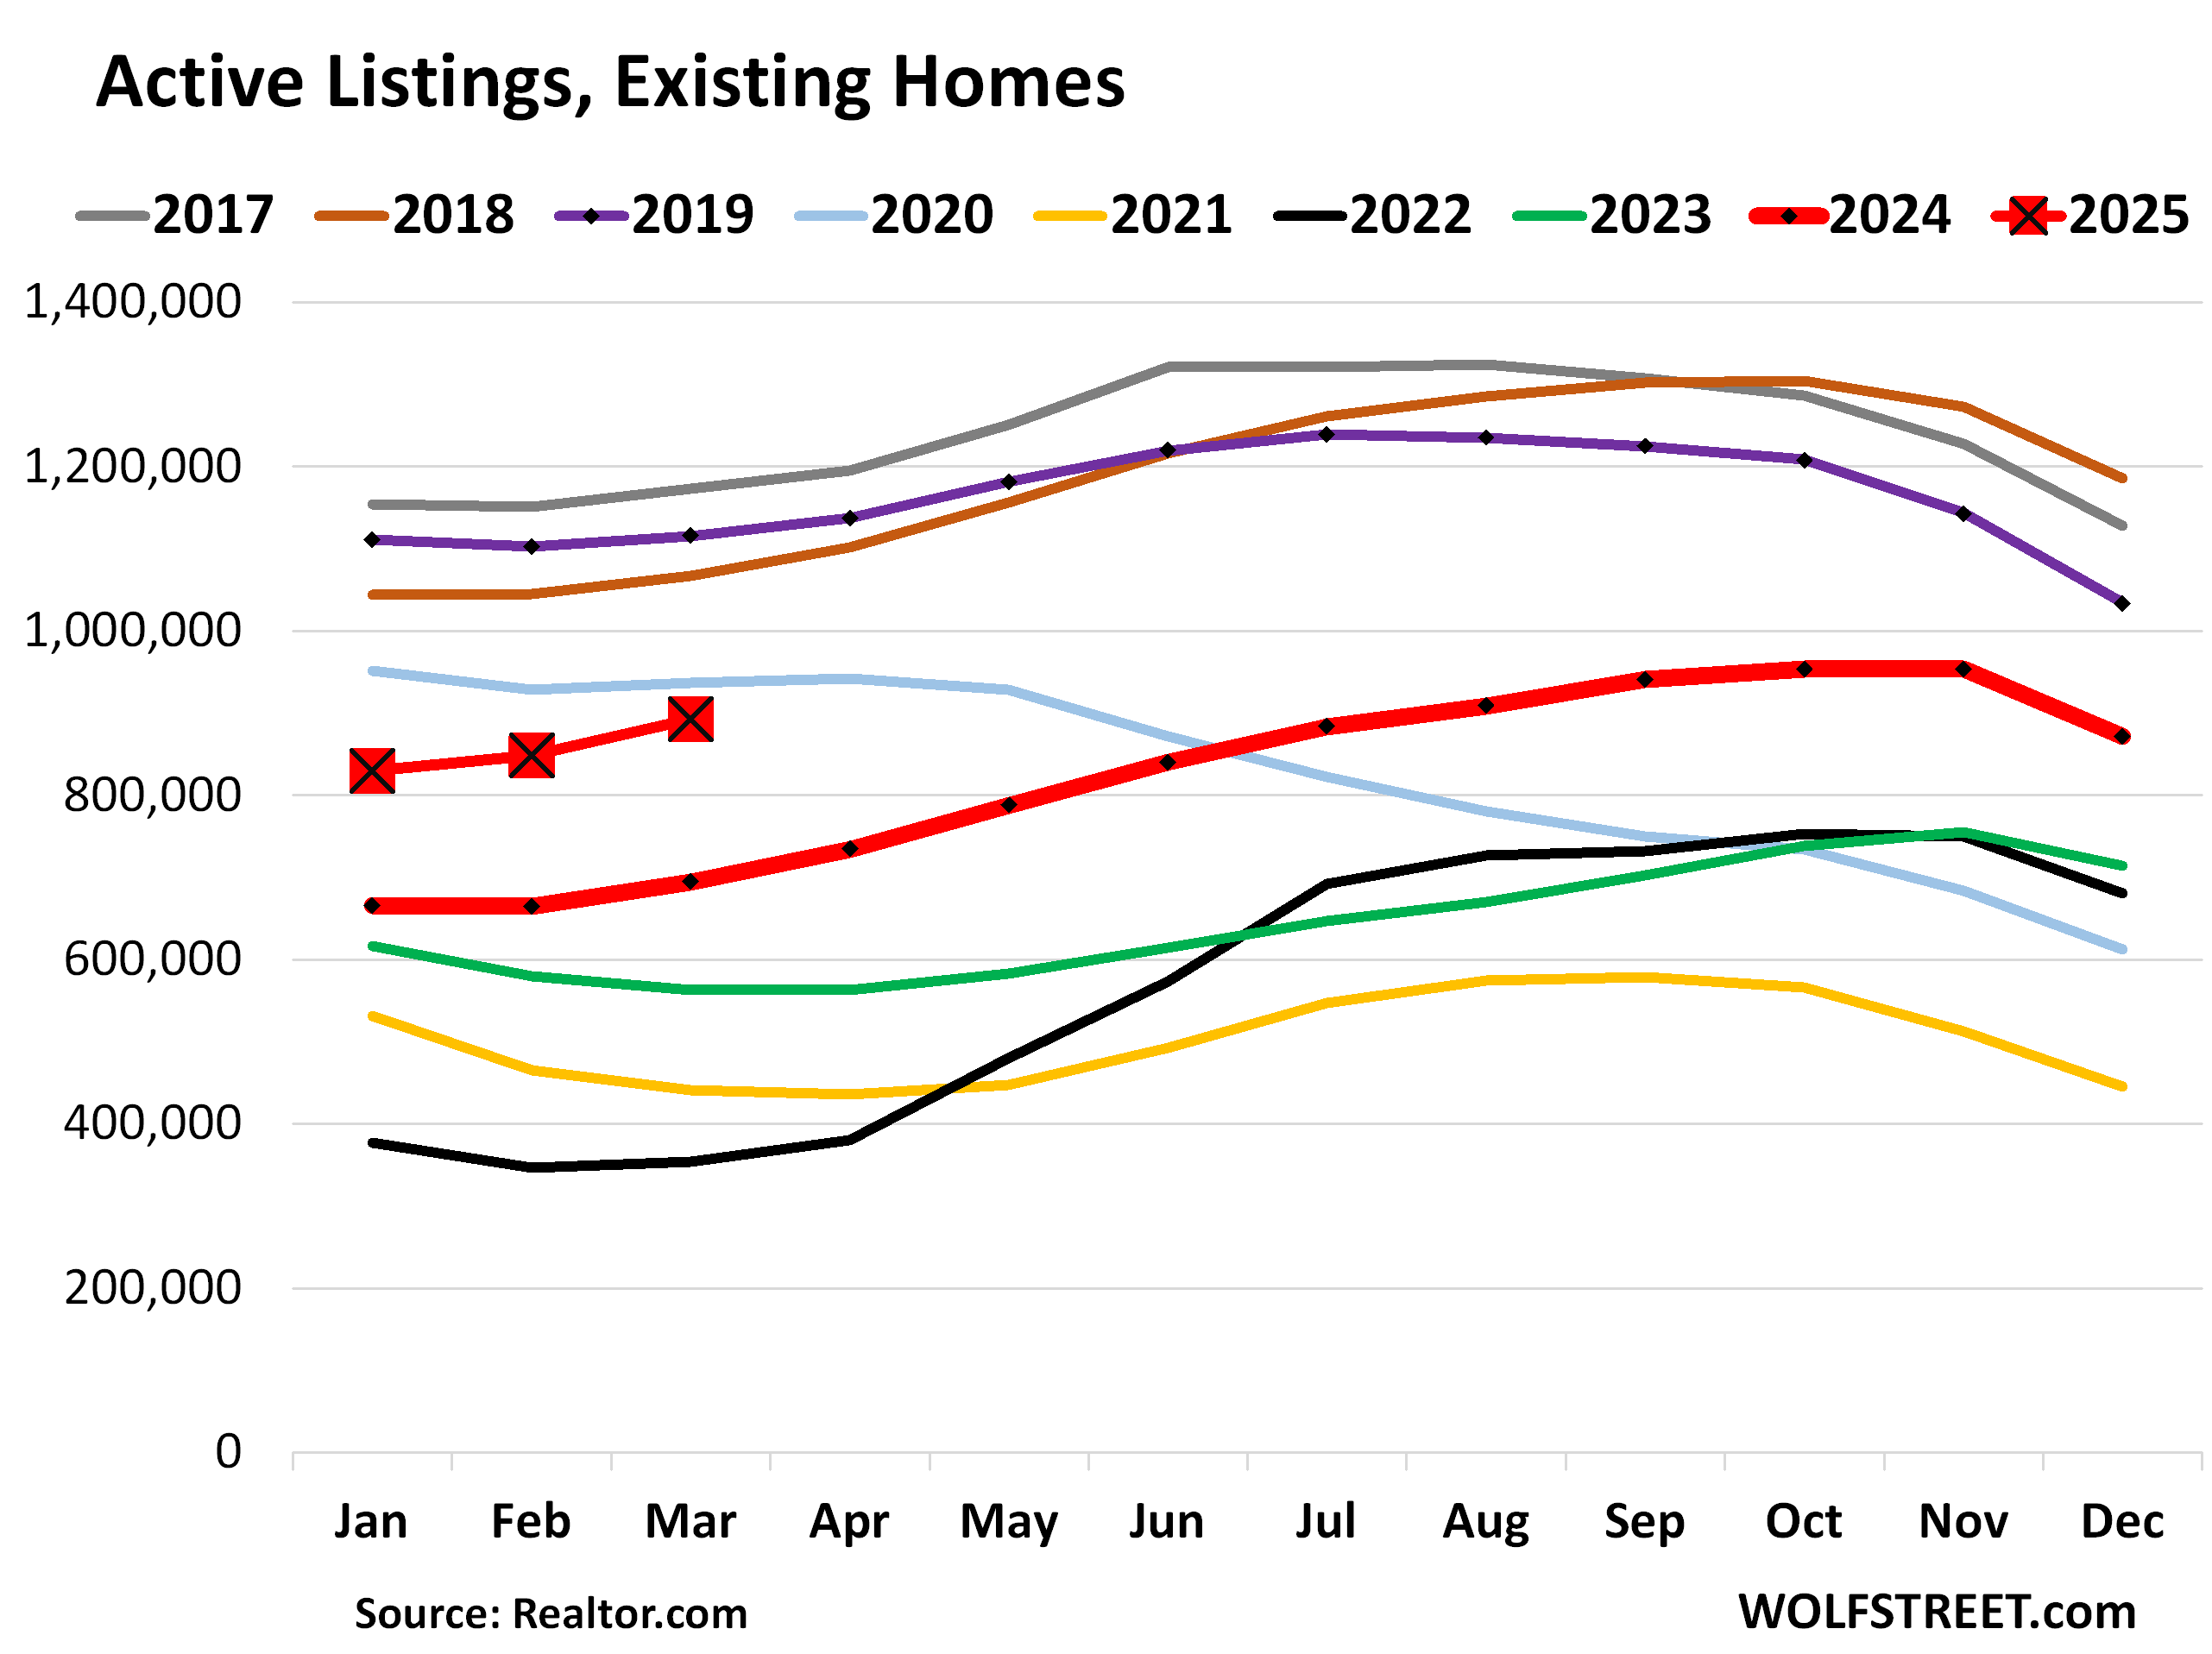
That figure you cited, 892,000, is “active listings” of existing homes, which are NOT NEW homes. The article here is about NEW homes.
The data is from Realtor.com, FRED just aggregates data, it doesn’t have its own data. The FRED charts indicate where the data is from.
1. “We have added 60,000 homes to the market so far in 2025 during the first 3 months of the year when national housing supply is supposed to be going DOWN”
So in terms of actives listings, they normally rise this time of the year, as you can see in the stacked chart (a couple of pandemic years were the exception).
But yes, active listings are rising faster than before the pandemic. The problem is that sales of existing homes have plunged, and there is not the kind of demand that there was in 2019 and before. The reason why demand has plunged is because prices are too high. If sellers get tired of hanging on to their property, they can just cut the price enough, and it will sell. But that’s not happening yet on a grand scale.
The gluts of active listings are in specific markets, such as in Texas and Florida, where inventories have reached the highest in the data from Realtor.com going back to 2016.
Seems it might be a bit of a financial shell game. What I mean by that is companies like DR Horton and Lennar own not only the construction company but also the property, undeveloped lots, and customer financing as a lender. So my question is are they playing a shell game of heavy losses in the lending entity while the other parts of the business (e.g. sales reported to Wall Street). If the lending entity actually fails, what is the real fall out other than the shell game comes to halt? Otherwise, why are they simply not slowing down the pipeline? Why continue to build homes at potential losses?
The lending entities do no keep the loans.
They also did not keep loans in 2008 yet almost all failed financially.
They are building and selling homes at lower profits (not losses) than earlier: “Homebuilders still have big-fat profit margins and net incomes — though they’ve come down — and have lots of room left to cut prices if the market forces them to before they start booking losses. For example, Lennar still booked $519 million in net income in Q1, though that’s down by 28% from $720 million a year ago. PulteGroup still booked $523 million in net income in Q1, though that’s down by 21% from $663 million a year ago.”
and meanwhile, nvidia had net income of $22 billion in the quarter. just goes to show how actually building housing that people need is much less profitable than producing chips for worthless ai data centers.
AI is happening.
i’ve seen what bigtech considers ai and i don’t like what i’ve seen.
Do you have inventory data and months of supply for existing home by region. Thank you.
Here is last month’s data; the new data (NAR) will come out tomorrow (Thursday):
https://wolfstreet.com/2025/03/20/buyers-strike-not-letting-up-sales-of-existing-homes-have-worst-february-for-since-2009-as-inventory-surges/
Active listings in Florida and its major cities (realtor.com). New data in about a week:
https://wolfstreet.com/2025/04/05/inventories-of-existing-homes-in-florida-spike-in-march-to-highest-since-at-least-2016-massive-jumps-in-tampa-miami-orlando-as-buyers-are-on-strike/
Maybe with Trump’s tariffs, they’ll stop importing foreign new homes and start building them all here. Free Corvettes in every garage with every new home purchased.
I just wonder with all these rate buy downs and interest rates staying high (compared to pre pandemic at least) how many will end up in foreclosure. Many people were buying homes thinking by the time their rate was back to the full rate they would be able to refinance to a lower rate. That’s not going to happen anytime soon.
The rent is too damn high. Trump’s meme coin will fix it.
All that precious land turned into asphalt,concrete,steel,plastics glass,dangerous chemicals ,noise,lights and traffic. So sad
Do you live outdoors among the tree frogs and mosquitos? Because otherwise you’re just full of “I got mine” bullsh!t.
Oof, so only homeowners can appreciate nature?
Not at all. I think DC is pointing out that complaining about development, if you already have a home, is basically taking away opportunities for other people to have a home. A form of nimbyism.
Great numbers and graphs..as usual. What I struggle with is understanding the impact on the market of the massive immigration event of the last administration…and the sudden shutting off of same influx. Population increase was noted..in recent years however 100% of the increase was driven by international immigration. 100%. Are native born Americans leaving urban areas to buy these new houses..?? Are non citizen international migrants somehow big players in this housing market..??
The change in illegal immigration will have a massive effect on housing if it is sustained, 12 million people crossed the southern border during the 4 years of the prior administration, the current annualized rate of illegal border crossings is less than 100K/ year, like 30 times lower. Say what you want about about the current administration and the dubious legality of some of its actions, but in hindsight, the previous administration’s border policies were basically insane.
Happy1,
1. “Border crossers” is a useless metric because it includes the millions of people who were sent straight back, and then recross, to be sent back again…. “multiple border crossers” that have been counted multiple times and may still not be in the US.
We now know by how much the population in the US grew, and nearly all of it through immigration, including illegal immigration. I made a big deal out of it when the figures were finally released. So read this article, which also discusses the new methodology used to get these numbers. I’m getting tired of having to shoot down this “border crossers” nonsense:
https://wolfstreet.com/2024/12/19/census-bureau-revises-up-population-growth-8-million-in-3-years-due-to-immigration-total-us-population-340-million/
Quoted from my article:
The US population surged by 8 million people in the three years from July 2021 through July 2024, to 340.1 million, according to the updated estimates from the Census Bureau today.
The 3.3 million net increase over the 12 months through July 2024 was the largest in decades. And the biggest portion of increases came from net-immigration (those that came in minus those that left or were removed):
2022: +1.92 million, incl. 1.69 million net immigration
2023: +2.80 million, incl. 2.29 million net immigration
2024: +3.31 million, incl. 2.79 million net immigration
2. You can take illegal immigrants off your lists as buyers of new single-family houses. But legal immigrants, such as tech workers coming in on H1b visas, green-card holders, other long-term legal immigrants, and those who are citizens now, such as yours truly who has been here since dirt was young, sure, they buy homes.
Wolf, Since real incomes would have increased since 2022 and new home prices have decreased slightly in value, can we say home affordability has slightly improved compared to 2022. But not yet reached 2020 or 2019 level. Is that assumption correct?
Yes, there is a little bit of that. And if home prices stay flat for 25 years, and real household incomes continue to rise for 25 years, homes might become reasonably priced again in 25 years 🤣
I couldnt respond to you earlier because there was not an option to.
What is going to stop supply from going much, MUCH higher from here? Year after year after year after year…. from where we are today?
The answer is nothing. A huge part of the population cannot afford a mortgage. People are going to be forced to sell in time because of divorce, death, boomers going into nursing homes, long term care, and all sorts of other reasons. People will have to sell, that is a fact. Time forces everything.
Cash buyers have dropped off a cliff. There is zero demand and sharply increasing supply everywhere. Home prices are going to get hit hard. And even if people sell their FHA mortgage, they are going to have to lower the price substantially because no one is buying right now. Also, the airbnb market is also in serious trouble which will force people to sell without steady income with rising costs.
There is not going to be some huge buying demand even if prices came down 20%, thats a pipedream. Not with mortgage rates where they are, and not with home owners insurance costs exploding and the cost to own a home in general exploding.
This will be fun to revisit 12 months from now. We’ll see where the national supply sits then, with or without foreclosures.
I have my forecast in writing. We will be close to 2016 levels in supply a year from now.
I wasn’t disagreeing with you on your supply forecast. But there is a confusion of terms in your prior comment. So I tried to straighten some of that out.
BTW, “supply” is typically expressed in “months” at the current rate of sales (inventory divided by sales). So this takes demand AND inventory into account. The number you cited earlier was “active listings,” which is inventory minus the pending sales.
“Supply” spiked to 4.0 months for existing homes (your topic), as per NAR today, highest since 2016. Hot off the press, and it seems to be heading higher from here:
https://wolfstreet.com/2025/04/24/sales-of-existing-homes-drop-to-worst-march-since-2009-west-south-midwest-northeast-all-get-crushed-supply-surges-to-highest-since-2016/
Supply going much higher would be a great thing especially if it pressures prices lower to get all these absurd charts back to normal. I don’t know why you are sounding like it’s bad. It’s the crazy spikes up in price in these charts that was bad. The corrections down are a big relief. Mortgage rates are still artificially suppressed because the fed still holds trillions and shouldn’t have ever bought any mbs. I’m one of the people that wants to buy if prices decrease more. Insurance can go down with lower prices. The airbnb having trouble is self inflicted, thinking it was a good idea to greedily buy up sfh, turn neighborhoods into hotels, that working families could live in. Did they think the massive money printing would make a bunch of rich folks that want to travel all the time?
Wolf doesn’t say this but he knows as well as many of us rational thinkers that this housing market is a manipulated circus. Things are being done behind the scenes to make it defy gravity. Levers are being pulled. Deals are made. Money is greasing some ‘wheels’ in order to keep the gravy train going. I realized long ago that housing is probably the largest wealth transfer mechanism. High prices for housing makes certain people/industries rich. Likewise, it is making another group of people poorer. Wolf knows.
Everything is rigged. There’s no such thing as a “free market.” The government has their filthy mitts in everything, and for the worse. They make EVERYTHING more expensive, using taxpayer dollars. They are waging an all-out assault on humanity to try to satiate insatiable billionaire greed.
Wolf,
Have you considered doing an article comparing regional rental rates alongside RE prices and inventory?
I have a friend who insists if you purchase a rental property that is cash-flow positive at the time, then it doesn’t matter if you bought at the peak of the RE market. i.e. You can never pay “too much” for a cash-flow positive property, because “rents almost never go down”.
I remember having to lower rates on my rentals circa 2010 or so. My friend didn’t own rentals back then. I’m curious how our anecdotal biases compare to long-term data.
Good question. We’ve lowered rents two different times in the last 30 years in Colorado. About 10% around 2005 and 3% in the last year. Of course, those were also times it was hard to buy a cash flow positive property. They were also times expenses went up a lot with crazy property prices reflected in more expensive insurance (some of that hidden by increasing deductibles) and property taxes. I did have a tenant after the GFC who had 7 rentals foreclosured on and a bankruptcy. I know others who overpaid for rentals and lost them. Others who fed the alligator (negative cash flow) for a while and held onto their properties which are doing quite a bit better.
I think it would be very interesting to do prize comparisons of housing prices priced in , how many ounces of GOLD housing cost over the last 25 years.
And also what housing costs are and what they are renting for now.
I think when you look at the numbers, people may be buying homes and renting them out for less than the cost of carry , just might be trying to put cash today and taking out mortgages in a Currency that might, become Worthless.
Just another way of looking at this, crazy as it seems
You could also price houses in shares of Amazon or Apple or Enron and see what you get, like how many shares of Amazon to buy this house in 1999, in 2002, in 2019, in 2025, etc. Same logic. Price one asset in terms of another asset. Not sure how much sense that makes though
I think he’s just looking for inflation adjusted in some manner.