Natural gas and electricity pushed up energy costs in February, despite drop in gasoline prices. Used vehicle prices continued to surge.
By Wolf Richter for WOLF STREET.
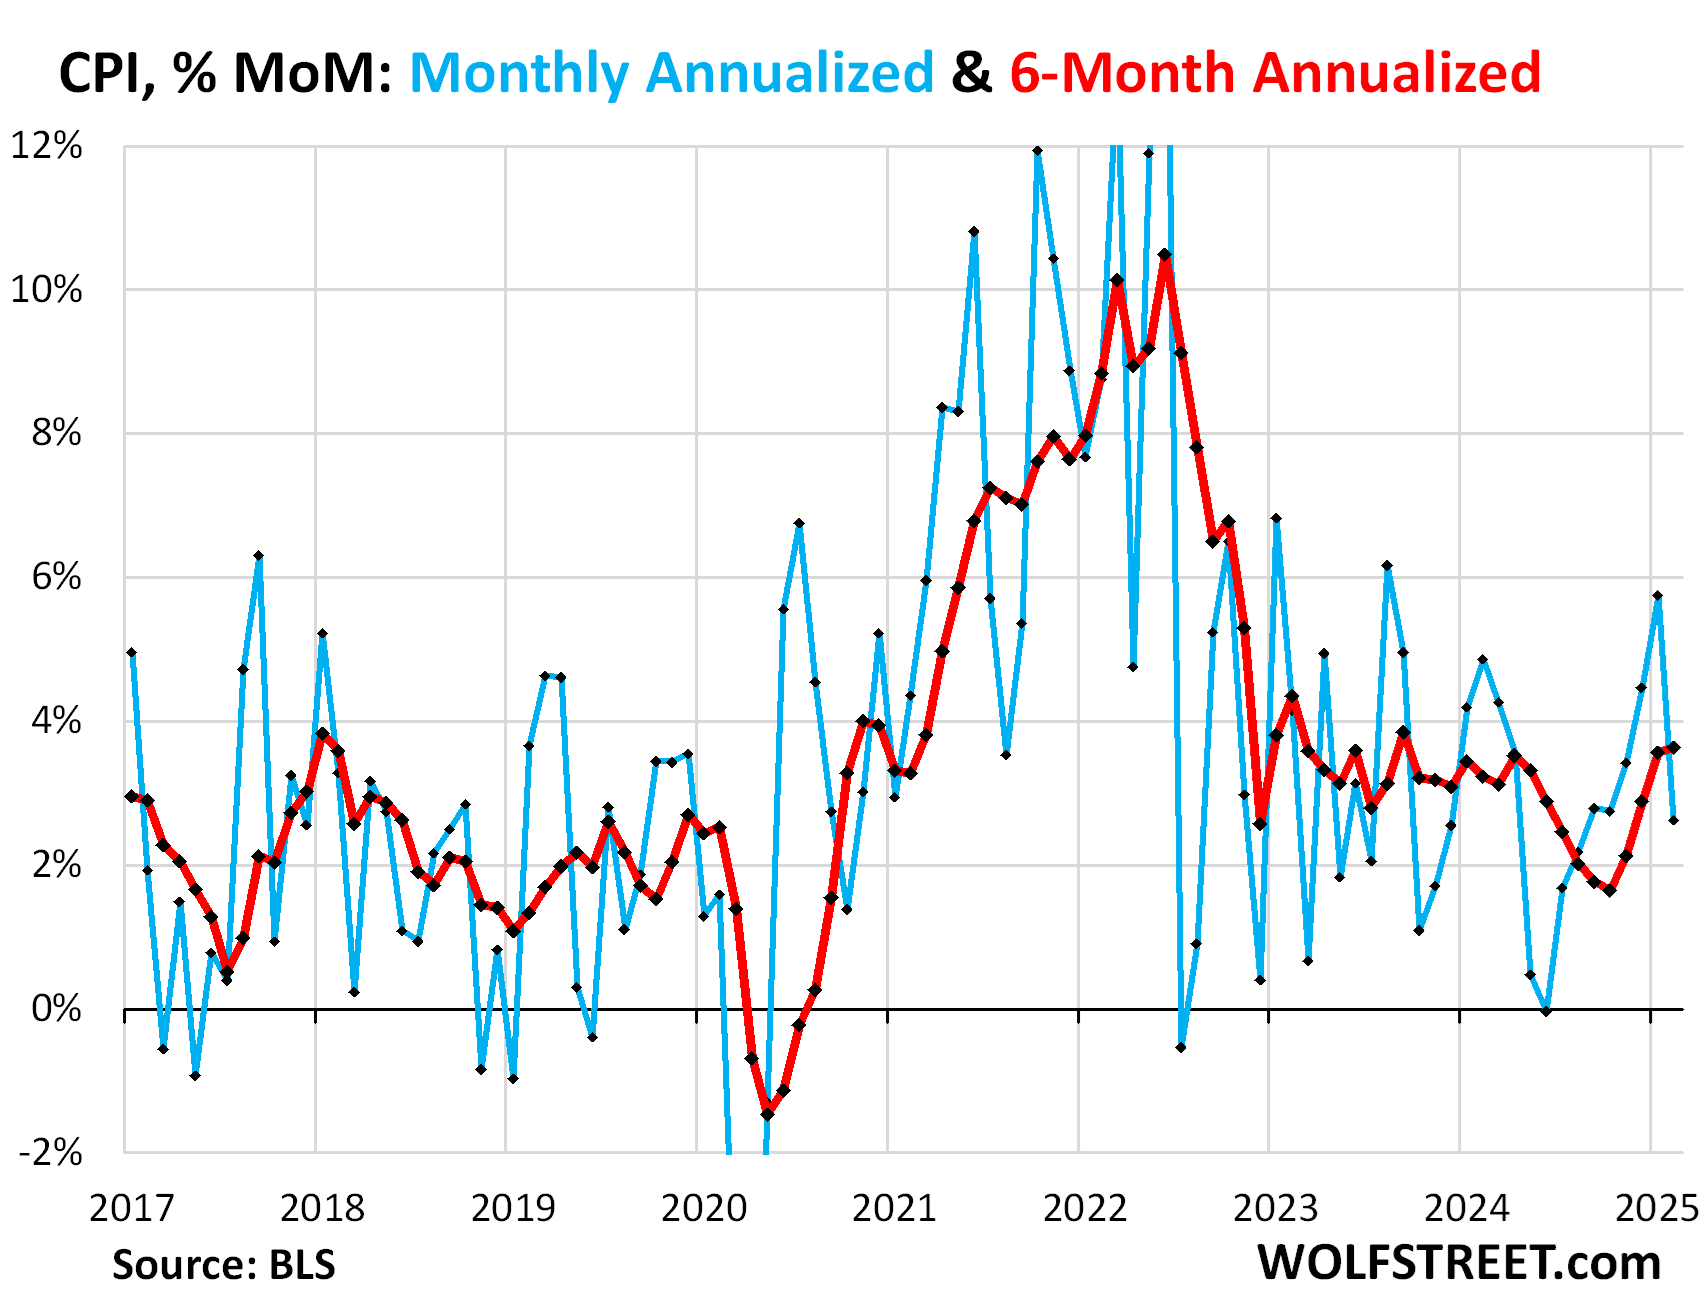
The overall Consumer Price Index rose by 0.22% (+2.62% annualized) in February from January, after the jump of 0.47% (+5.75% annualized) in January from December, which had been the worst month-to-month increase since August 2023, and the sixth month of acceleration from the low point in June.
But the 6-month CPI accelerated further, rising by 3.63% annualized, the worst increase since September 2023 (red in the chart):
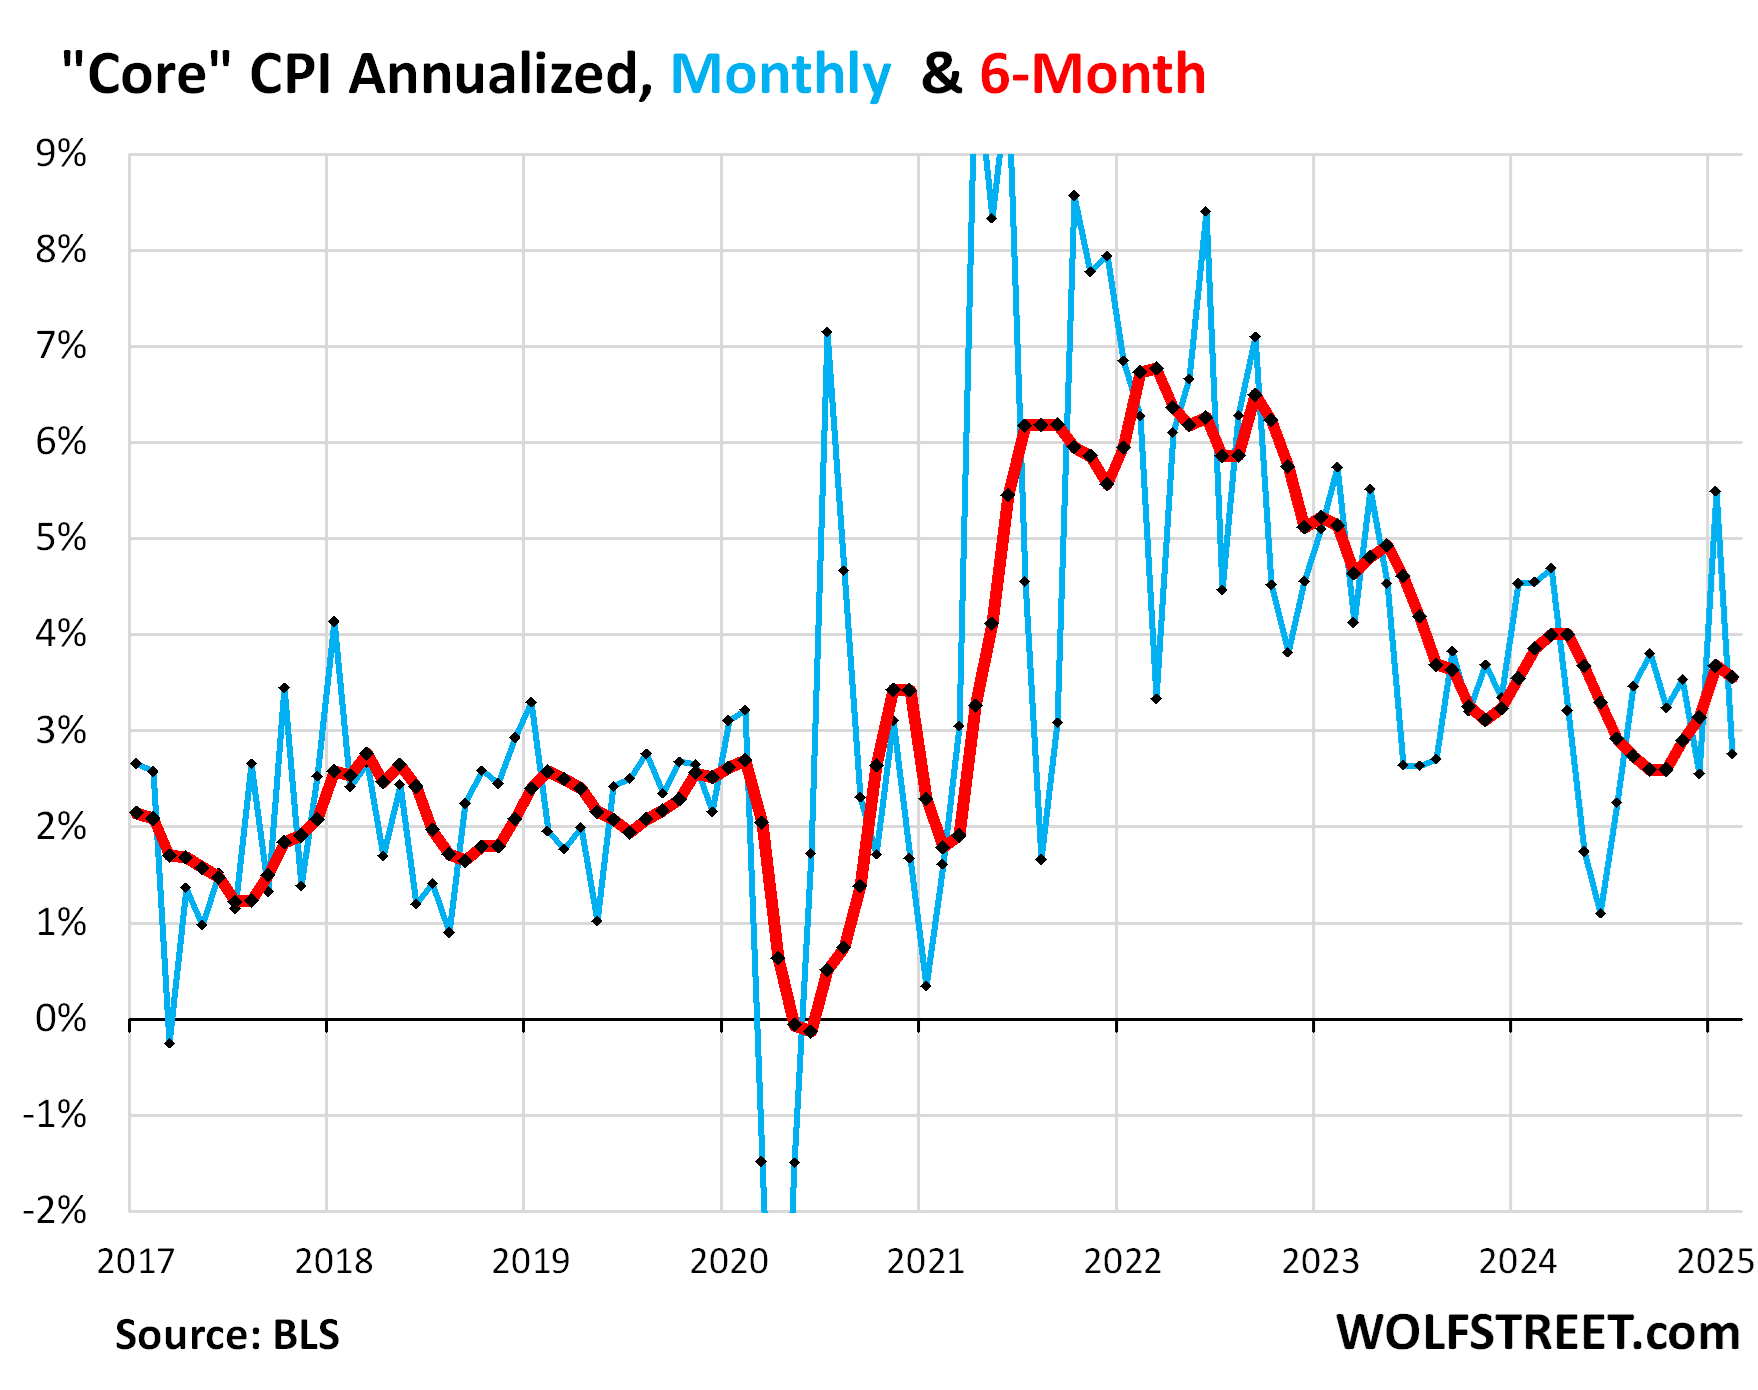
The “Core” CPI, which excludes food and energy components to track underlying inflation, rose by 0.23% (+2.7% annualized) in February from January, after the jump of 0.45% (+5.5% annualized) in January from December, which had been the worst increase since April 2023, (blue in the chart below).
The 6-month “core” CPI rose by 3.6% annualized, a slight deceleration from the prior month (+3.7%), which had been the worst since May (red).
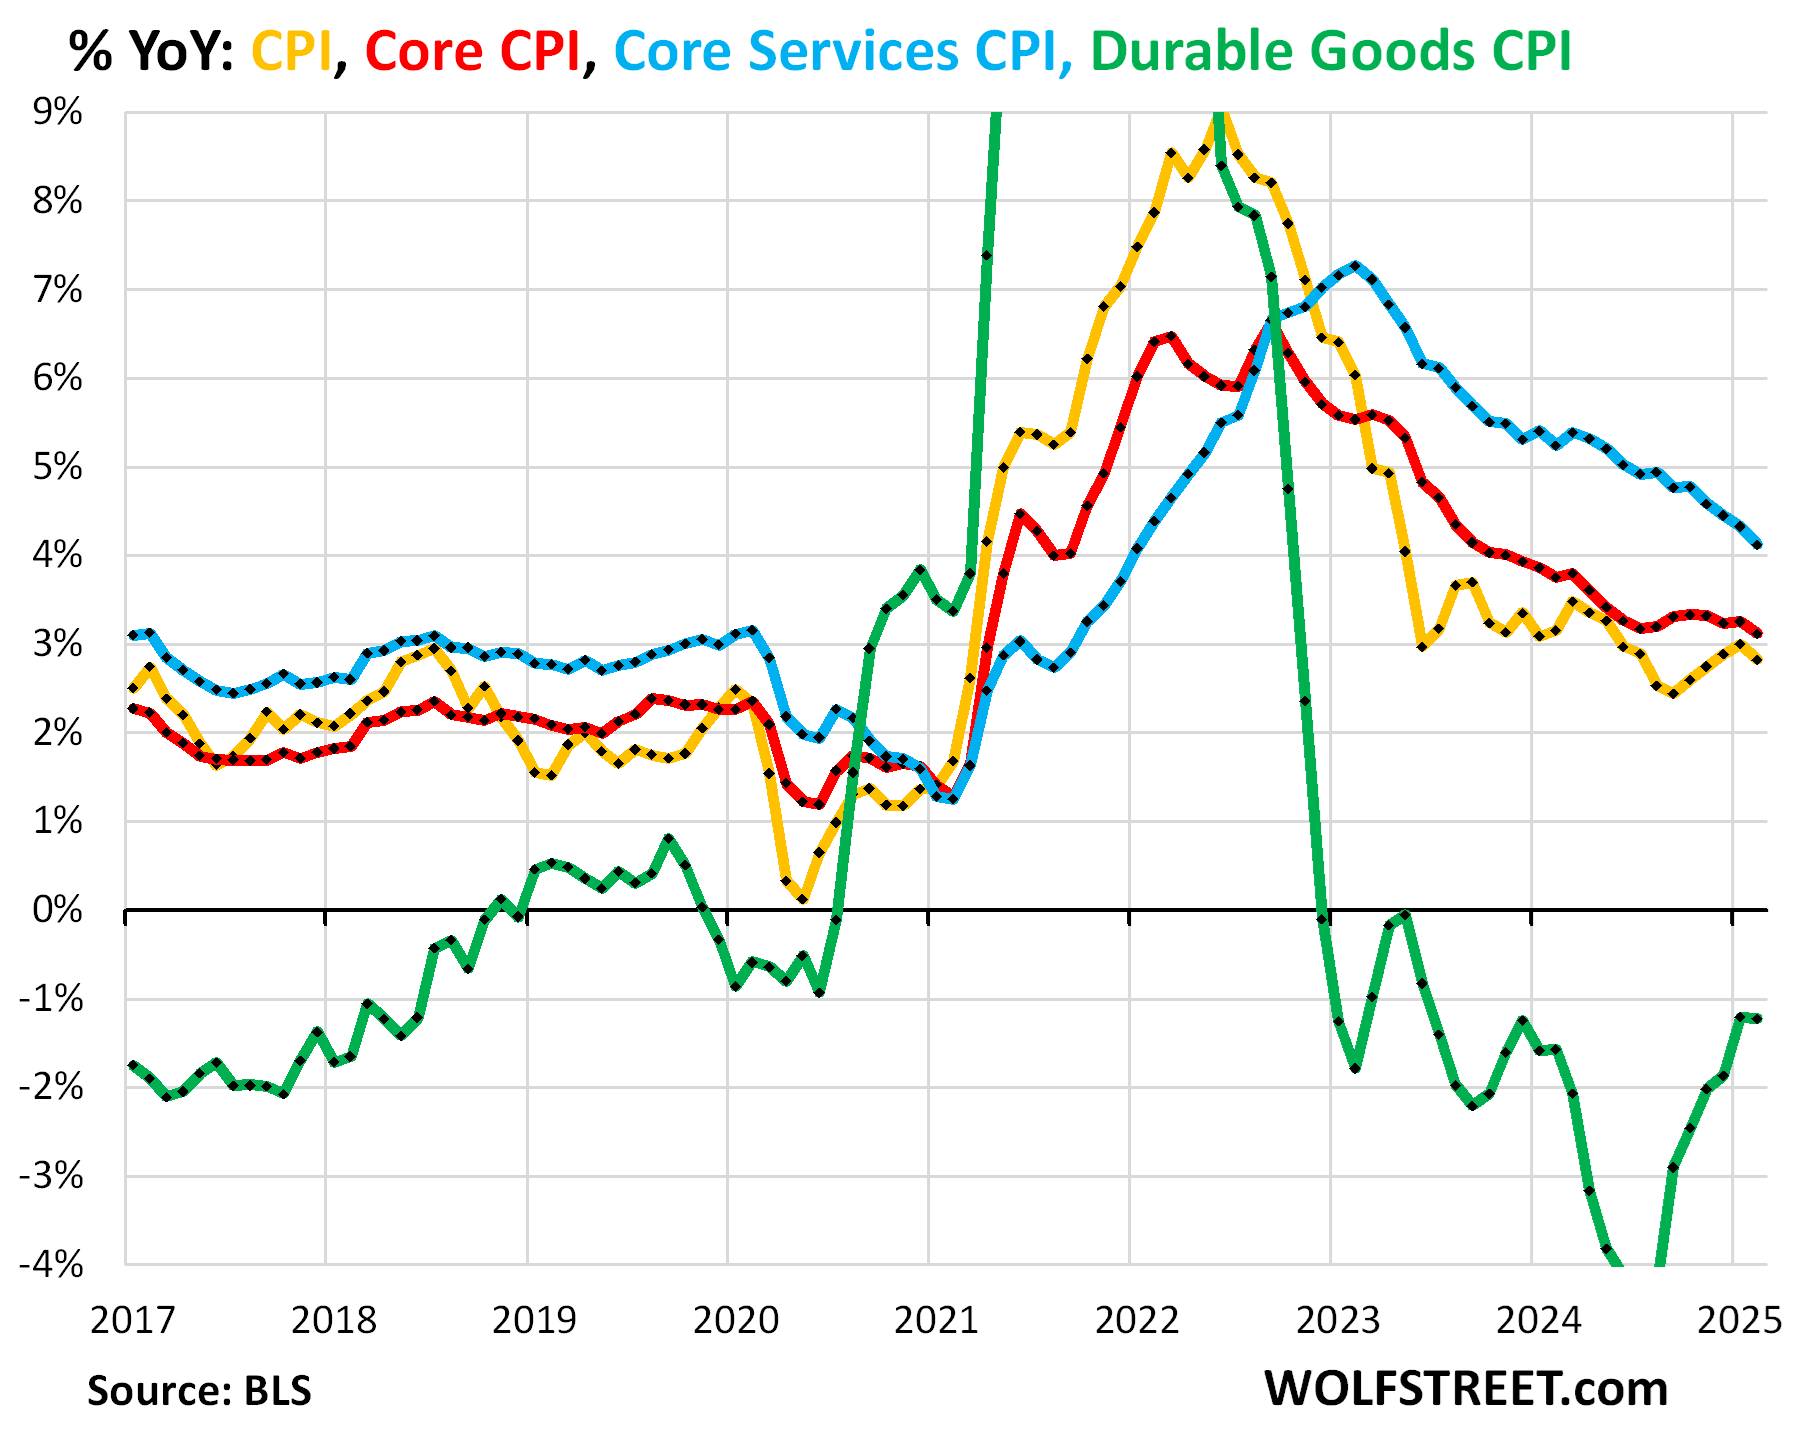
The major components, year-over-year:
- Overall CPI: +2.82% (yellow), deceleration from +3.0% in January.
- Core CPI +3.11% (red), deceleration from +3.26% in January. It has not improved at all since June 2024
- Core Services CPI: +4.12% (blue), a deceleration from +4.33% in January.
- Durable goods CPI: -1.23% (green), essentially same decline as in January.
“Core services” CPI.
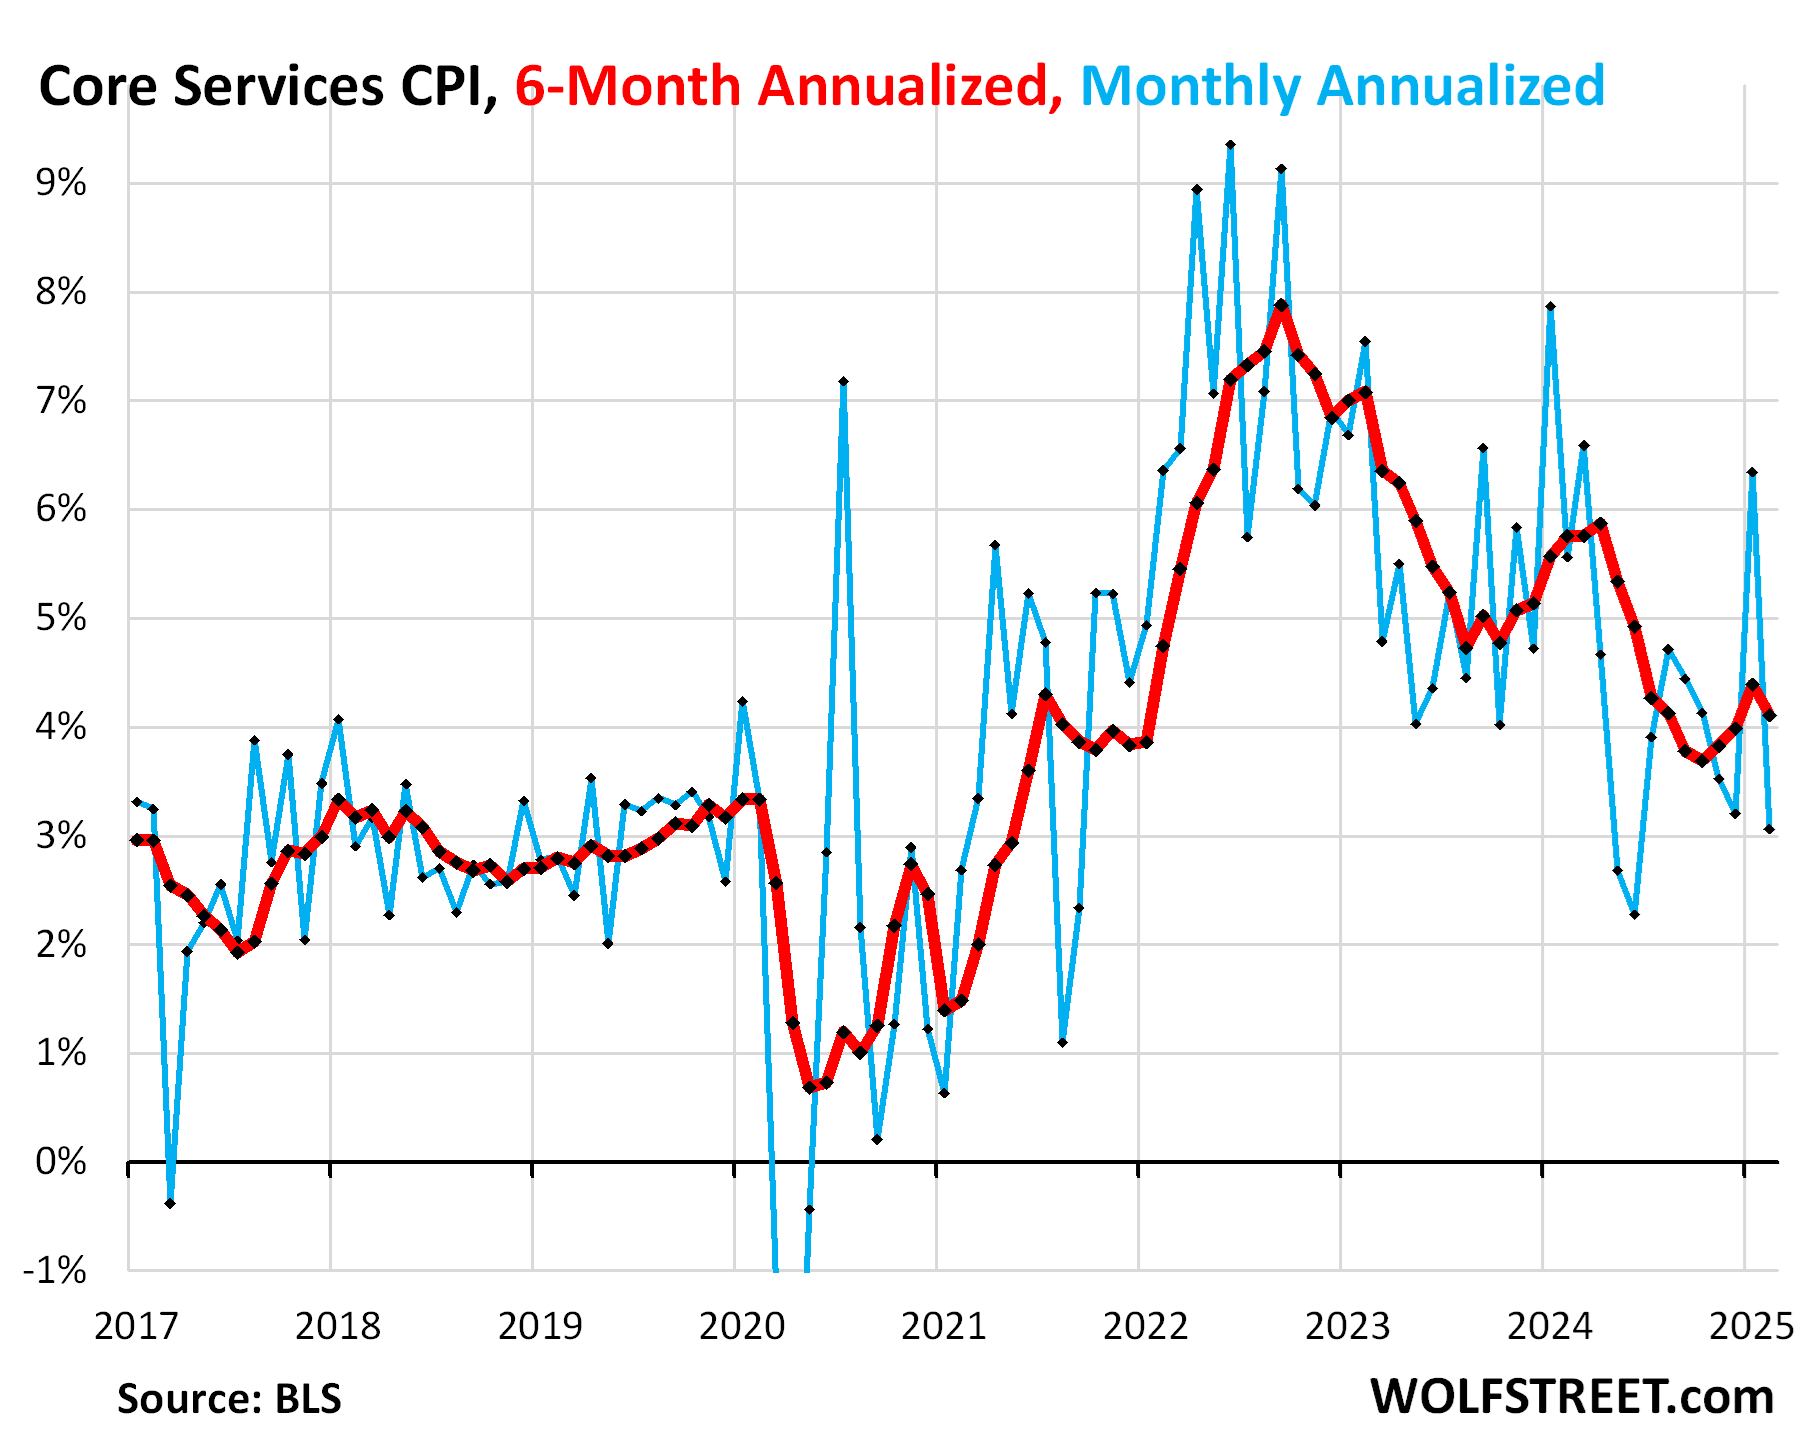
Core services CPI, which are all services less energy services, and accounts for about two-thirds of the overall CPI, rose by 0.25% in February from January (3.1% annualized, a sharp deceleration from the spike in the prior month (+6.4% annualized), which had been the worst increase in 11 months (blue line in the chart below).
The 6-month core services CPI rose by 4.1% annualized, a deceleration from January (+4.4%), which had the worst since June (red).
What we noted a month ago was that some services raise their prices annually in January, which can help produce the spikes of the services CPI in January. But we did not see those kinds of January price spikes before the pandemic:
Housing components of core services.
Owners’ Equivalent of Rent CPI decelerated to +3.4% annualized in February from January (+0.28% not annualized).
But the three-month average accelerated to +3.68% annualized.
OER indirectly reflects the expenses of homeownership: homeowners’ insurance, HOA fees, property taxes, and maintenance. It’s the only measure for those expenses in the CPI. It is based on what a large group of homeowners estimates their home would rent for, with the assumption that a homeowner would want to recoup their cost increases by raising the rent.
As a stand-in for homeowners’ insurance, HOA fees, property taxes, and maintenance costs, OER accounts for 26.2% of overall CPI and estimates inflation of shelter as a service for homeowners.

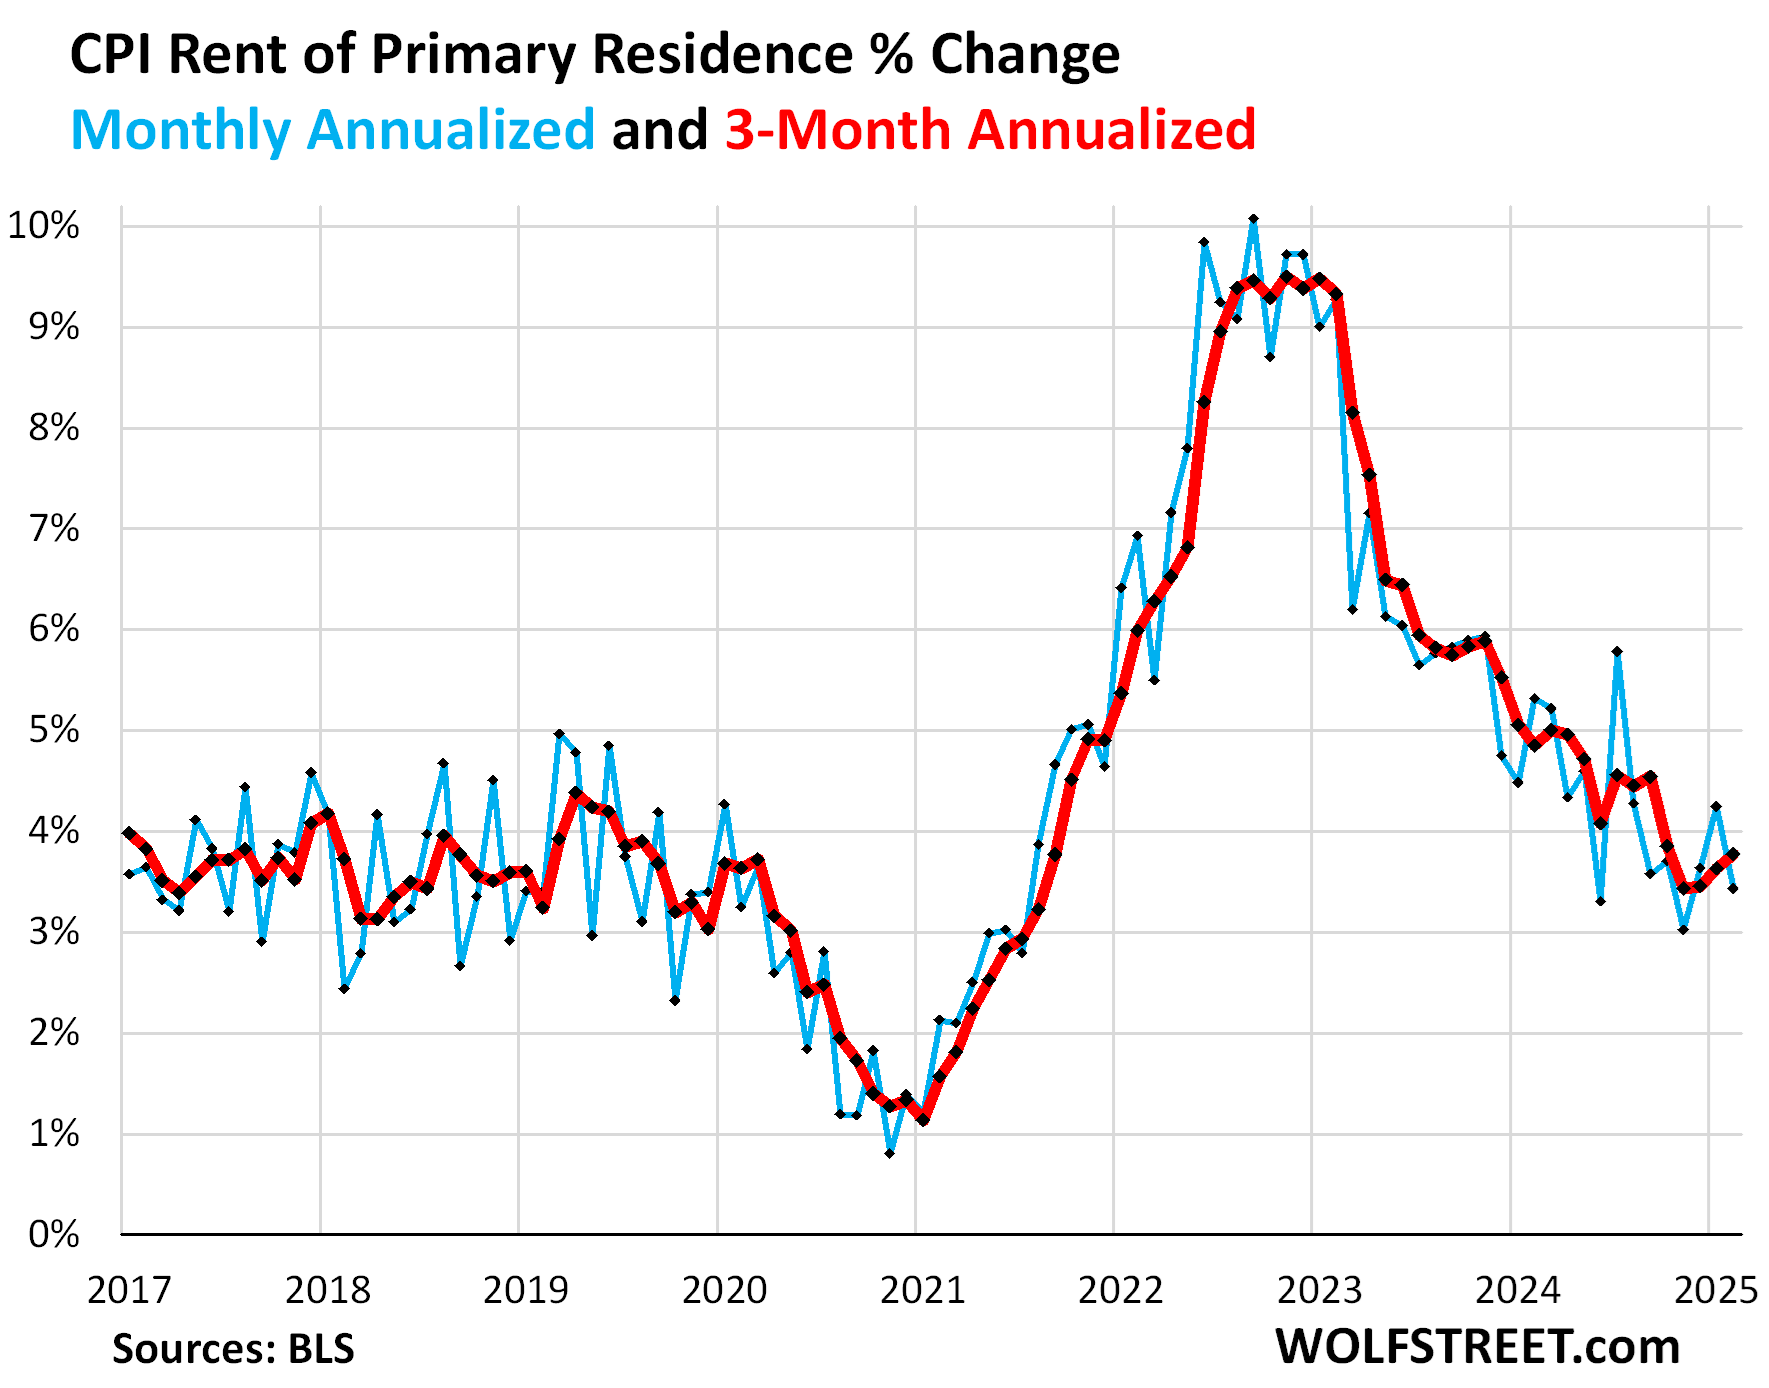
Rent of Primary Residence CPI decelerated to +3.4% annualized in February from January.
But the 3-month rate accelerated to +3.8% annualized, the worst increase in four months. This rate is in the upper end of the range before the pandemic.
Rent CPI accounts for 7.5% of overall CPI. It is based on rents that tenants actually paid, not on asking rents of advertised vacant units for rent. The survey follows the same large group of rental houses and apartments over time and tracks the rents that the current tenants, who come and go, pay in rent for these units.
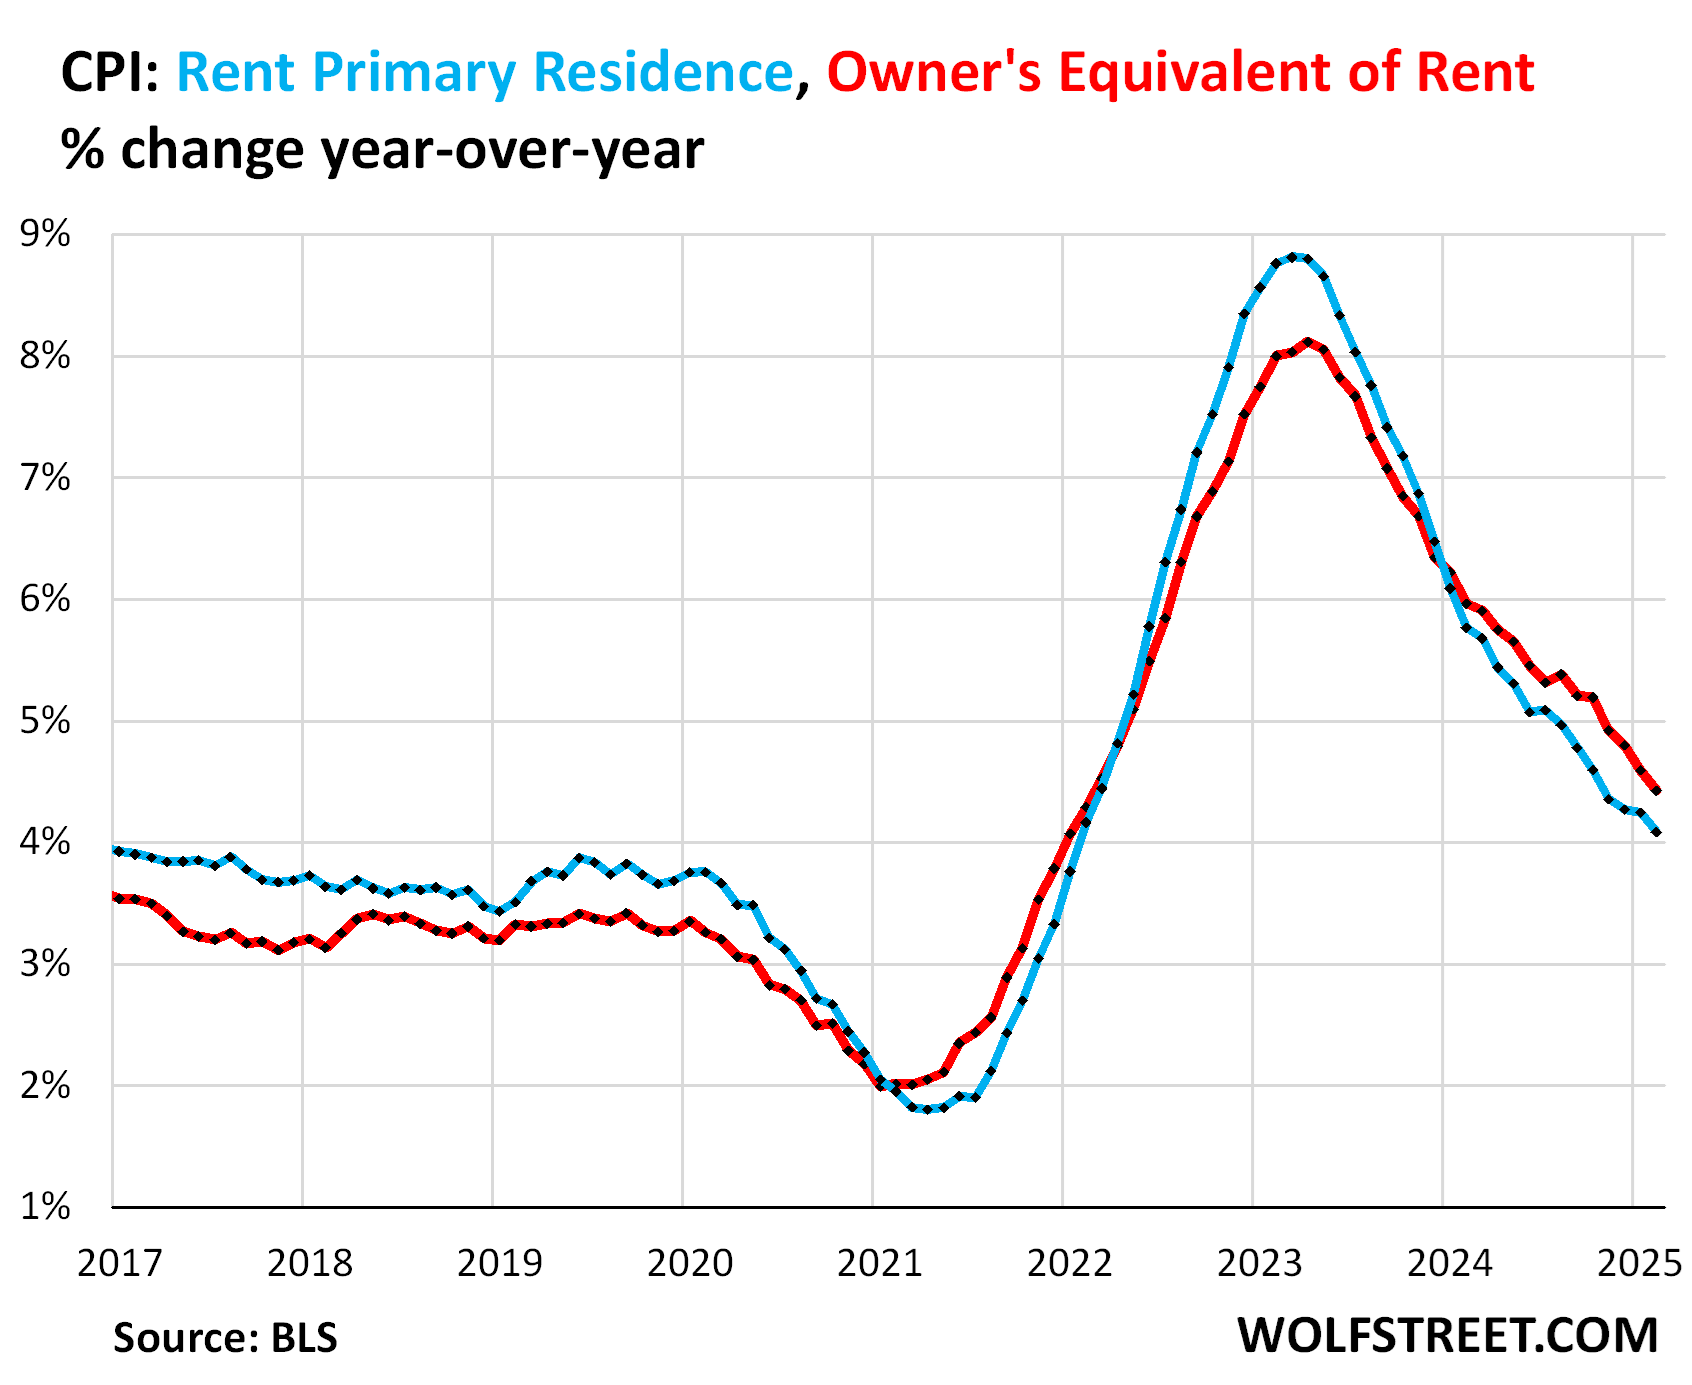
Year-over-year, rent CPI (blue in the chart below) rose by 4.1%, and OER by 4.4% (red), both continuing to decelerate on a year-over-year basis.
“Asking rents…” The Zillow Observed Rent Index (ZORI) and other private-sector rent indices track “asking rents,” which are advertised rents of vacant units on the market for rent. Because rentals don’t turn over that much, the spike in asking rents through mid-2022 never fully translated into the CPI indices because not many people actually ended up paying those jacked-up asking rents.
For January, the ZORI (seasonally adjusted) rose by 0.31% month-to-month and by 3.5% year-over-year. Zillow has not yet released the February data.
The chart shows the CPI Rent of Primary Residence (blue, left scale) as index value, not percentage change; and the ZORI in dollars (red, right scale). The left and right axes are set so that they both increase each by 55% from January 2017:
- Since January 2017: ZORI +52%, CPI Rent +42%.
- Since January 2020: ZORI +34%, CPI Rent +27%.

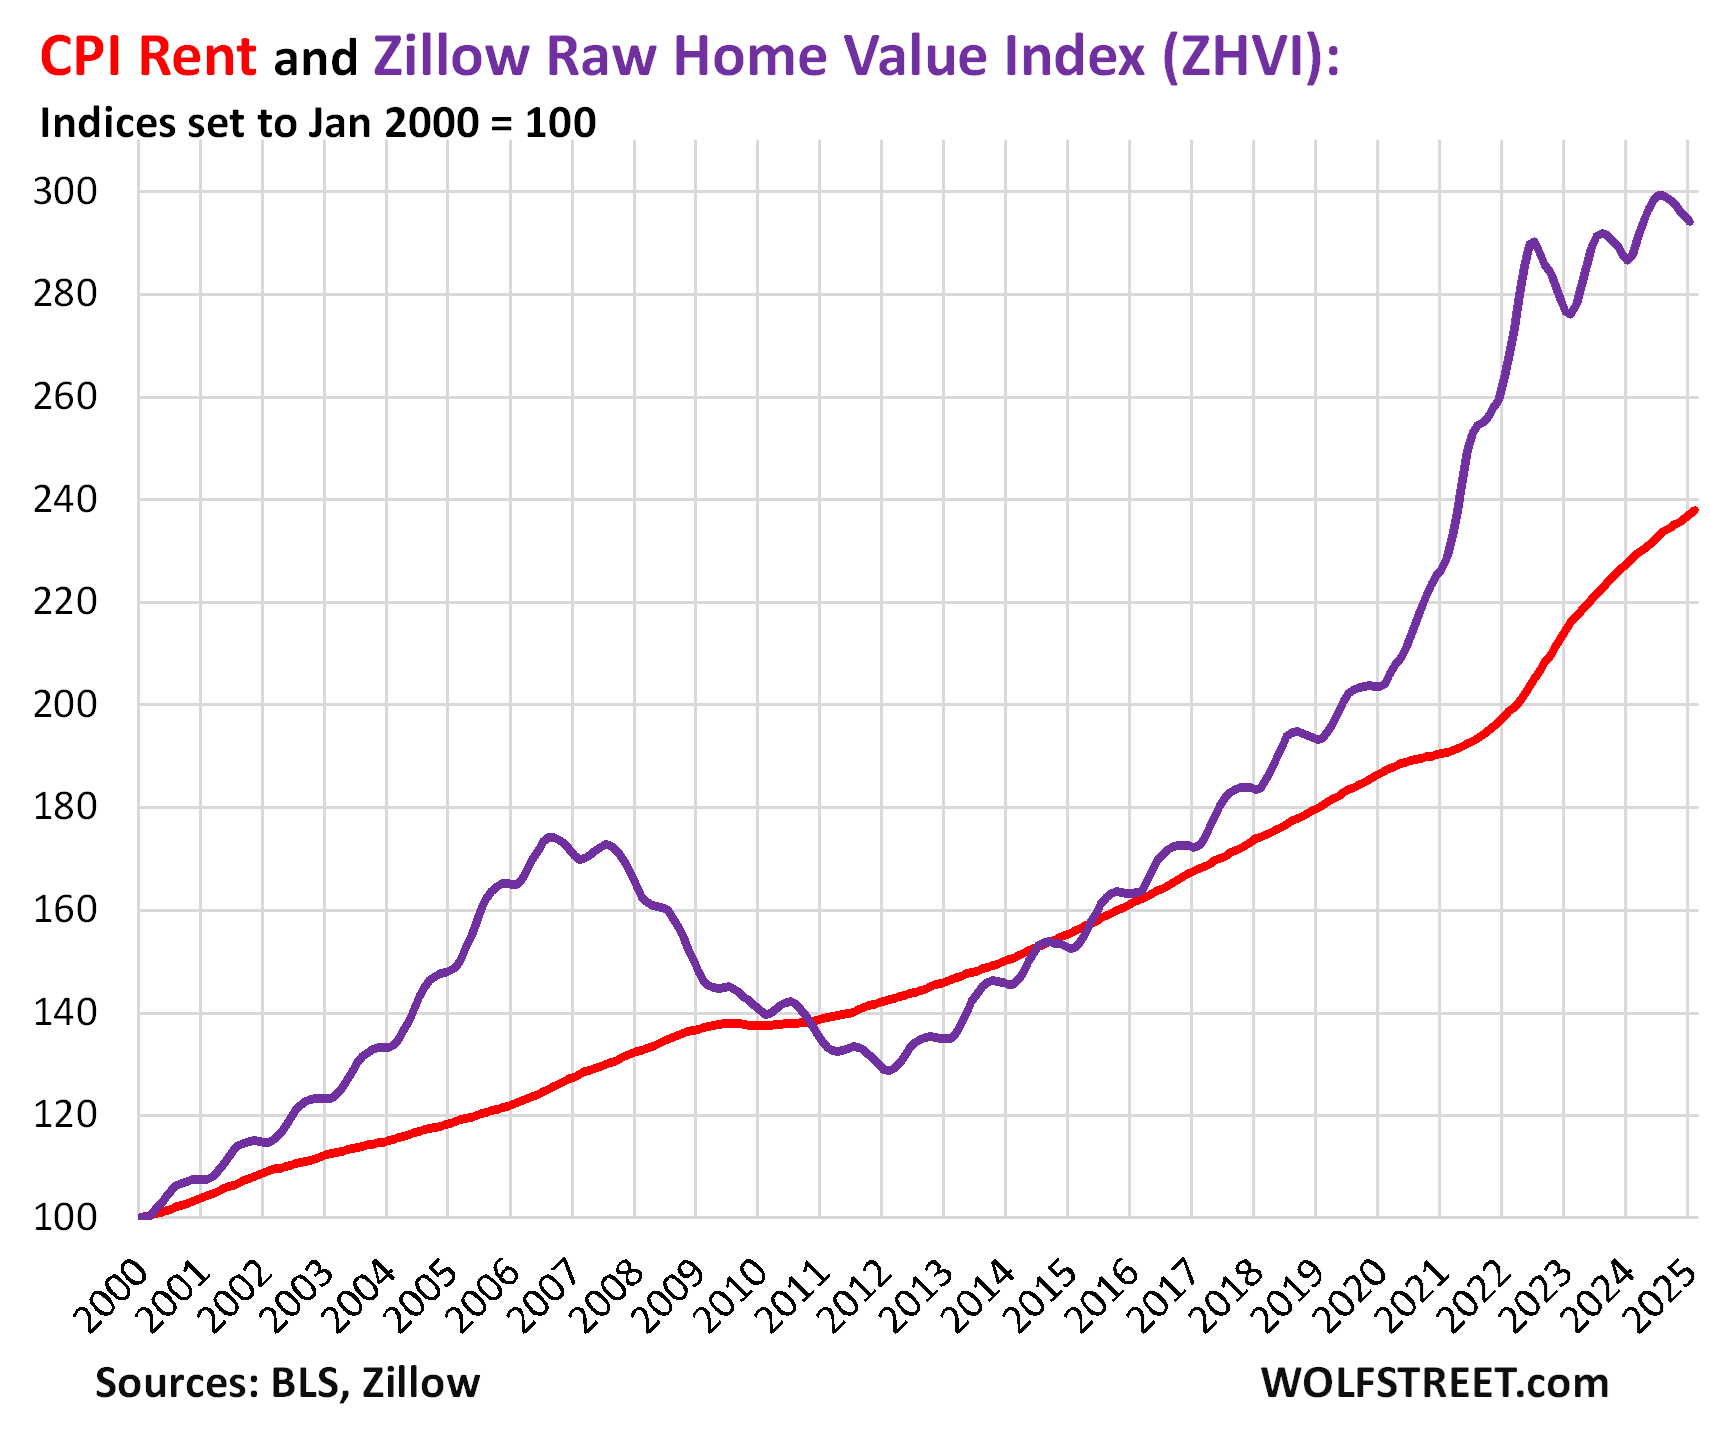
Rent inflation vs. home-price inflation: The red line in the chart below represents the CPI for Rent of Primary Residence as index value. The purple line represents Zillow’s “raw” Home Value Index for the US. Both indexes are set to 100 for January 2000 [but each metro dances to their own drummer… The Most Splendid Housing Bubbles in America, Jan 2025: The Price Drops & Gains in 33 of the Largest Housing Markets].
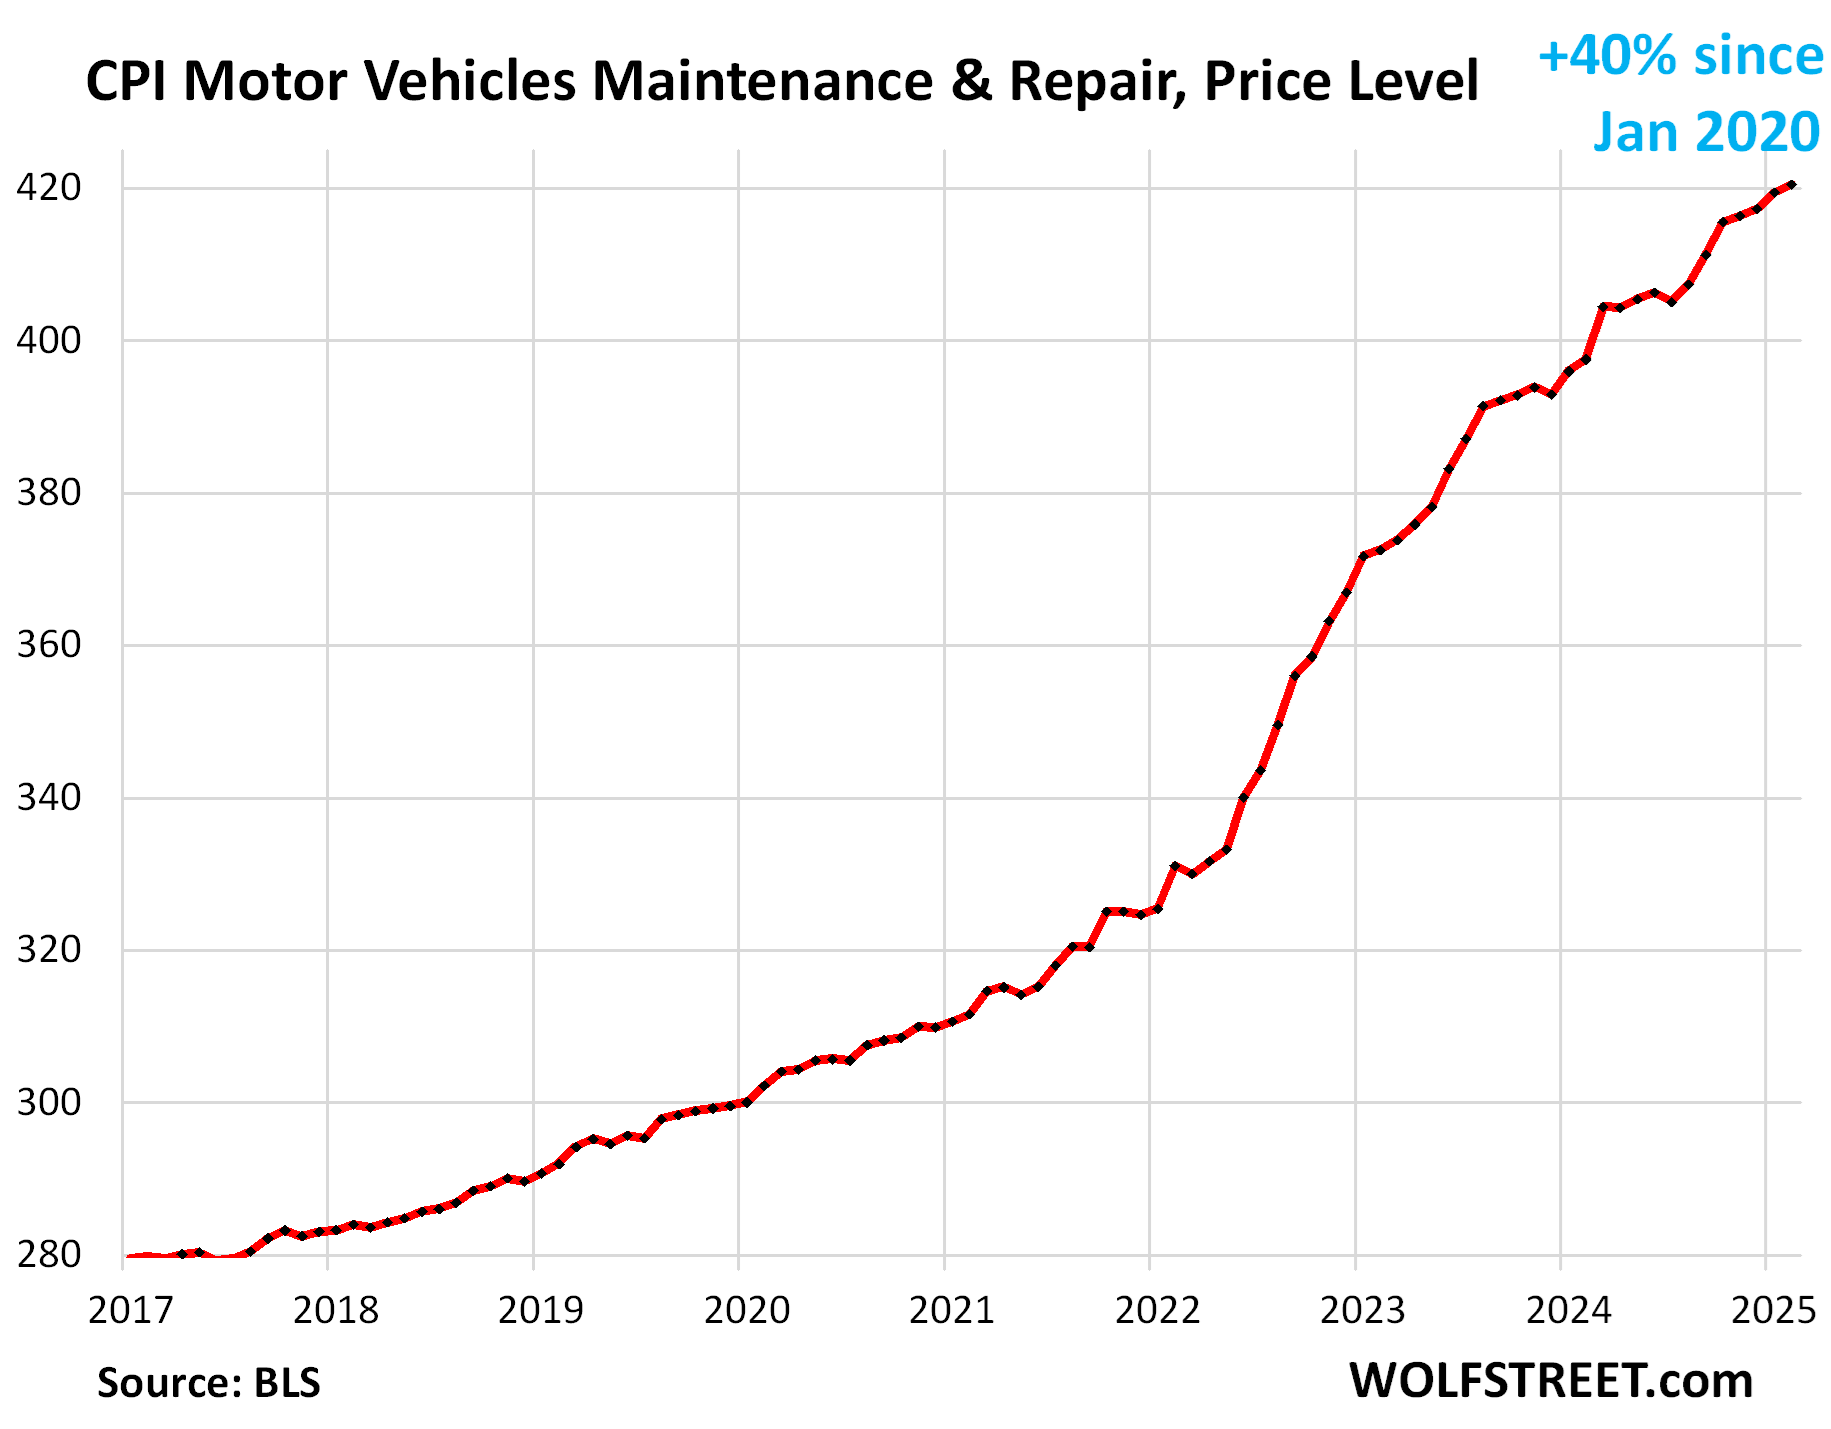
The CPI for motor-vehicle maintenance & repair rose by 3.1% annualized in February from January. Year-over-year, the index rose by 5.8%. Since January 2020, the index has surged by 40%. This chart shows the price level, not the year-over-year percentage change:
The CPI for motor vehicle insurance rose by 3.25% annualized in February from January, after the huge spike in the prior month. Year-over-year, the index surged by 11.1%, but that was a deceleration from the prior months and the least-bad increase since September 2022.
Since January 2022, motor vehicle insurance prices have exploded by 56%, fueled by the surge repair costs and the historic spike in used vehicle prices in 2021 and 2022, which increases the replacement costs for insurance companies.

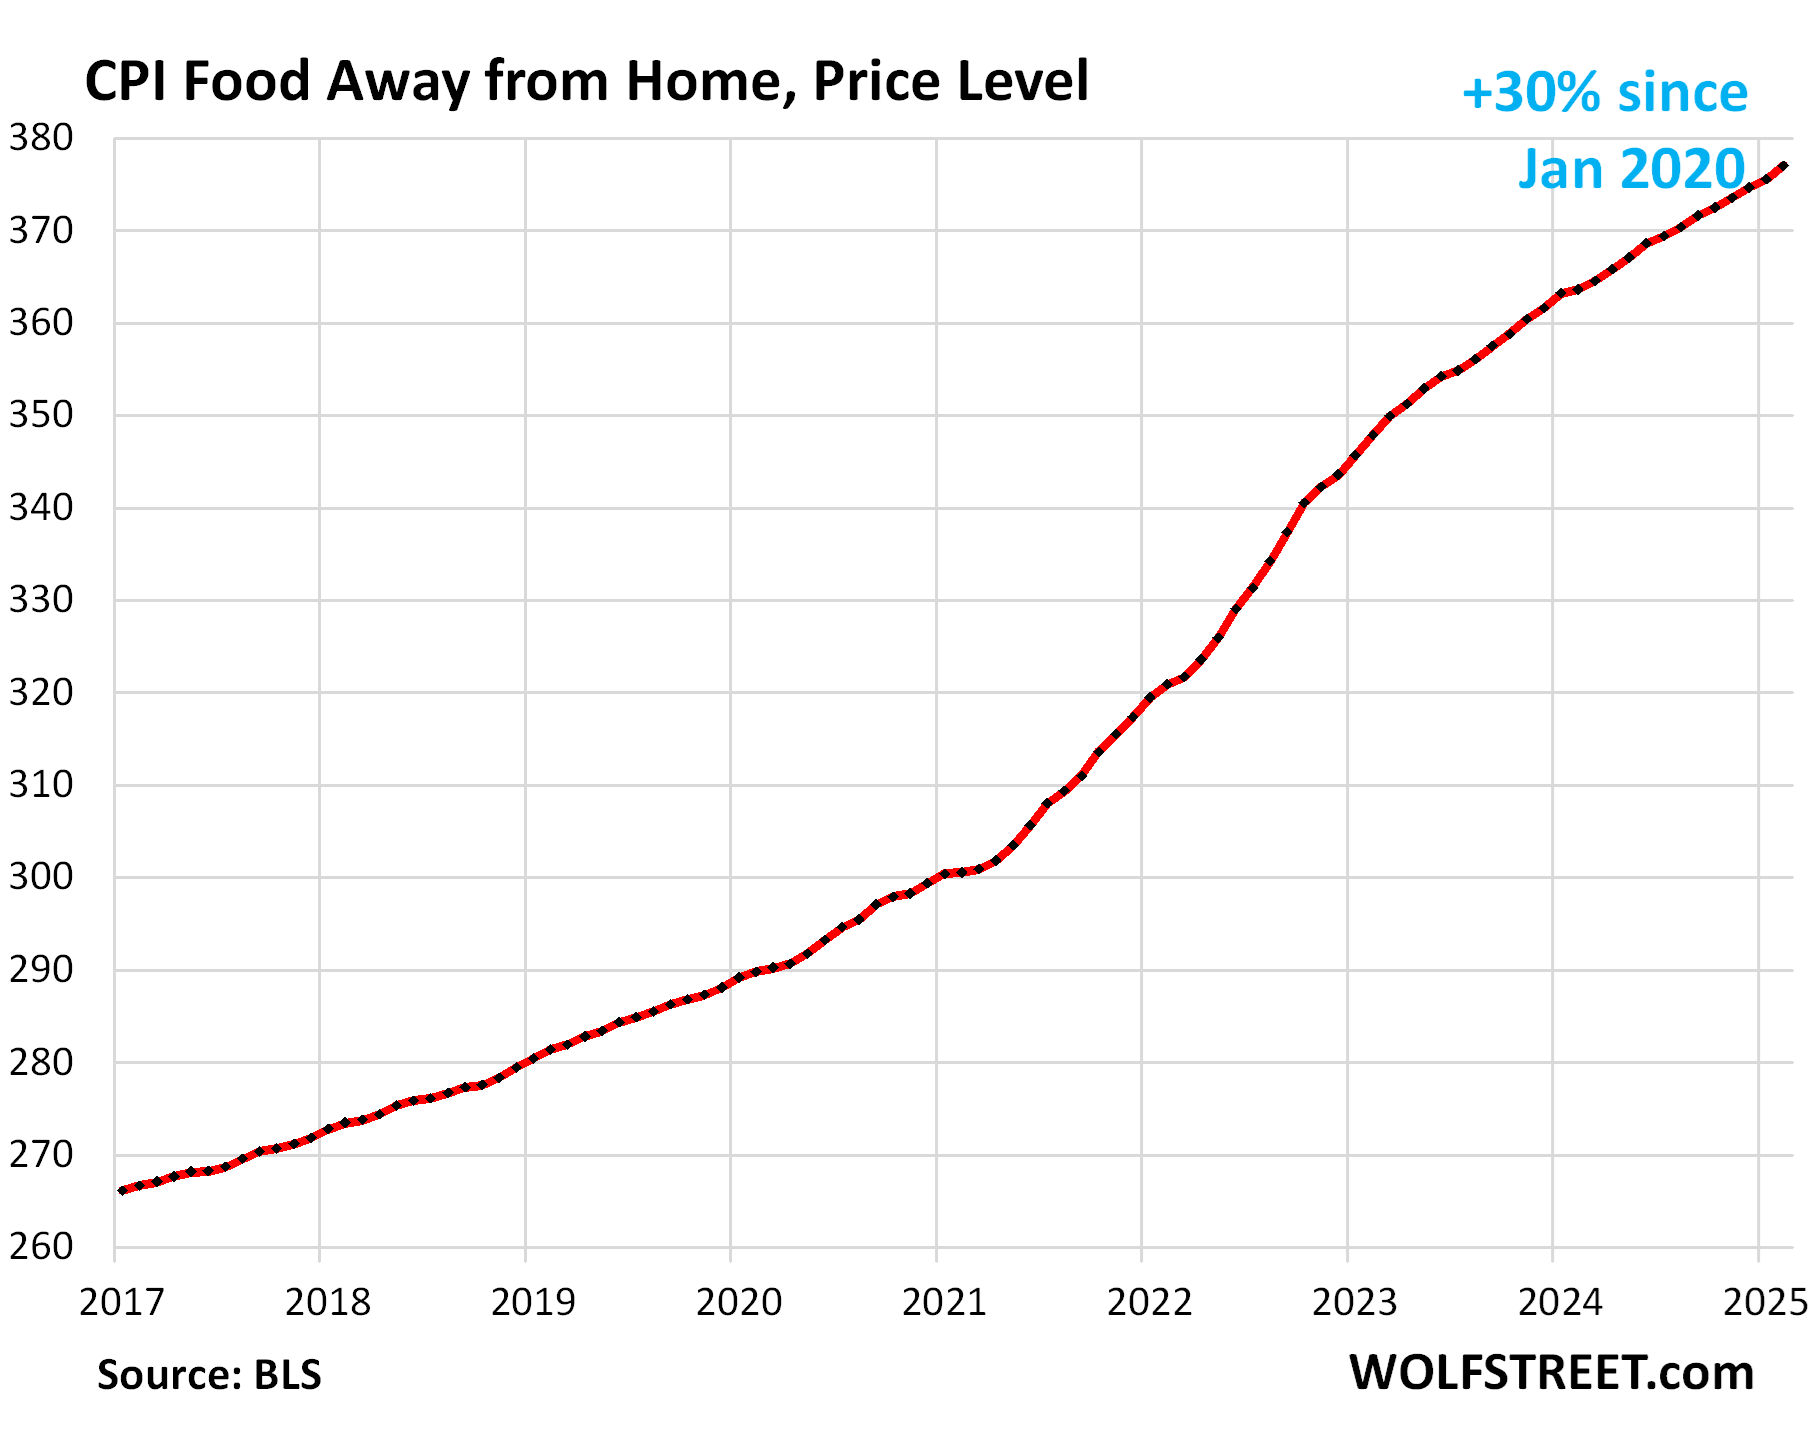
Food away from Home CPI jumped by 4.8% annualized in February from January. On a year-over-year basis, the index accelerated to +3.7%, worst increase since October.
These food services include full-service and limited-service meals and snacks served away from home, such as in restaurants, cafeterias, at stalls, etc.
The table below shows the major categories of “core services.” Combined, they accounted for 64% of total CPI:
| Major Services ex. Energy Services | Weight in CPI | MoM | YoY |
| Core Services | 64% | 0.3% | 4.8% |
| Owner’s equivalent of rent | 26.2% | 0.3% | 4.4% |
| Rent of primary residence | 7.5% | 0.3% | 4.1% |
| Medical care services & insurance | 6.7% | 0.3% | 3.0% |
| Food services (food away from home) | 5.6% | 0.4% | 3.7% |
| Motor vehicle insurance | 2.8% | 0.3% | 11.1% |
| Education (tuition, childcare, school fees) | 2.5% | 0.2% | 3.5% |
| Admission, movies, concerts, sports events, club memberships | 2.1% | 0.6% | 4.3% |
| Other personal services (dry-cleaning, haircuts, legal services…) | 1.6% | 0.9% | 3.8% |
| Public transportation (airline fares, etc.) | 1.5% | -3.4% | -0.6% |
| Telephone & wireless services | 1.5% | 0.1% | 0.1% |
| Lodging away from home, incl Hotels, motels | 1.3% | 0.2% | 3.5% |
| Water, sewer, trash collection services | 1.1% | 1.0% | 4.9% |
| Motor vehicle maintenance & repair | 1.0% | 0.3% | 5.8% |
| Internet services | 0.9% | 1.1% | -0.7% |
| Video and audio services, cable, streaming | 0.8% | 1.0% | 3.7% |
| Pet services, including veterinary | 0.5% | 0.1% | 5.9% |
| Tenants’ & Household insurance | 0.4% | 0.8% | 3.0% |
| Car and truck rental | 0.1% | -1.3% | -7.1% |
| Postage & delivery services | 0.1% | -2.7% | 3.0% |
Prices of Goods.
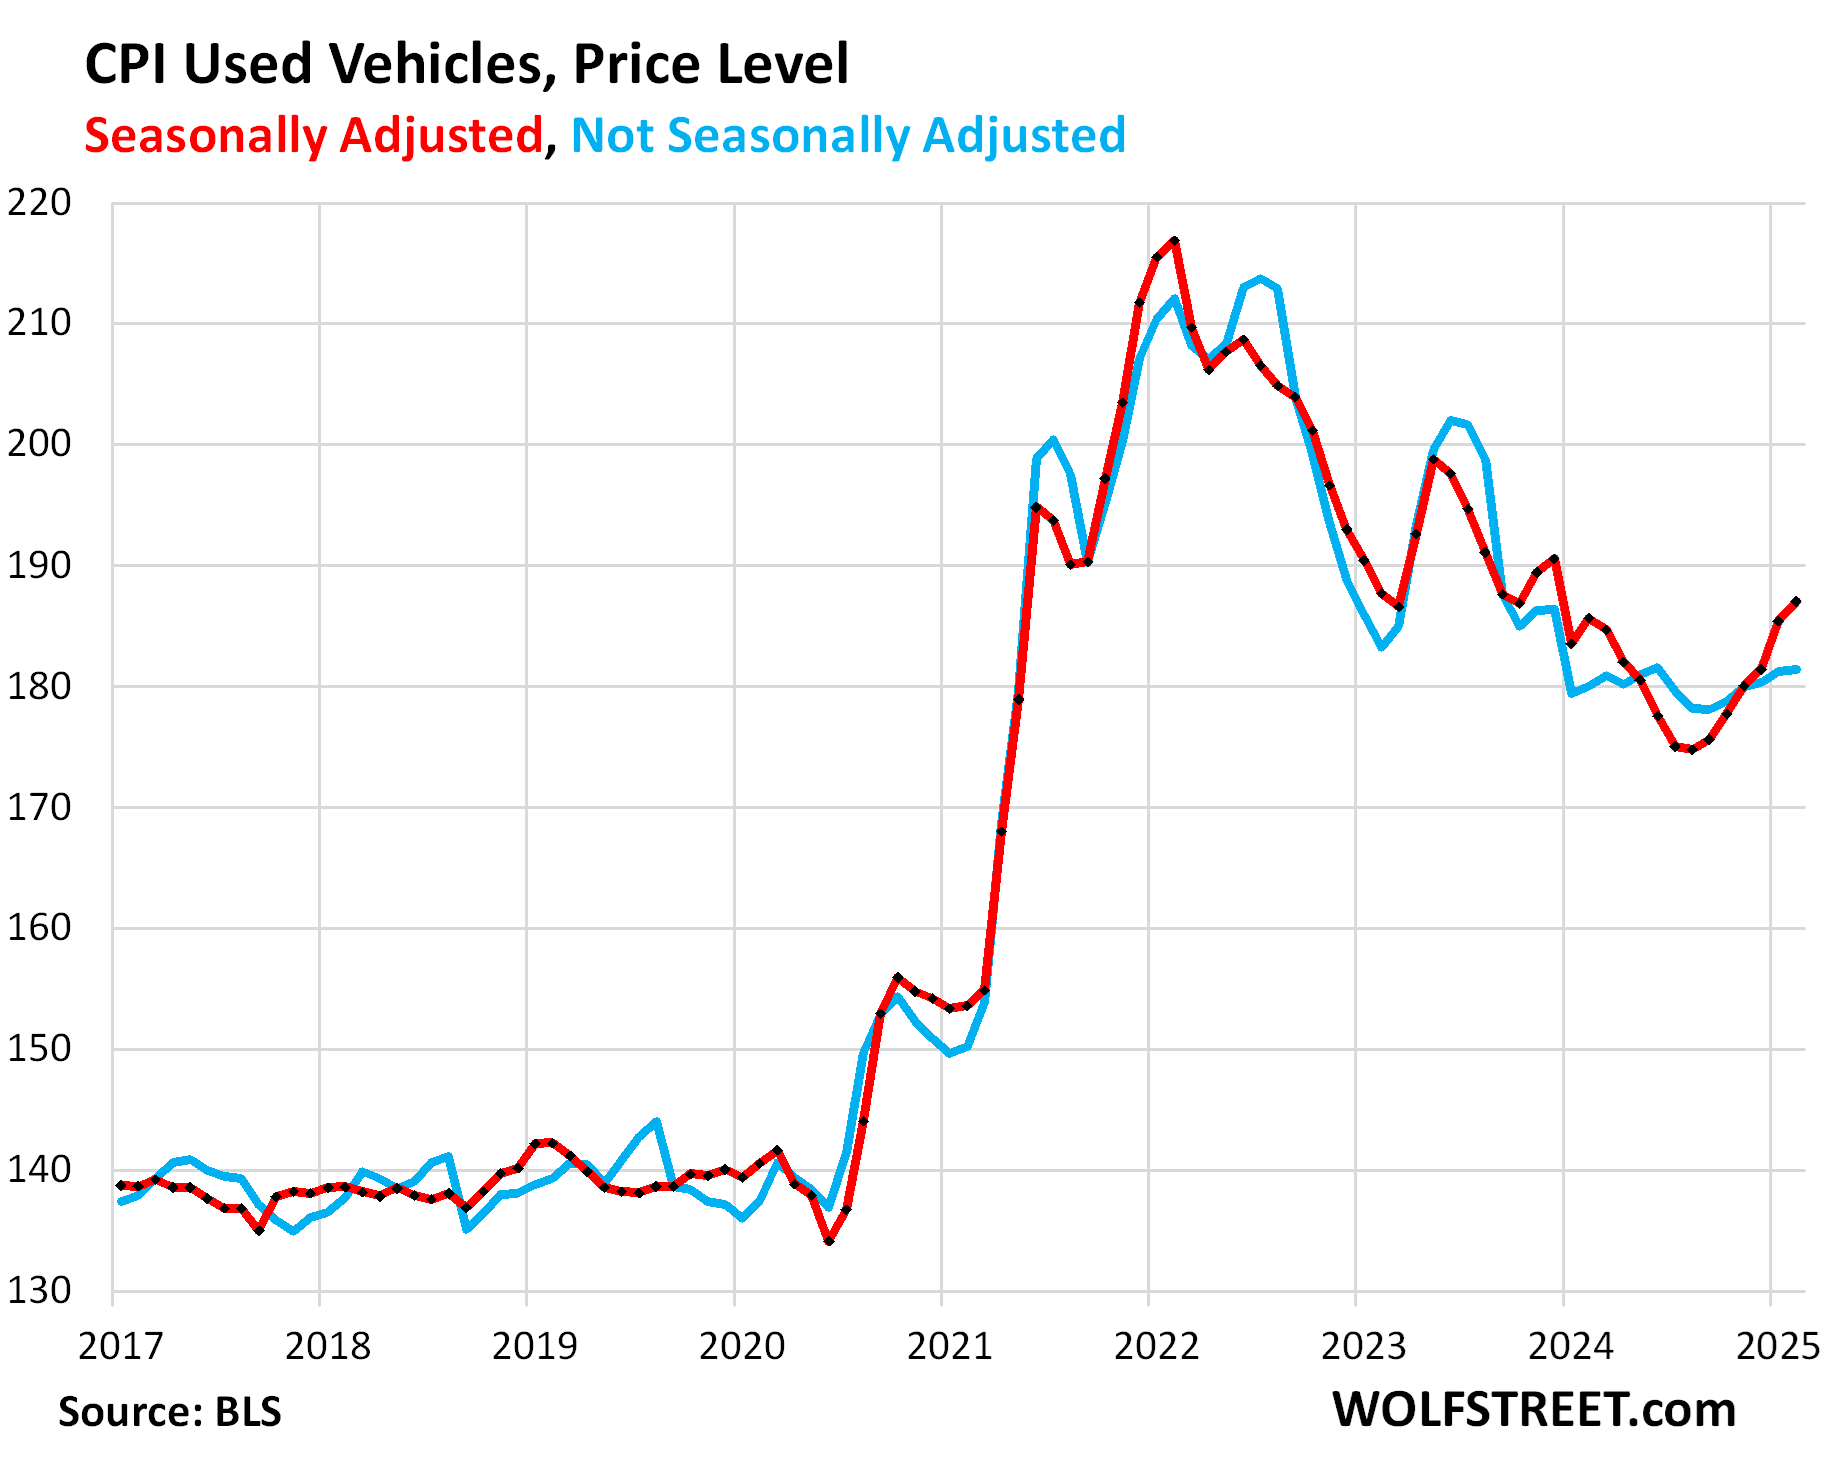
The used vehicle CPI jumped by 0.9% not annualized (+11.1% annualized) in February from January, seasonally adjusted, the sixth month-to-month increase in a row.
Year-over-year, used vehicle prices rose by 0.8%, the second month in a row of year-over-year increases, after steep declines topping out at 10% year-over-year drops last summer.
The historic plunge of used vehicle prices from early 2022 through August 2024 was one of the factors in the cooling of CPI inflation over that period. That’s now over.
Since January 2020, prices are up by 34%, despite the plunge from early 2022 through August 2024.
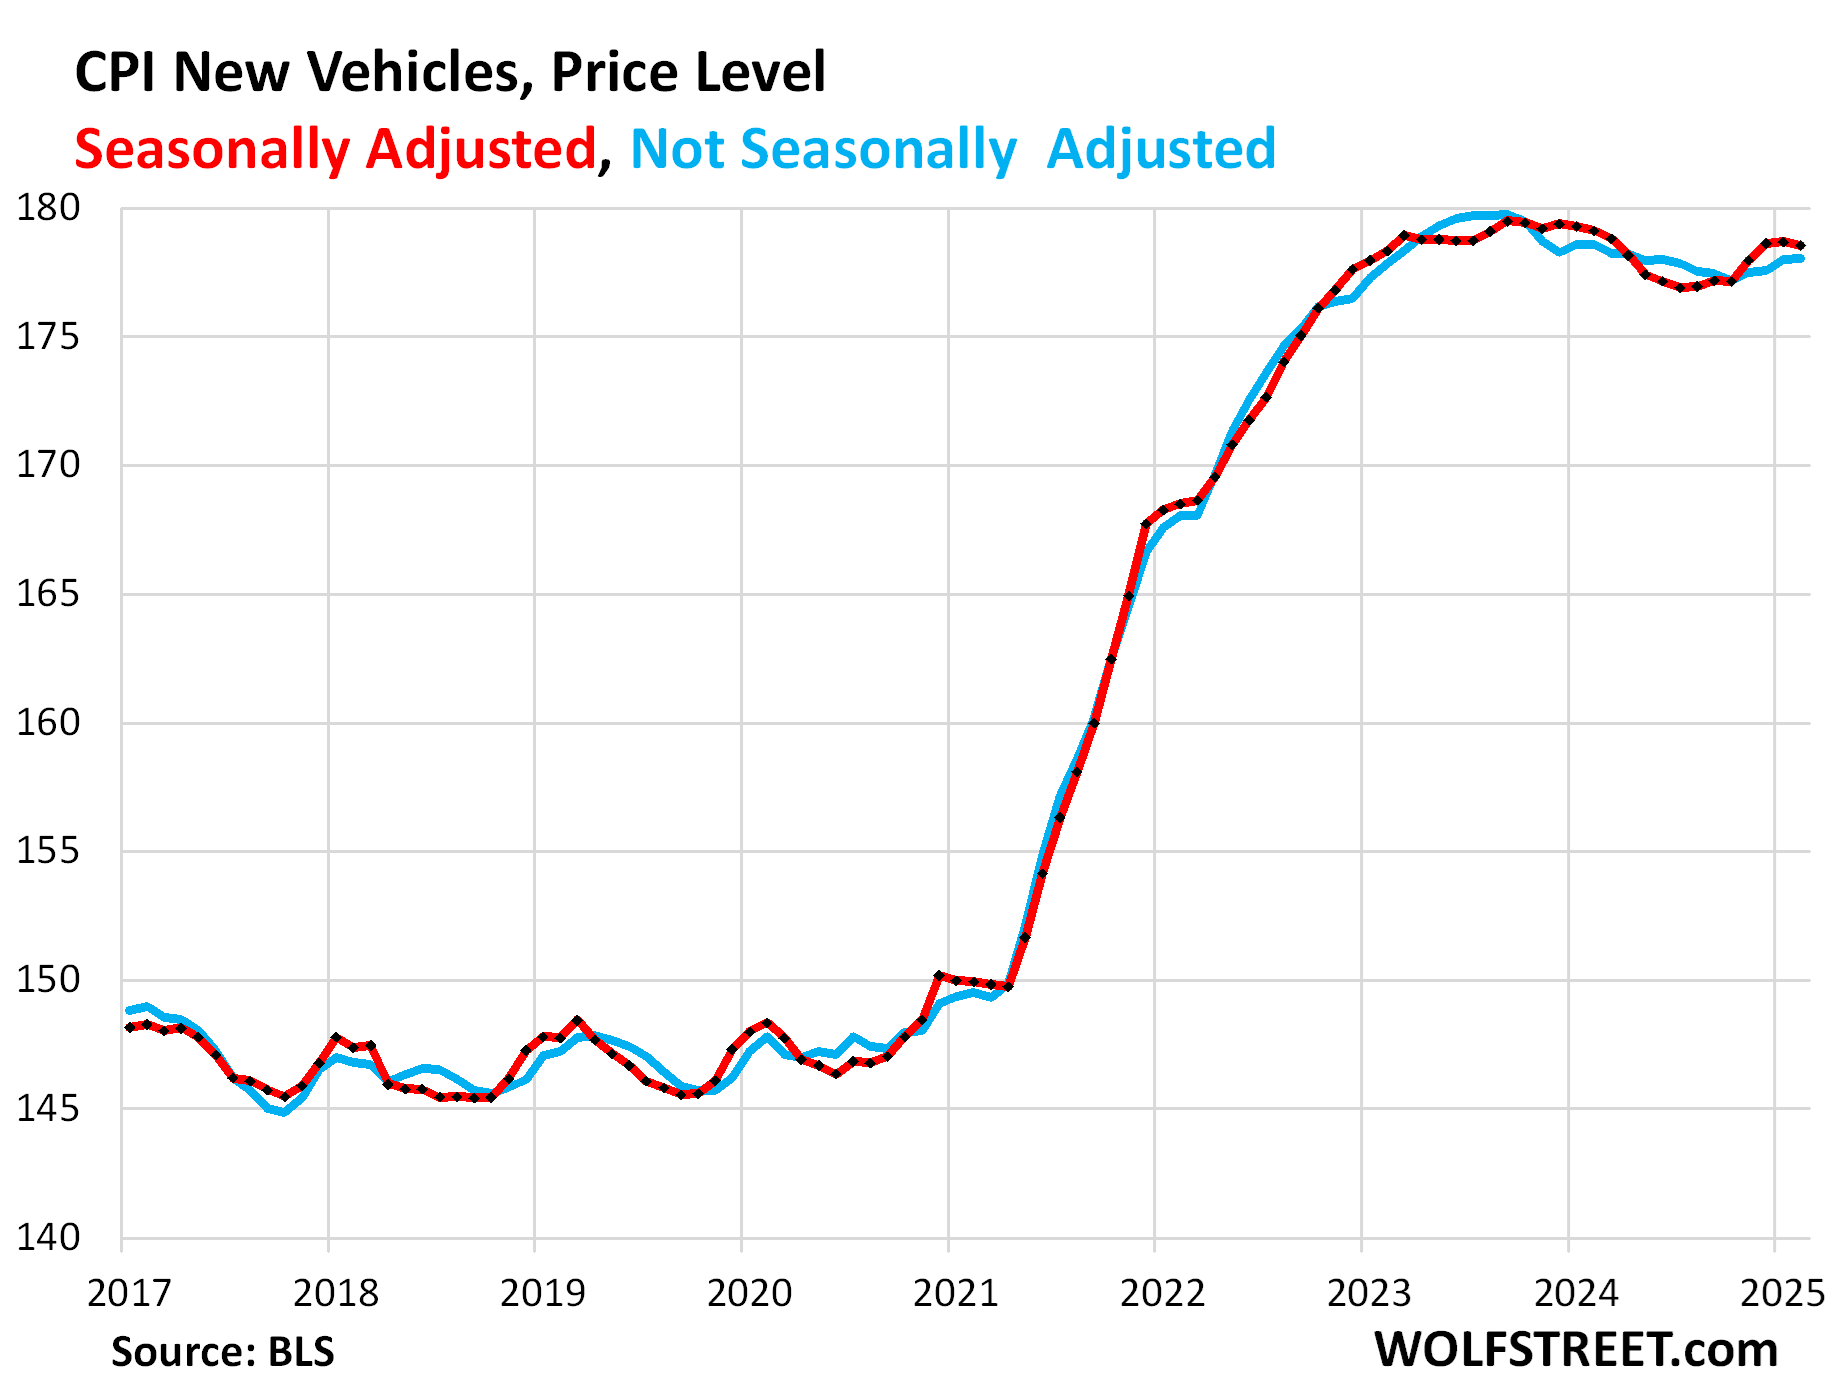
New vehicles CPI edged down a hair in February from January, seasonally adjusted. Year-over-year, the index edged down by 0.3%.
New-vehicle prices have proven to be sticky, unlike used-vehicle prices, despite lots of supply of new vehicles now on many lots. Automakers and dealers are giving their darndest to preserve their profit margins while maintaining unit sales.
It’s hard to imagine how they’re going to pass on tariffs without crushing their sales in this environment, which is why certain US automakers that have offshored the most, such as Ford, are so upset about the tariffs: They know they have to eat them. They know they cannot pass them on without seriously damaging their sales.
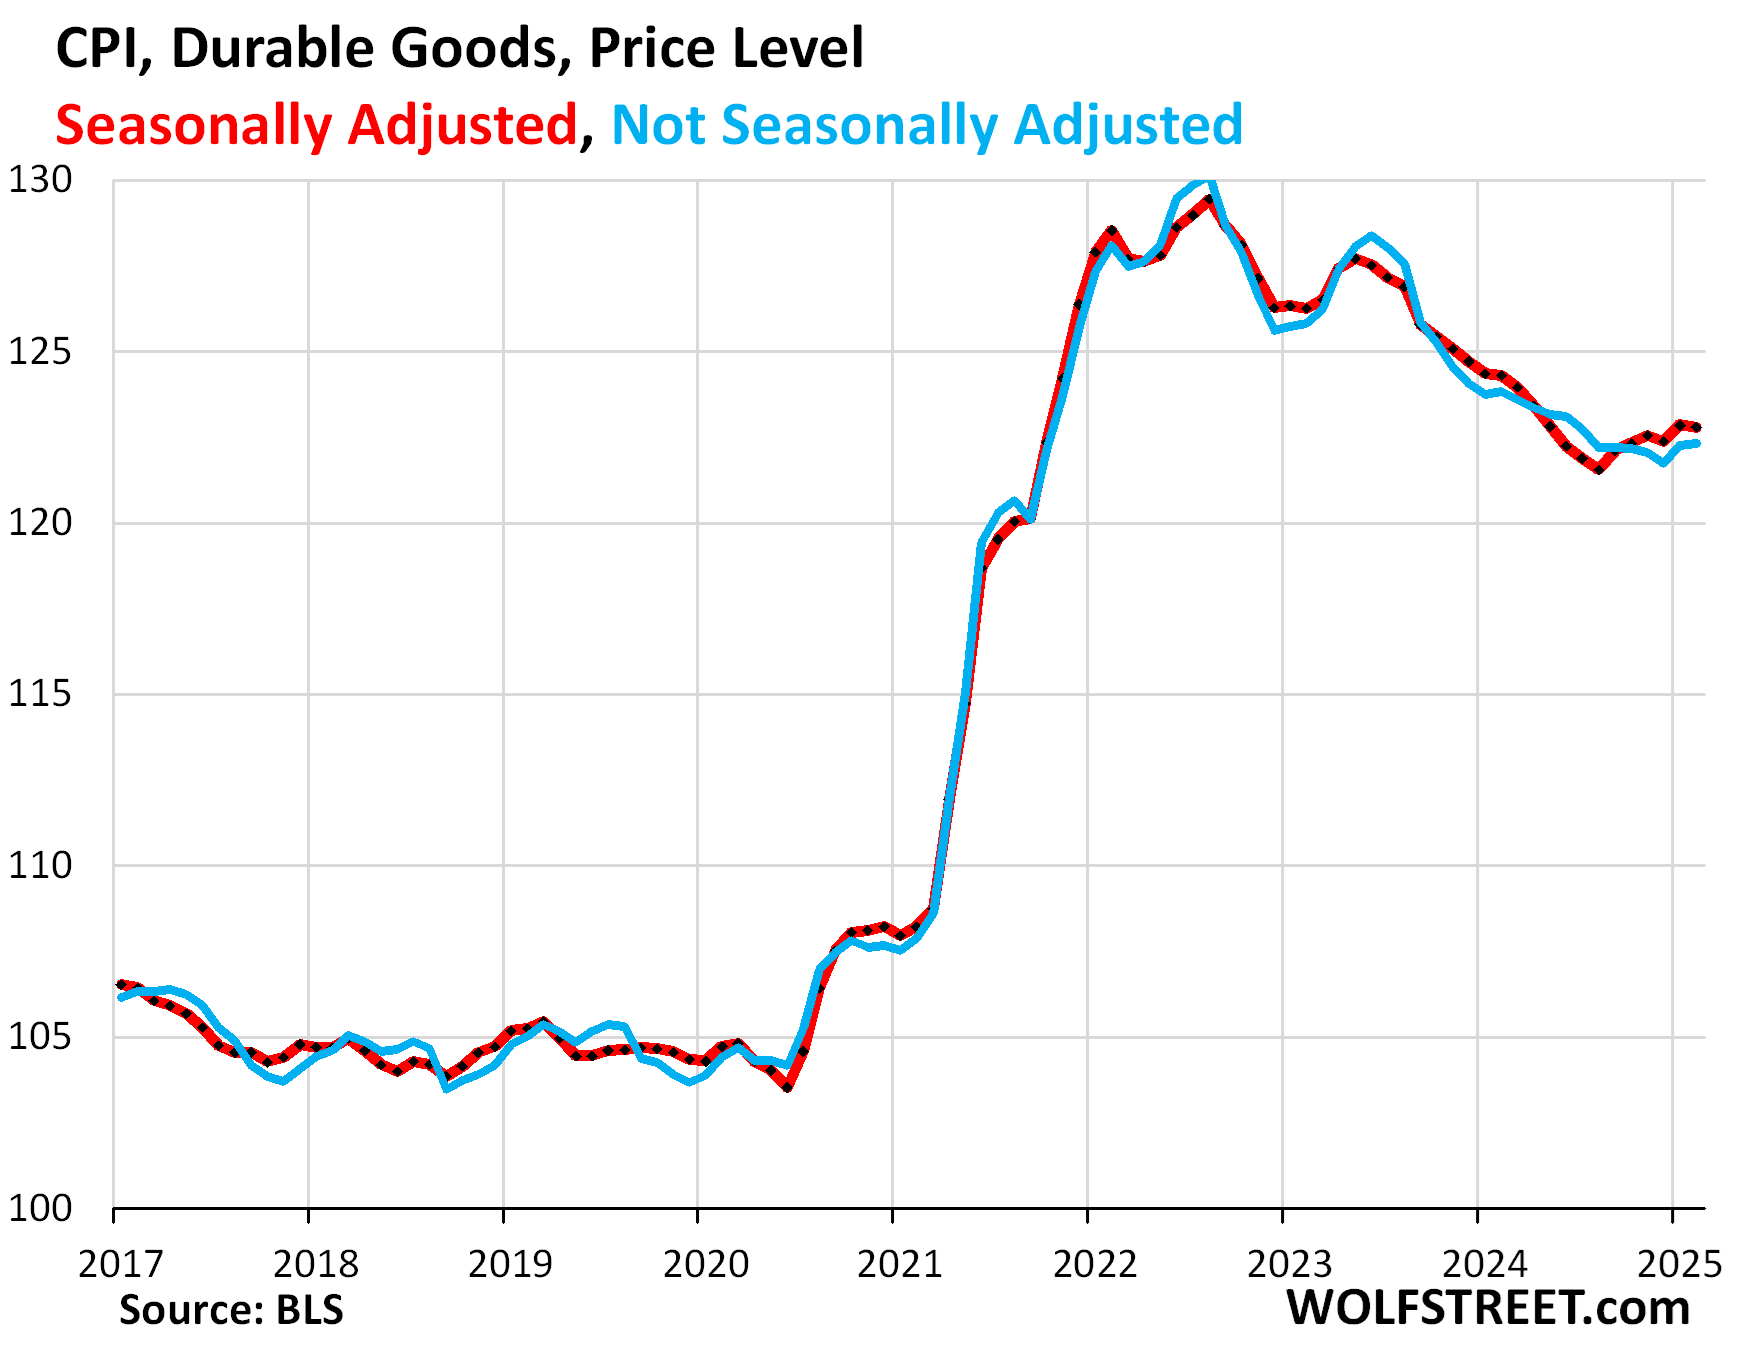
Durable Goods – dominated by new and used vehicles – have experienced price declines (deflation) across the board, starting in mid- to late 2022, after the huge price spikes during the pandemic. But at least part of that has ended now:
| Major durable goods categories | MoM | YoY |
| Durable goods overall | -0.1% | -1.2% |
| New vehicles | -0.1% | -0.3% |
| Used vehicles | 0.9% | 0.8% |
| Household furnishings (furniture, appliances, floor coverings, tools) | 0.2% | -0.4% |
| Sporting goods (bicycles, equipment, etc.) | -2.2% | -5.3% |
| Information technology (computers, smartphones, etc.) | -0.2% | -8.6% |
Food Inflation.
The CPI for “Food at home” was unchanged in February, after the big jump in January. This is food purchased at stores and markets and eaten off premises.
Year-over-year, the index rose by 1.8%. Since January 2020, food prices have surged by 28%.
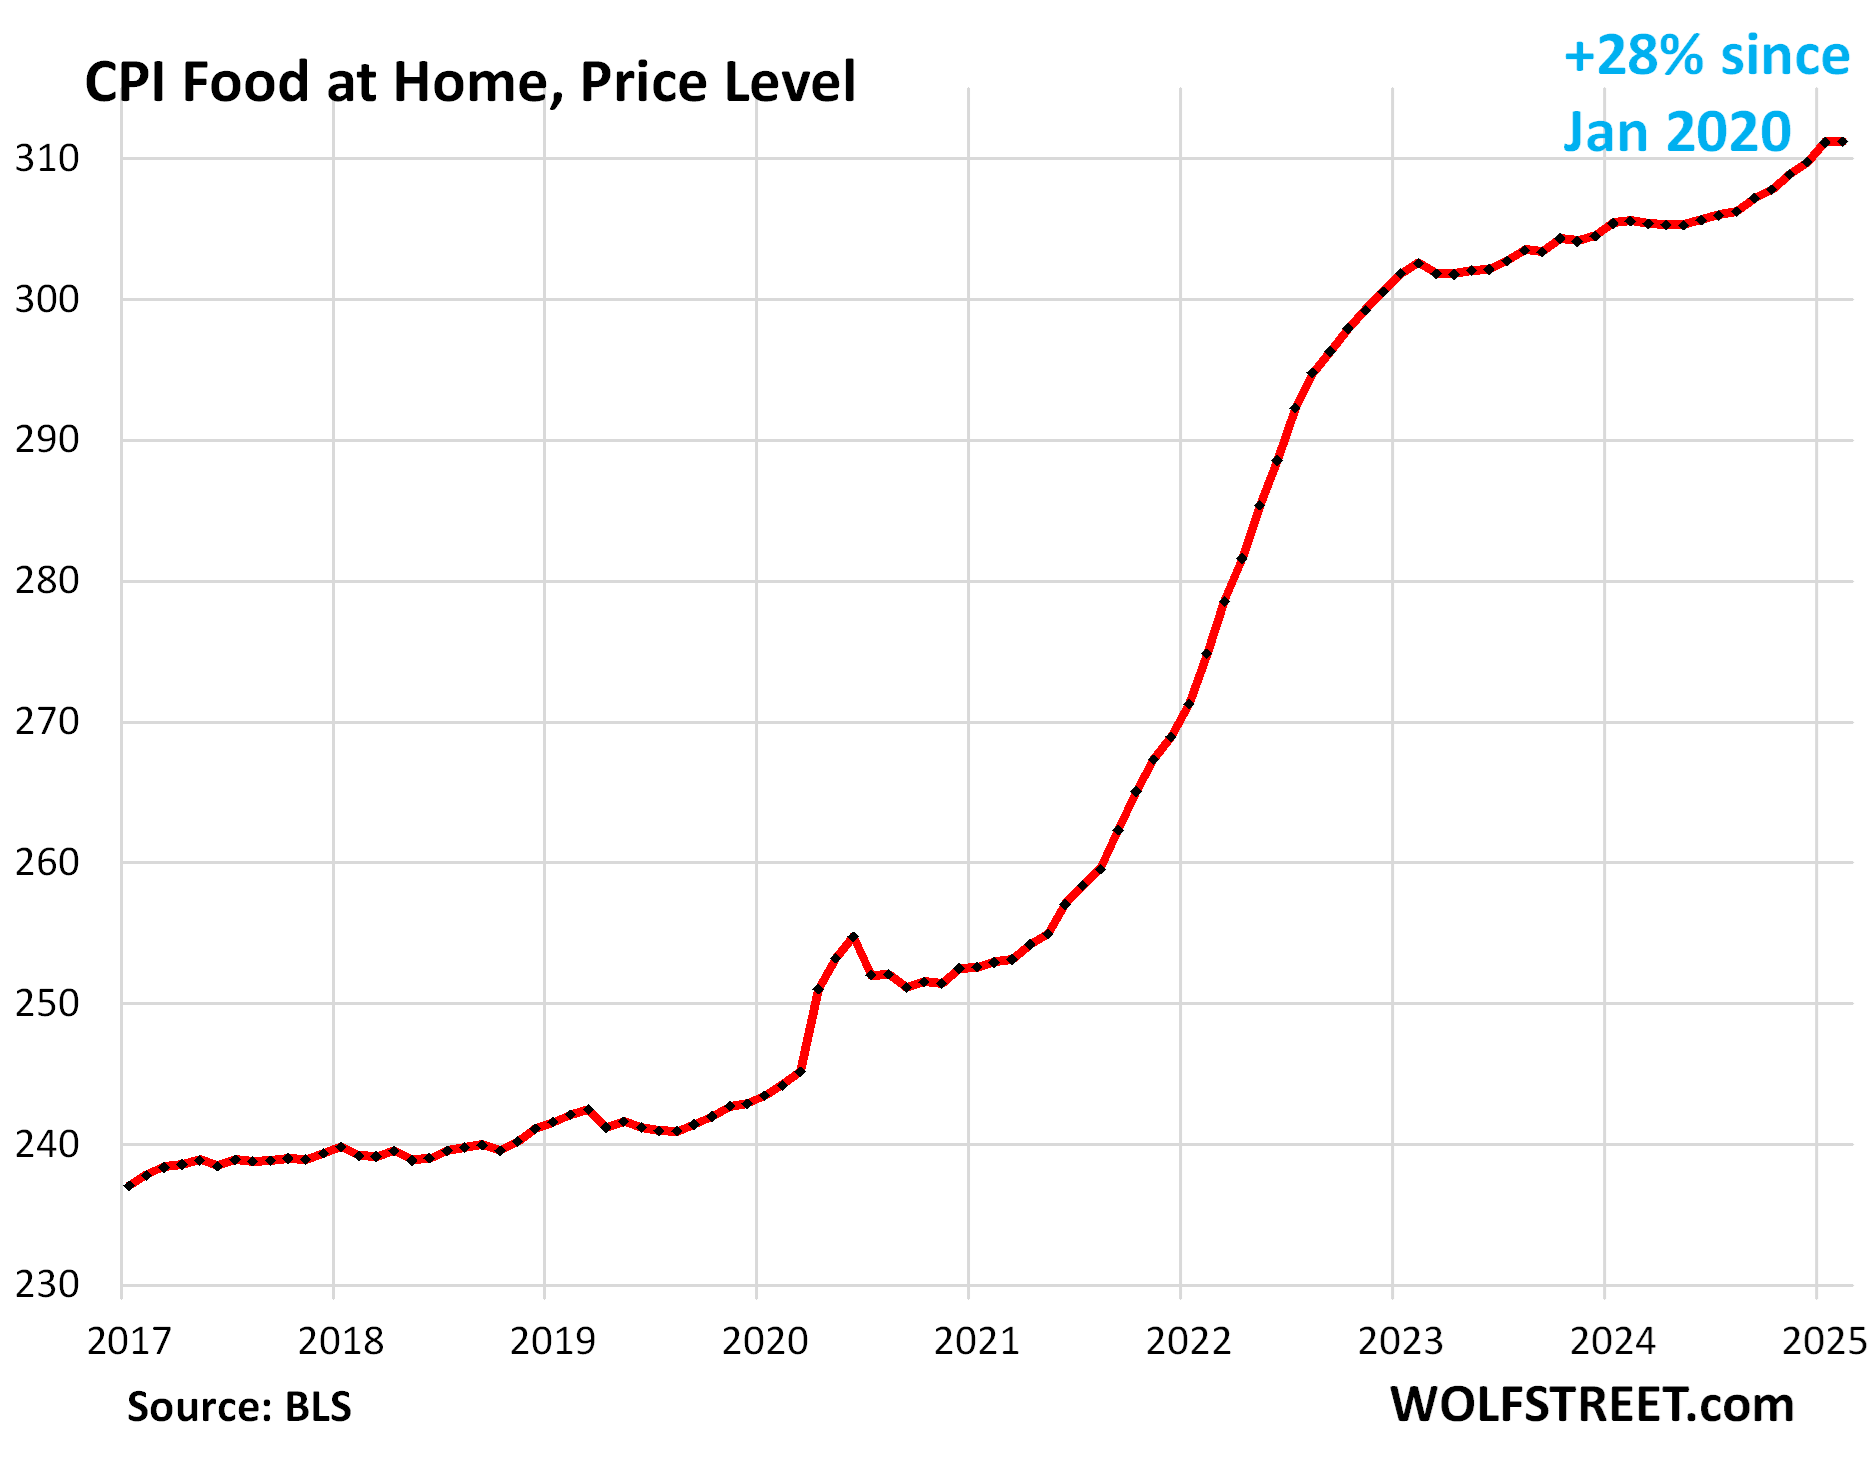
The avian-flu-triggered price spike of eggs, which started in early 2024, seems to have run its course and is beginning to cool.
Big month-to-month and year-over-year increases also occurred with beef, where prices already soared in prior years, and coffee.
| MoM | YoY | |
| Food at home | 0.0% | 1.9% |
| Cereals, breads, bakery products | 0.4% | 0.3% |
| Beef and veal | 2.4% | 7.6% |
| Pork | -1.4% | 1.8% |
| Poultry | -0.2% | 1.3% |
| Fish and seafood | 0.7% | 1.8% |
| Eggs | 10.4% | 58.8% |
| Dairy and related products | -1.0% | 0.8% |
| Fresh fruits | -0.8% | 1.9% |
| Fresh vegetables | -0.5% | -2.5% |
| Juices and nonalcoholic drinks | -0.8% | 1.3% |
| Coffee, tea, etc. | 1.8% | 6.0% |
| Fats and oils | -0.2% | -0.2% |
| Baby food & formula | -0.4% | 0.0% |
| Alcoholic beverages at home | 0.1% | 0.4% |
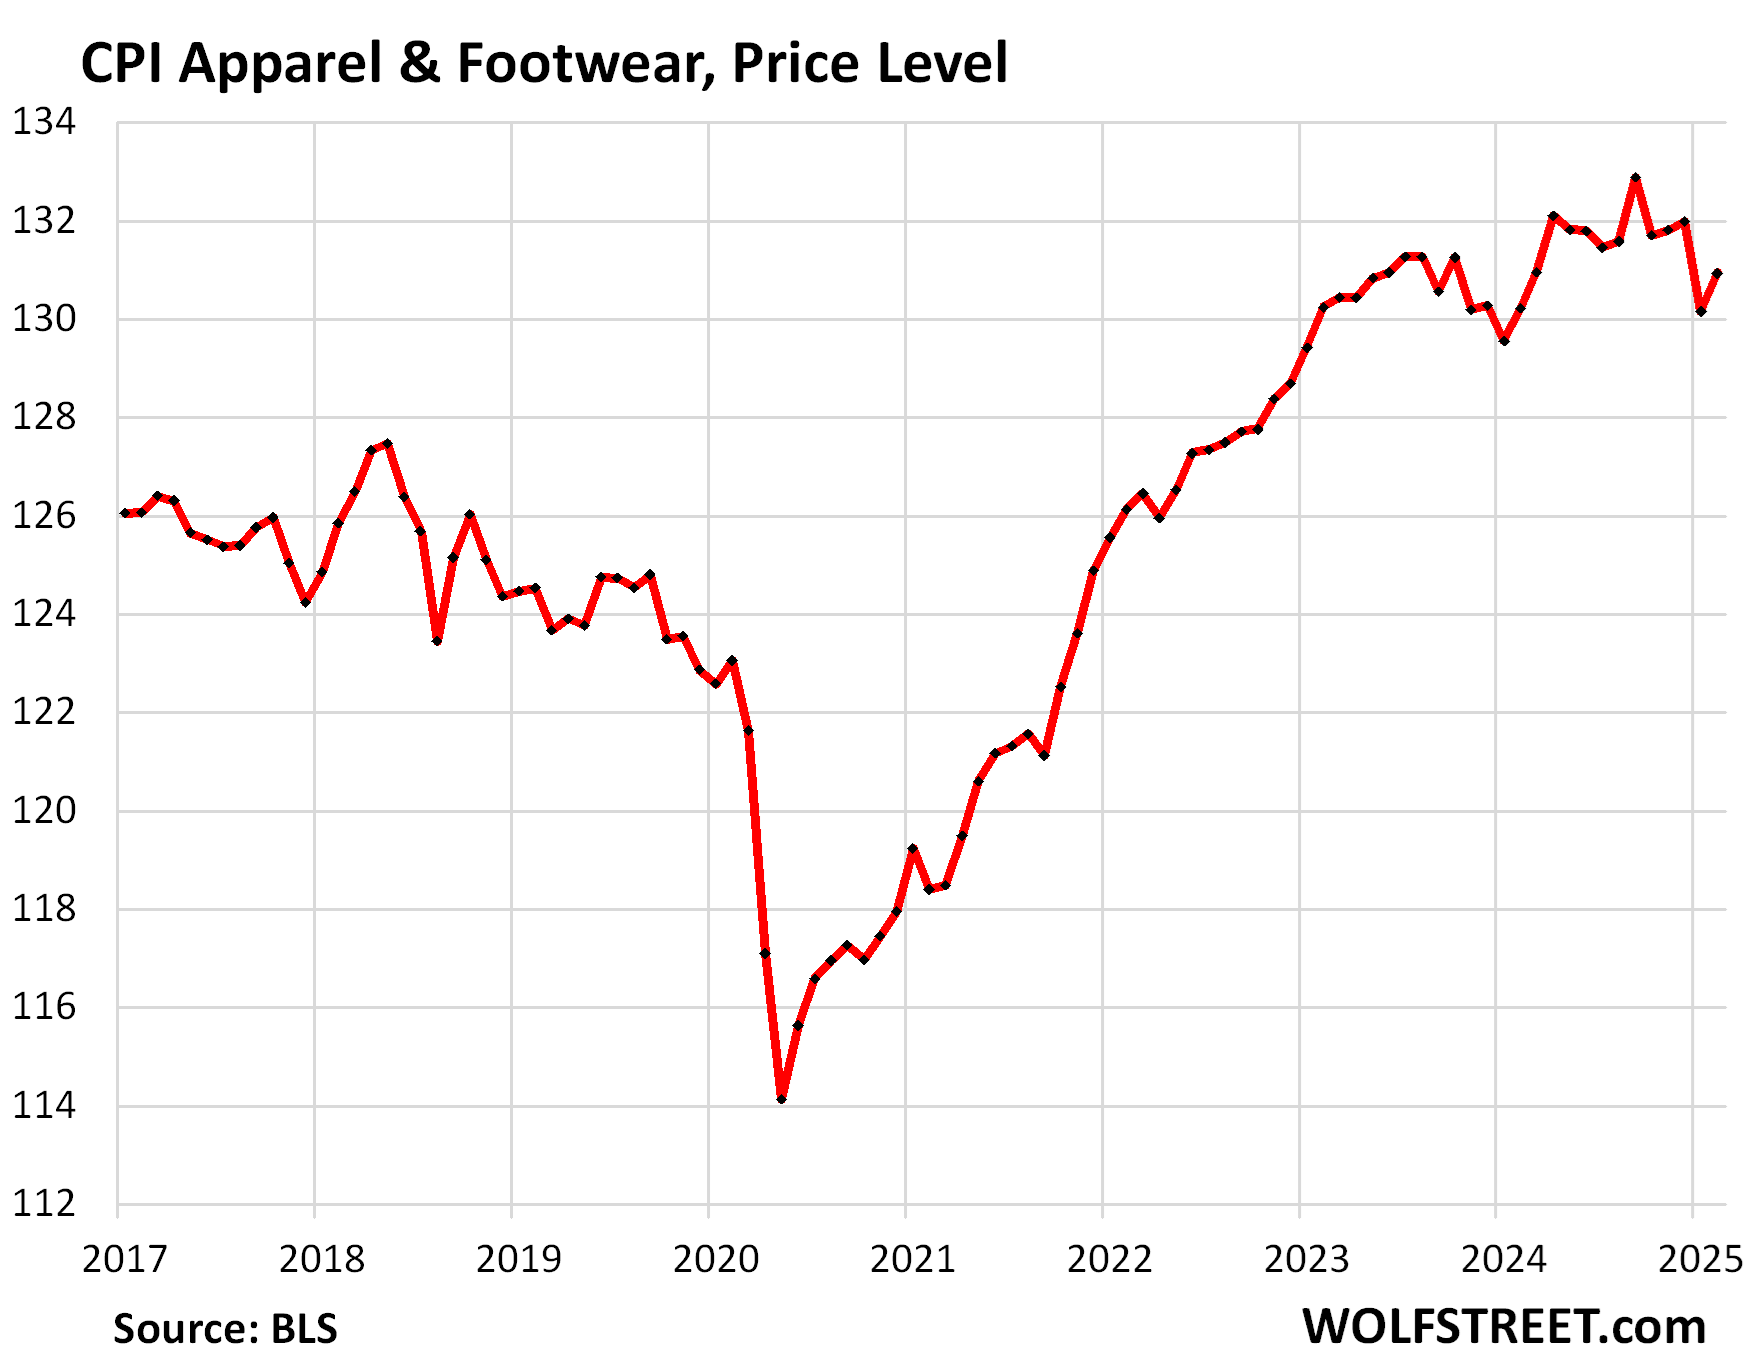
Apparel and footwear.
The CPI for apparel and footwear jumped by 0.6% (not annualized), undoing about half of the drop in the prior month. Year-over-year, the index rose 0.5%.
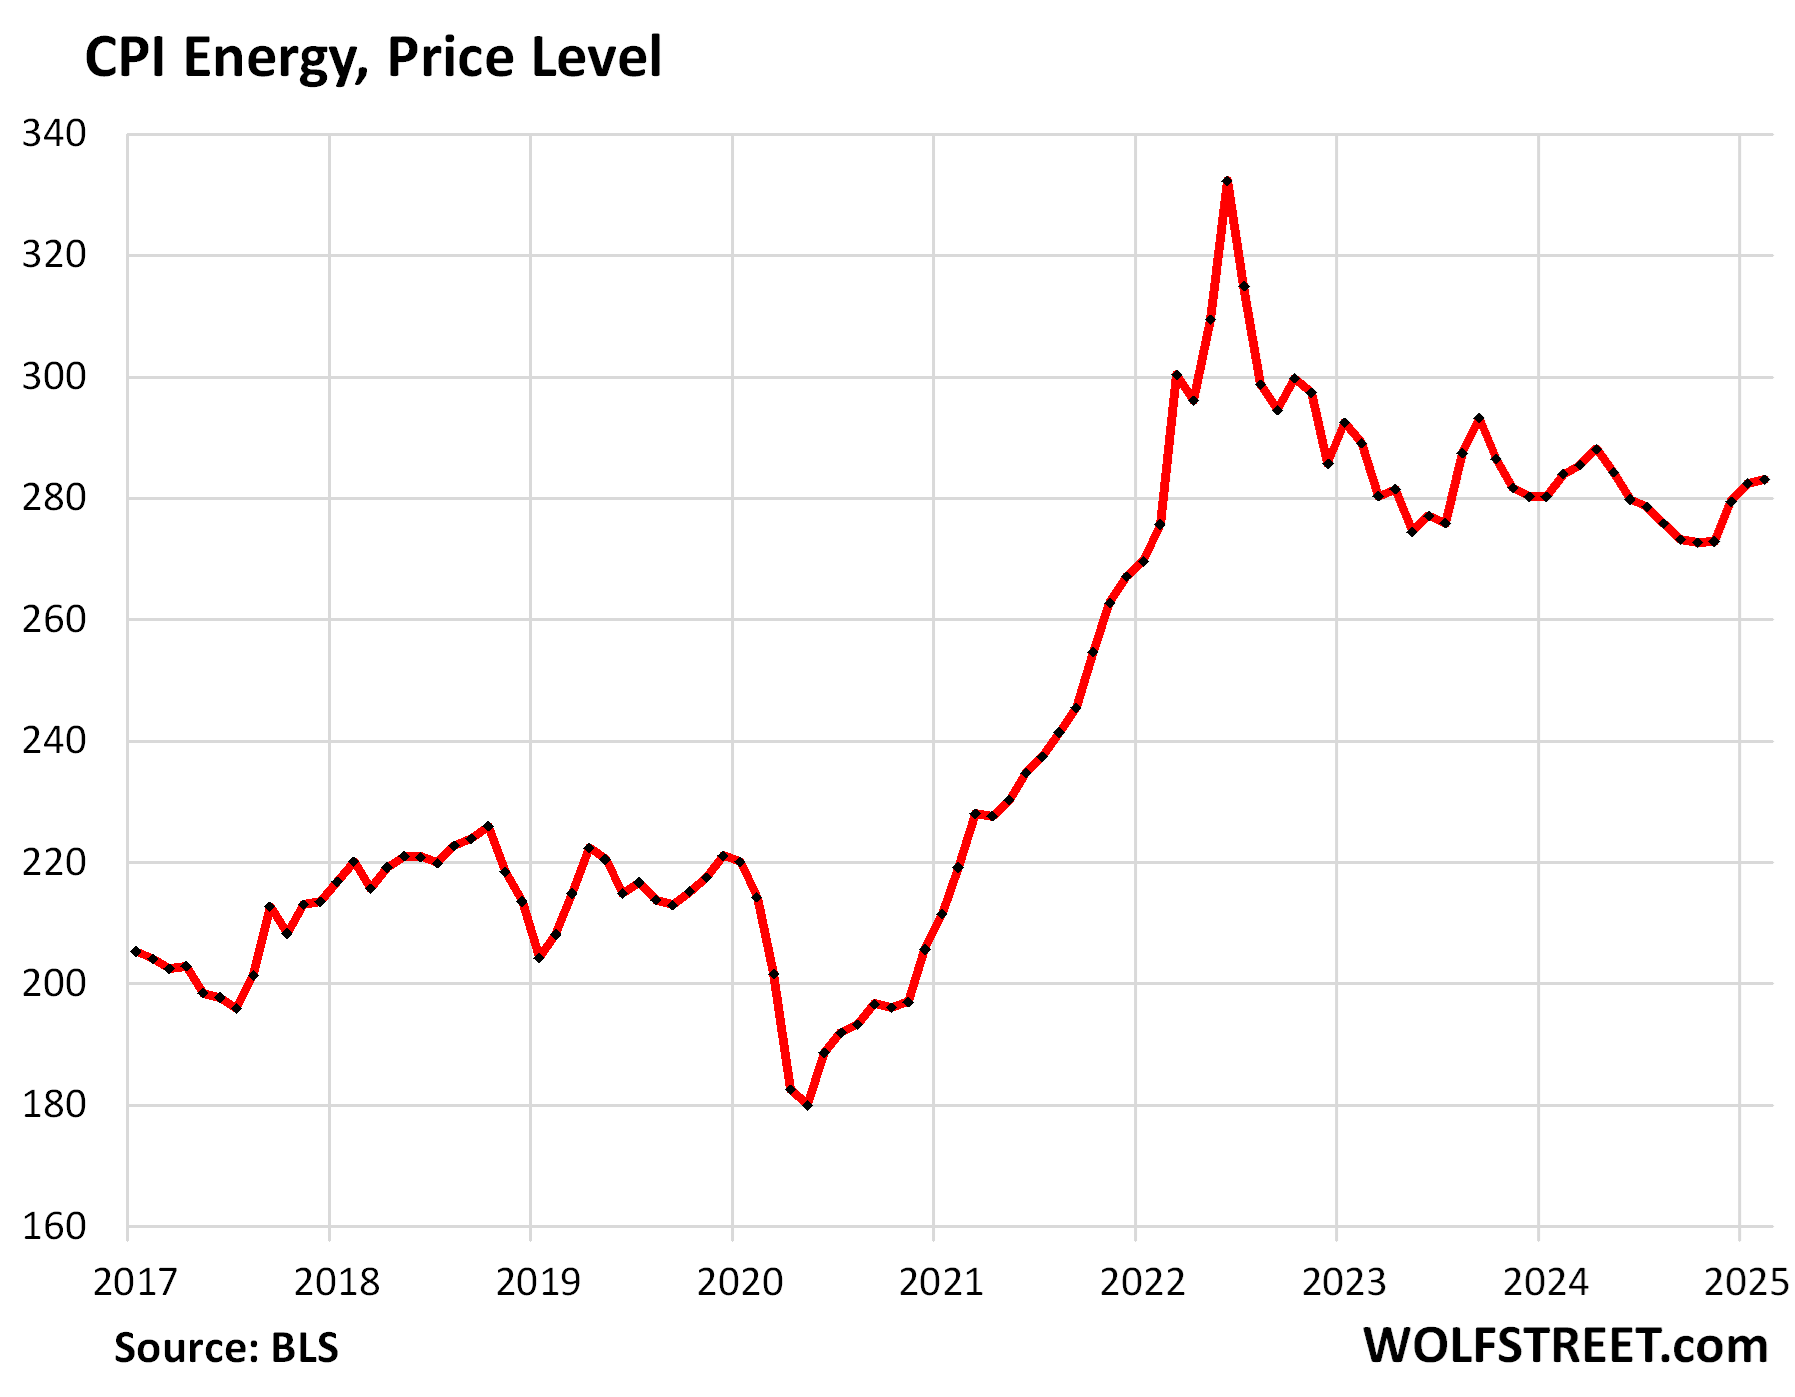
Energy.
The CPI for gasoline makes up about half of the overall energy CPI. Seasonally adjusted, it fell by 1.0% (not annualized) in February, undoing part of the increase in January.
Not seasonally adjusted, the index rose month-to-month, but slightly less than normally in February.
Year-over-year, the index fell by 3.1%. This decline essentially since the summer of 2022 was a significant contributor to the cooling of overall CPI in February.

The CPI for energy rose by 0.2% for the month, despite the drop in gasoline prices. The driver was a big jump in natural gas prices. We discussed the 140% year-over-year price spike of natural gas in the futures market here, which has started to bleed into prices charged by utilities for natural gas piped to the home. The index for electricity services also increased as 43% of the electricity in the US is generated by natural-gas fired powerplants.
| CPI for Energy, by Category | MoM | YoY |
| Overall Energy CPI | 0.2% | -0.2% |
| Gasoline | -1.0% | -3.1% |
| Electricity service | 1.0% | 2.5% |
| Utility natural gas to home | 2.5% | 6.0% |
| Heating oil, propane, kerosene, firewood | -0.2% | -1.7% |
Enjoy reading WOLF STREET and want to support it? You can donate. I appreciate it immensely. Click on the mug to find out how:

![]()
If I exclude food and energy, and women, and gambling, I feel there is very little inflation.
I haven’t done any cloth shopping in a decade. Yes, men do not feel about the inflation if housing, transportation, and everything important are excluded.
Ah yes, the funky smell of old people.
drg – I prefer to think of my aging process more akin to that of a fine cheese (brush off the mold and don’t stand too-close and all is well). And what’s with discounting some advice from an elder? All the youngin’s I counsel strongly to ‘don’t age’, never listen and do it anyway…
may we all find a better day.
Packets of Ramen Noodles are $0.19 this week at a major grocery chain. That’s what I paid 40+ years ago. They must not have tariffs.
There was a comment yesterday that it is hard to find a $5 poker table (or a nickle slot machine). Gambling inflation is likely 100+%. I can’t comment on the women.
The crap table doubled, then tripled, then fell back to 10 dollars a bet.
I miss $5 craps tables so much.
On my first trip to Vegas in 2002, I remember some $2 craps tables.
#backinmyday
I bought hand-pulled noodles in Chinatown SF for $4.50 for 18 portions. Tomatoes from 79 cents/lb to $1.29/lb; same tomatoes in local Safeway $3.99/lb. Green onions 3 bunches for $1; local Safeway $2.25 for one (worse quality). Price difference of 500-600% in these real life examples (from last week). People need to learn to shop.
If you get the obvious California produce at those stores you get good stuff for dirt cheap.
“I spent half my money on gambling, alcohol and wild women. The other half I wasted.”
― WC Fields
My old and dear buddy, RIP:
” I decided to give up smoking, booze and women.”
” That was the worst 15 minutes of my life”””’
HOLD ON folx,,, and at least TRY to keep on keeping on AND HAVING FUN.
Lol!!
And that is the real story!
You do know that women are people too, right? And that this is not a male-only space. But, this kind of comment makes me want to stop reading wolfstreet.com.
Hello Marg, Please don’t let an occasional commenter throw you off. This blog is one of the best finance blogs out there. I have been a reader and patron for many years. In the early times, the original domain name was, “TestosteronePit”. This indicates to me that Wolf has toned things down a bit from the heady times post-GFC.
–Geezer
Hey Marg, wimmins here
I been a reader, lurker of this site for prolly 10 years plus ? I have a Mug too ! It’s worth
The financial info inspite of the sometime Bro doink.
That guy’s insensitive…
Marg, I don’t think he was implying women don’t feel inflation. I think he was inferring that having a woman can be expensive. From experience, can confirm.
Velocity down, money up (based on large CDs and bank credit).
Long-term money flows, proxy for inflation, are still up albeit slightly.
I don’t buy this far off tariff fix. A lower dollar will not correct our trade deficit problem.
A lower dollar will however tend to make exports more sustainable, giving them a competitive advantage.
It is axiomatic that the smaller the degree of price competition in a market and the greater the degree of private unregulated monopoly power over prices and output, then the higher the amount of unit prices, the greater the tendency for restricted output and employment, and the smaller the degree of downward price flexibility.
The streetwise expression is “sticky prices”. Under these conditions, unless money expands at least at the rate prices are being pushed up, output cannot be sold and hence the work force will be cut back.
A weak currency is not a cause; rather it is a symptom of a weak, noncompetitive economy. In time, of course, a declining dollar will eliminate the deficit in our balance-of-trade. But the price exacted will be a sharp decline in imports and the purchase of foreign services, reflecting our relative poverty and inability to compete in the international economy. The fact that we are the world’s number one producer of smart bombs will not arrest that trend.
What is RPI? ? Rensselaer Polytechnic Institute? Generally on a forum, the first time you use an abbreviation/acronym you spell it out completely, then use the abbreviation in the remainder of the posting.
Example: I went to Rensselaer Polytechnic Institute (RPI) for my education. RPI is a private…
I wish everyone posting in the forums would follow this model. I have seen postings with so many abbreviations that I think I am back in the military.
RPI is retail price index used by the UK. Maybe that is what Sea Captain had in mind.
If you read a non-fiction book about current US military or intel there is sometimes more than one page with all the acronyms.
RPI stands for retail price index and is a UK measure of inflation that used to be used instead of CPI. It’s still use for some purposes but there’s a lot of people who still pine for it in the UK as RPI includes the cost of home ownership, whereas the CPI doesn’t (directly).
It doesn’t really have much relevance in the context of discussing US inflation.
BP I agree with you as it would help this old farm boy immensely. Only changed careers three or four times in my life and each began a steep learning curve.
It only seems like common sense. Has it become not so common any longer?
Record deficit $1.1 for first 5 months of US fiscal 2025
Feb 25 spending $603B up 6% from 24 = $307B deficit just for Feb 25
First 5 months fiscal 25 record %48B paid in interest….
Further cuts by the Fed? Anyone? Bueler?
They can kill GDP (fake news) but CPI will still be around. TIP BEs are high, which implies that inflation is still taking a bite. Tariffs and a weak dollar put pressure on inflation. The notion that inflation will come down when economic strength moderates is specious. Appears likely we will have shortages and domestic companies using tariffs to raise prices (not sure why the stock market isn’t bidding up on that idea?) EVs will probably get more expensive, using quantities of copper and lithium, while an ICE is just plastic and steel. Biden wanted to make it so every American drove an EV, and thats what Musk wants, but it might cost you a lot more.
I hear the Fed wants to “pause” QT.
Genius!
On CNBC’s site: ‘Fed rate cuts could ward off a serious recession, Jim Cramer says’
Looks like the Fed is now the Fairy Godmother who can fix anything.
AV8R
You can just read about it here, LOL:
https://wolfstreet.com/2025/03/08/why-the-fed-considers-pausing-or-slowing-qt-until-the-resolution-of-the-debt-ceiling-situation/
I saw it and also agreed with you that resolution of ceiling was essential, but there was no way budget would be balanced next year as per WH prediction. But who on market booster CNBC was even mentioning a ‘severe recession’ just a month ago ?
.
Yes, recession talk is now everywhere, just like it was in 2022 and 2023.
If the stock market drops 40% or more, we’ll get a recession for sure. Maybe the line is at 30% or 35%. But somewhere there is a line, and if the market drops below that line, people with money get spooked, and the hiring slows, and the spending slows, and investment slows, and we’ll have a recession.
If government spending gets cut enough, that might also contribute to a recession. But government spending needs to be cut. The government budget has been in a catastrophic condition.
But when everyone talks about a recession, then that’s a sign we won’t get one?
Google search/AI overview on deficits per gdp G7
In 2024, the G7 countries’ general government deficits as a percentage of GDP ranged from 2% (tied with Germany) for Canada to 7.6% for the United States, with France at 6% and the United Kingdom at 4.3%.
Here’s a more detailed breakdown:
Canada: 2%
Germany: 2%
France: 6%
United Kingdom: 4.3%
United States: 7.6%
I mention this because Canada will obviously go into recession in the unfolding trade war, but it looks like major major infrastructure projects are being discussed to reset future trading partners. This would include another west oil pipeline for Asian markets, and an energy east pipeline for European markets. It is said to mimic the CP Rail spanning the country which only took 4 years.
German, Japanese, British 10-year bond rates are rising. 10-year treasury is probably heading to 5% again.
Bring it on.
I I’M
N NEVER
F FINDING
L LOVE
A AFTER
T. THIS
I INFLATION
O OBLITERATES
N (My) NET WORTH
Inflation is here to stay – people are greedy!!
People want to live the good life since they only have one shot at it!
Sure, yielding to higher prices will quit often make sense.
All this talk of lower airline tickets prompted me to look. Prices where they’ve been the last few years but $70 for the first checked bag, ouch!
Even Southwest is going to start charging for checked bags. Sigh.
Surely you can find baggage with a fabric pattern other than checks. What are they charging for herringbone designs?
Time to kiss that Southwest credit card good-bye thanks to Elliot Investment Management (destroying this loyal decades long customer). So long Chase and the annual fee.
Wells Fargo Active Cash 0 annual fee, 2% cash back on all purchases.
paul singer is your typical pe sociopath
Somewhere customer sentiment was replaced by stockholder sentiment and everything shot to the moon. Unfortunately, it is still in orbit. I see many people on fixed budgets burn through their savings to stay a float. Dreams of enjoying retirement is gone. The younger generations are heart broken and resigned to never owning a home. Eventually, we need smart people to take a stand and help make Main Street affordable again. So what comes first? Reduced cost across the board or a major recession. Poor communities are living like this is a depression.
Fantastic information, all in one place. I cannot thank you enough for educating me like this.
I would like to ask anyone to check my facts. I want to be correct when I discuss this with people. I know that I’m “cherry picking” my facts, but I’m just adding to the information here, to see if my claims are also correct:
1. Is it true that the predictions for both overall CPI and Core CPI were both higher than the actual numbers that came in? (predictions of 2.9% and 3.2%, respectively)?
2. Is it true that the monthly change in overall CPI is the lowest rise since August 2024? (I know monthly rates are “volatile” but still.)
3. Is it also true to say that, were one to exclude problematic “eggs” from “food at home”, we’d in fact see quite significant DEflation for that category overall?
“Food” for my thought, so to speak. Thank you again for your invaluable time and effort.
1. Depends who was predicting. These predictions are all over the place and vary widely. But someone (such as CNBC) takes an average of the predictions by the 10 or whatever people they survey, and it’s a prediction (they call it “consensus” but it’s just an average of 10 predictions that varied widely). Someone else (such as Reuters) takes an average of predictions by different people and it comes out differently, etc. Predictions are worthless. Just clickbait for headlines.
2. yes – after the highest since August 2023, LOL. Here is the chart, chart #1 in the article. Look at the blue line. After six surges there’s finally a long overdue reversal in very volatile data. That’s what you’re referring to:
3a. Month-to-month changes of the food at home category are always volatile, big positive readings (for example, January) followed by small positive or flat readings (for example, February), or negative readings (for example March and April 2024). Small negative month-to-month readings are common, as are big positive month-to-month readings.
3b. Food-at-home CPI month to month was roughly unchanged in February (+0.01%), after jumping by 0.46% in January.
3c. A near-0% change as in February can be flipped in either direction by replacing the actual change in some item with your fantasy figure. For example, if you change the -1.4% month-to-month of pork, to 0%, the food-at-home CPI would have been more strongly positive. It’s a game you can play with any line item. Just pick one, flip it to 0% or into the opposite direction, and see what happens. But this game is just mental masturbation, and considering the results of such mental masturbation “deflation” is just goofball stuff.
Speaking of predictions ….
“The first thing is the debt issue, we have a very severe supply-demand problem,” Dalio told CNBC’s Sara Eisen at CONVERGE LIVE in Singapore. ”[The U.S. has] to sell a quantity of debt that the world is not going to want to buy.”
Asked whether the U.S. debt problem could lead to a period of austerity, Dalio said the issue could result in a restructuring of the debt, the U.S. applying pressure on other countries to buy the debt, or even cutting off payments to some creditor countries.
“Just as we are seeing political and geopolitical shifts that seem unimaginable to most people, if you just look at history, you will see these things repeating over and over again,” Dalio said. “We will be surprised by some of the developments that will seem equally shocking as those developments that we have seen.”
Comments Herr Wolf?
1. Is Dalio deep into a huge short bet on Treasuries?
2. Dalio has said lots of crazy stuff, including “cash is trash.”
3. nonsense. There will always be demand for Treasuries. It just means that the yield will be higher.
Wolf,
Isn’t that part of the point? If yields have to go higher to spur demand, they get so high that our debt spirals out of control, and that’s when some of these unimaginable things can happen, like not paying all our creditors? I mean, nearly unimaginable things are already happening, and the majority of citizens are complicit through ignorance, so it seems to me that the pace at which unimaginable things could happen could go parabolic.
I have my concerns.
No. That’s when Trump puts the screws on Powell to restart QE, and the Fed starts buying treasuries again at whatever interest rate Trump wants him to buy at.
Why would the President waste time pressuring other countries when the guy with (by definition) limitless dollars is just down the street?
(Note, of course this will have huge knock-on effects, but of all the crazy scenarios that Dalio talks about, like stiffing certain creditors, this is probably the least damaging one)
Lune,
“Why would the President waste time….”
One word: Inflation.
What you’re proposing will blow inflation out of all proportion. Which is the reason this will only be done if even high yields on Treasuries cannot entice buyers, but high yields always entice buyers. I’m still waiting because long-term yields are way too low.
Juicifer, sure, a print of 2.8 is lower than a predicted 2.9, but to me, it is substantively no change, although the media will blast headlines like CPI IS LOWER THAN EXPECTED. Now a print of 2.1 versus a prediction of 2.9 would be something to crow about.
If you watch these numbers over time, you will see that tiny changes from one month to the next might mean nothing in and of themselves. However, if, say, mainly negative changes are seen every month for three or six months in a row, then you might see a trend and that might mean something. Wolf provides three and six month moving averages of these monthly changes.
Finally, a relatively big monthly change would be something to think about.
Average inflation for the last 100 years = 2.9%
Average inflation for the last 50 years = 3.6%
Average inflation for the last 20 years = 2.5%
Average inflation for the last 10 years = 3.0%
Average inflation for the last 5 years = 4.1%
Average inflation for the last 1 year = 3.1%
I know the explicit inflation target is 2%, but it seems that historically it hovers in the 2-4% range, and that it is now right around average and has been holding steady for a year straight. Obviously if it were to start increasing drastically again that would be bad, and maybe there are some signs of worry, but available data seems to indicate a stable and normal inflation rate for the modern era.
Inflation primarily strikes at the economically weak — like a cheetah on the African savannah eyeing the old and the crippled. If you’re a producing member of society, capable of demanding and getting a pay raise, you have little to fear.
Hope u are never old or crippled
Exactly, you better be producing something that stops you ageing then!
Oh my the ego of the working class!
Those with little to fear, do not need a job!
That is how I felt when Hewlett Packard abbreviated one of the labs “PRC” or Peoples Republic of China.
According to trading economics website, eggs picked this month at $8.17/dz, today the wholesale price is $5.17/dz. What ever the reason its great news.
We now see some supply and have been buying at below $5 for two weeks. Before then it was hit and miss, empty shelves, and $8-plus price tags.
The egg price spike was entirely due to chickens being destroyed because of avian flu:
March 13, 2025SupplyChainBrain
Although egg prices continued to soar in February, the U.S. Department of Agriculture (USDA) says that relief could be on the horizon.
According to the Consumer Price Index for February, the average cost for a dozen eggs rose to a record high of $5.90, which was up from the previous record of $4.95 set in January. Dating back to the fall of 2024, U.S. farmers have been forced to cull millions of egg-laying hens as avian flu has torn through flocks. As a result, the USDA predicts that egg prices will have risen by 41% by the end of the year, more than double its previous projection of 20%.
That being so, the USDA’s egg market overview published on March 7 says that the spread of the disease has actually started to slow, with no significant outbreaks having been detected in nearly two weeks. Average wholesale prices have dropped by nearly 22% over that same period as well.
Trump says “spend, baby, spend”…
In the meantime, the AEB estimates that the U.S. has imported more than 827,000 dozen eggs from Mexico and Turkey since January to bridge the gap in supplies. The Trump administration also rolled out a plan in late February to invest $1 billion in bird flu response efforts, half of which will go toward boosting biosecurity measures on farms. Another $400 million will go to farmers with flocks impacted by the disease, while the remaining $100 million will go to research on vaccines and therapeutics for chickens.
All I got is I’m glad I’m retired and all my kids are doing well financially. Never been a good investor but instead a damn fine saver. I have enough money to last until I die so let the cards fall where they may.
Oldguy:
I thought the same re: sufficient savings. But only until this last and continuing bout of inflation to protect the banksters from their usual greed.
Now, just working to expand savings, and it is definitely a challenge due to high inflation and low Treasuries.
I HOPE and PRAY for the best for you and the rest of our cohort who are now, clearly, too old, etc., to be hired since ”ageism” reigns.
May THE GREAT SPIRITS, by any name, BLESS us all…
I am heading to the “Too old to be hired” part of life.
As a trademan sure,can’t handle the loads I used to carry/can’t go off binging on weekend and showing up bright eyed and bushy tailed on Monday ect.,that said,can still do a lot of the work,just perhaps at a slower pace.
I will also say those of us older have knowledge/skills ect. to pass on,just like older folks did for us.
I if needed will find a new hustle though am pretty well off (at moment!)financially
As a very wise man said””don’t worry about what you can’t do/work on what you can do”.
I have had a standing offer for at least the past 6 years to train
for free….my competition.
Was at continuing ed. for my license’s today.
Us old guys still out number the youngsters by at least a 6-1 ratio.
Not sure how fast they can turn that ratio around.
Wolf – slightly OT but in line with your prior coverage of consumer spending, would appreciate your thoughts on the following:
1. Gathering what we know from the data — consumer spending continues to notch record after record and that’s a big part of the US economy’s growth above trend in recent years, right?
2. That spending is driven by more people (pop’n growth + more overall employment) earning more money (increase in real wages).
3. If we see a sustained drop in stocks do you think that the reverse wealth effect (people feeling poorer b/c the value of their portfolio is lower) will play a meaningful role as far as consumer behavior/spending goes? Curious if you’ve looked at whether there’s any correlation btw stock performance and consumer spending historically?
TIA and appreciate the time you put into writing this blog
I’m planning to publish some ruminations on this late Friday or over the weekend, if I have time.
The situation is not dire, BUT it is not as rosy as the current administration is spinning it. Thanks Wolf! Just confirming the politicians lie, no matter the party affiliation.
Anyone have any thoughts on those 100 year, zero coupon, bonds proposed by Trump? LMFAO!
Wolf
Every now and then I’ll read something that says that this country or that country has a shortage of Dollars and at in general for the world economy having a dollar shortage is really bad. I’ve tried to find information that makes this situation understandable to no avail. If anyone could make understanding to us civilians it would be you. Maybe a topic for a later day.
There can never be a “shortage of dollars,” except in my wallet, LOL.
There is a problem however: Governments and companies in the developing markets are borrowing in USD because it’s a lot cheaper than borrowing in their own currency. But they have to service the USD debt with USD interest and principal payments. Obviously, they don’t ever pay it off, they just refinance maturing USD debt with new USD debt. When interest rates were very low, that worked fine. But their USD borrowing rates might have double or tripled since 2021, and they can no longer afford borrowing in USD, and if they don’t take in enough in USD, they can get in trouble. For example, a national oil company can sell part of its production overseas for dollars, and that might be enough to service its USD debt. But a retail chain that sells in local currency but borrows in USD doesn’t generate any USD and has to convert local currency into USD to service the USD debt.
So now, there are two issues: 1. Interest rates have surged in the US, and the cheap dollars are gone. It’s now a lot more expensive to borrow in dollars. And 2., if the local currency plunged against the USD, borrowers will have to pay a lot more in local currency to service their USD debt. So that’s also very expensive. Double whammy.
So what they mean by dollar shortage is that these foreign governments and businesses cannot borrow at the low rate they used to, and their own currency has plunged against the USD, so for them, there is a shortage of “cheap dollars,” there no more cheap dollars at all for them, and when that occurs, companies and countries might and do default. “Dollar shortage” is kind of a silly way to describe this situation.
This occurs regularly because US investors are STUPID and keep lending USD to foreign governments and businesses – think of Argentina – and these bonds end up in emerging-market bond funds, and plunge therein. When those funds sell the defaulting bonds for cents on the dollar, hedge funds buy them and work out a deal with the borrower and make huge amounts of money. This is the endlessly repeated cycle.
Thanks, what I take from your explanation is that countries have to sell stuff to earn dollars and the “shortage” is the lack of earnings to service their loans. Thanks for the detailed explanation.