Toronto single-family prices -19% from peak, back to Oct. 2021. In Montreal, Quebec City, Edmonton, and Winnipeg, prices near all-time highs.
By Wolf Richter for WOLF STREET.
Home sales in Canada jumped by 7.7% in October from September, seasonally adjusted. Compared to the beaten-down levels a year ago, home sales jumped by 30%. New listings declined by 3.5% in October from September, after the 4.8% jump in September from August, “so new supply remains at some of the highest levels since mid-2022,” the Canadian Real Estate Association (CREA) said today.
Total inventory for sale of 174,458 properties was up by 11.4% from a year ago. Given the surge in sales, supply declined to 3.7 months at the current rate of sales, compared to 4.1 months in September.
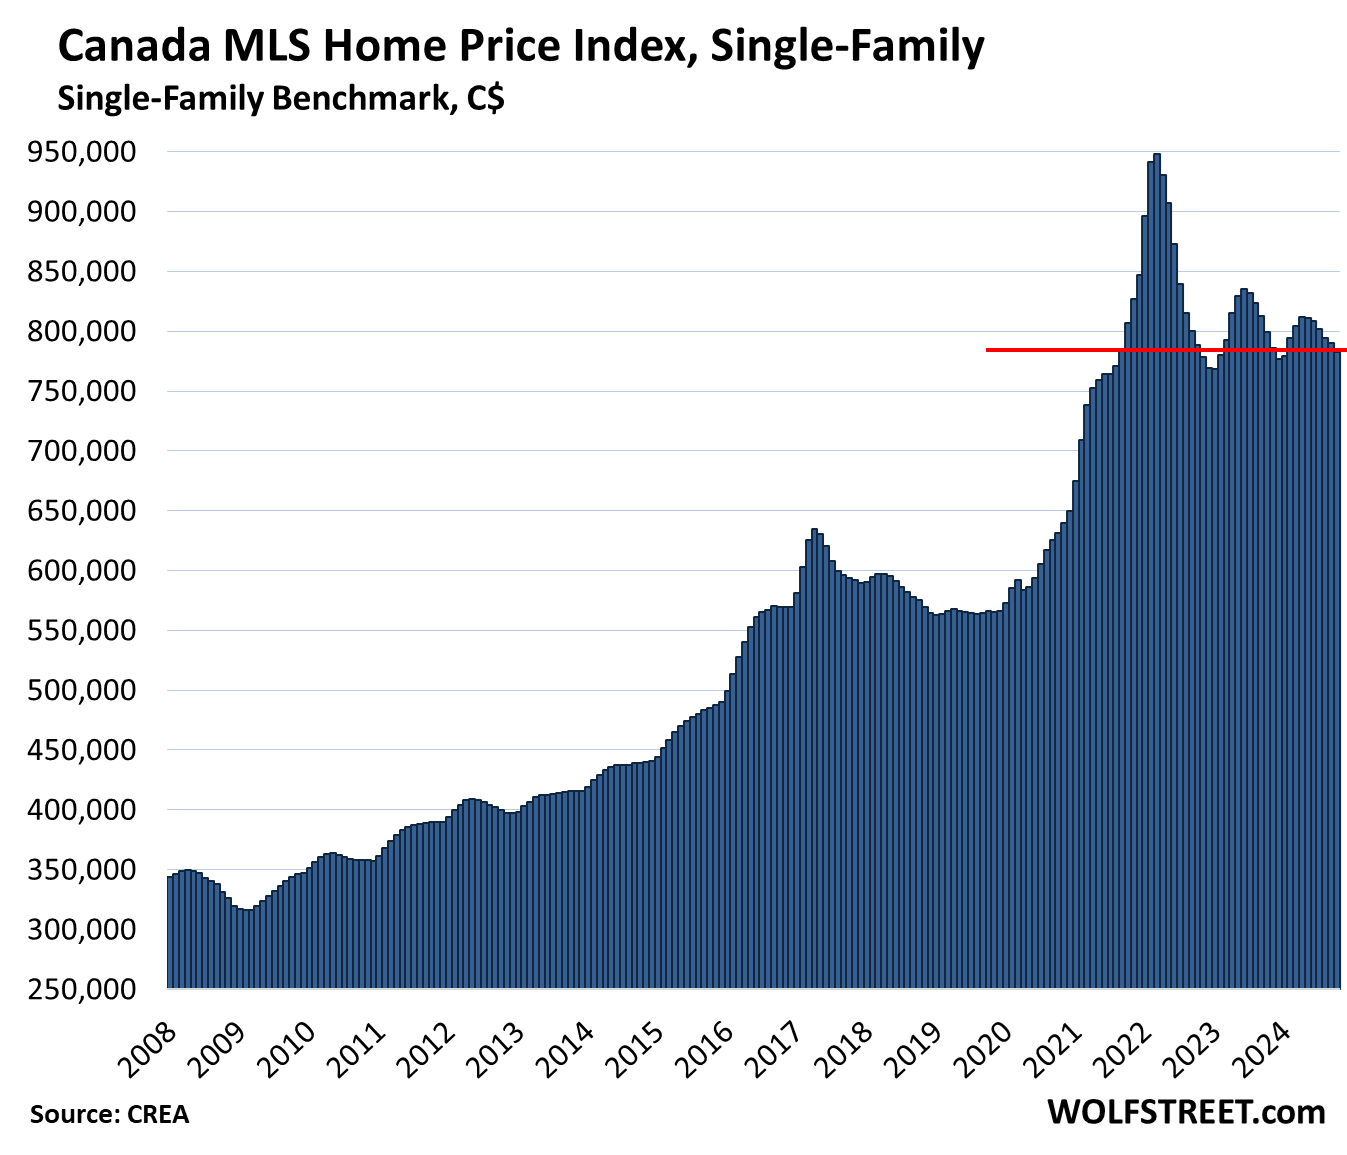
Prices of single-family properties in Canada fell 0.9% in October from September and were down 2.1% year-over-year — the sixth year-over-year decline in a row — were down by 17.4% from the peak of the spike in March 2022, and were back where they’d first been in September 2021, according to the Canada MLS Home Price Index for single-family benchmark properties released by CREA today. All prices here are actual, not seasonally adjusted, in Canadian dollars. But as we’ll see in a moment, prices are on very different tracks in different markets.
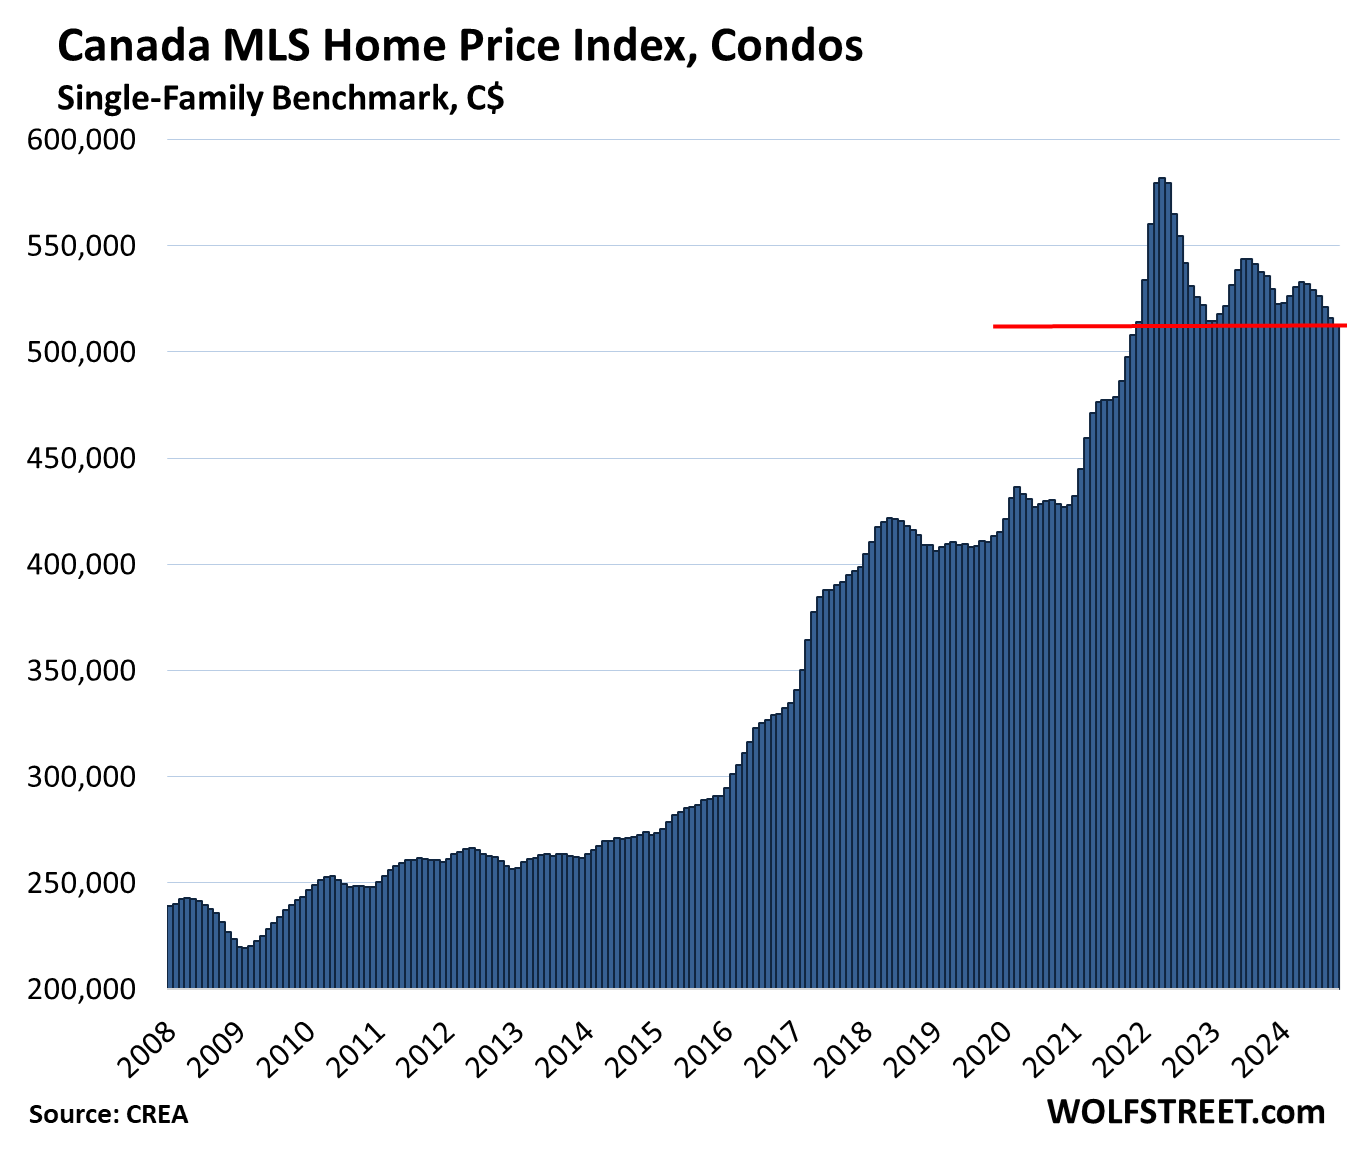
Prices of condos in Canada fell 0.8% in October from September the lowest level since December 2021. They were down 4.4% year-over-year, the sixth month in a row of year-over-year declines in a row, and were down 12.0% from their peak in April 2022.
Home prices by market in Canada.
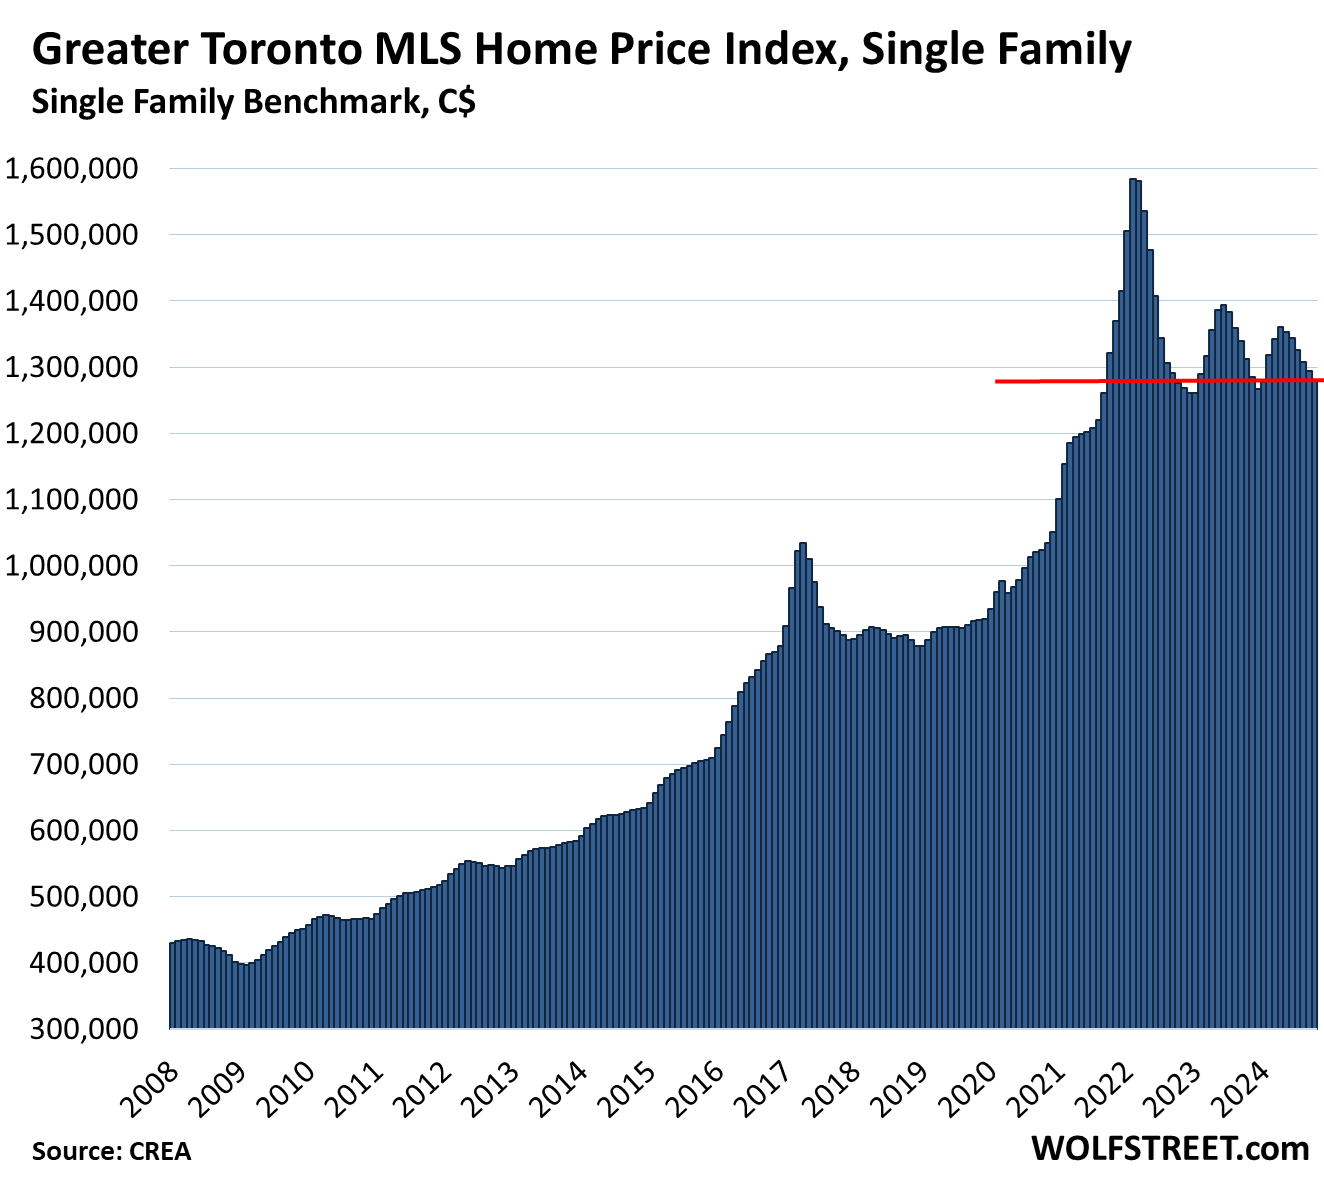
Greater Toronto Area, single-family MLS Home Price Benchmark Index:
- Month-to-month: -1.0% to $1,280,000; below October 2021
- From peak in February 2022: -19.2%
- Year-over-year: -2.5%, sixth month of year-over-year declines in a row.
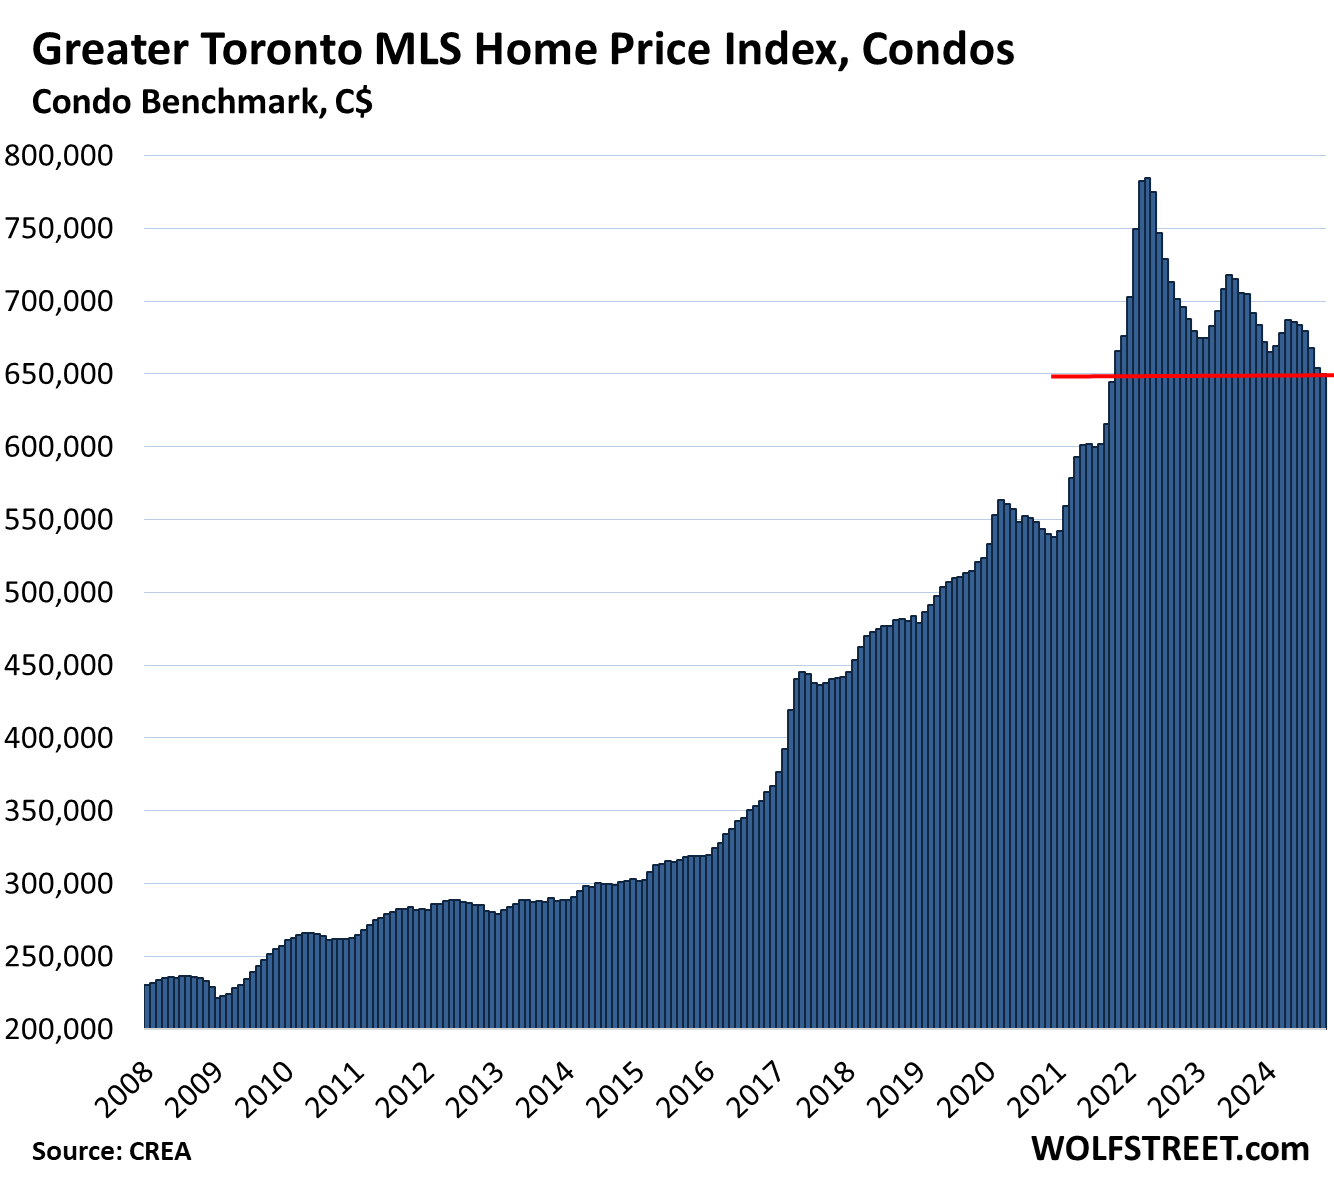
Greater Toronto Area, condo benchmark price:
- Month-to-month: -0.7% to $649,900, lowest since October 2021.
- From peak in April 2022: -17.1%
- Year-over-year: -6.1%, with 22 of the past 21 months booking year-over-year declines.
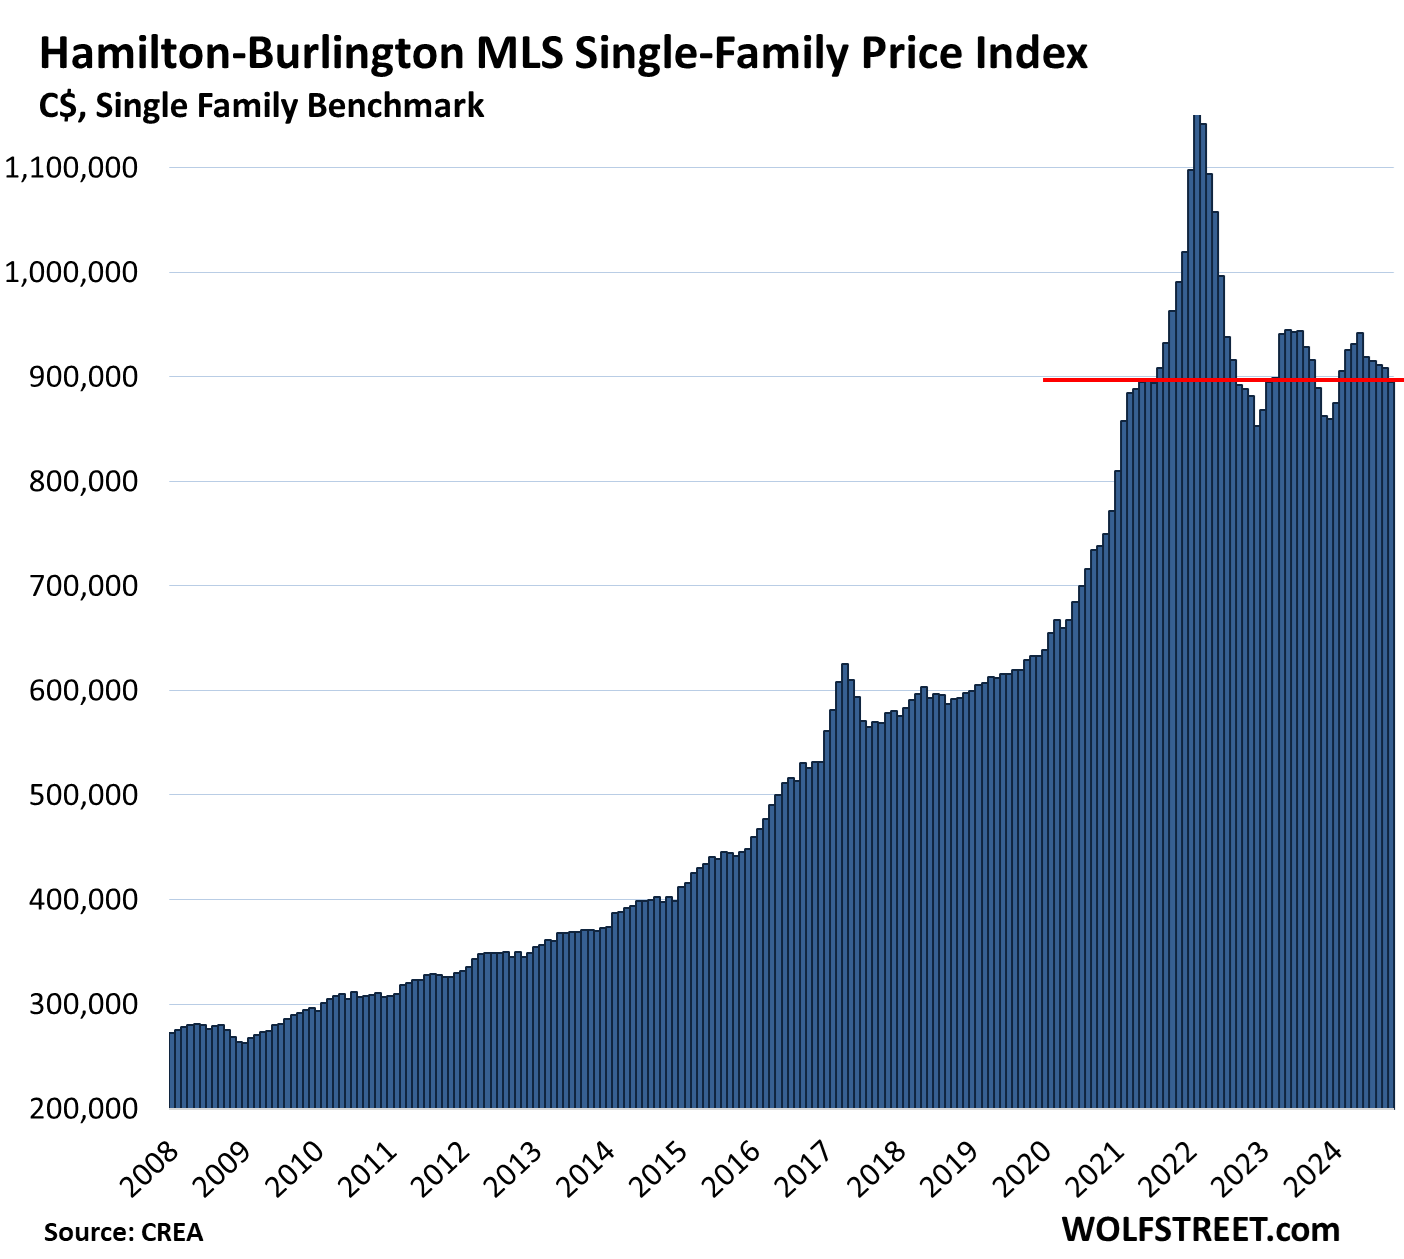
Hamilton-Burlington metro single family benchmark price (part of the “Greater Toronto and Hamilton Area”):
- Month-to-month: -1.5% to $894,600, where it had first been in July 2021
- From peak in February 2022: -22.6%
- Year-over-year: +0.6%.
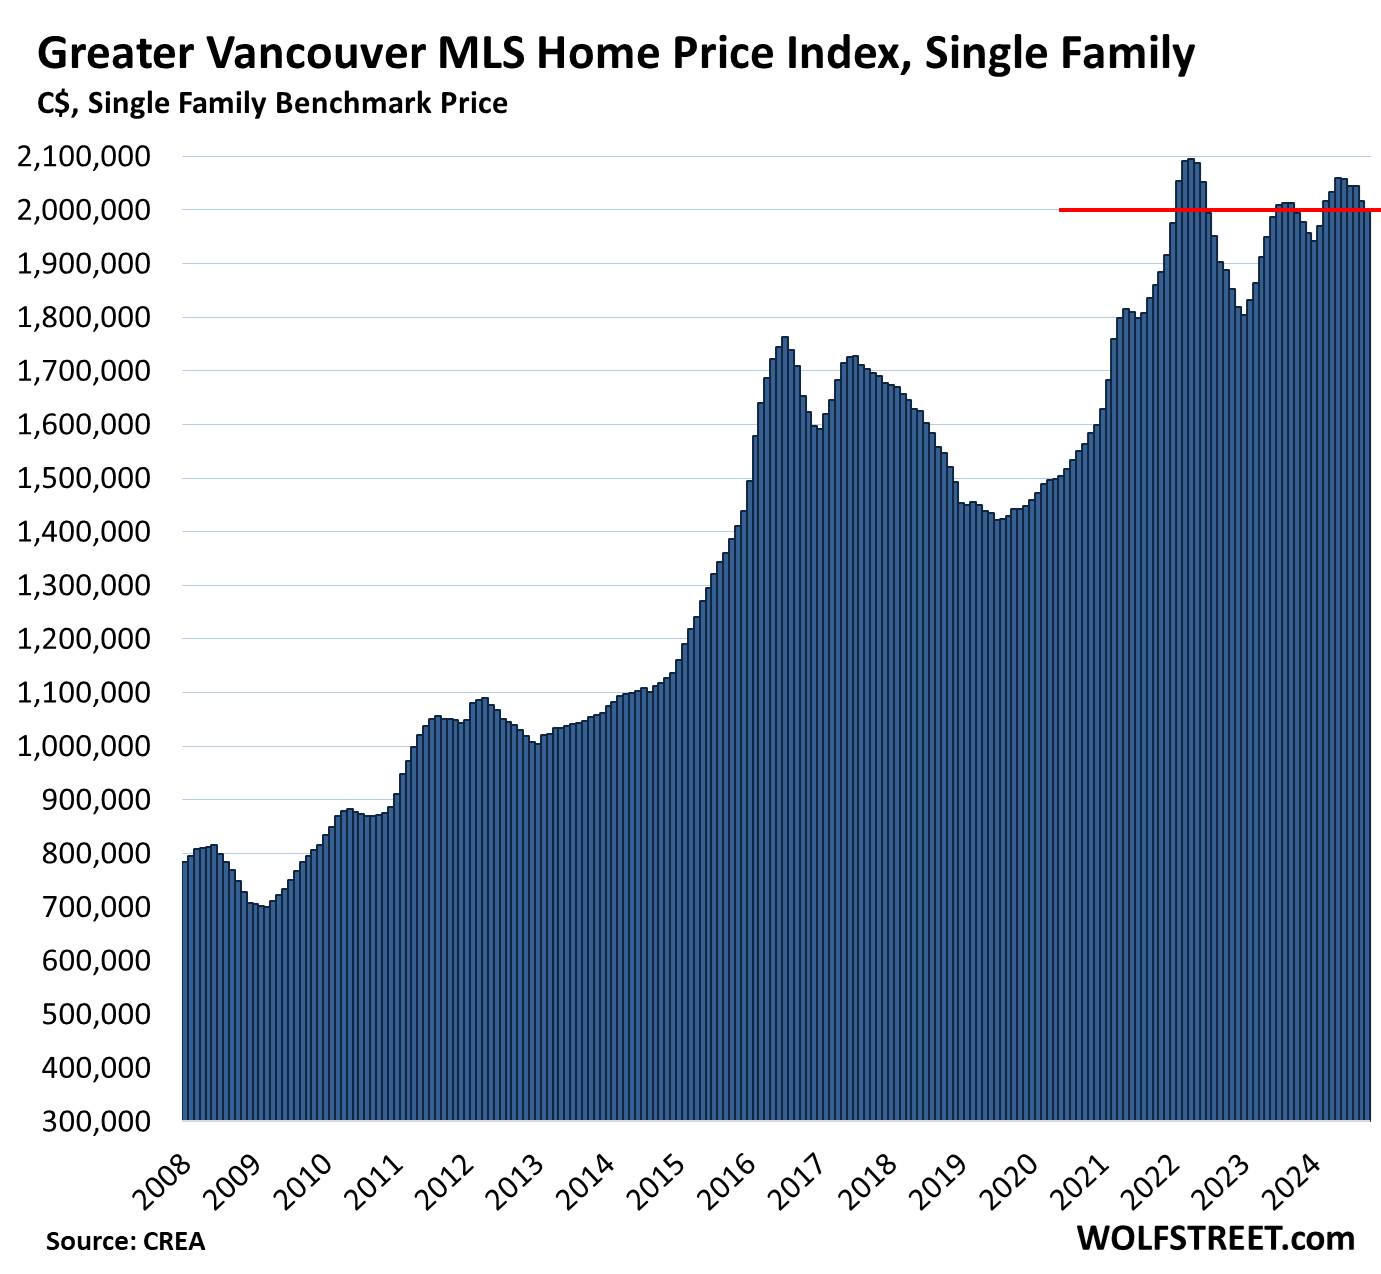
Greater Vancouver single-family benchmark price:
- Month-to-month: -0.8%, at $1,999,200.
- From peak in April 2022: -4.6%
- Year-over-year: +0.2%, same as in September, and both were the smallest year-over-year gains since the drop in June 2023.
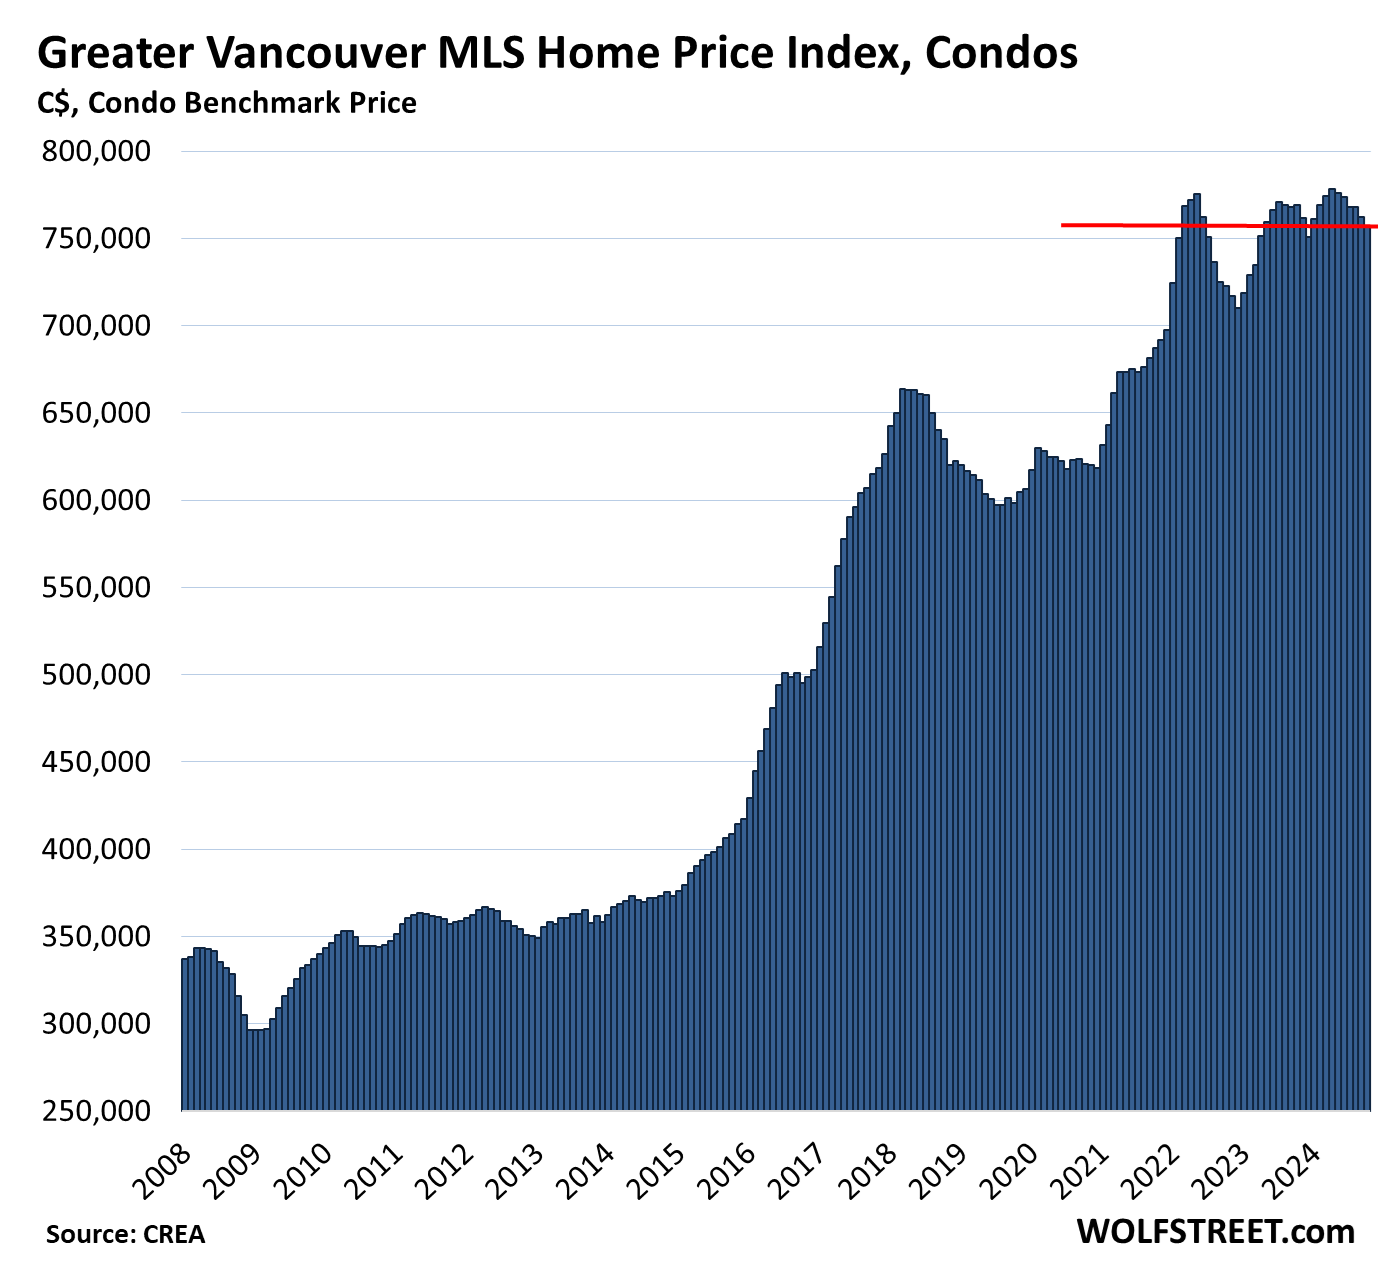
Greater Vancouver condo benchmark price:
- Month-to-month: -0.6%, to $757,200, below March 2022.
- From high in April 2024: -2.7% from high in April 2022: -1.9%
- Year-over-year: -1.6%, fourth year-over-year decline in a row.
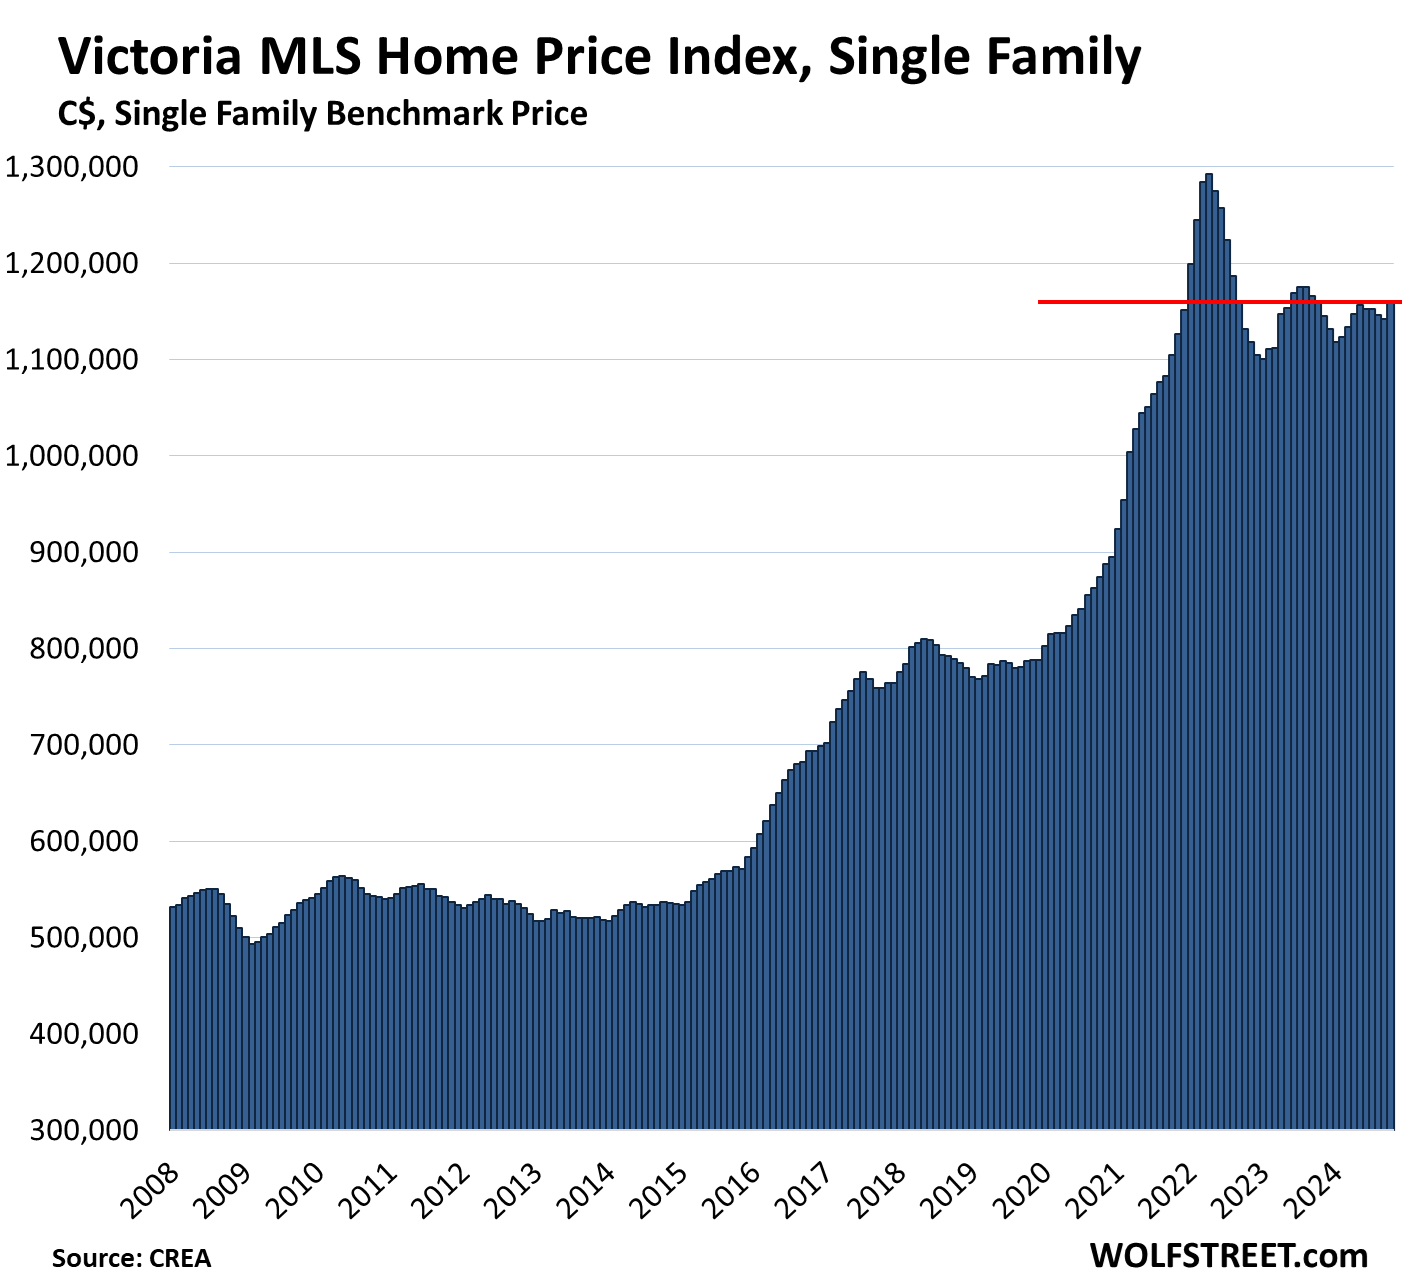
Victoria, single-family benchmark price:
- Month-to-month: +1.4%, to $1,158,400, back to about December 2021
- From peak in April 2022: -10.4%
- Year-over-year: -0.1%, fifth year-over-year decline in a row.
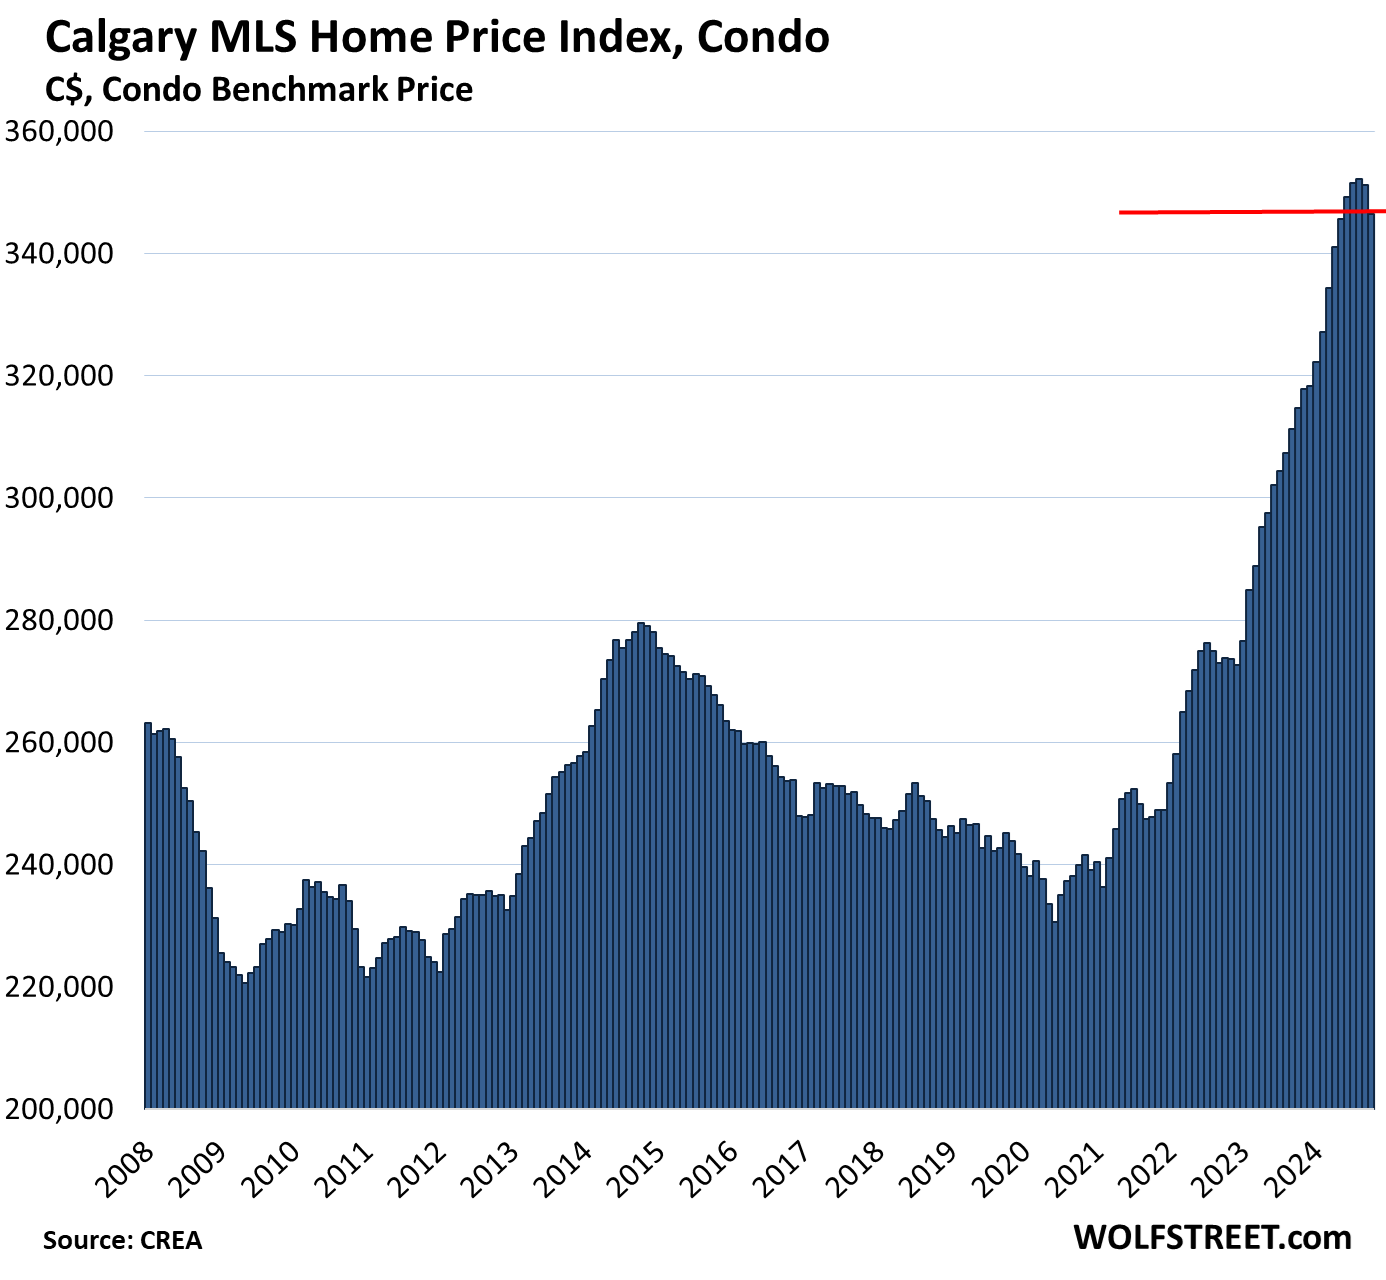
Victoria condo benchmark price:
- Month-to-month: -1.2%, to $549,300, below December 2021.
- From high in May 2022: -10.4%
- Year-over-year: -4.5%, fourth year-over-year decline in a row.
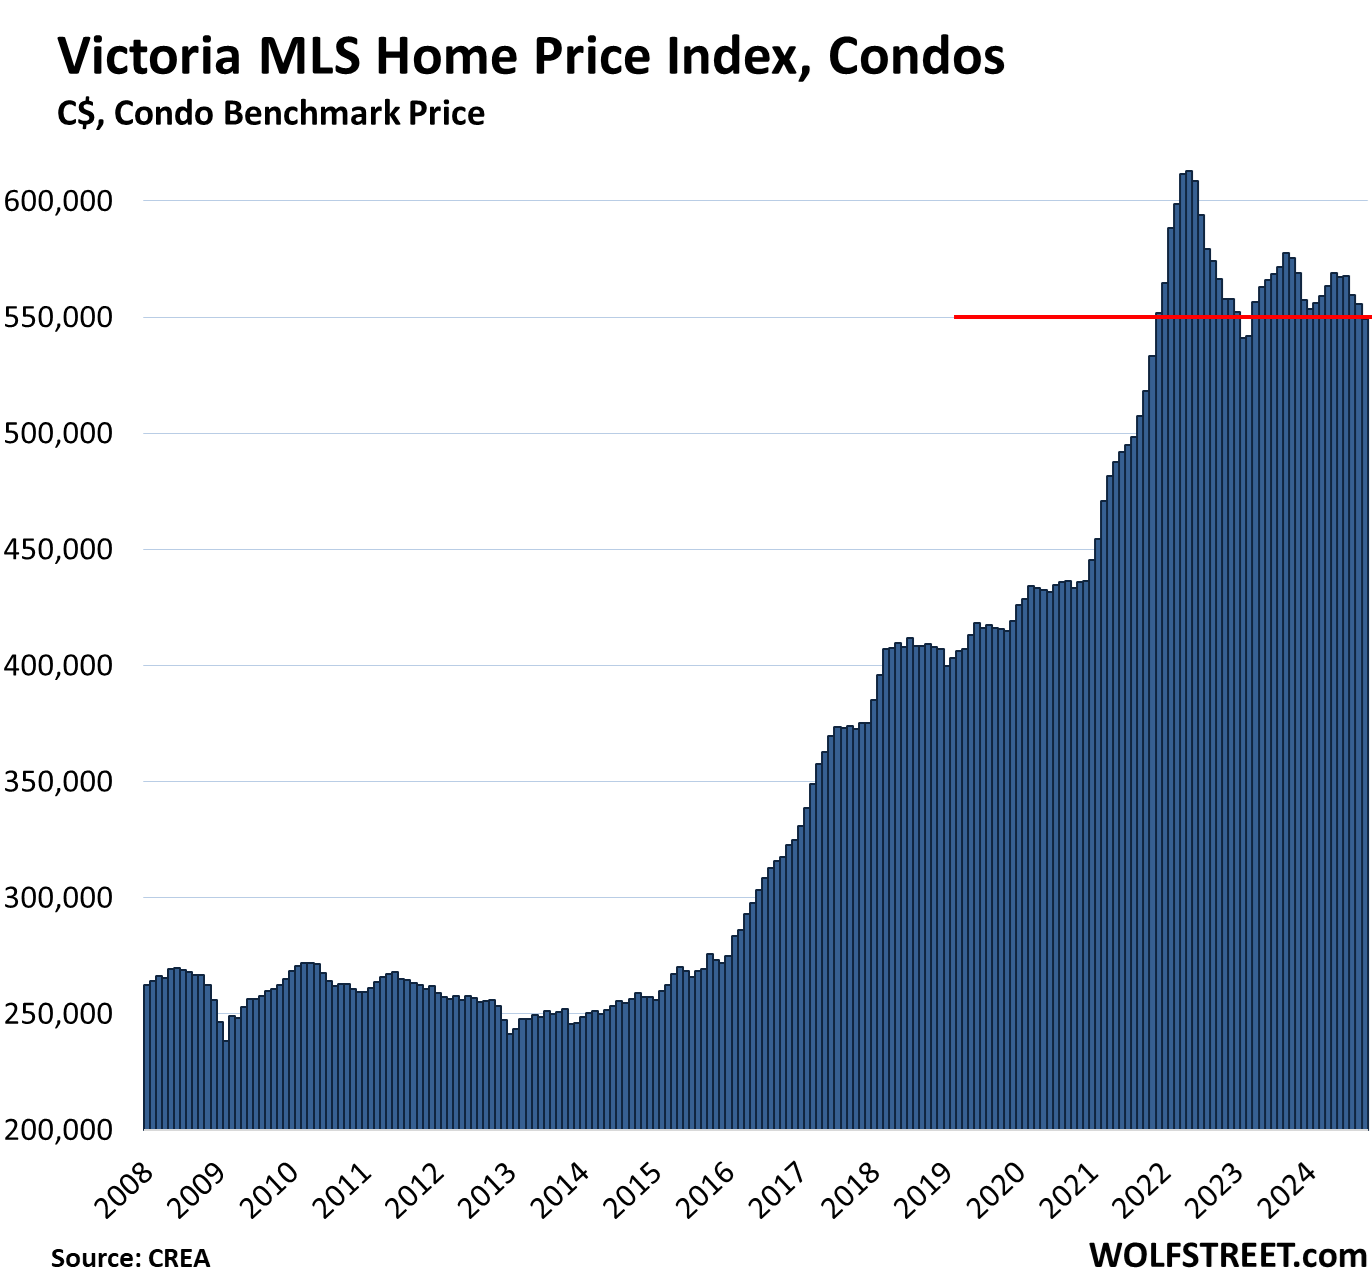
Ottawa, single family benchmark price:
- Month-to-month: -0.6% to $724,400, back to April 2021
- From peak in March 2022: -11.7%
- Year-over-year: +0.6%.
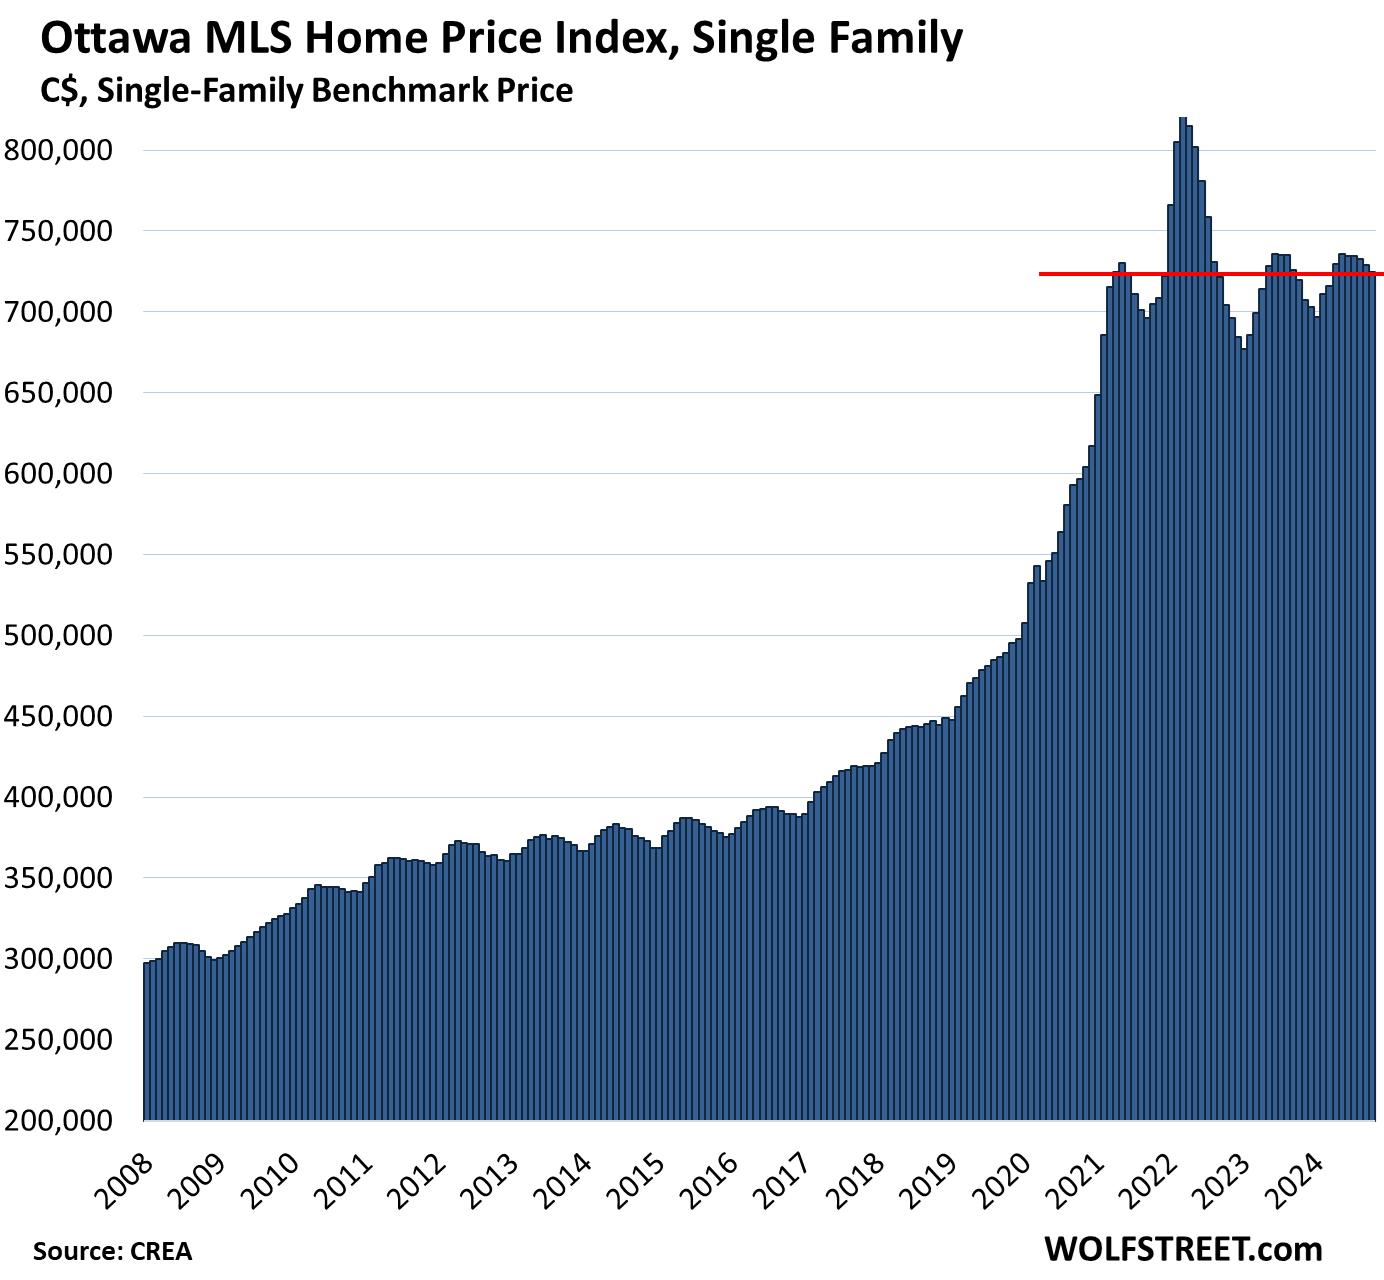
Calgary, single family benchmark price:
- Month-to-month: -0.5%, third month of declines from the all-time high, to $680,900.
- Year-over-year: +7.6%, the smallest gain since July 2023.
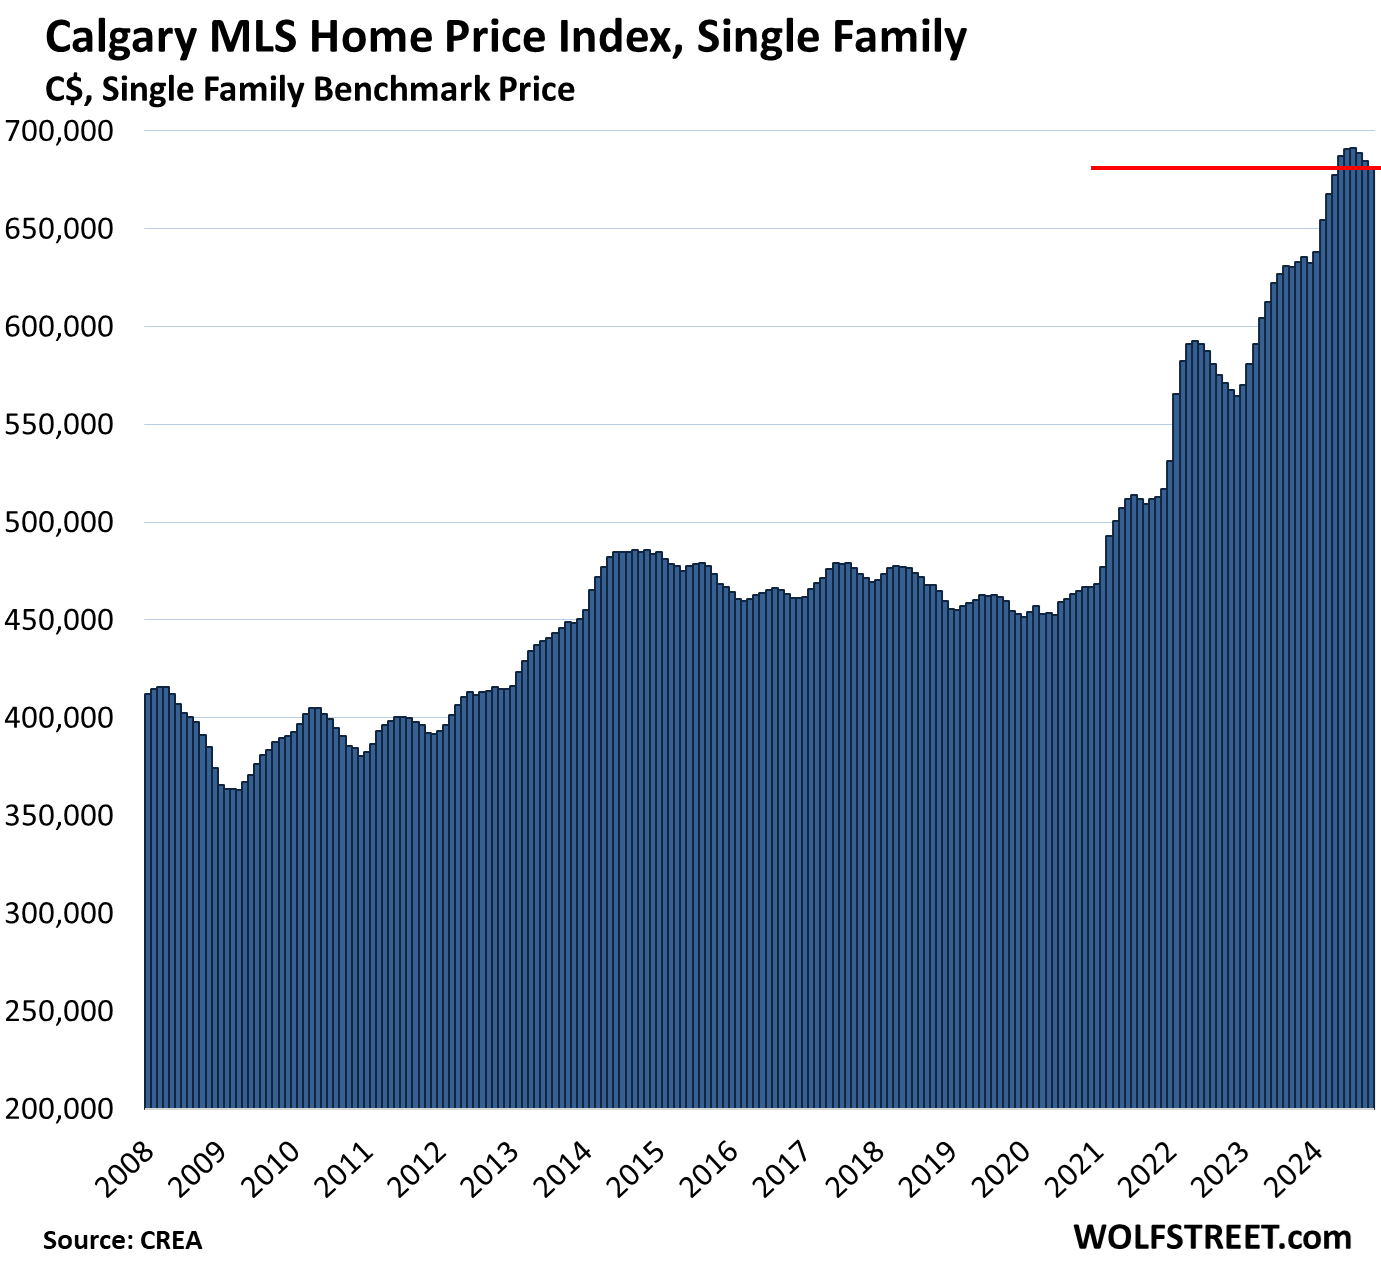
Calgary, condo benchmark price:
- Month-to-month: -1.3%, to $346,500.
- Year-over-year: +10.1%, the smallest gain since June 2023, with gains having ranged from 10.2% to 16.7%.
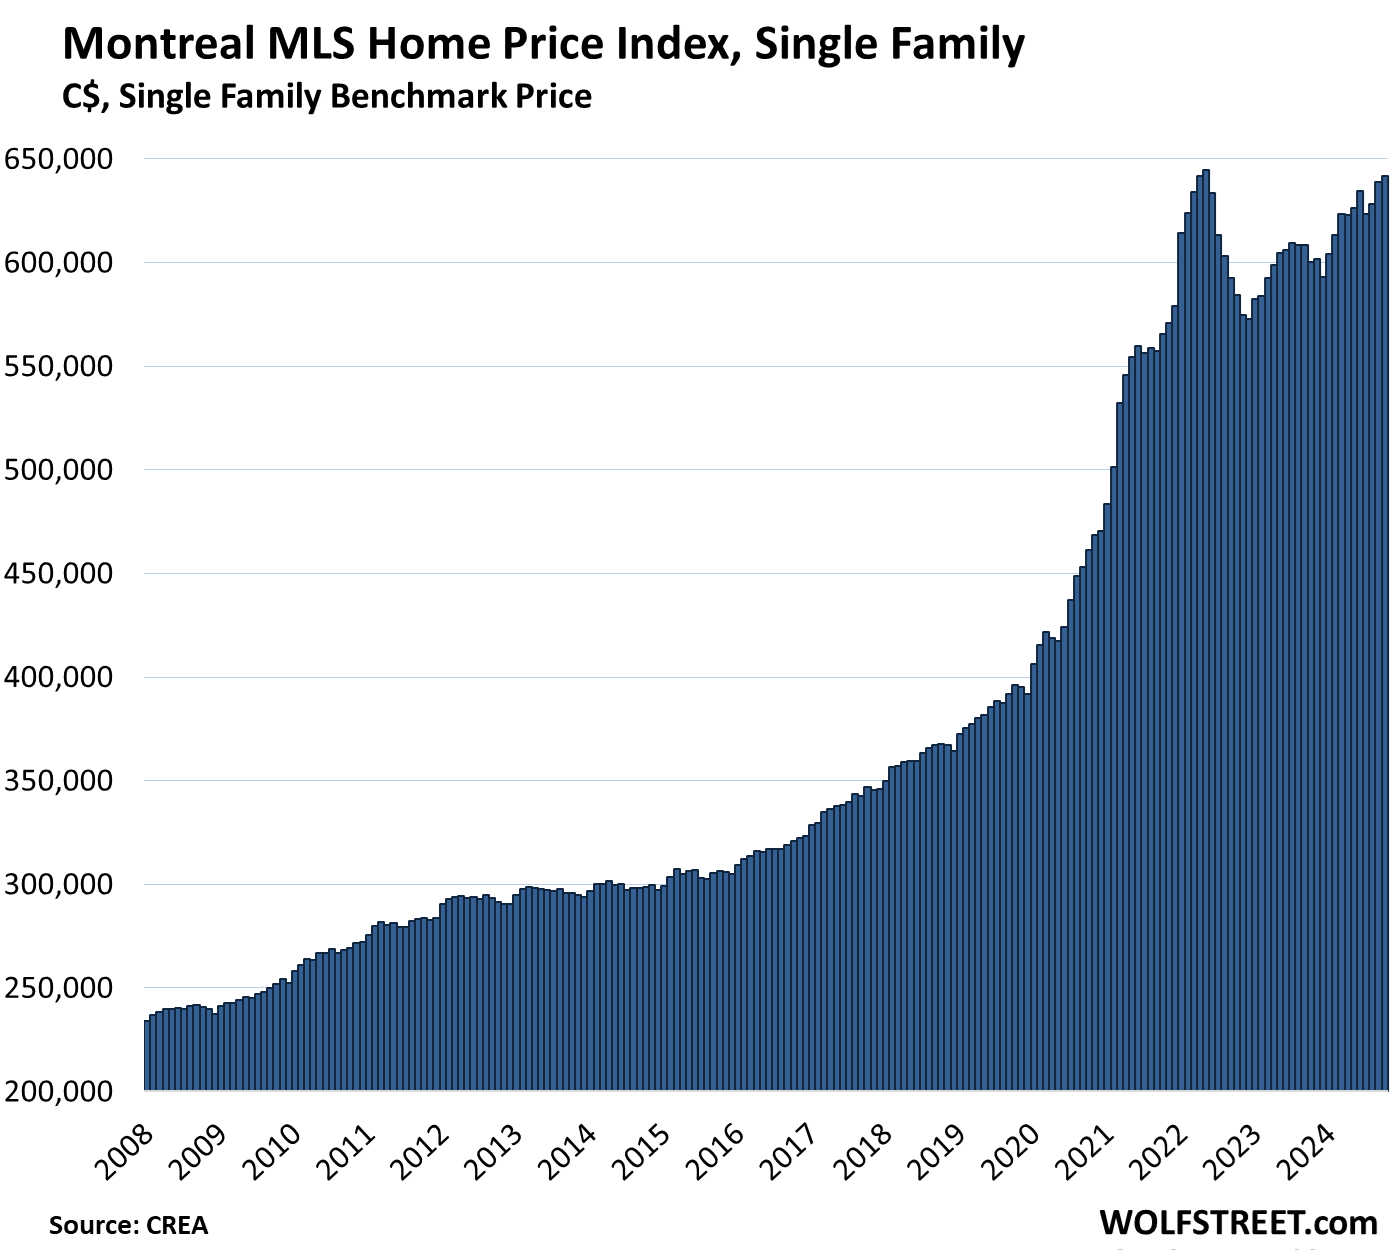
Montreal, single family benchmark price:
- Month-to-month: +0.4%, to $641,600.
- From peak in May 2022: -0.5%
- Year-over-year: +6.9%.
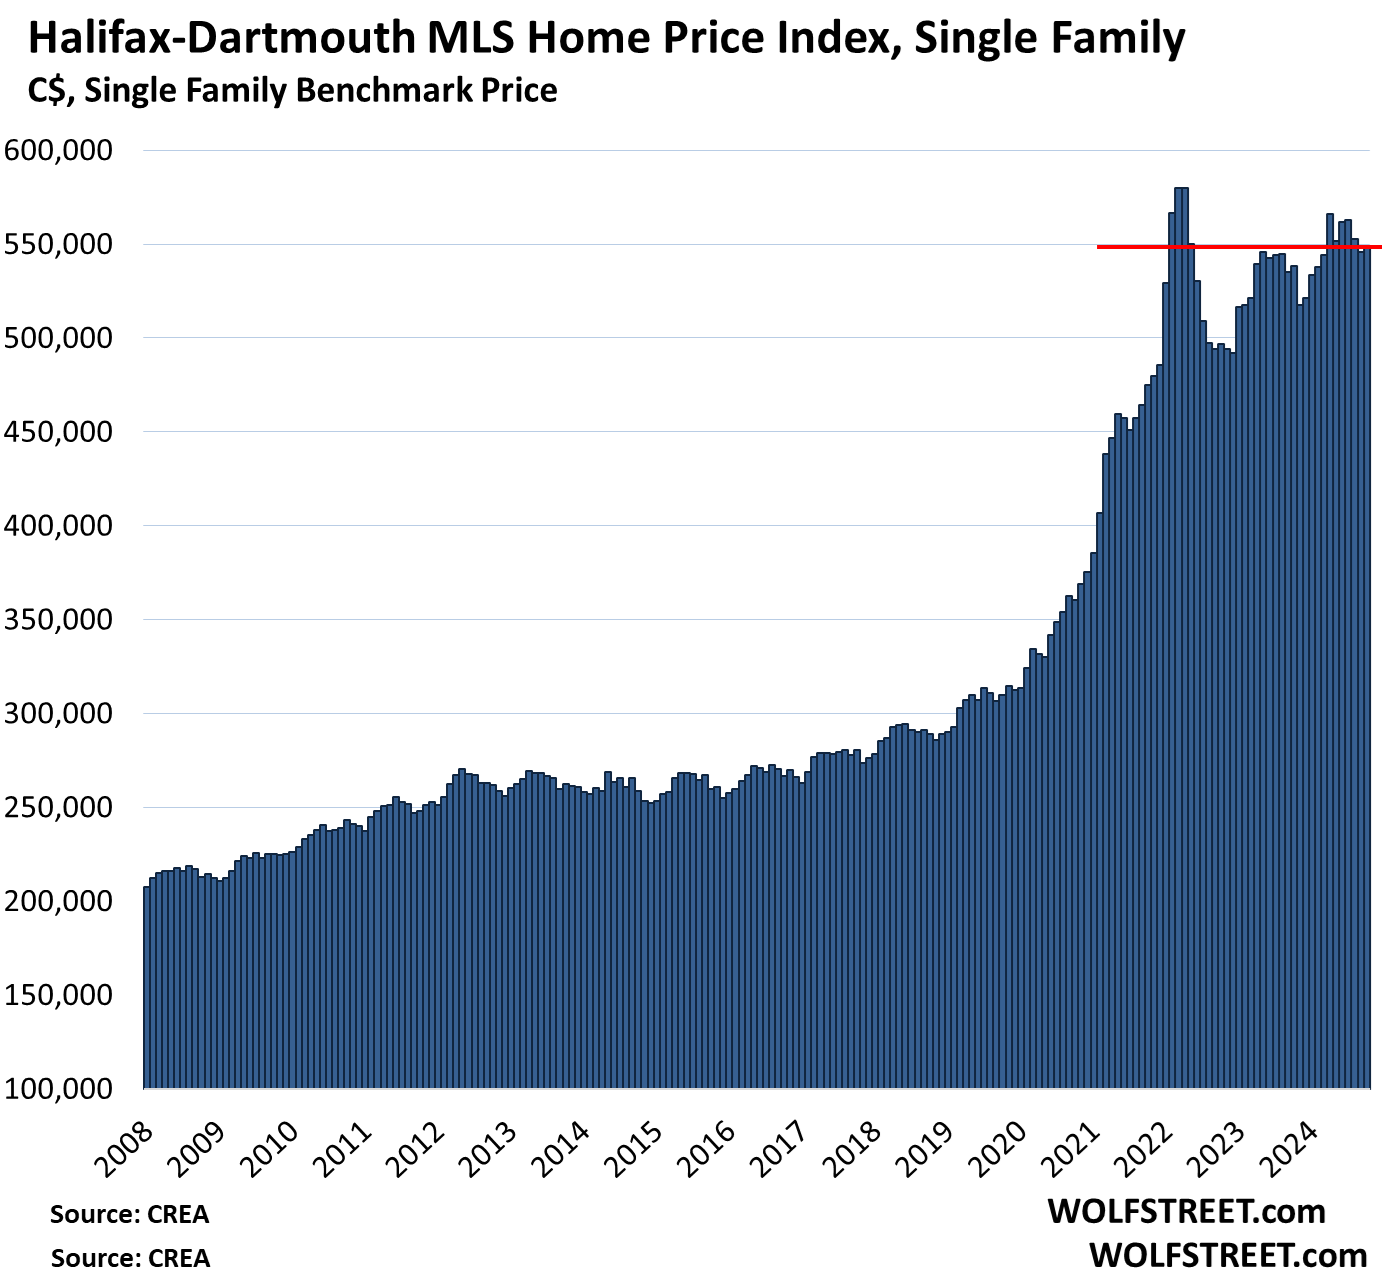
Halifax-Dartmouth, single family benchmark price:
- Month-to-month: +0.4% to $548,100
- From peak in April 2022: -5.5%
- Year-over-year: +1.8%.
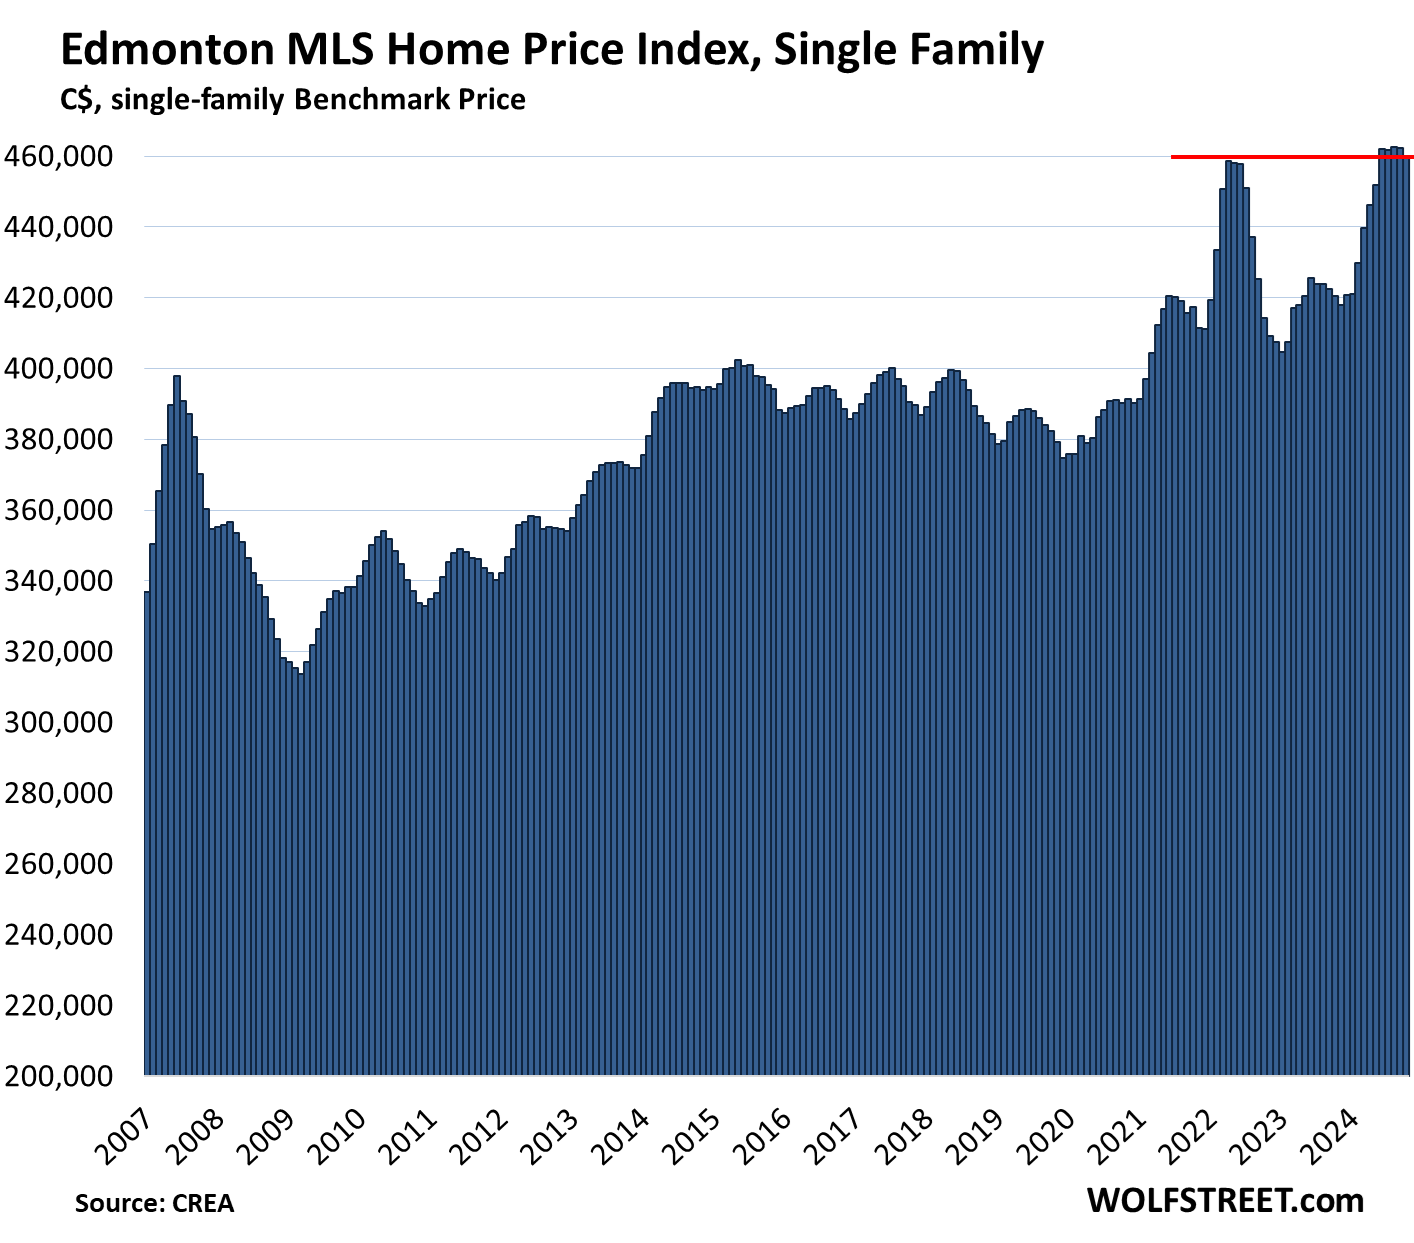
Edmonton, single-family benchmark price:
- Month-to-month: -0.6% to $459,800
- Year-over-year: +9.3%
- In the 17 years since the peak of the prior bubble in June 2007, the index is up 16%.
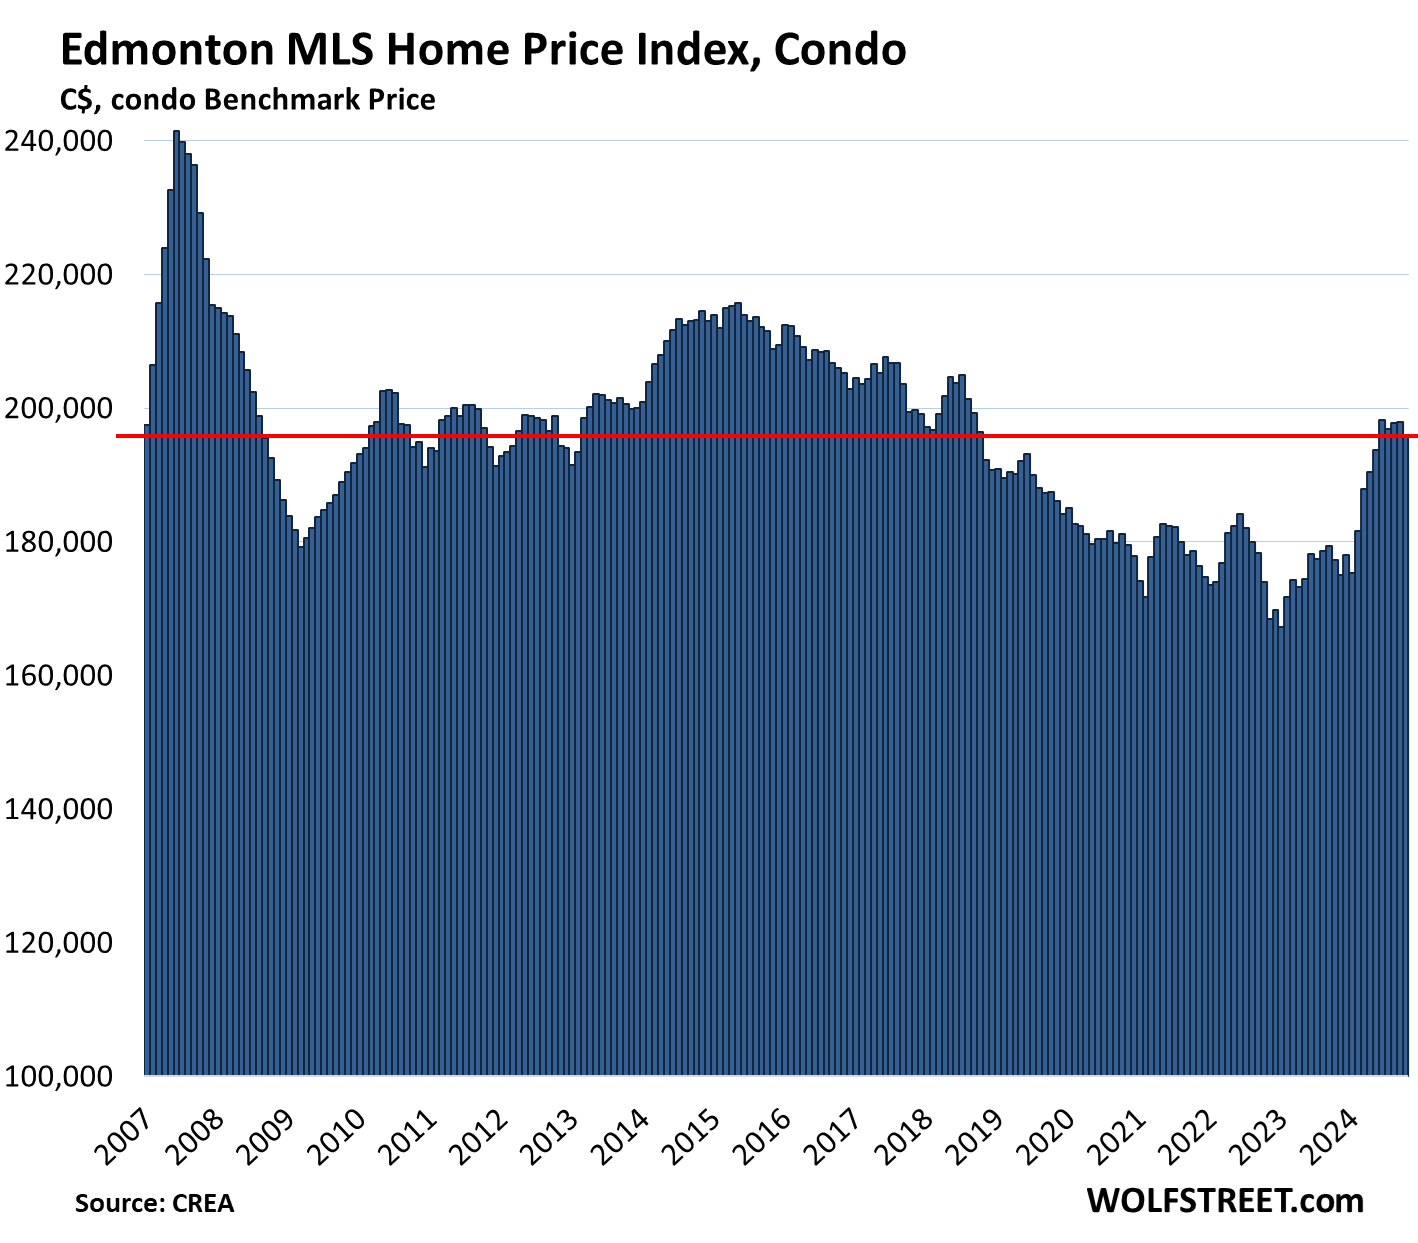
Edmonton, condo benchmark price:
- Month-to-month: -1.0% to $196,000, first seen in January 2007.
- From peak in June 2007: -18%
- Year-over-year: +10.5%
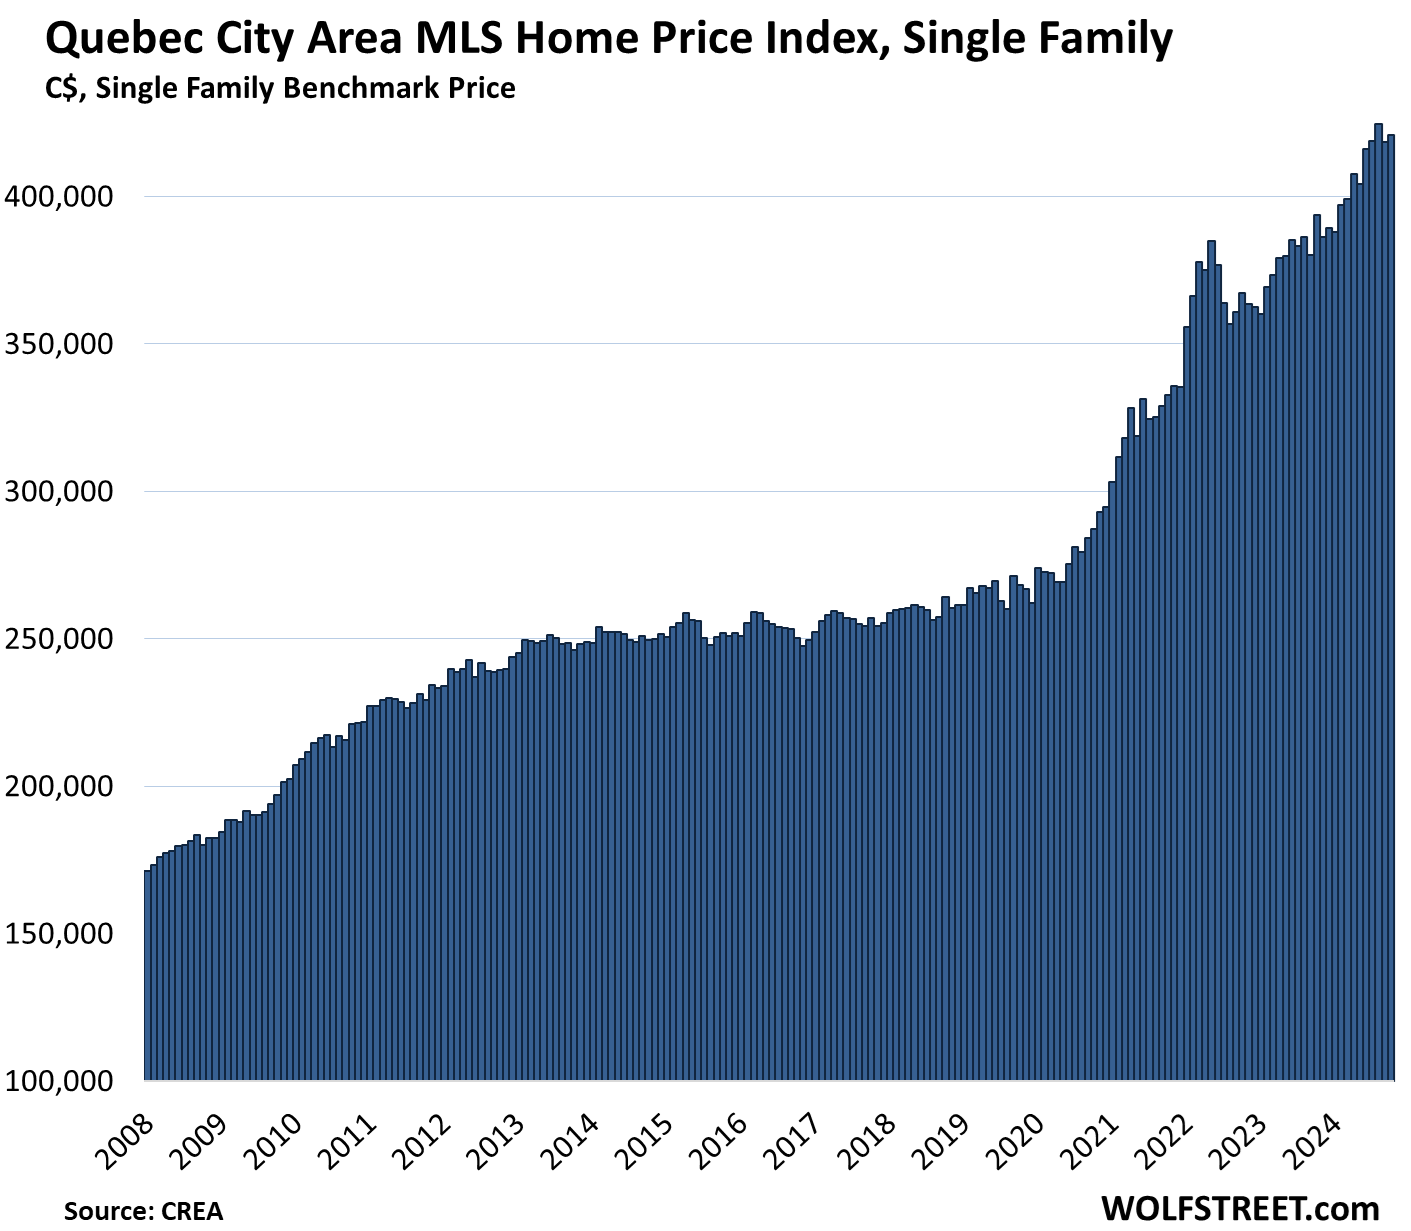
Quebec City Area, single-family benchmark price:
- Month-to-month: +0.6% to $421,000
- Year-over-year: +6.9%
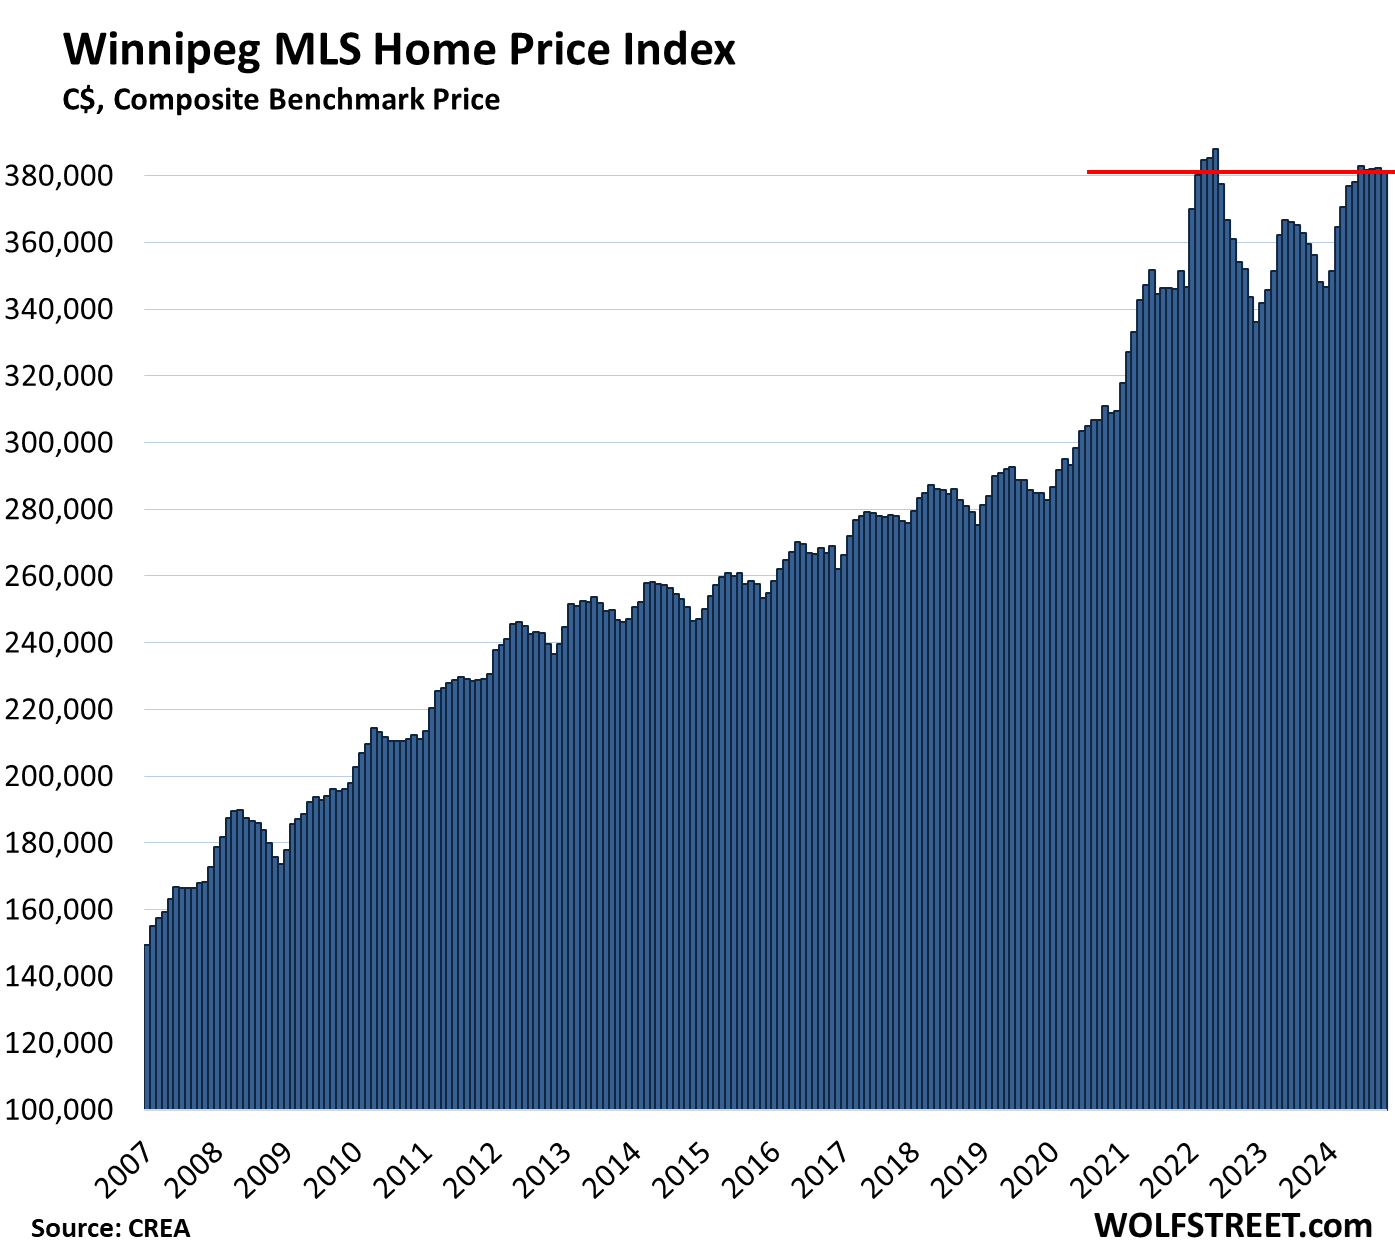
Winnipeg, single-family benchmark price:
- Month-to-month: -0.3% to $381,000
- From peak in March 2022: -1.8%
- Year-over-year: +6.9%
Enjoy reading WOLF STREET and want to support it? You can donate. I appreciate it immensely. Click on the mug to find out how:
![]()


Still too expensive.
You people are way too impatient. You’ve been spoiled by cryptos, which collapse overnight, and have done so repeatedly, and when you wake up, they’re at or near zero. Housing doesn’t do that. It takes years. In the US, top to bottom, the housing bust took 5-6 years. In Canada, the housing bust of the 1980s took even longer.
A million for a house really isn’t that much, the problem is the poor people who don’t have any money.
If all Canadians got a free house, a good portion of them would piss it away and be back sniveling about the high prices a few years later.
Watch housing prices rise in the spring …being unburdened by the past few years.
Poor people should just buy more money.
🤣
At 10% off?
“Poor people should just buy more money.”
😆😂.. reminds me of the Twitter account Worst Finance Takes
I believe the correction of the 90’s went into the new millennium. I think it was 12 years for prices to recover to their pre-levels. Perhaps even 14 years when adjusted for inflation.
Is there data for Winsor?
Yes, Windsor-Essex. Looks about like Hamilton. Similar numbers.
In the Greater Toronto area the housing bust happened in 1989 and prices didn’t start to recover until about 1997. Lucky for me that’s when my wife got the nesting instinct and we bought our current home. Wolf’s charts don’t go that far back, but they encapsulate the trend well enough for you to get a sense of how fortunate our timing has been.
You’re point about time to correct is well taken Wolf.
The issue with property in Canada is not so much about the time it might take to correct. The issue is that animal spirits in Canada are still very strong re:real estate.
There is still a common belief in Canada that property only goes up. So every small drop in prices gets met with a “buy the dip” impulse.
For most Canadians the current price movements are perceived as being a dip – not a correction.
The market should correct but it feels like something that’s too big to fail at this point.
Housing IS the economy in Canada so governments will scramble to keep the party going.
I just want to know what happens to world economies after experiencing 5,000 year low interest rates.
And I want to know if there are any economists who work at the Fed who are feeling a little… you know…. GUILTY.
Questioning their contribution to a functional society.
Cdn here. Anecdotally, given the gap between sellers and buyers, I think a lot of connected people are working hard to slow or stop the price-elevator from going down. Maybe buyers need to drop more low offers?
Another floor to pricing is the cost of construction and renovation. Wages in particular are much higher. Some of that is linked to high cost of living; which is linked to inefficient and wasteful government policies and decisions.
Another factor was overly ambitious or desparate government immigration policy. Canada is a small country. Exaggeratedly, it is just 3 to 6 mid size cities. Adding 500k to 1m new people is a big impact on a city’s infrastructure; hence taxes and development charges.
The government is now reversing its “overly ambitious or desperate government immigration policy” in multiple ways.
Too little, too late, but it’s a great start. If they can keep population growth under 0.5% for the next decade, infrastucture and housing might have a chance to catch up…
By a very small amount only.
The modern term is “population growth”. The current govt just went on a job cutting spree in the lucrative public sector. About 600 to 1,000 federal employees on term contract and casual employment will not have their contracts renewed in 2025.
Who’s gonna afford million dollar Toronto condos and $2,500 a month studio rentals with the public sector job losses?
If you believe some of the noise after the last two weeks, the demand for homes in Canada could be rapidly increasing, which would drive the prices up, but in the U.S., the Los Angeles market could see a lot expensive homes come on the market. 😁
What do you consider ‘expensive?”
Cdn here. Wolf, appreciate your point, resets take time and best slowly. However we all should be concerned.
My impatience is really more like frustration, and a heart felt more, with the duo monsters, who created this monster bubble in home prices and in public finances: the BOC, (central banks) and the cdn federal government. Both have been reckless.
The pain for Canadian mortgage consumers has been acute. Maybe 30%? renewed last year into high rates, ( 2/3% to 7/8%, and maybe 50% to renew over next two years. Anecdotally, people have been “accommodated by banks” with 80 to 90 year terms.
Many mortgages are underwater; not sure how many, as reporting has been blocked; 2015 was reported as $9B.
The pain for canadian renters has been acute, too. As federal government brought in 6 million people, in 10 years, so Canada went from 35 to 41 million people. Again for sort of 3 to 6 mid-sized cities. Plus 500k+/yr of temporary visas. Property taxes for city infrastructure has sky rocketed. Many are not able to replace boomers, so there are sugnifucant skill shortages in construction, health care, etc, etc. Happily, no shortage of real estate agents. And rent costs have escalated significantly.
Added insult came ecently from our Deputy Governor of BOC, who recently lectured us that it is best to not “tinker” with housing/mortgage incentives, as that leads to longer term higher costs. No sh’t Einstein!. Of course DP of BOC is but one person. Where were the rest of the leadership vanguard, for the last 30 years?
Huge fuducuary failure.
Socialist government and capitalism does not mix well. Too bad socialists are intenationalists – they despise their own people and love foreigners. We see this in Europe all the time. When we say: you cannot let illegal immigrants in, they call you a racist.
Even though most Canadian immigrants are legal (I suppose), it is completely irational to let people in, if you don’t have a plan what to do with them and where to put them.
Canada showed some great knowledge on how to import problems, but no solutions. When did Trudeau come to power? 2016?
There were about a million international students on a study permit last year I believe. The issue was that many of the international students were working full time while Canadians had to use food banks.
And then the international students were boasting about getting “free food” on YouTube while on a study permit, and even working full time.
And then the rental property industry decided to cash in on the million students a year by basing their rent on per capita income based on the maximum tenants per apartment unit.
So rather than base rental income on a working couple for a one bedroom, or a working couple with a child for a two bedroom, the greedy slumlords decided to base their rent on $500 per person multipled by as much as 10 students in a one bedroom apartment.
So what happened was that rents began to climb higher and higher because there were more people willing to cram themselves into a highly insulated apartment with poor ventilation.
And what was disturbing was that they wanted to pack so many young women into a one bedroom while horrible stuff were demanded from them from very terrible landlords. That’s another story.
Right now, there are measures being used to reduce the “population growth”, but the damage is already done, and will take a few decades to return to normal.
The ‘student’ racket was fueled by agents, domestic and foreign based who recruited students from overseas, as well as domestic colleges both private and public, with an insatiable demand for funding and desire for growth, and that charge multiples of tuition that Canadian citizens pay. The ‘students’ then apply for temporary resident permits, work permits, etc, with the goal of family reunification following.
The feds have recently begun to reduce the student influx after belatedly recognizing the explosion of this population, as well as refugees who simply walk across the border at illegal crossings, and are greeted and processed by police, given health cards, hotel or other accommodation and welfare. Typically many will work under the table, often under egregious conditions for minimal pay, and 10 to 15 living in a house or even an apartment, can be typical both in the city and especially the suburbs. Recent zoning changes in Toronto allow for higher concentration (i.e. flop houses) in formerly single-family neighborhoods. Neighbors not happy.
Not having paid much attention to population statistics for some time I understood Canada’s population to be something like 32MM; the other day it was given as 42MM, up about 10MM in the last 10 to 15 years, maybe 30%, but who even knows.
You got that right. The acceleration of the population happened in the past 5 years. They even upped the ante when there was a few months of flight closures due to the pandemic.
It’s like they want to body pack this country without expanding jobs and housing.
Quiet cul de sacs in Scarborough and the west end have become busy like downtown Toronto, yet the transit and job market is operating like if the population was 30 million people.
Think of a small city in New Jersey increasing its population by 200,000 people a year without expansion.
…the expanded population resulting in downward pressure on labor costs while expanding gross tax revenues, throwing a bone to the rental and house markets while we’re at it, perhaps?
may we all find a better day.
So…you’re not particularly thrilled with your Government’s part in all this?
“…as reporting has been blocked”
Not surprised.
Don’t worry they will extend them to 50yr mortgages.
Thanks.
Realtors have been screaming that come what may, Condo price may fall but not SFR.
I guess this move comes to So Cal as well.
In Canada I believe the ratio of new builds SFD : condos is – 1 : 4. Mind you, if you remove Vancouver and Toronto (and the GTA), I wouldn’t be the least bit surprised that the ratio is closer. Still, given the level of population increase and that SFD is in higher demand (more desirable) from the majority of the population – I would agree with those realtors. The future doesn’t look to promising for the condo market at least in Toronto.
“Toronto single-family prices -19% from peak, back to Oct. 2021” => Looks like SFR is also not doing well :-)
Canada only builds townhouses and apartments no detached houses unless they’re custom built by someone paying a lot of money.
Condo developments are everywhere on southern half Vancouver Island. In fact, I hardly recognise my old home town of Campbell River, pop approx 40K. They are filling these condos with retirees who move here from God knows where? SFH subdivisions seem to be expanding non stop too, however, a new 100+ acre site seems bogged down in legal troubles. That one they were asking $985K for the ocean front lots…1/8 acre or less. They are now just trying to unload the whole site.
I used to salvage logs off the beach right below my Campbell River house, and now there is a paved walkway with angle parking and bumper to bumper traffic. In the summer you hear Harleys rumbling by with retired pony tails playing at bikers.
I moved to a rural setting 20 years ago when Campbell River just got too big and busy for us. We are 50 minutes from town. At that time this place was in a similar downturn like it is today, and houses would/could be on the market for 2-3 years. It now looks like the same thing is happening again. It is our own market cycle. 10 years ago…when it was booming here, some Albertans bought and renovated an old huge place that was once a shingled covered school run by some granolas. It was supposed to be a lodge, but illegal to operate as such on registered farm land. They didn’t do their research! Now it is marketed as an estate home for 2.3 mil. It has been for sale for 2 years +, as well as many SFH in the $350-500K price range. People move here because it is gorgeous, they can’t handle the quiet and lack of shopping, and then move within 3-5 years. The lodge renovators are a case in point, as is one across the valley from me which our friends used to own. In just 10 years the current 3rd buyer is now trying to leave and has dropped their price twice.
Interesting that a new post and beam place going up on some land overlooking wetlands 1/2 km from me. An Outsider, and no one knows who it is? As for newer residents, we do have established grizzly families now…..with cubs Locals keep their location off social media to keep the lookie loos away. If a rare bird is sighted we are inundated. Sign of the times, I guess.
Personally I found the recent sizeable GDP revisions by statistics Canada to be a head scratcher and concerning. GDP for 2021, 2022, and 2023 were all simultaneously revised upwards roughly a week ago. I know revisions happen, but 3 years of GDP upwards revisions at precisely the exact same time? There’s the potential for people to perceive this as helping increase gdp per capita stats and/or possibly running cover for the BOC to decrease the benchmark less and at a slower pace (given economic projections of the newly elected American government). One would think that such a miscalculation would reflect poorly on statistics Canada and maybe further damaging their credibility – probably not, it never came close to making headlines in most mainstream media.
The Bank of Canada is getting desperate while watching the dollar fall. It will be interesting to see what they dream up for the upcoming inflation figure. I think it will either be very high or very low.
The good news is that the YIMBY agenda is driving forward in the best parts of Canada to crush those charts. The BC government ended single family housing and was re-elected and Calgary did something similar but now has to survive some asinine court challenge. We need all the housing we can build because we need all the immigrants we can get, and there are going to be a lot of Americans escaping to greener pastures in the times to come.
Canada is stunningly beautiful but you need to dig me out of my grave to live in such an awful weather.
Don’t understand the shortage of land in Canada as Canada has vast swath of open land all around.
I can talk about BC. There is not much space left. There is the ocean and mountains. The south western part is already built up, the main available area there is Frazer River. It has the terminating delta, totally built up. Higher the river, there is the river canyon and steep mountains.
The space SW BC is like 1 dimensional, along a few mountains roads (no flat area around), the second dimensions is taken away by the ocean and the peak.
The northern part of BC has miserable climate, and very limited infrastructure.
I know BC quite well, its corners. I was thinking over the years: if it would be up to me, what area I would suggest to built a new bigger city? Also studying it via maps and google earth. My top pick was Power River. It has some flat area to support it. But there is no road there, you need to take 2 ferries.
There is also some areas on Vancouver Island still available.
So, closer to the ocean is taken, other limited areas are subject to crazy forest fires and floods etc.
Overall not much left to be able to bring more millions to BC.
And, we don’t have much fresh water to spare…
One can build homes in the mountains , people have been dong it for centuries.
Powell River, not Power River. I lived and worked there for 9 years.
A lot of your post is somewhat misleading. There is vacant land, everywhere, but it is mostly all Crown Land….owned by the Province. If it was released for sale RE developers would go ballistic if their property values declined. The land is mostly designated for Forestry, including absolutely everything around Powell River.
There are thousands of available acres on southern Vancouver Island, private land from the old EN railway grant, but designated forestry. It dates back to the coal mining days in Nanaimo, Union Bay, and Cumberland which brought in the rail line. It was then sold/transferred to Forestry companies like BCFP, Weldwood, Pacific, etc and is now mostly owned by Mosaic Forest Products.
However, if they sold it off for residential use people would go ballistic, especially First Nations with unsettled land claims.
Cities are not just built somewhere, they exist for a reason….like a port, transportation hub, even as an information industry hub. Powell River, originally Sliammon, was built for the hydro power to run a pulp mill. The mill is now shut and the site is now owned by the local First Nations band. They will most like remove the dam and re-establish the destroyed salmon runs from the Powell lake and Lois River lake systems.
When I lived there in the 70s there were over 2,000 employees at the mill. When I moved away in the 80s downturn (to CR) there were 1400 employees. There are now 0 employees. The main industry is servicing and building for retirees and WFH folks….some remnants of logging.
Lots of fresh water most locations….just no infrastructure.
I’ve spent some time in the winter months doing oil and gas work in northern Canada (Fort McMurry, Norman Wells). If you can actually get there, land is plentiful and attractive during the summer which usually occurs during the second week of July (maybe).
If you think it’s cold in Canada, check out Montana and Minnesota.
Robert, that cold weather in Minnesota and Montana comes down via the jet stream from the southern part of Canada, which is the warmest part of Canada!
I have lived in both Montreal and Montana. The cold in Montana is mild compared to the cold of Montreal where you can’t even stay out five minutes without having your extremities frost bitten. I used to wonder, why did people even settle here?
You violated the commenting guidelines several times in a row, including with this comment, which I explained to you:
https://wolfstreet.com/2024/11/08/with-home-prices-way-too-high-more-and-more-people-profit-from-arbitraging-the-vast-cost-difference-between-renting-and-buying/#comment-614199
And including by spreading made-up conspiracy bullshit about Social Security, which I deleted. I understand you’re in Canada and know zero about our SS system, but you felt compelled to make up and spread this insidious bullshit because it was fun to do??? This is exactly why the internet is such a toxic place.
But OK, if you understand the drill now…
Jon the majority of Canadian land is Crown land, or protected land.
Even if you got a parcel of land free in the middle of Ontario, the county could refuse construction on the land with no recourse.
And the funny thing with Canada is that they can’t even track stolen cars with the GPS telling the car owner where the car is, but the cops will gladly drive in remote areas to arrest people who are living on land without a permit.
It happened to that YouTuber who was living waaayyy up north in the Yukon. RCMP ordered him to vacate the land.
The Trump victory means the Yuan should fall hard which would mean Vancouver, Canada would be the first city to collapse in price due to no new money coming in from China. Money from China will be priced out of the Canadian housing market because the Yuan will keep on falling in value.
The Yuan is so cheap the drop isn’t even noticeable. They pumped a ton of money into Vancouver at 14 cents to the CAD over 10 years ago, it’s not like they waited for the amazingly high price of 21 cent peak before flooding into Vancouver. They can “collapse” back to 14 cents and will continue to move money out of China.
Yeah I don’t know if I agree with that assessment, the Chinese money that reaches Canada and our RE, well anywhere outside of China and any foreign RE is basically capital flight, so in my mind falling Yuan should accelerate not decelerate it. Ofcourse I’m not a Chinese industrialist so I could be 100% wrong lol
Huh? The renminbi (yuan) is pegged to the value of the US Dollar with very minimal float (variance) allowed.
Calgary,Edmonton and Winnipeg are only rising because it’s considered more affordable for FOMO buyers.
Same goes with MTL and Quebec City, but hopefully the home buyers know how to speak French (because there’s a historical reason why Quebec real estate is lower- has to do with the English and French language dispute).
Rents are still struggling to go lower in the GTA though. It’s still $2000+ for a one bedroom apartment.
15 years ago, it used to be $900 a month for a one bedroom apartment in the Parkdale area of downtown Toronto. Apartments now go for the $2000+ a month price, even as far as Halifax Nova Scotia.
I live in Markham, Ontario and the last figures I could find show it has the highest rents in Ontario even higher than in Toronto.
January 2024
According to liv.rent, Markham was the most expensive city to rent in Ontario, with an average rent of $2,494 per month for a one-bedroom unit
The consultants likely advertised that Markham is a world class city. I used to enjoy the farmland north of Steeles 10 years ago as a teen, but Vaughan and Markham are like condopalloozas all over.
The funny thing with Canadian condos is that no matter how many 30+ storey towers are built, it rarely translates to lower rents. Just less drastic price increases.
Is there a Wall Street in the residential York Region these days?
Little off topic, but did ya’ll ever see The Trailer Park Boys? Awesome show, don’t miss it. Driving through the SE of Canada, checked out some of their areas (Truro, Dartmouth, and around), and found the show to be extremely accurate.
I’m thinking Ricky and Julian would do a better job running the country than the current administration…
Not much to cheer about. The Canadian Central Bank simply wants folks to have a lot of patience:
“our forecast includes the expectation that households will continue to adjust their saving and spending patterns to absorb the impact of higher mortgage payments. And as interest rates come down that impact will fade, and consumption will gradually pick up.”
That’s called do nothing economics.
Condos are a must in Toronto, more viable than single family homes. Even in the outlying areas, condominium developments are more feasible and workable, from a financial standpoint, than are homes.
One problem with condos is that they may be a little harder to sell than freehold homes. It’s easier to get people into and out of your property out in the burbs than to traipse them through a skyrise all the time.
And there is the question of mortgages. Mortgage rates skyrocketing out of control are associated with inflation, but there is also predatory pricing by the big banks to consider. Although the banks play innocent, and support charitable endeavors such as the literary Giller Prize, they have been known to gouge when the gouging is good.
The first comment and your response is intriguing. ‘Still too expensive.’
‘You people are way too impatient.’
Your website seems to have two cycles only…wash, rinse, repeat…always the same stuff. I totally understood the housing market correction (crash) of 2008. It was predictable, rational and everything one would expect in a normal, albeit manipulated market. THIS MARKET IS DIFFERENT, A sort of Frankenstein monster beyond any and all comprehension – a market that defies any and all norms of a free, floating market. It is like a magician levitating an elephant, and the audience gasps in disbelief. I can’t understand this market. It’s a freak. Why doesn’t Wolf dedicate a column to this abomination of a market and explore the reasons for the inexplicable? Prices started to fall in 2008. We could smell it. This time – nothing! NOTHING, but inexplicable levitation. Maybe it’s beyond Wolf’s comprehension. Admittedly, it’s beyond mine. I have some ideas. I am certain of one thing – this freak of a market is NOT normal. Could it end up with the largest bust in all of history? Time will tell. Meanwhile, wash, rinse, repeat…
“Prices started to fall in 2008. We could smell it. This time – nothing! NOTHING, but inexplicable levitation.”
RTGDFA, or at least look at the first two pictures. 🤣 you people are a trip!
So this is repeated from the article, LOL
Prices of single-family properties in Canada were down by 17.4% from the peak of the spike in March 2022, and were back where they’d first been in September 2021:
Prices of condos in Canada hit the lowest level since December 2021 and were down 12.0% from their peak in April 2022.
And don’t forget Toronto, down 19% from the peak:
Dimitri, open your eyes. Slice and dice the data any way you want to. If your “inexplicable levitation” comment has to do with the charts showing some level of “support” at the upper end of the numbers, then yes, there seems to be some lower bounds where the prices “bounce off”. This is not a stock chart.
Fact: Prices peaked and are now lower. We know that because of HINDSIGHT.
In analyzing the SPEED of the price declines, I see some markets in the US declining faster than Housing Bust 1. Spring season should bring some more clarity to the whole thing, but it doesn’t matter if you won’t open your eyes.
I think it’s time for annexation of Canada to the USA. Canada can’t compete with the US and certainly not globally. The taxation stranglehold on taxpayers to bridge this gap is insane and not sustainable. This last ditch attempt to open the immigration flood gates to shore up the population (and tax base) is a gimmick by a desperate politician. Maybe when the CAD goes to $0.50US Canadians will wake up.
🤣 I think for most part, Canadians like being Canadians, rather than USians.
The board said 6,658 homes changed hands last month in the Greater Toronto Area, up 44.4 per cent compared with 4,611 in the same month last year.
3,824 homes were sold in Montreal’s housing market during the month of October 2024, reflecting a massive 43% growth in sales compared to October last year and a 19.5% increase compared to last month
Deals in the two biggest cities are rising again and BОC is about to lower interest rates. This speaks to a recovery in prices in the near future and continuation of the inflation of this bubble.
But inventories are up too from a year ago, and the supply it coming out of the woodwork, which is why prices have DROPPED in Toronto, despite the increase in sales.
Agree with you.
The big question is how far the BOC will cut interest rates. If it continues at the same pace sales will jump which will reduce available inventory and prices will jump
That was before Trump got elected which could mean longer term interest rates stay elevated. That means no speculators will come back into the Canadian housing market and with virtually no first time buyers due to prices it means home prices should keep falling. The Bank of Canada can keep cutting short term rates but at some point in time they’ll have to raise short term rates to defend the dollar. With rents finally falling you don’t want to be a home buyer right now.
I’m not sure if BOC cares about the value of the loonie more than he cares about real estate prices in Canada which is one of the main pillars of the economy
Lower CAD = higher inflation from imports. Good for exports though. Inflation will come back when the QE cannon comes when Trump cuts taxes and continues to spend. They’ll cut anything thr democrats put in place now that they have control of both house and senate. The poor will suffer with rug pull of social assistance programs.