Six-month core PPI: +3.4%. Six-month services PPI: +3.7%. Year-over-year, both also accelerated further. But energy prices plunged.
By Wolf Richter for WOLF STREET.
The plunge in energy prices caused the Producer Price Index to inch up by just 0.05% in September from August – rounded to “unchanged” – and this was the material today for the (AI-generated?) headlines. But outside of energy, inflation at the producer level wasn’t benign at all, as several of the prior month-to-month changes were revised up substantially today. The six-month averages, which include the revisions, and the year-over-year increases, show that the whole scenario changed for the worse.
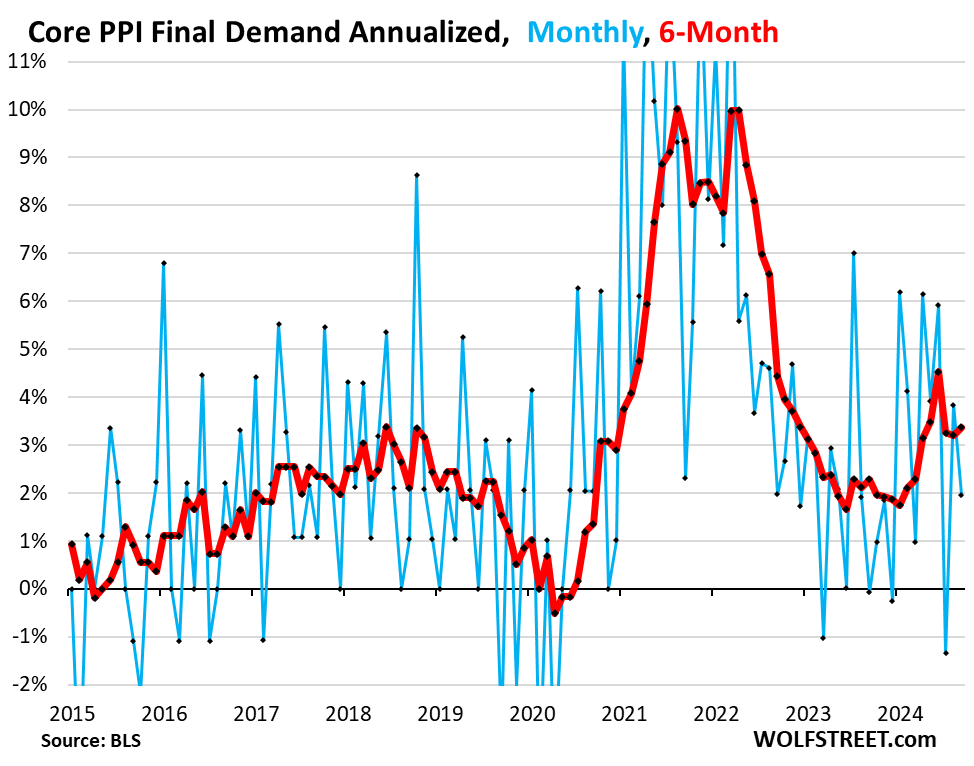
“Core” PPI rose 1.9% annualized in September from August (0.16% not annualized), seasonally adjusted, according to data from the Bureau of Labor Statistics today. But some of the prior months were revised up substantially. These month-to-month squiggles are indicated in blue.
So the 6-month Core PPI – which includes the revisions and irons out the month-to-month squiggles – accelerated to +3.4% in September. In terms of the up-revisions: August, as revised today, rose by 3.2%, up from the August reading a month ago of 2.8%. Note how the 6-month average shifted higher in 2024, after being well-behaved in much of 2023 near 2% (red).
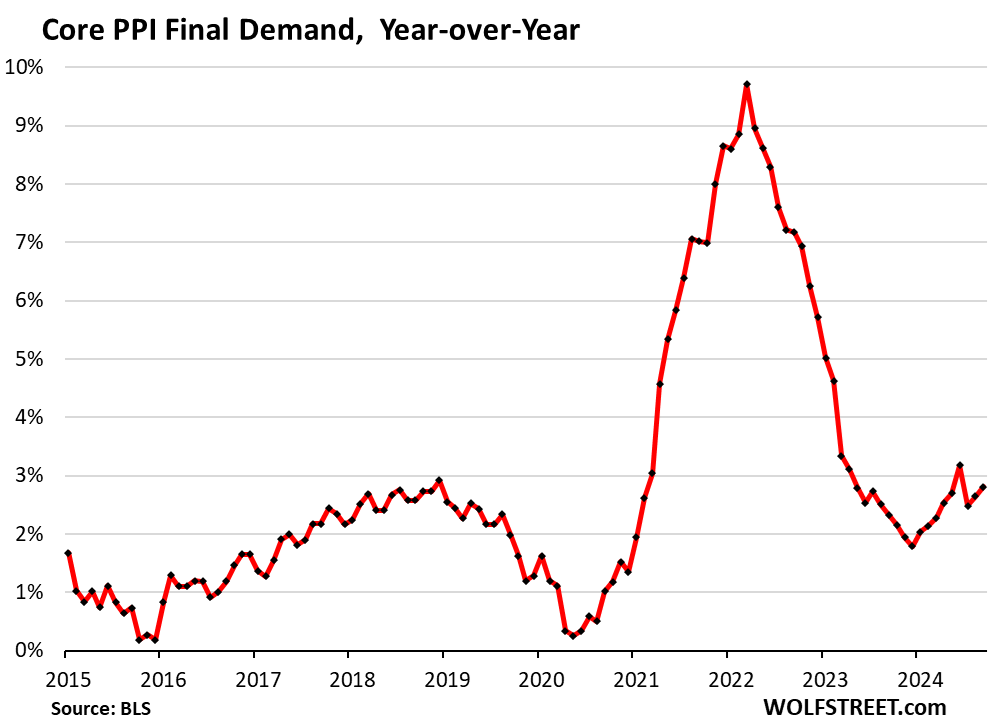
Year-over-year, core PPI rose by 2.8%, the second month in a row of accelerations, showing a significant up-trend in all of 2024. In terms of the up-revisions: August, as revised today, rose by 2.6%, up from the reading a month ago of 2.4%.
The PPI tracks inflation in goods and services that companies buy and whose cost increases they ultimately try to pass on to their customers.
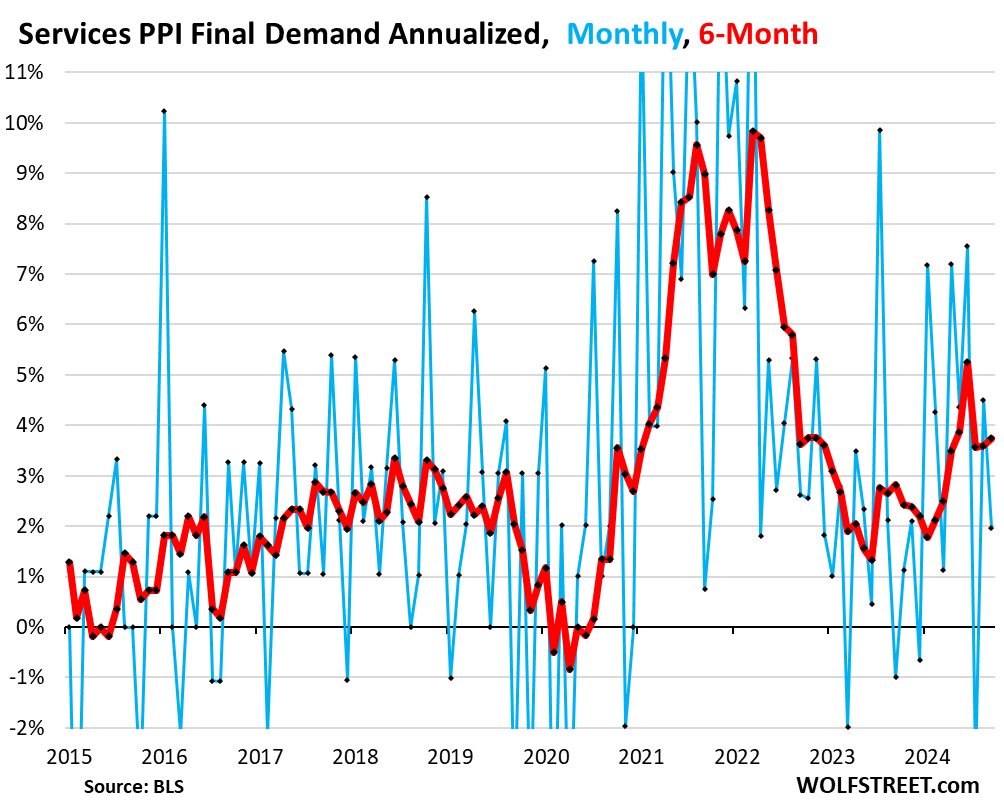
Services PPI rose by 2.0% annualized in September from August, and some of the prior months were revised up substantially (blue in the chart below).
So the 6-month average rose by 3.7% (annualized) in September. In terms of the up-revisions: August, as revised today, rose by 3.6%, up from the August reading a month ago of 3.0%!
It’s the big revisions in the services PPI that drove the revisions in the core PPI. And there is nothing benign about the trend in the services PPI.
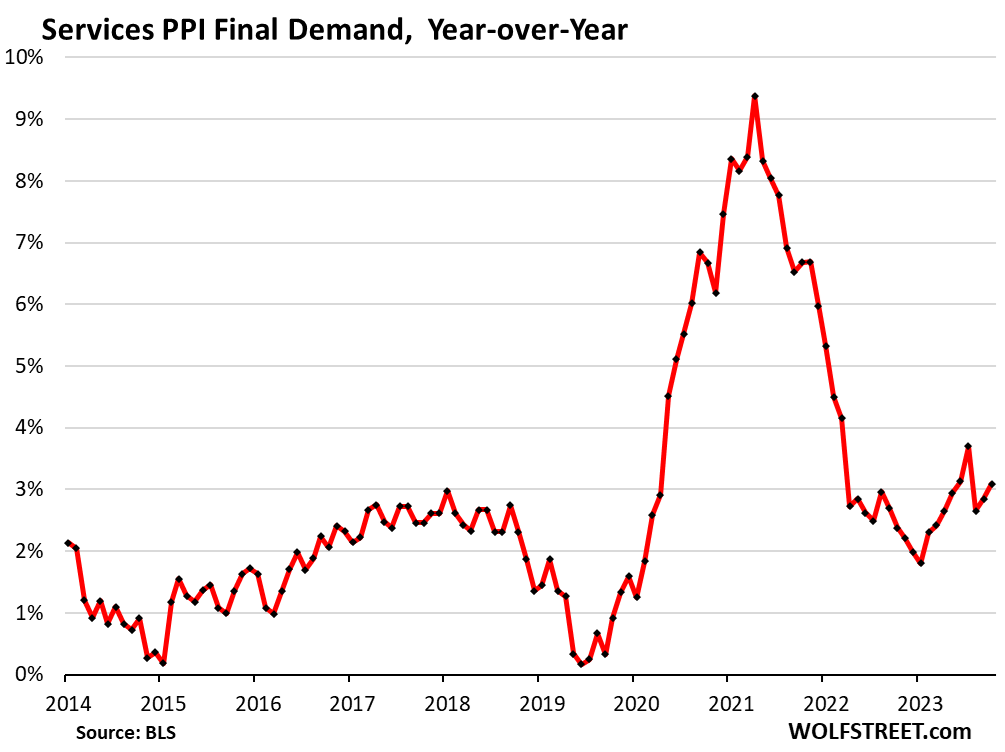
Year-over-year, the services PPI accelerated to 3.1% in September. In terms of the revisions: August was revised up to an increase of 2.9%, from an increase of 2.6% reported a month ago.
“Finished core goods” PPI rose by 2.6% annualized in September from August. The 6-month average accelerated to 2.3%, but has been in that range for three months. And the revisions were insignificant.
At the core goods level, producer price inflation seems to be in the upper portion of the pre-pandemic range at this point.
As we have seen in the Consumer Price Index as well, there have been no major inflation pressures in core goods in over a year. Inflation has gotten very sticky in services. And core goods have been a big factor in holding overall inflation down.
The PPI for “finished core goods” includes finished goods that companies buy but excludes food and energy products.
Year-over-year, the finished core goods PPI accelerated to 2.4% in September, the highest since December 2023. Here too, we can see that core goods inflation is in the upper portion of the pre-pandemic range.
The overall PPI for final demand, driven down by the plunge in energy prices, inched up 0.6% annualized in September from August (+0.05% not annualized).
But the big up-revisions of the prior months caused the 6-month average to accelerate to an increase of 2.3%, despite the plunge in energy prices.
In terms of the revisions: August was revised up to an increase of 2.2%, from the increase reported a month ago of 1.9%.
Here too, and despite the plunge in energy prices, we can see that overall PPI started trending higher in 2023.
Year-over-year, overall PPI rose by 1.8%. The August increase was revised up to 1.9%, from the 1.8% increase reported a month ago.
Obviously, the massive plunge in energy prices, which started in mid-2022, will end when energy prices hit bottom somewhere. Energy prices cannot plunge forever. But this plunge in energy prices has papered over the very sticky and still vibrant inflation pressures in services, which is why we look at prices beyond energy.
Enjoy reading WOLF STREET and want to support it? You can donate. I appreciate it immensely. Click on the mug to find out how:

![]()
Very helpful perspective, as always. Thank you Wolf!
Wolf,
Without the specific item breakouts available in the CPI posts, I find it a lot harder to interpret/weigh the PPI numbers.
Do the PPI reports provide more granular level detail that might be useful?
The PPI report is a huge pile of very volatile detailed data, going up the pipeline all the way, way too complex and volatile for an article, and really not very useful. This here is just “final demand.” Then there is “intermediate demand,” which is further up the pipeline and comes in four “stages,” each going up further in the pipeline.
I track the PPI for nonresidential construction costs for my construction articles — so you have seen this chart before in my construction articles. This is the level of detail the PPI data provides:
The Fed does not care about higher inflation. This is just a talking point to fool the masses. They have to finance the almost 8 trillion of debt that has to be refinanced in the next 14 months.
So obviously rates have to come down fast so all the government debt can be rolled over. And they ain’t gonna roll it over at 5% duh…
“We are living on borrowed time and borrowed money”
The Federal Reserve has no control over the yields on the $35 trillion of outstanding US government debt and that is set in the free and enormous US bond markets and will continue heading much higher over the coming years.
Given the astronomical levels of Federal debt, it does seem reasonable to assume that the Fed will happily sacrifice savers (again) in order to save the Government that accumulated the astronomical debt.
But, in the internet era, it is much harder to frame private actors for Government-created inflation.
At some point, as things get worse and worse (and given the post 1970 record why wouldn’t they?) the G will probably try laying the blame on its henchman, the Fed – buying a few more years of desperate political baloney.
But if long rates go up, this will not work.
Treasury finances Gov not Fed. Fed is trying to save as many banks (including primary dealers which are required to bid in Treasury auctions) and bank like organizations (see repo market) from each other. Research CDO (which includes MBS but there are lots more) and you will see some of the more difficult Fed conundrums.
SoVal,
“Federal Reserve has no control over the yields on the $35 trillion of outstanding US government debt and that is set in the free…”
I’m not saying it is always going to be this way or that it is good (in fact I believe the opposite) but…
It seems pretty clear that Fed money printing (at the cost of inflation) *has* been able to beat down interest rates, multiple times in the wake of free mkt spikes.
Basically, if no private actors/foreign Gs are willing to roll-over massive US Treasury debts at X% (instead demanding X%+Y%), the “independent” (snort) Fed has stepped in with incrementally unbacked fiat (printed money) sufficient to roll-over that Treasury debt at X%.
That is exactly how DC has been able to keep the whole fiscal sh*show going for over 15/20 years.
Of course, the consequence is dollar inflation on *everything* (in essence the Fed, via printed fiat, is incrementally confiscating all USD private savings – in order to fund perpetual US fiscal deficits).
I am open to other opinions, but I need to see them stepped through and related to the actual empirical outcomes of the last 20 years.
The whole history of ZIRP was about artificially strangling US interest rates.
@SoCal I’m not sure that your statement is absolutely true that the FED has no control over treasury yields. The FED is the single largest? (or among the largest) participants in treasury auctions. This is the opposite of a free market. While you might argue they can’t absolutely set the rate on the 30yr bond, they can certainly influence that rate as every cycle of QE has shown.
It’s a political certainty that the FED will “look through” elevated inflation to help ease the gov deficits through inflation. The question is what is that magic level where “looking through” is no longer politically tolerable? Seems likely that inflation in the 3%, maybe even 4% range will be tolerated.
“The FED is the single largest? (or among the largest) participants in treasury auctions.”
Correction: the FED was* the single largest participant. Now they are doing QT.
Headline on CNBC right now 2:47 PM CDT. The Fed may have just hit its 2 percent inflation target. LOL
Two years ago, high energy prices were pulling up CPI and PPI. Now, low energy prices are pulling these figures down.
Inflation whack-a-mole.
All eyes on you Pow Pow…your next move will speak to your legacy in this inflation war…
Looks like MSM wants a cut, data suggest otherwise…definitely will be an interesting Nov..any bets on where this is heading in Oct?
I hope Powell is reading this, energy is skewing the target.
The Cantillon effect in reverse.
I gave AI a random sample of Wolfstreet articles and asked it to generate headlines for them. For every one of them AI came back with a headline “Some Economic Data Explained, RTGDFA“
:)
It would be a tragedy if Wolfstreet.com ever become dominated by AI output. The flair and sizzle would be gone. The unique viewpoint would be bowdlerized into a potpourri of literary soundbites … And where would we be without his comments?
“bowdlerized”
Wow!!! On Wolf Street! I think the last time I heard this word was in one of my graduate courses in literature in the early 1980s. You just made my day!
1:04 PM 10/11/2024
Dow, S&P 500 close at record highs as stock investors cheer bank earnings
Dow 42,863.86 409.74 0.97%
S&P 500 5,815.03 34.98 0.61%
Nasdaq 18,342.94 60.89 0.33%
VIX 20.51 -0.42 -2.01%
Gold 2,672.60 33.30 1.26%
Oil 75.56 -0.29 -0.38%
SP 500 PE ratio – over 30.
Historical average = 15.
50% index decline would normalize.
Whoop de doo. I just checked my 401k (invested in Target 2060 retirement), and it’s at $87,000 and change. Everything I need to buy is up by 20-80% in the last 5 years since I graduated university, and the rich with $10 million 10 years ago have $30 million and will still “pay whatever” for everything, driving costs us, but life’s just grand!
Steve B,
You have no idea how tone-deaf your whole series here (prior article) is. You said you’re about 27, you graduated from college not long ago, you already have $87K in a 401k at this young age, rather than struggling for survival, as we had to do at that age, and you complain how unfair life is. You have no freaking idea. I’m glad that you’re doing great at your young age, but you get 5 Academy Awards for whining in your prior comments.
I agree with Mr. Wolf. Is Steve B serious? Must be a troll, otherwise I’ve a pair of shoes for Steve B.
He’s a Millennial…
Or more likely, Gen Z (they started in the late 90s). They’re even more insufferable than us millennials and took the “everyone gets a trophy” and added “eat the rich” to complain how it’s unfair they don’t have houses, fully funded 401Ks, and luxury vacations in their twenties that the rest of us spent decades to earn.
A good case study for the whiners. Greed.
If SteveB leads a boring responsible life, the max 401K contribution is $23,000/ year. If he has been working for 4 years, he should have over 100K by now with market gains. Why isn’t he saving more? :-) Before he has a house, children, etc….
It sounds like a humble brag.
Gen Z is so lucky. Back when I was his age, I could only stash away 7K/year in a 401K.
87,000 7% return compounded annually till 67 years old with no additional contributions will only be worth 1.3 million. The average savings at retirement is 555,000 and the mean is half that. What a poor kid.
Our debt that all these people are complaining about can be solved by stopping tax give aways to the rich. But as long as the Congress doesn’t allow a default by refusing to pass the debt ceiling Treasuries are a great investment especially compared with the newly announced Chinese bonds.
Wolf thanks for your hard work pulling all this info together.
Not bad Steve. I feel a bit fooled LOL
If youre really opposed to the current situation, understandably so, I wouldnt invest in the target date fund. They contain the overhyped, overvalued megacap tech stocks and toxic bond funds. I understand that 401ks sometimes have limited choices, but a money market or stable value fund might me available, which both have some risk, also. But if you change jobs, you can roll it all over into an IRA and be free of the funds.
My guess is that Steve would be interested in something that gives at least 100% return without much risk.
SP500 would not do that. It only gave 34% in the last year…
MW: Homeowners haven’t drained cash out of their houses this fast since 2008
MW: US mortgage rates register biggest weekly jump in six months
Sounds like another scare doomer headline like most American don’t have $400 in savings type….I am sure this is nothing burger…
Yes, the best solution would be for everyone to STOP RTGDFHeadlines.
Ikki, song fan,
So, read nothing at all…..or just skip the headlines……or stick to talk radio and some TV?
Rhetorical question.
I mean, a “nothing burger”.
MW: SoCalBeachDude drags garbage onto Wolf Street and gets labeled as an idiot.
Those two stories today on MarketWatch are both correct and have highly salient information and I would suggest you read them and attempt to comprehend that key information.
There is not one media outlet, including marketwatch, that exists to provide information. They exist to get you to the next commercial. That is all.
With the inflation and employment data that’s come out recently, another rate cut in November doesn’t make sense to me. At the very least you’d expect a “wait and see” approach for caution’s sake.
Not sure why “wait and see” should only apply as rates increase. But maybe I’m naive.
Bostic came out yesterday saying that he is open to a “pause” in November.
I am sure it will be pending Oct numbers. If it even flatline in Oct, likely it will be greenlight for cutting….
The rate cut in September was unnecessary. A rate cut in November would be worse than unnecessary.
You best believe it’s a function of who gets elected. Yellen and JPow will burn it down if they know their time is up.
Very interesting headline vs fact though I did not see much move in the 10 year. Not sure what the fed flat rate cuts did (don’t really know how to pull that easily)
Rich folks love this e-CON-omy.
Poor workers not so much.
What rich folks don’t seem to get is that quality of their goods and services fall as inequality in wages rises. Yes, they can buy a gigantic fancy yacht with the geater inequality, but they might not be able to enjoy it. The likelihood of the yacht falling apart due to shoddy interior quality, or being in the shop for maintenance all the time due to crappy structural integrity or engine parts, or the crew not doing their job correctly or showing up for work goes way up. Look, some level of wealth inequality is ok, but when it gets out of hand, no one benefits. Those billionaires lives can’t be enjoyable when everything around them is low quality due to their economic actions.
Do I understand this correctly?
Thesis: Wealthy people spending money on luxury items causes fall in quality of goods because the workers can’t afford to purchase yachts. Better yet, no one should be able to purchase them or billionaire quality of life will diminish.
Solution: pay diversity hires and ignorant illegal immigrants more money until they too can afford Jets and Ferraris.
I agree, rich folks don’t seem to get this.
If thats what the rich folks think, after ignoring wisdom and common sense, that there are no consequences to ratcheting up wealth disparity, then yes, they dont get it, and might find out the hard way. The real solutions are there ready to commence at any time the rich folks decide to stop being ignorant and greedy: drain all the MBS, cut spending, reduce the debt, quit manipulating interest rates, etc.
PilotDoc: I didn’t get that at all. Rather,
Thesis: Great and increasing wealth disparity is demoralizing to the “working class.”
The ones who do (manufacture, maintain and repair etc) will eventually get weary of a continually perceived (and measurably real) “falling behind.” They will stop caring about productivity and quality.
Replacements for skilled workers are cheap but not skilled.
I observe regularly that it’s relatively easy to “complete” work poorly. It leads me to wonder if it’s actually “complete”?
It begins with fast food, grocery stores, hotels, dock workers, Amazon warehouses etc.
We see that airline mechanics have bargaining power because the skills are recognized and valued. Is the same true for medical workers, non-union aircraft mechanics or pilots etc?
Time will tell.
Struggler – the bumpy, and eternal, human problem of how much to accept and engage in existing rates of exchange for one’s only true asset, their time, for anything else, material or ephemeral…
may we all find a better day.
I think the QE and the deficit spending is going right to profits and wages and not to meaningful expansion of productive capacity. The money didn’t flow to China to expand production, did it? When you never have a slow down in consumption what incentive do corporations have to lower prices? People will pay what it costs to get what they want, and rack up the debt to do it.
Hello Wolf. Sorry this is off topic but curious to know how much MBS is owned by US treasury and part of the national debt. I understand Fed owns significant MBS(2.5 trillion), but since now fed is not buying who finances new mortgages.
I think you’re using the wrong language here.
1. The Fed holds (“owns” as you said) MBS
2. The US Treasury Department holds zero MBS
3. The US government insures and guarantees mortgages, packages them into MBS, and SELLS these MBS to big investors. The US government does this through various agencies (VA, Ginnie Mae, Farmers Mac, etc.) and through the GSEs (Fannie Mae, etc.).
4. The US government is on the hook if these mortgages default. Investors that hold these “agency” MBS don’t bear the credit risk.
5. As the Fed steps away, investors end up buying all the MBS that are issued.
If the government is going to guarantee MBS, why even bother having them? Why not just buy treasury bills of the same duration?
MBS yield quite a bit more than Treasury securities because they’re such a hassle to deal with. You constantly get these pass-through principal payments that reduce your balance, so you have to buy new MBS all the time to keep your balance steady. MBS are really only for pros with huge portfolios of them. But if you have this system set up on auto pilot, they’re a pretty good deal.
https://fred.stlouisfed.org/series/WSHOMCB
Can you expand on this series?
The chart you linked shows MBS held by the Fed, which it bought during QE and is now shedding during QT.
You people have to start reading my articles here.
My Fed QT articles, which I publish once a month every month, are a flagship product here and get lots of attention. By posting this kind of comment here, you show the entire world that you have never ever read any of my Fed QT articles.
So the link below is the latest Fed QT article. The MBS section is the third chart down. Make sure you read and understand the explanation.SO READ THIS:
https://wolfstreet.com/2024/10/03/fed-balance-sheet-qt-66-billion-in-sept-1-92-trillion-from-peak-to-7-05-trillion-back-to-may-2020-below-7-trillion-in-1-2-months/
Sorry forgot to add this simple search link.
https://www.investopedia.com/ask/answers/07/mbs-guarantee.asp
My post wasn’t a dig just trying to add that there can be risk it’s not always a free lunch. I was mostly curious regarding what the Fed report on there balance sheet and if any was at risk if there can be such a thing for the Fed.
The Fed only holds “agency” MBS that that are guaranteed by the government, and is therefore not exposed no credit risk if borrowers default on mortgages.
My articles have said this a gazillion times.
There are private-label MBS that investors hold that are not guaranteed by the government, but that’s a much smaller portion. And the Fed holds none of them.
If there is no credit risk why are mortgage rates so much higher than treasury yields?
There are two parties to this deal.
There is no credit risk for investors of MBS because the government insures or guarantees the mortgages. So investors are buying government guaranteed securities.
But the government faces the credit risk from homeowners defaulting on their mortgages, and lenders face this credit risk in non-government-guaranteed mortgages, and they all need to be compensated for taking this risk.
The spread on MBS vs. Treasuries is lower than the spread on mortgage rates vs. Treasuries. If a mortgage is 6% and Treasury bond is 4%, the MBS is probably closer to 4.75%. The servicer who takes mortgage payments has to get paid, and the GSE typically keeps some part to fund its guarantees, and so on. In the meantime, the MBS investor is getting paid more because of the risk that rates fall and everybody refinances. So even though the credit rate risk is probably the same between Treasury securities and MBSs, the interest rate exposure isn’t the same.
But the fact that MBS are self-liquidating and get called when the mortgage pool falls below a certain level — so a 30-year MBS pays off its holders long before 30 years — also reduces the duration risk that we saw over the past two years get banks in so much trouble.
There is credit risk! That’s why CDS exist. Not all MBS are federally guaranteed. If they were there would not have been the great financial crisis!
I actually do read many things as well as a life as a successful trader to include CDS. There’s more to this story than your cursory post Wolf! I was only asking the question in the hopes of having some additional great analysis regarded risk that others might benefit from instead of believing that investing in MBS is a risk free government guaranteed instrument.
I can see how investing in new MBS offering can be a good investment when rates have been 7+%. However, if the mortgages refi to 6% then that nice rate goes away and the MBS is “called”.
It seems that loan servicers must have a much higher overhead compared to supporting a treasury bond. My loan servicer staffs a support line, sends bills out every month, collects and pays escrow, has a legal staff, and sends out tax forms every year. That must affect the paid interest rate for MBS holders.
Since many MBS’s hold mortgages at less than 3%, With the high overhead, how are any of these making any money?
They must be taking a bigger hit than Treasury Bonds from that time.
Thank you Wolf.
Precisely in what way is the government on the hook for agency backed mortgages?
For VA and GNMA backed mortgages, there is an explicit guarantee.
But how is Uncle Sam on the hook for the others, like mortgages backed by Fannie and Freddie?
US has taken over Fannie and Freddie during the Financial Crisis. They’re in conservatorship of the US, are controlled by an agency of the US government (FHFA), and all their profits are remitted to the US government.
There are discussions underway to privatize the GSEs, but they have not gone very far.
The GSEs have offloaded some of the credit risk via risk-share arrangements with servicers/issuers and by selling Credit Risk Transfer vehicles to private investors.
So Uncle Sam is on the hook to the extent of its investment in the debt and equity of Fannie and Freddie?
C and Kramartini,
I think Wolf is saying that after the GFC, the US government took the risk away from the banks when they took conservatorship of Fannie and Freddie.
I know that when I refi’d with a lender in 2020, that my qualifications had to meet Fannie and Freddie requirements. My loan was not kept by the lender but was immediately sold to Freddie(you can look up your loan on the Freddie page). This means that all banks and lenders have turned over the risk of default to the US government. I think the majority of home mortgages were sold to Fannie or Freddie after 2008.
This means that the bank crisis of 2008 should not be repeated.
However, there is now a possibility of a taxpayer crisis. Since unlike a bank, the US government theoretically cannot fail so they can offer deferments and forgiveness if the SHTF again.
It seems like it will only accelerate more from here. The Fed would have to raise rates again, and then we will finally have the crash I anticipated much earlier. It seems like this inflation will be crushed only by a recession.
Maybe our economic indicator needle will find it’s way to the promised landing? The 2% goal of Powells is close but yet so far away.
Does anyone eat bacon anymore at 9 dollars a pack….myself, I’ve been reduced to hot dogs.
You can make your own, and better than store bought bacon for under $4.00 a pound. And it is easy to do. Lots of folks do it.
Thanks WR for these reports and showing us the other side, much different from MSM and FED as well.
If the inflation is really this high, and sticky, then FED would not have hiked by 50bps.
When the Fed hiked, it didn’t yet have this data. But it did have two weak labor market reports in a row, and that scared them. But then, after the cut, the entire weakness was revised away. I’m glad I’m not in their shoes.
Could be that Powell is made of green cheese: two eyes, a nose and a mouth. There may be something here…
.5 will never make sense to me. What will a pause in Nov + Dec say?
Nearly 68 million Social Security beneficiaries will see a 2.5% COLA beginning in January 2025.
Input 2.5% to my big spread sheet. I will ignore inflation until October 2025.
The only way to beat inflation is to stay rich.
You do have to wonder if they purposely came up with that small COLA figure knowing damning data was coming down the chute.
“Oops, too late now. Maybe you’ll catch up next year”.
MS – the euphemistic term: ‘…cutting your losses…’, has many different interpretations and implementations…
may we all find a better day.
No revisions of COLA numbers of course to match prior month revisions to this data.
Seems like we need a major conflict or event to drive energy prices up to reveal what’s behind the curtain.
The US is the largest oil and gas producer in the world, a large exporter of petroleum products and the largest exporter of LNG in the world. Production has been surging from record to record. Drill baby drill. There is a glut in the US, and exports are relieving the glut. So any energy price spike is going to be short-lived because it will just cause production to surge.
But what will happen at some point is that energy stops plunging, and when it kind of wobbles along in a price range for a while, the energy PPI and CPI are no longer negative but maybe zero or slightly positive. And suddenly overall PPI/CPI is higher than core PPI/CPI. So in this case, if core PPI is 3.4% six-month average, and energy increases even a little bit, overall PPI will increase by 3.7% six-month average, instead of 2.3%, as it’s doing now.
Wolf,
What you mention here on oil production I follow a writer who believes EIA understated production in 2022 and overstated it in 2023. We are beginning to see the peak production of Permian isn’t far away. Thus the increase in overall PPI is on the way.
The upside will be with LNG and hopefully in a big way.
Every year since I followed oil production in the US – lots of years by now — there have always been stories by “experts” that claimed that peak production had either already occurred or was just around the corner, either in the US overall or in specific fields. But production keeps booming. These peak-production stories are circulated, I believe, in order to pump up prices.
And when the price of oil rises enough, then shale plays that are not economical today will become economical. A high price of oil in the US will bring on a tsunami of oil production. When the price is high enough, frackers can ramp up production so fast it makes your head spin, as we have seen. And so they have succeeded several times already in totally crashing the price of oil and gas through overproduction.
Peak cheap oil is a myth.
Given the opportunity, oil producers would flood the market with supply, crash the price, and ultimately drill themselves into bankrupty.
There is no shortage of oil (or hydrocarbons generally) in the western hemisphere.
It’s probably the nature of fracked oil and gas production that it quickly responds to price moves. Price goes down and players slow spending on refracking older wells. Prices go up and capita quickly gets deployed to refrack wells that are running down the production curve. Oil production in these non-traditional fields seems to be very much a matter of “put capital in get black stuff and gas out”. And it’s not even a gamble on established pads, its a simple formula – x-dollars in, results in y-volumes out.
And dont forget that the Permiam is not even the largest area of new exploitation now – Pennsylvania and the Marcellus continues to grow and grow. Also, Canada will one day get their heads screwed on right and the oil-sands in Alberta will begin to ramp again. Although with the pipeline dead much of that production will move east to the pacific for transport offshore.
Add to this the continued increase in EV’s in urban commute markets which frees up more and more gallons of gasoline
So that’s why the USA Imports 8.5 MILLION BARRELS of petroleum per day???
Because US refiners import crude oil, refine it, and export value-added gasoline, diesel, jet fuel, etc. It’s a huge trade. That’s how refineries make money. Even the refineries here in the SF Bay Area are doing it, and I can see the fully loaded tankers head out the Golden Gate toward Mexico and Central America. Gulf Coast refineries are doing it, everyone is doing it. In addition, the US petrochemical industry is a huge exporter. Exports of petroleum products and petrochemical products are a huge part of US exports, and we’ve covered it here many times.
The US West also imports crude oil because there is no crude oil pipeline across the Rockies, and so the overproduction east of the Rockies can only be exported to other countries, not to California. There are some Midwestern refineries tied by pipeline to Canadian producers, so they’re importing. while producers further south are exporting. The US buys crude oil from Mexico and sells gasoline, diesel, and jet fuel back to Mexico, and makes money off the spread. There have been efforts to build more refineries in Mexico, and someday they will, and it might end that trade.
The whole petroleum trade is huge and complex. And these are just a few tidbits.
in July, the US exported 10.6 million barrels per day, including some of these major categories:
4.2 million b/d crude oil
3.1 million b/d of finished petroleum products such as gasoline, diesel, jet fuel, residual fuel oil, petroleum coke, etc.
2.2 million b/d in liquefied petroleum gases
350,000 b/d unfinished oils
https://wolfstreet.com/2024/03/04/us-production-exports-crude-oil-petroleum-products-soar-to-record-in-2023-strategic-petroleum-reserve-gets-refilled-slowly/
All of what Wolf said, and remember: the Saudis own one of the biggest refineries in the USA.
Port Arthur is a big refinery, I believe still wholly owned by Aramco? (Since 2017)
The tankers are already coming here. Saudis have a lower breakeven rate than shale producers. There’s probably various arbitrage opportunities.
Beyond Saudis, there’s the Venezuelans and other multinational companies with ownership stakes in US refineries.
It’s the old joke about the tire companies: the only difference is the name stamped on the sidewall. There’s not a tire plant in every city! (Or oil refinery or chip factory etc).
Over the past month the prices of oil and gasoline and diesel have been soaring and are up around 15% during that time which renders these statistics on inflation pretty much meaningless and irrelevant as of the present time.
That’s BS for the US overall — though your personal rip-off gas station from hell might have jacked up the price just to make you happy, but not in the US overall.
Weekly gasoline prices for the US and by region:
https://www.eia.gov/petroleum/gasdiesel/?src=email
As you can see, the West Coast has its own line. If you click on the dates in the right-hand column, you get the charts. On the West Coast, the average price as of Oct 7 dropped to the lowest in 10 months.
The commodity price of WTI oil has increased from around $68 to now almost $76 per barrel over the past 30 days and that applies to the entire US pricing and is a straightforward fact.
Look at a 1-year chart of WTI. You will see that a year ago, WTI was at $89 (today it’s at $75). By mid-Dec, it was at $69. Then it rose to $86 by April 2024. then it fell to $65 by early September, then it rose to $75 now. In other words, it has traded in that band (between $65 and $89) for an entire year, but with fairly typical ups and downs, and is now in the middle of that band.
Now look at a three-year chart to see how much WTI has fallen from the peak in mid-2022.
But gasoline prices don’t track WTI in lockstep. They dance to their own drummer — demand and supply at the retail level. Driving season (summer) has the highest gasoline retail prices and winter the lowest, seasonally. So seasonally, gasoline should decline coming out of the summer, and they did. There is a lot of hedging by refiners. And you can see the varying profit margins of refiners and retailers.
Yesterday I paid $3.60/gal for premium in northern New England. Pretty sure this is the lowest price I’ve paid all year.
I just paid $3.98, near the highest since last winter.
I know there’s a $0.50 premium in my neighborhood (the $4 price is the “affordable” option 70 miles away).
Gas, cigarettes, coffee, all cost as much as someone will pay!
We have 0 ethanol gas on some pumps that’s a higher price for the same octane. No idea if there’s any operational benefits but I am sure it sells!
Struggler – I cannot overstress the deleterious effects of ethanol in terms of its hygroscopic nature (attractiveness to atmospheric moisture) when used as a component of motor fuel, let alone it’s corrosive nature on various rubber products not specially-formulated to withstand exposure to it. Throw in it’s lessened thermal-potential when mixed with gasoline (reduced fuel-economy/gallon) and questionable true cost-effectiveness of same when following the food-stock-to-fuel subsidy trail…well, let’s leave it that I’m not a fan (wish I had the option for ethanol-free here in CA at venues other than special-order or at a racing facility… I know, I know, given my advancing years and ongoing decline of ICE-power this is truly, as my grandson reminds me, “a vanishing first-world problem”…).
may we all find a better day.
Diesel (USRDP) is down significantly over the last year. It is down almost 25% YoY and is scraping its lowest point of the year. You are just a barrel of BS today.
What motivates FED decisions?
For Paul Volcker, it was inflation and he didn’t care how high unemployment went to control inflation.
But now, due to the $35 trillion Federal debt, the situation is far more treacherous. Plus Paul Volcker didn’t care about the damage done to Wall Street.
Jerome Powell is trying to thread the needle: he cares about unemployment, he cares about Wall Street, he cares about the economy, and he says that he wants 2% inflation, but he lowered rates before he even got it. Maybe he lowered rates to help democrats in the election, anything is possible.
The Federal government guarantees so much today: $250,000 or $500,000 in bank deposits, home mortgages, who knows what else. Any rational observer could only conclude that their guarantees could very easily exceed their ability to fulfill their guarantees.
After all, how much are guarantees worth when the organization making them is already $35 trillion in debt.
The Federal Government now guarantees every penny in every bank account. There are no limits.
If these people had just dealt with this from the beginning rather than ignoring it and hoping it went away on its own we’d be out of this mess by now.
If we just didn’t spend a crap ton of money and shut everything down we wouldn’t be in this mess. I work as a nurse and was knee deep in covid and I still feel we shouldn’t have shut crap down.
Ok, things open now, but nothing will be the same as before. Uncle Waldo’s wild ride has landed us in this strange post covid reality.
…we declared war on ourself and our businesses, we lost the war, many businesses were destroyed…. trust in our institutions was the biggest casualty…bla bla bla.
Matt, thanks for being on the front lines of that war.
Wolf, thanks for your honesty and taking the time to reply to comments.
I’m disappointed in how most people read the headlines about inflation going down without actual crunching the numbers. Every article I’ve seen paints a rosy picture by examining the year of year numbers not month over month increases. Please keep reporting the real deal.
It may be a statistical artifact, but short-term money flows fall below long-term money flows in 2025. This would indicate stagflation, business stagnation accompanied by inflation. It suggests that stocks be sold in the near future.
Can you chime in on this Mr Wolf? I see NVDA going to 150 easy and all your writing suggest the economy is robust and healthy (and SPY agrees with you)
But your writing on this inflation thing has me confused. It sounds bad and many major outlets seem to not care and think everything is fine
Are equities a safe harbor from inflation? I do not want to sell NVDA :[
Nvidia has nothing to do with the economy. It’s in the middle of the AI bubble. When the AI bubble implodes, Nvidia implodes, and markets take a huge bath, and the economy will be OK, except in places where the laid-off AI workers live.
It’s incompressible to me how you can tie Nvidia’s stock price to the economy. You’re just fooling yourself?
Wait so the economy is bad??? Idk Mr Wolf… Jensen and co are creating our brilliant future it is no bubble. There is obvious hype but I’ve been using this AI stuff for over a year and it’s only gotten better…
I still think NVDA is worth at least 150, it being cheap at these prices…. Sure there is a little inflation but that will be solved when AI improves efficiency in all sectors :]
Wake up and smell the silicon my friend!! Who cares if eggs are an extra dollar or two lol. Small price to pay
Anonymous – unclear if you neglected to engage the ‘/s’. (…if not, then I’ll say what I had to say to (very few, thankfully) new, young associates at the moto-shop when I inevitably-found they were passing their employee-discount privilege to a buddy at the register-, if so, my apologies in advance…)
Associate: “…but it’s only a dollar!…”.
me: “…we have one chance to maybe fix this, right now-open your wallet, and give me a dollar.”
Associate: “…what?!?…”.
me: “…you, yourself said, it’s ‘only a dollar’…(less devalued at the time). Comprende, amigo?…”.
Spend your own ‘dollar or two’ anyway you wish, sir, but don’t think I, or anyone else, ‘shouldn’t care’ about how we spend ours…
may we all find a better day.
The time has come to stop selling cartons of 1 dozen eggs, from this day forward, eggs will be sold as lots of 10 units:
Per BLS:
During each call or visit, the data collector collects price data on a specific good or service that was precisely defined during an earlier visit. If the selected item is no longer available, or if there have been changes in the quality or quantity (for example, a 64-ounce container has been replaced by a 59-ounce container) of the good or service since the last time prices were collected, a new item is selected or the quality change in the current item is recorded
Not gonna work. Americans hate the metric system.
There isn’t a valid measure of velocity. But FEDwire statistics show an increasingly robust economy.
https://www.frbservices.org/resources/financial-services/securities/volume-value-stats/quarterly-stats.html
PPI trend up and earnings trends down, great combo as stonks make successive new all time highs — ignoring every possible link to reality or abundance of caution.
From our good friends at Lipper:
“For the second consecutive quarter, aggregate earnings are expected to reach a new all-time high, with a current estimate of $511.4 billion in Q3, surpassing last quarter’s actual figure of $504.8 billion. However, this quarter’s earnings face tougher year-over-year comparisons, resulting in an expected growth rate of 5.0%, down from the 13.2% seen last quarter.
Earnings growth expectations were revised downwards by 320 basis points heading into this earnings season. This aligns closely with a common trend, as we typically find that analysts lower estimates by an average of 330 basis points before earnings season, based on data from the last two years. Energy saw the largest downgrade of 1,670 bps, followed by Materials (-1,180 bps) and Industrials (-760 bps). Only three sectors—Financials, Information Technology, and Communication Services—saw an upgrade heading into earnings season, and even then, the increase was minimal at just 50 basis points. This modest improvement highlights a cautious tone from analysts.”
Tariffs increase prices. China retaliated. She bought less corn, chicks, wheat, almonds, tomatoes, whatever…to punish us. Our trade deficit with China is less negative since 2018, rising to a higher low, trimming about a 1/3. Mexico is next. We will build more stuff ourselves, just in time. Farm’s overcapacity will send food prices down. The CPI Food at Home will shrink. Telling addicted people to stay away from junk food isn’t good enough. Raising the min wage of junk food workers to $20, before $25 will shutdown many junk outlets and reduce our spending on pharma, doctors, sureuries… Farmers will sell excess land to construct houses and apts. Demand is high. Farmers subsidies will raise food prices. Farmers are hooked on subsidies. Less subsidies and
higher tax collection from highly skilled workers will cut US gov debt down, possibly by a third.
ME – food pricing/production/arable-land resources vis population food demand is an eternally-windy tightrope to walk. FDR’s administration realized the human constant that hungry populations can become extremely irrational in short order, leading to New Deal ag-subsidy program solutions and their subsequent financial-gaming by all involved…(the mission of maintaining an unhungry, if not-necessarily well-nourished, population achieved, and, so far, maintained however…).
may we all find a better day.
may we all find a better day.
CL 1M almost completed its downtrend cycle. CL might rise in 2025.
I remember the good old days, when the price of a stock was determined by its dividend, and only a small part of its valuation was determined by the upside potential of its price. Stock was issued to raise capital for the company and to share risks/profits with the public.
And when the federal reserve guaranteed liquidity nationwide and it controlled the growth of the money supply by setting the reserve requirements for the banking system. Instead of attempting to control the entire economy by setting interest rates.
And of course there was the quaint economic principle of supply and demand to determine the value of anything? Including interest rates! Instead of everyone perusing the news and crunching numbers with algorithms hoping for a big score?
It’s a system that is not working, and as the wise say, it will only be resolved by chaos and a new system rising out of those ashes.
EcuadorExpat
“it will only be resolved by chaos and a new system rising out of those ashes.”
You’re confusing the US with Ecuador. Ecuador has already done that a few times. I got into a peasant revolt in Ecuador in 1998 (glad I made it out alive). Meanwhile, the US is doing just fine.
EcuadorExpat
“it will only be resolved by chaos and a new system rising out of those ashes.”
You’re confusing the US with Ecuador. Ecuador has already done that a few times. I got into a peasant revolt in Ecuador in 1998 (glad I made it out alive). Meanwhile, the US is doing just fine.
The US is NOT ‘doing fine’ at all and is an out of control economic disaster headed for its biggest crash in history.
🤣❤️
The election result could possibly sink the market. No matter who wins there could be higher taxes, higher prices, more stimulus and more debt, according to the candidate’s policy proposals.
There was a deal, but it expired. Putin renew his attacks on Odesa’s port,
silos and ships to stop Ukraine grain export that makes Ukraine rich.
They attack ships sailing in the black sea across the coast line to the Bosphorus that feed millions in China, the ME and Africa, in front of Kasan BRICS conference. In 2025 inflation will rise.
Wolf – what about an article on skyrocketing homeowners insurance rates in Florida and other disaster prone areas. I just heard the average homeowners insurance in Florida is now approaching $6,000/year and many insurance companies are going bankrupt and dropping their clients, like Citizens Insurance. Rates are predicted to go up even more as result of these two recent hurricanes, if you can even get insurance. This is a major crisis that is not being covered by the main street media. People need to be informed on what the risks are in buying in hurricane/flood prone areas. I believe the Real Estate Industry is covering all of this up. Where is Lawrence Yun, touting his BS about buying real estate anywhere and anytime and always going up?
“I believe the Real Estate Industry is covering all of this up.”
I don’t think they’re covering it up. It’s a huge crisis in lots of places, not just Florida. It’s on the front pages here every day.
The insurance issues for homeowners is nowhere to be found here in the print media. Most people here don’t even know about it until they get their bill in the mail. I had trouble getting insurance on my home because of a large claim paid out in 2022. I’ve been “Black Listed”
I see it constantly. The WSJ covers it. My local papers in San Francisco cover it constantly because it’s such a big mess in CA. The LA Times covers it. In your bailiwick, the WaPo covered it. Even the NAR covered it:
https://www.nar.realtor/magazine/real-estate-news/states-where-home-insurance-costs-are-surging-highest
Thanks, Wolf
Good info
I ‘ll check it out.