The yield curve moved further toward un-inversion, but not the way it was hoped.
By Wolf Richter for WOLF STREET.
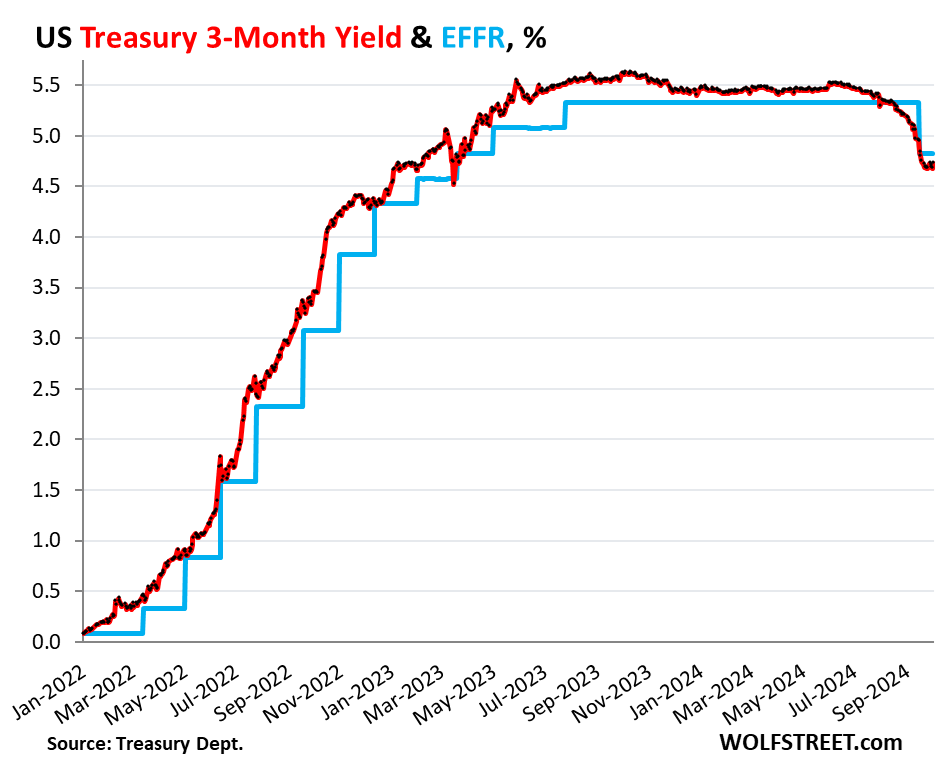
The Treasury yield curve un-inverted by another big step on Friday: The three-month yield has vacillated in the same range for the past 11 trading days following the drop after the monster rate cut. But longer yields surged, starting with the one-year yield, with rate cut expectations getting slashed, and with inflation fears returning. This nearly fixed position at the short end and surge in yields further out on the yield curve caused it to un-invert by another step, but not the way folks had hoped.
Folks – especially the real estate industry – had hoped that the yield curve would un-invert amid a series of steep rate cuts that would bring down short-term yields fast, and that long-term yields would follow but more slowly, so that yields would be lower across the curve than they’d been before the rate cut, but with short-term yields a lot lower and long-term yields somewhat lower, and mortgage rates lower too.
But longer-term yields had never fully bought into the rate hikes in the first place, with the 10-year yield remaining well below the Fed’s policy rates; and then they started dropping in November last year in expectations of lots of rate cuts – reinforced by the labor market tail spin in July and August that has now turned out to have been a false alarm – and very low inflation in the future that has now come back into question.
So when the rate cutting started, longer-term yields went the opposite way: They jumped amid resurfacing inflation fears, and mortgage rates spiked.
The chart shows the “yield curve,” with Treasury yields across the maturity spectrum, from 1 month to 30 years, on three key dates:
- Gold: July 23, before the labor market data went into a tailspin.
- Blue: September 17, the day before the mega-rate cut.
- Red: October 4, after the jobs report.
As shorter-term yields stayed roughly put over the past days while longer-term yields jumped, the yield curve un-inverted further – it became somewhat flatter. Eventually, the yield curve will enter its normal state where shorter-term yields are lower than longer-term yields across the yield curve. But it still has aways to go.
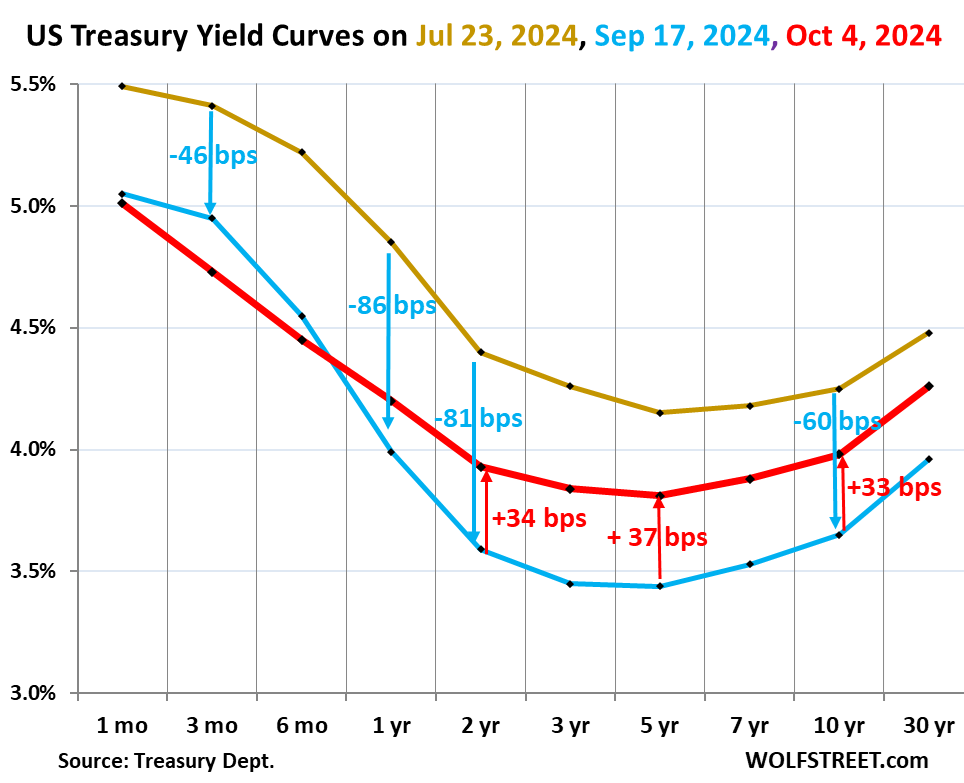
Between July 23 (gold) and September 17 (blue), yields plunged across the yield curve in anticipation of lots of rate cuts from the Fed – thereby pricing in a bunch of future rate cuts (blue figures and down arrows in the chart above):
- 3-month: -46 basis points
- 1-year: -86 basis points
- 2-year: -81 basis points
- 3-year: -81 basis points
- 5-year: -71 basis points
- 10-year: -60 basis points
- 30-year: -52 basis points
From September 17 (blue) to October 4 (red), from the day before the rate cut to Friday, October 4 (red figures and up-arrows in the chart above):
- 3-month: -22 basis points
- 1-year: +21 basis points
- 2-year: +34 basis points
- 3-year: +39 basis point
- 5-year: +37 basis points
- 10-year: +33 basis points
- 30-year: +11 basis points
Yields jumped the most in the middle on crushed rate-cut expectations.
The 1-year yield, which had been as low as 3.88% on September 24, is back at 4.20%, after Friday’s 18 basis-point jump.
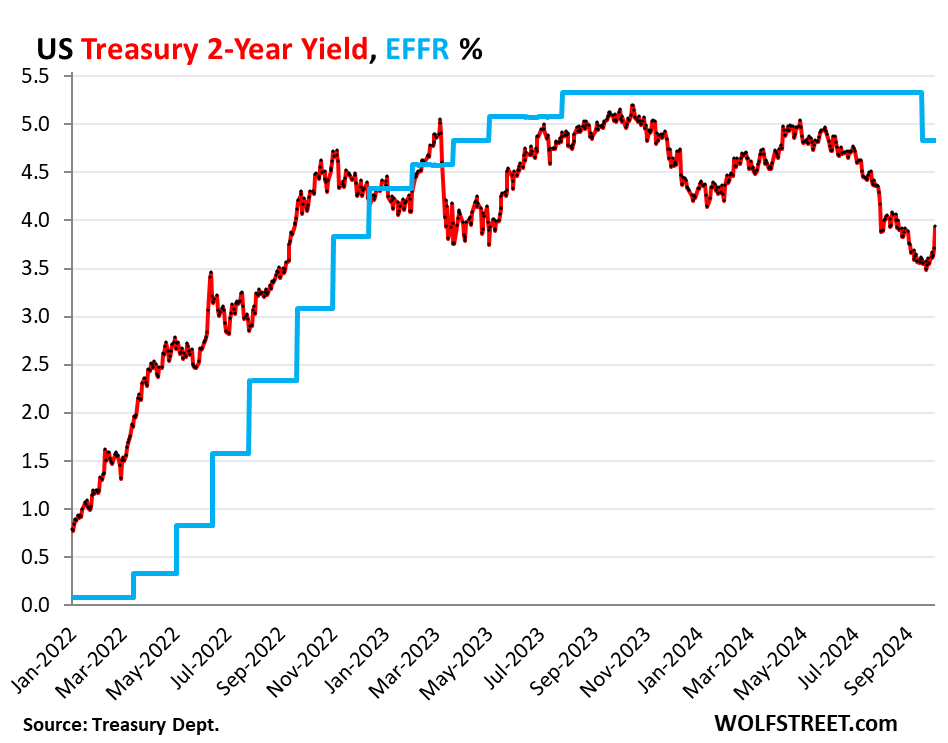
The effective federal funds rate (EFFR) which the Fed targets with its headline policy target range, dropped 50 basis points after the Fed announced its 50-basis-point rate cut, from 5.33% on Wednesday September 18, to 4.83% the next day, and it has remained there since (blue in the charts).
The biggest jump on Friday occurred at the 2-year yield, which spiked by 23 basis points, to 3.93%. Over the past two days combined, it spiked by 30 basis points. This shows that markets have dialed back their aggressive rate-cut expectations with which they had gone into the September 18 FOMC meeting. Quite a U-turn (EFFR = effective federal funds rate which the Fed targets with its policy target range):
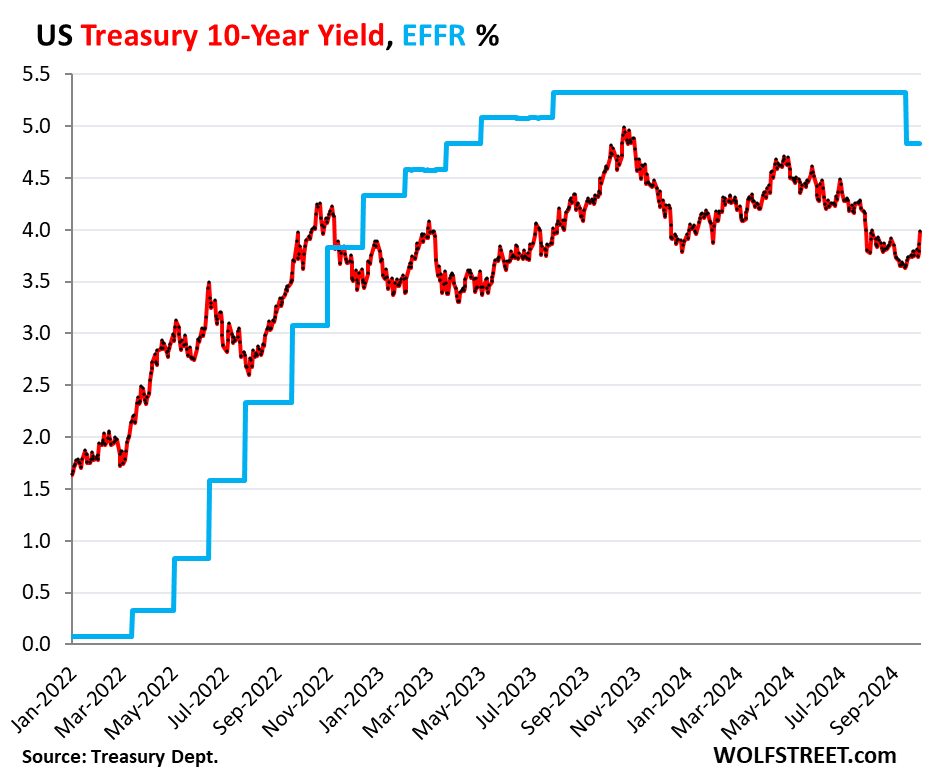
The 10-year yield jumped by 13 basis points on Friday and has risen by 33 basis points since the rate cut, to 3.98%. It’s back where it had last been on August 8.
The 10-year yield isn’t as much a reflection of rate cuts and rate-cut expectations, which impact short-term yields, but more a reflection of inflation expectations over the next 10 years. And there are all kinds of dynamics under way now that indicate that inflation might not go back to sleep. We got the latest indication in the jobs report: steep increases of average hourly earnings in August and September.
In addition, the 10-year yield is a reflection of expected supply, and given the massively ballooning US debt, supply will be huge, everyone knows that.
The average 30-year fixed mortgage rate exploded on Friday by 27 basis points to 6.53%, according to Mortgage News Daily. It was quite a mess (chart via Mortgage News Daily).
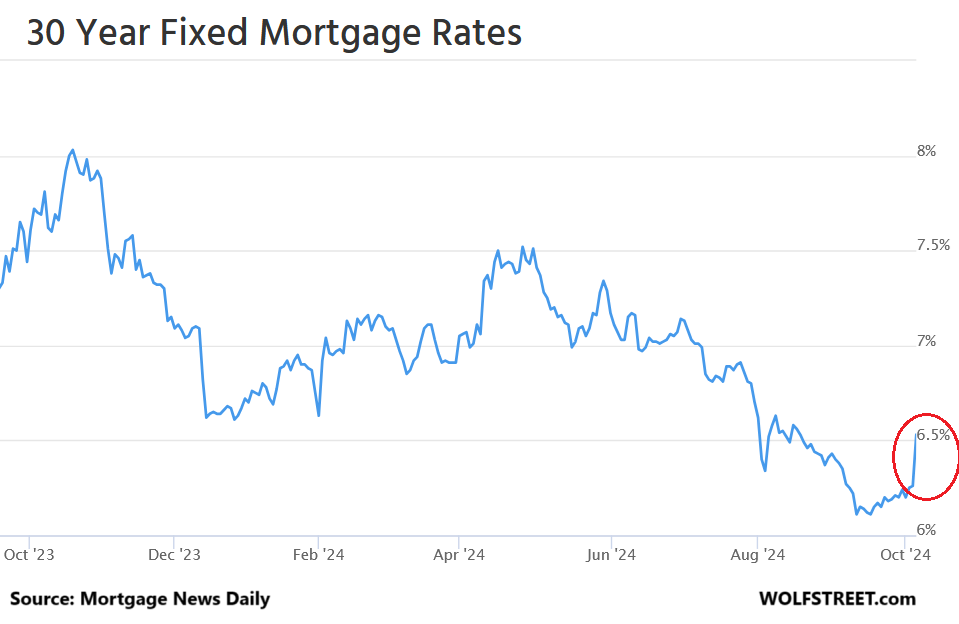
Mortgage rates roughly parallel the 10-year yield but at a higher level. The spread between the average 30-year mortgage rate and the 10-year yield has been around 2.5 percentage points all year, which is higher than average over the past four decades, in a range that went from near 0 percentage points to over 4 percentage points.
With the 10-year yield 3.98% on Friday, and the average 30-year fixed mortgage rate at 6.53%, the spread between the two measures was 2.55 percentage points.
The spread could remain in this wider range because the Fed no longer supports the mortgage market, as it had done during QE. As part of QT, it is letting its holdings of MBS run off at the pace of the passthrough principal payments, and it’s letting its holdings of Treasury securities run off at a pace of $25 billion a month. In September, the Fed’s total assets fell by $66 billion, to $7.05 trillion.
The Fed said it would let the MBS run entirely off its balance sheet even after QT ends, which would take years, and market participants will have to be enticed to take the Fed’s place, and this could mean that the spread will average wider than during the era of QE.
Despite the drama on the long end, not much happened at the short end.
Short-term yields are pricing in the expected rate cuts during their term. A security with 3-months left to run will trade on expectations of rates largely over the next two months. The closer the security gets toward its maturity date, the less policy rates matter because on maturity date, the holder will get paid face value plus interest. And that’s the value of the security on that day, no matter what policy rates are.
The 3-month yield rose by 5 basis points on Friday, to 4.73%. But it has vacillated in this range for about two weeks. It has fully priced in one 25-basis-point cut, plus portions of a second 25-basis point cut. The yield is down 22 basis points from September 17.
Enjoy reading WOLF STREET and want to support it? You can donate. I appreciate it immensely. Click on the mug to find out how:

![]()
Excellent analysis. Some of us skeptics are doubtful that the Fed will ever completely exit the MBS market. Either way, the continued massive deficit spending, combined with the huge overall debt load, presage a flood of Treasury issuances, which may give the market some serious indigestion. That, combined with inflation perhaps rearing its ugly head again (and without ever really getting back to the sacred 2% “target” that has been arbitrarily set as “good” inflation), could lead to higher interest rates. And if the Fed then reverts to QE, it is hard to fathom how inflation would not “revert” back to higher levels. Thanks again for a great article. Note to readers: Please donate to Wolf Richter. This guy puts out more quality content than many macro analysts who sit behind a pay wall, and force you to pay for the privilege of reading their content. As I have said many times, Wolf should charge us, but he is too unselfish and wants to help out as many people as possible with his educational insights.
I agree with your sentiments, Wolf is a master class in macro. I used to read the Fed Reserve Board newsletter (https://www.federalreserve.gov) before the so called analysts. The batting order has been restructured with
Wolf in the Leadoff spot, the Fed batting second and the others (Bloomberg, Dalio, etc) an occasional look-see.
I have grown very fond of Mr Wolf I wish I could keep him in my pocket like Siri and ask him questions about the market. Like when I am in the checkout line… Why are the oranges more expensive Wolfiri? :]
NVDA to 150!!!!!
Don’t forget learning from comments. This might help you start to save on drugs…….you’ll never get to read it though…..
After some thousands of years of experience we think that we have learned how to teach what is KNOWN. But now with the undeniable upsurge of scientific research, and ESPECIALLY relatively recent corporate or other “business” money to be made from our “discoveries”, we cannot continue to rely on the mere fact that we have learned how to teach what is “known”.
We must learn to teach the best ATTITUDE towards learning what is not known, and ALSO that which is “known” but is INCORRECT, and sometimes almost insanely and damagingly so. This may take centuries to acquire but we cannot escape this new challenge, nor SHOULD we want to.
“The unexamined life (and I would include the world around him) is not worth living for man” -Socrates
(I think….or some old Greek, who refused to invoke “magical” stuff like gods….the insane asylums are full of “prophets”….I believe Jesus is the favorite in Western asylums. Quite a problem for the docs when the guy says “How do you know I’m not?”
Nbay,
Are you drunk?
I mean, no shame in that.
Stand at ease, commenter.
The Longer View — good comments and thanks for reminding people to donate/contribute to Wolf’s excellent work…
Wolf — forgive me if this question is misunderstanding some of the dynamics of this changing yield environment….
Could some of these yield changes be attributed to the so-called “Bond Vigilantes”?
Or is this more “traditional” financial market forces at work?
Thanks for taking the time/effort to review these yield shifts!
Thanks, both of you.
“Could some of these yield changes be attributed to the so-called “Bond Vigilantes”?”
During the early phases of QE starting in late 2008, the already beaten-up and decimated bond vigilantes were taken out the back and summarily shot. There are none left.
It took two decades to give rise to them in the 1970s and 1980s, when big bond investors were mauled year after year by rising inflation, and ever higher interest rates that left them holding the bag year after year on their previously purchased bonds. And they were furious because inflation wasn’t brought under control. And then in the mid-1980s, after inflation had started to fall, government deficits shot through the roof, and big bond investors had had it. They didn’t want to buy Treasury securities and had to be enticed with much higher yields, in relationship to inflation, to buy them, because they’d gotten beaten up so badly for so long by inflation and rising yields, and now there was this scary ballooning US debt – all this new supply coming on the market – and they were tired of losing money, and they didn’t trust that the deficit issues would ever be resolved, and they saw big risks in that for which they wanted to be compensated. And so Treasury yields remained stubbornly high in relation to inflation into the 1990s. It wasn’t until Congress and the Clinton White House succeeded in visibly bringing the deficit down that longer-term Treasury yields dropped in relationship to inflation. The term “bond vigilantes” was coined in the early 1990s to describe big institutional bond investors who’d gotten tired of getting beaten up, and they demanded higher yields in return for their pains and for the risks posed by the through-the-roof deficits before the early 1990s.
The “Bond Vigilantes” have been hiding in Argentina.
Will they return? “Who knows what evil lurks in the herts of men?”
Thanks Wolf for the additional background/perspective!
Circa mid-80’s…
“they didn’t trust that the deficit issues would ever be resolved”
Flash forward 40 years and many (many) trillions in additional accumulated Federal debt…
Ahem.
When the history of American ruin is written, those looking back will be aghast and agog at American leadership’s utter (utter) inability to come to grips with the relentless increase in trade and fiscal deficits/debt – for over 50 *years*.
Apparently, without catastrophe, it is almost impossible to get American leadership to ever deviate from its pre-determined agendas – and, even with catastrophes…it is 50/50 that American leadership will do something that makes the situation worse.
There is a lot of ruin in a country…but not an infinite amount.
Wow. Did not know this story. Thank you Wolf. And yes, thank you for the nudge Longer View. Open your wallets and donate to Wolf Street!
I have refused to buy long bonds for years. Does that make me a “bond vigilante”? Is there a costume I should be wearing? Or just a mask?
It’s just everyone outside the US dumping their dollars. Some of’em are even waking up to the silver story, and that is saying something.
No “bond vigilantes” required.
🤣
https://wolfstreet.com/2024/09/24/who-holds-all-these-us-treasury-securities-update-on-the-investors-in-the-recklessly-ballooning-us-national-debt-in-q2/
https://wolfstreet.com/2024/09/28/status-of-the-us-dollar-as-global-reserve-currency-share-drops-to-lowest-since-1995-as-central-banks-diversify-to-nontraditional-currencies-and-gold/
Interest rates records have been kept for 2000 years typically between 6 1/2 and 7 1/2% for the last 2000 years. We just had a whole generation of people growing up with 0% interest because the government was over spending. !
It’s really hard to accurately reconstruct historical interest rates, but most of the ones I’m seeing show an average of ~3-4 for the last 300-500 years. Most of them also show something substantially higher before that, but how relevant (or accurate) is an interest rate from before we invented modern industry?
There’s also some uncertainty about what the long term trend in interest rates is, I e. is there some fundamental reason why they should change as society changes and how? It kind of looks like they’re dropping, and it’s easy to construct a plausible story as to why: interest rates are your reward for possessing money which is scarce and temporarily giving up on using it. As savings rates increase, money isn’t that scarce anymore. As we are all much richer now, people can get their money from lots of places now and thus don’t have to pay as much interest for it.
“As savings rates increase, money isn’t that scarce anymore. As we are all much richer now, people can get their money from lots of places now and thus don’t have to pay as much interest for it.”
That’s more or less the Fed’s story (vis a vis Chinese capital being recycled into US Treasuries and everywhere else).
But if that were really true, there wouldn’t be periodic catastrophes where corp bond/Treasury buyers utterly evaporate – skyrocketing rates (to find *any* buyers) and the Fed feels the absolute need to step in with trillions in incrementally unbacked fiat in order to drive interest rates back down to “normal”/targeted/artificial levels.
At bottom, fiat inflation is created to avoid higher interest rates/American default. (Fed prints money to buy unwanted Treasuries, driving rates down).
*And* the “capital surplus” explanation for ZIRP *especially* doesn’t explain why those incremental trillions in Fed rescue “money” remain on the Fed books for years and years and years (if they ever entirely come off…which they won’t).
If there was really so much “new era capital” sloshing around (indifferent to awful American financial fundamentals), the Fed would have been able to sell its “emergency” holdings back into the mkt much, much faster without spiking interest rates.
The very fact that the Fed has not been able to do this refutes the “new capital era” narrative.
Don’t lend money at interest- God
But it’s only 5%! -People
Nothing new here.
Unless Fed starts selling MBS (and they said they won’t), it will take it around 15 years for Fed to exit the MBS market. It is extremely likely that they start buying new ones. So, it is very unlikely for Fed to exit the MBS market.
Fed’s MBS holdings is not the only problem. Govt should stop interfering housing market for a healthy economy. Existence of govt control in fannie and freddie is also a big problem I think. There should not be treasury backing in the housing market.
Ponzi
” it will take it around 15 years for Fed to exit the MBS market. ”
Get a calculator?
1. Even at the current low run-off, it will take 10 years, not 15 years.
2. The runoffs speeds up when refis and home sales increase. Mortgage applications for refis have already tripled from the lower point in recent weeks, almost exclusively for cash-out refis (to fund home renovations, etc.). But since these are applications, it will take a while before the existing mortgages are actually paid off and the principal payments are forwarded to the Fed. This already has accelerated the MBS runoff.
3. MBS are called when the mortgage pool gets too small, and holders of MBS get face value for the remaining balance. There is nearly no chance a 30-year MBS will be out there for 30 years. When MBS are called, they come off the balance sheet in their entirety all at once.
“It is extremely likely that they start buying new ones.”
You forgot the UN. And then you based your entire propaganda on a typo, LOL
It is not clear how the Fed merely holding MBS that they bought years ago affects the housing market today.
It DID affect the housing market when they bought them because at the time their buying helped pushing down mortgage rates because the yields of MBS feed into mortgage rates on a day to day basis. That’s how the mortgage rate market pricing mechanism works. Buying MBS caused the spread between MBS and 10-year yields to narrow substantially, which pushed down mortgage rates.
Now we have the opposite, QT, and the spread has widened, and mortgage rates are much higher.
“It is not clear how the Fed merely holding MBS that they bought years ago affects the housing market today.”
Well, if the Fed tried to sell MBS back into the mkt at a faster rate, they would have to find more buyers than currently exist at current rates.
There is a 95% probability that would require higher discounts on the MBS paper the Fed was trying to sell…meaning higher interest rates for *everything* (as money was drawn from everything else to the new Fed MBS sales).
Those higher rates would include the primary mortgage mkt interest rates.
So the Fed selling the MBS would affect the housing market just as buying them affected it years ago. But doing nothing but collect payments should have no presenr effect in the housing market.
kramartini
No. Not replacing maturing bonds, and replacing pass-through principal payments of MBS is like selling stocks: your portfolio shrinks! Same effect. That’s the fundamental difference between credits and equities.
MBS come off the balance sheet via the pass-through principal payments. An MBS fund that wants to just maintain a fixed balance of MBS has to constantly BUY new MBS to replace the pass-through principal payments = doing nothing = neutral, to just maintain the balance.
When that fund decides to liquidate by not replacing the MBS that come off, others will have to buy the MBS that the fund would have bought to just keep the balance flat and remain neutral. And for these others to be enticed to buy what the fund would have bought to stay neutral, they will have to be incentivized with higher yields, hence wider spreads and higher mortgage rates.
Agree with both your points TLV:
But especially w the support for WR!
I have been a big fan of the 10% ”finder’s fee” model of rewarding those who have been very helpful, and WR CERTAINLY is at or near TOP of that category!
“And if the Fed then reverts to QE, it is hard to fathom how inflation would not “revert” back to higher levels.”
My guess is if the Fed dips back into the QE well, the economy is in dire need of growth, so inflationary pressures would be low.
“My guess is if the Fed dips back into the QE well, the economy is in dire need of growth”
That, or there’s a severe liquidity shortage in the banking system.
Still an unlikely outcome imo, but hypothetically, a broad recession isn’t the only problem that QE could fix.
agree with ALL you said
Looks like inventory of existing homes have increased across the board because perception from sellers is that rate cuts will translate to lower mortgage rates. Now that this didn’t happen and if the higher 30 yrs fixed can continue to hold, wonder if we will go back to the mexican standoff from sellers again. Pulling listing off because they don’t want to slash price and once again wait for some other BS narrative (maybe another rate cut hopes) to relist later to get as much without lowering price even more..
Either way, think this upcoming spring season will be interesting…hopefully delusional sellers won’t get what they dream for and have to face the reality instead..
Or maybe we’ll see some seller-motivation? Sell NOW or you’ll miss out forever? Seller-FOMO
NAR on Monday: “Jump in mortgage rates sees buyers stampede into the housing market before it’s too late devastating the remaining low inventory!”
Just think of all the houses that closed a sale over this weekend.
Geez, can NAR or most RE agents be more creative to come up with something more interesting than never ending FOMO narratives? Rates, going up, buy now before it gets worse. Before that, rates are high but buy now so you can just re-finance when rates come down…..Planet killer asteroid heading to earth….buy now and enjoy your house before we all get wipe out….
That sounds like some illogical propaganda nar would say. They want to deceive people into thinking higher mortgage rates are bad for ordinary people buying a house but they aren’t bad, they’re good because they would cut down on a lot of the cheap-debt fueled speculation and hoarding of housing. It’s nars lobbying of politicians, and the politicians selling out to them and appointing fed govs to make the mortgage market totally unfree and manipulated by “buying” (with printed money) mortgage backed securities, pushing down rates, that has devastated the inventory. The US govt should not waver in contining to decrease its’ holdings of mortgage backed securities, which is still over two thousand billion dollars worth, all the way to zero, to restore housing market freedom and fairness for all.
I wouldn’t single out just the NAR. Coke is bad for you, yet they sell it to make you happy. Heinz ketchup has about 40% sugar. Are they up-front about that?
The NAR is not in the business of selling honest; it’s in the business of making money for their members.
That FOMO prodding is what recessions are for; the rich buy low and sell high, the rest do the opposite.
Definitely happening in central El Lay
Sell now or be priced in forever!
I agree. Inflation hasn’t been tamed.
The last thing we need is for 30Y mortgages to move below 6% with a fairly stable employment picture.
The question is what does the Fed do at the next two meetings, if employment stays buoyant as well as core inflation?
If they felt like a cut was necessary, the data supported a 25 BP cut and not 50. That was the same mistake same type of mistake they made 2 years ago. They thought they had more time to wait but didn’t. Now, it’s reversed. They have more time to wait but are moving too quickly.
This is why I think they’ve taken they eye off inflation and are peaking over at interest expense.
I disagree. the fed can cut ultrashort rates significantly over the next year and the yield curve will remain inverted. they can and will cut rates further until we get a normalized yield curve. as long as rates don’t explode higher on the long end, this is ok.
as a side note, fed funds rates don’t impact long term inflationary pressures. so don’t worry about that issue.
“as long as rates don’t explode higher on the long end, this is ok.”
But long rates *are* going higher as a result of short rates being cut. It’s not bond vigilantism as Wolf mentioned above, but it’s the market simply requiring higher inflation compensation.
Is it too far out to suggest that bond investors will eventually want 5-6% yield for 10 years of USG debt??
Responding to ShortTLT:
Well first of all, in the long run, I imagine long term rates are going higher and so we agree upon this. BUT, in the short run I’d argue that the confluence of recession risks, and market flows into bonds as a “derisking” strategy for equity players is/was occurring leading into the Fed decision. Now that the Fed has made its decision, and indicated an easing cycle you have new forces emerging which will drive yield curve. Namely market supply/demand for the middle and long end of the curve vs. Fed easing on the short/ultra short end.
It is simply my *opinion* that there will be a bid under the 10 and 30 yr bonds until at least year end. If the economic news remains stable, and no major revisions to employment and inflation data, then I suspect rates be steady or will rise only slightly. If we get major revisions, which I expect, I think you will see the most recent lows on the 10yr yield break even lower. But I have to agree with your assessment that in the longer term, 6+% yields on a 10yr are likely. This will happen, not because the Fed cuts or raises short term rates, but because of the massive supply (glut) of treasury issuance in the next few years.
Lastly, the Fed is not monetizing debt at the moment, so it isn’t actually easing monetary conditions significantly, even by cutting the FFR, particularly because the rates are currently inverted. It would be a different situation, if the 10yr was 6% right now, and the Fed was cutting FFR to 5%, because that would ease financial conditions significantly. We aren’t in a vacuum here, not all rate cuts are the same over the last few decades. a 50basis cut, when the curve is inverted, does not significantly increase speculative lending/leveraging because it is already cheaper to borrow money longer term then it is to borrow it short term. The speculation that occurred from ultra low rates happened in a normalized yield curve for the last decade. There is a difference, hope this makes sense!
Central Bankster,
“It is simply my *opinion* that there will be a bid under the 10 and 30 yr bonds until at least year end.”
I don’t disagree that flght to safety has been the hiatorical rationale for this. But consider the following:
The 2-year treasury started last week at 3.6% (it’s higher now at 3.9 ish). Fed rates are 4.75-5.
Even if we get another 100 to 125bps of rate cuts over the next couple years, the entire cutting cycle has already been priced in!
Where’s the bid for 2-year & longer durations going to come from if bond traders have already positioned themselves for these cuts?
Now cosider that the average 2-10yr spread is around 100bps. If the 2-year settles at say 3.75, that means the 10-year should be around 4.75%.
Again – where is the bid going to come from?? Bond bulls have already bought these bonds on the premise of these predicted rate cuts that may or may not happen.
P.s. the Fed is still doing QT.
@Central Banker,
“in the short run I’d argue that the confluence of recession risks…”
Let’s face it. These are Schrodinger’s recession risks, and they are still inside the box. Yes, the leading manufacturing indicators indicate trouble ahead. But as we have learned, negative data can change on a dime. Take wages and savings, for instance. Apparently, after recent revisions get factored in, wage growth will have been 6% recently, and furthermore the savings revisions indicate that bank accounts are flush. Retail spending is still on fire. Corporate profits (after taxes!) are still on fire. Is recession there, or not there? Well, it has been two years, and these recession threats are long in the tooth now, so I tend to believe it’s about time they take hold. On the other hand, the premature 50 bps cut has let animal spirits out of Pandora’s box, so who knows?
“the leading manufacturing indicators indicate trouble ahead.”
Manufacturing is only a small part of the economy. How many manufactured GOODS are people going to buy before the house is full to the rafters with stuff?
And when people buy a house, they’re mostly buying “construction” — a separate category, and not part of manufacturing, and it is booming — and services related to building the house.
Phoenix_Ikki … your analysis is incorrect. Sellers with a low mortgage rate are willing to sell, but only for a high price because the next home they buy will have a higher rate. There are plenty of jobs, especially in SoCal, which has tons of high paying defense jobs, so there no reason to give a home away. Inflation is not going away, especially if there is a middle east war. Historically, home prices have always risen during inflationary periods, and they are still rising, albeit slowly. This is fundamental.
Yes. Home prices do rise during inflationary times. LOL It is usually because of government printing and increasing its debt and thus the currency is devaluing.
We are on pace to increase government debt at a rate greater than 10% from 2020 to 2030. The last time the government debt was increasing over 10% was in the 1970 to 1980.
Interesting how we are seeing the faster rate of housing appreciation since….the 1970s.
Or, sellers set their price, and wait for a sucker to buy. Prices to the moon.
The potion is almost complete, eye of toad is all that remains.
Wandering in from the street and seeing what’s contained in this headline, “the fear, the exploding, the spiking and the monster, the message is clear that the potion will be needed soon.
I’ve said this before, and I’ve tried hard since then…but I. Never. Have any idea what the hell you’re talking about.
Regardless of the Fed’s actions, this economy is due for a recession. Perhaps not overdue, but due. The Democrats hope it doesn’t start before the November election, the Republicans would like to see a rapid drop in the indicators for all to see. Pure guess: a recession by mid-’25, sometime in summer when the businessmen can enjoy the slack at work by going outdoors.
Clearly, the Fed is scared witless of a recession. Otherwise, they wouldn’t be doing all this crazy stuff, in cahoots with the Treasury. Perhaps this is why Yellen said she expected “no new financial crisis in our lifetimes” back in 2017. Maybe the Fed did some classified research back then and found that the whole house of cards would completely collapse if there were ever another recession, no matter how shallow. Maybe that 2017 statement was her way of saying another recession would not be *allowed* going forward. It certainly seems like the Fed is trying to engineer that, because a 50 bps Fed fund rate cut under current conditions was just bonkers, otherwise.
And to clarify my comment about Yellen’s 2017 statement, one has to admit that when an FOMC chair’s job is to make it vague what the FOMC will do next week, it was outright bizarre for someone in that position to project such an absurd claim over a *lifetime*, unless they plan to have a hand it actively stopping it from happening. The FOMC’s job is to manage risk and respond to risk, not to prescribe risk. Yet that seems to be exactly what that bizarre statement implies, especially when coming from an *FOMC chair* whose number one job is to retain credibility! Something is rotten in Denmark, or at least smells fishy.
Yellen…rotten fish?
A recession is like a river that overflows its banks every 10 or 20 years after a a series of storms. Yellen is of the mind that the feds new Levees, dams and other containment efforts will stop the flooding. But now as the pressure builds and the water tops the dams and levees…
But it could worse with no water in the lakes and streams, just the smell of rotten fish.
Financial analogies to events in nature are total bs.
Can’t argue with that.
Ok, I’ll leave out the weird stuff.
A recession is needed every 10 or 20 years for a healthy economy.
HowNow? …..Brown cow
“The FOMC’s job is to manage risk and respond to risk, not to prescribe risk…”
Since the GFC, the trend of the Fed (and bankimg regulation in general) has been the xfer of risk from commercial banks to the Fed. Examples abound:
-The PCF (discount window) and SRF
-Requiring repos to be centrally cleared next year
-All the other regulatory changes brought about by Dodd-Frank and Basel III (SLR, G-SIB surcharges, etc.)
There’s a reason unsecured (fed funds) dollar markets are a ghost town. Regulators are pushing towards a secure standard where loans and repos are collateralized – another transfer of risk from the private to the sovereign sphere.
I wonder if this is what Yellen’s (admittedly bold) statement referred to.
HowNow-
“Financial analogies to events in nature are total bs.”
Try John McPhee’s 1989 book “Control of Nature” — as it applies to the Fed’s central control of the economy — as an antidote to your disdain for analogies of this sort.
Bright as they might be, the Army Corp of Engineers can’t sustainably control North America’s largest river. His other vignette’s in the book are equally knotty and consequential (and equally well written!)
All Fed members are required to take an anti-recession vaccine before serving. :)
“when an FOMC chair’s job is to make it vague what the FOMC will do next week”
But that’s the rub: Mr. market didn’t like the smoky back room and the unknown.
The new way is to project, but deliver with sleight of hand!
I still believe they shouldn’t have chickened out on the “final” projected 25bps hike, just as a messaging tool.
Instead they jawbone financial conditions loose, to keep the boat upright (with the blazing fire of fiscal policy raging in the engine room l) and deliver a big-ish cut in the “good times.”
Adulting sucks and even our leadership has given up on the “tough choices.” It’s just go-along with the man behind the curtain!
I don’t think we’re necessarily due for a recession. We’ve been in a “rolling recession” since Covid wherein weak companies have been slowly getting culled. First Covid culled weak retail, hospitality, and offices like BBBY and WeWork. Then rising interest rates have been culling weak tech, finance, and durables like SVB, EV companies, and realtors. All while the government is pumping money into infrastructure so there’s plenty of job creation in government and construction.
So, while we haven’t had a traditional recession, I think enough industries have gotten hit by trying times to have galvanized them and reset the clock on the normal business cycle.
My institution didn’t react to any of it. Saving account still at 5% APY. Expected that to come down pretty quickly with rate cut but a nice rate all while being completely liquid.
Congrats on still getting 5% on a liquid savings account – that’s a great rate. I’m still getting 5.1% on SGOV, which I can liquidate in $100 increments.
My Cap One savings still pays $4.1% (was $4.25% last month), and my stupid credit union recently lowered their savings rate from 2.6% to zero%. I’m in the process of moving $$ out of the latter.
$&@“! CapiralOne sucks my balls. I’ve been so lazy and hate myself, but didn’t know they dropped from 4.25.
Yeah baby, it’s analogous to the Carter Reagan election. Bring on Volcker, get those interest rates to double digits.
I think the Fed has never intended to hit the 2% target. They needed the perception of disinflation getting close enough to lower rates to deal with interest payments on debt. All those three month treasuries will be replaced with lower interest short term bonds. Furthermore, they want inflation to eat away at the rising US debt because tax increases are a non-starter. Inflation is here to stay until our drunken sailors are willing to make sacrifices.
But if the Treasury is shifting back towards coupon issuance, they’ll be paying higher rates on that debt.
Another slightly conspiratorial take is that the Fed needed to cut because other central banks have: they don’t want the dollar to get too strong vs other western currencies.
The fed has already silently raised the target with the “average inflation targeting” lie. Powell as much as admitted it in a press conference.
When the Fed makes a policy decision — any policy decision — and the net result is a 1/3 percent jump in the 10yr yield over a two week period (!!), and a similar jump in the 30yr yield (!!!), then they have done something wrong. Really wrong. They need to go back and revisit their thinking.
As a side note, longer rates remain high(er) won’t it keep Private Equity from devouring everything.??
The trouble private equity has now isn’t the “devouring” part (they still have plenty of cash) — it’s the “defecating” part: they have trouble exiting the investments they’d made years ago, and whose valuations they have driven into the stratosphere, and there are few buyers willing to pay those prices, and the IPO market has gotten beaten up. So PE is sort of stuck with investments they’d wanted to sell by now, and they’re having trouble sending the long expected cash payouts to their limited partners (such as pension funds). This has been going on for two years, and it’s clogging up their digestive system. Some have exited their investments by letting them drop into bankruptcy. Most are still holding on. Some have leveraged their investments even further to raise cash to send to their limited partners. This industry needs a massive clean-up, and some more years of higher interest rates might finally force it.
Amen to that. PE has really hurt Hospital systems on a national scale by routinely purchasing hospitals at 300% of value in sale in leaseback transactions. In exchange, a few fat cats make a mint, Hospitals are saddled with massive debt and eventually fail.
Yes. PE should never ever be in healthcare. That’s a match made in hell.
At least they are maximizing utilization rates for the “machine that goes BING”!
Perhaps PE isn’t creating as much “value” as they would have us think…
If I remember correctly, wasn’t it Trump who was pushing and pushing for G’ment workers to be able to “invest” their 401k/TSP funds in PE? I think they now can, although they at least have to make some active decisions to do so (someone thankfully demanded some rails).
great analysis. I’m curious how/when this starts to impact construction spending. I cant imagine much new office, retail, or multifamily construction if the 10yr doesn’t keep falling. if it stabilizes around 4%, it could be tough on residential as well. ironically, without a recession, and falling 10yr rates, how do we avoid layoffs in this sector? there is a significant lag time from securing funding and launching a new development.
The interest the United States pays is already more than a defense budget. There’s never been a dynasty that could afford to do that. They will cut rates and come up an excuse to start QE..likely before the election.
The interest rate the US pays on its $35+ trillion in federal debt has very little to do with the Federal Reserve and is determined in the enormous free markets for US Treasuries which are determining that the present interest rates are insufficiently low.
I think long term rates will be higher when companies/ the world realize rate cuts will be done sooner than expected and rush to lock in longer term debt, we are better of with a few years of stagflation to help reduce the debt burden, prepare for it
Slightly related to yields rising, after the Monster Cut, is the bothersome issue of hotel strikes spreading, like Covid.
The dock strike was quick to resolve, but like, how many people are striking for higher wages, versus the amount of people with Monster wage gains in the bank?
This super smooth soft landing, with more Monster rate cuts, is without a doubt inflationary and with Treasury issuance flooding the market, it’s pretty hard not to imagine rates pushing higher.
The Feds super-thin credibility has morphed into clown-like banana republic status, as we watch them stumble into hesitation mode, caught like dazed deers in the headlamps of inflation — minutes after taking a victory lap, patting themselves on the back for a soft landing crash on a runway foamed with unreliable data.
In this post pandemic of bifurcated polarized weirdness, it seems possible that Treasury issue tons of short term issuance, will somehow end up being a duration mismatch that will backfire — oops, the bond mkt is confused again — as the deficit explodes like a helium bomb.
This all gets back to core services inflation heading the opposite direction of the Fed maestros — so that tension between wages rocketing higher and cutting rates a few hundred bps is entertaining — like watching clowns turn on fire alarms in a casino that nay or nay not be on fire.
This stupidity is exactly what we need before the election circus — maybe more Fed jawboning will help, or a sneaky surprise leak to Nick Timiraos, the Fed geisha girl, get another star in this kabuki presentation …. This is exasperating!
“it seems possible that Treasury issue tons of short term issuance, will somehow end up being a duration mismatch that will backfire ”
Since February, the amount of T-bills outstanding has actually dipped a little, to $6.00 trillion on Sep 30, from $6.01 trillion on February 29. The big boost was from June 2023 through February 2024. See chart below.
So every T-bill sold at auction since February was to replace a maturing T-bill and essentially no new T-bills have been added.
T-bills as percentage of total marketable securities peaked in March at 22.5%. In September it was 21.7%.
All the new debt that was added since February was longer-term notes & bonds.
Frankly I am amazed they still have as much credibility as they do.
Is it too soon to tell if the spiked mortgage rates are translating into actual closed mortgages?
Your comment, Wolf, “Mortgage rates roughly parallel the 10-year yield but at a higher level. The spread between the average 30-year mortgage rate and the 10-year yield has been around 2.5 percentage points all year, which is higher than average over the past four decades, in a range that went from near 0 percentage points to over 4 percentage points.” Might that be due to the fact that “points’, charged by mortgage brokers, are no longer separated but are embedded in the mortgage rate a buyer ends up with?
I think your 30-year “From September 17 (blue) to October 4 (red)” should be around 31 bp (instead of the 11 bp listed in your article). Great article as usual! Thanks!
I’d like to see the Fed *raise* rates by 50 basis points next meeting and turn September 18 into a headfake. They’ve become all too predictable.
Predictability isn’t such a bad thing for long term planing.
I predict I’m going to croak soon…. being a toad and all…
This country…is anyone actually in charge of this mess, just crazy. The “sweet land of liberty”…..sounds nice, but it think the sweetness is gone.
Toad, I am glad nobody is in charge of this “mess”. Let the markets sort it out. The best economies and countries are kind of a “mess”. Centrally planned economies have been complete failures. I am very glad to see the bond market snub its nose at Chairman Powell.
The fed only makes drastic moves when they’re bailing out the markets sorry.
Wolf, love the way you showed the yield-curve steepening with the multi-colored curves.
I have some callable 10-year 5.75% FHLB paper – not only have they not been called, but they barely trade above par!
How much time left on them?
I bought them earlier this year as a new issue.
I also had some 10y 5.98% Fed Farm Credit bonds bought around the same time, but those were called last month. Big sad.
Long term rates have been in freefall mode in Canada except for Wednesday, Thursday and Friday this week. With two big 50 basis point cuts slated for October and December this year in Canada someone has to short the Canadian dollar as it looks grossly overvalued.
With rates drifting higher, it’s a little strange volatility measures are subdued. The Vix had already been somewhat elevated after the carry trade drama recently, but Move Index, Skew and other barometers seem to be ignoring the waves hitting the boat.
In a way that’s good and part of the resilience associated with passengers that are wearing rose colored glasses — but many passengers are still wearing eclipse glasses, anticipating the worst.
Maybe The Goldilocks touchdown provides happiness for everyone, in every way, with higher asset values and higher yields, and a higher deficit and higher mortgage rates and higher home prices — lower unemployment with higher wages — an increase in inflation at a slower pace, lower Fed Rate ignored by bond market — and, and of course global rolling recessions offset by bursts of growth which flame out as fast they flare up — while the casino rakes in the dough on volatile speculation that leaves most participants highly confused.
Meanwhile, money markets and short term bills will chip away keeping slightly ahead of the inflation rate while stocks bounce around like kangaroos dodging cars in an interstate.
If my spell checker takes over any wording, I apologize
“With rates drifting higher, it’s a little strange volatility measures are subdued.”
It’s only strange because you’re looking at the wrong volatility index. You’re looking at the VIX which is used as a measure of stock market volatility, not bond market volatility. And it’s low.
But the bond market dances to a different drummer. There is a bond-market volatility measure, the MOVE Index (it measures interest rate volatility), and it has been relatively high since the rate hikes started in 2022 and it spiked in March 2023, and then meandered lower, but was still relatively high. Over the past year, it has been in the same range. Friday’s data will come out on Monday, and I assume it veered higher. It has been rising since Sep 26, from 90.14 to 100.15 on Thursday.
In 2018 and 2019, it was in the 45 to 65 range except during the months when the repo market blew out, when at the peak it spiked to 90. So on Thursday, we were already above that, at 100. As for Friday, the big day, we’ll see on Monday.
So your entire theory is based on the wrong thing.
To amend and extend my campfire theory, I think volatility in general, ahead of the election has been subdued — which is a good thing for economic stability — but maybe that’s the elephant in the room?
As I watch my money market, rates have definitely been falling for about half-a-year +\- — which wasn’t unexpected at all, but the recent plunge in yields around the Monster Cut, were more unexpected — which is where I assumed volatility would jump more. Obviously subjective.
Nonetheless, the main reaction to rate cuts, has been this u-turn in yields heading back up, with renewed concerns about inflation.
The Monster Cut & u-turn has caused rethinking which has been greatly amplified by Fridays unemployment GDP u-turn.
Scanning Google for reactions is like looking for ghosts — there’s a heavy silence, because, there weren’t many bingo cards that had a Monster Cut + a Monster GDP report — it seems like that shock hasn’t registered yet, except for the slight uptick in treasury rates.
That’s that — now part two of the campfire chat that will probably go up in smoke.
As I recall, the mini-crash in early August had a lot of people confused as to what triggered a massive spike in volatility down then up. The actual narrative as to what structurally happened is still debated, but perhaps a cross between carry trade and unemployment revision, but a substantial shock that acted as a wake up call.
As-if a switch was flipped, market crash, market correction. In terms of the Move Index or any volatility instruments, that was a shock that was unexpected — unanticipated.
With that background, we return to the Monster Cut/GDP shock Friday that had a muted reaction…
Tinfoil conspiracy hat theory 1:
What if, the decades-old Plunge Protection Team was tasked to do initiate a volatility test in August — as a way to gauge market risk associated with potential election shocks?
I know, totally absurd and unlikely to have any basis in reality — almost guaranteed to get me kicked me out of the campfire chats — but, I’d say, my main objective is to be skeptical and think in terms of risk management — what ifs, even if wild.
Why would something like that matter — because the economy can’t afford a substantial shock. The main thing that spikes a Move Index, Vix or volatility barometer is substantial shock.
Hence, I feel these recent shocks are subdued and suppressed to ensure stability.
Nostradamus at the campfire punch bowl (un-aided by ai)
“because the economy can’t afford a substantial shock”
This economy is in far better position than in the years before the pandemic to handle a substantial shock. This is not a fragile economy.
The inflation shock was a major shock, and it shook the economy by its roots, but it held up, and then took off again. I was amazed.
There’s whole cadres of wrong thinking out there, becoming more greatly distorted by time and manipulation.
Whether it’s asset valuations or “ridiculously high” interest rates, “record wage growth” (over the past 3-5 years, after being extremely low for the 40 year period before) or volatility measures.
Looking at the monthly charts for almost anything, over a 3-5 decade period is mind boggling. The MOVE is low at 100, the VIX is high at 20. Wheat prices are “way down” compared to Putin’s war premium and higher than the previous record highs.
Using ratios (to CPI for example, or GOLD:SPX etc) is a way to get perspective. One of the most important ratios is debt:GDP, OR (from my WS education) tax receipts: Debt payments?
I am trying to learn, while largely being increasingly confused.
“lower Fed Rate ignored by bond market”
On the contrary – the 2-year at 3.9% shows the next 100bps of cuts are already priced in.
The inflation premium in long-term rates will remain high not just to compensate for future inflation, but as inflation has inflated existing assets, the volume of savings required to fund the turnover of present assets is ever larger.
It’s also about bond market psychology.
Jim Bianco recently cited 1981-84 as an example. The 10-year went from….
Sept 1981 thru April 1983: 15.86% to 10.3%.
April 1983 thru May 1984: 10.3% to 13.9%
What happened? The bond market lost confidence in the Fed’s inflation fight, despite the fact that inflation peaked in 1980 and was already on it’s way down.
I purchased a home last year in Spokane Valley for $465,000 (under asking price of $500,000). I put $30,000 down. Took out a loan for $435,000 with an interest rate of 7.25%. Monthly mortgage is about $3,400.
A few weeks ago I was thinking of refinancing the house. Rates were about 5.99%. My loan officer told me he could probably get my monthly mortgage payment down by ~$600 per month. He also thought we should wait a bit more and let the rates fall.
After the FED made their own rate cuts, mortgage rates didn’t drop as some predicted; instead, they went up. I think we’re somewhere in the 6.5% range now.
Sorry for the long message but here’s my main question: do you suspect mortgage rates will drop to say 5.25% in the coming months, or do you think now is a better time to refinance?
Well since you’ve lost your 5.99 rates, it’s risen to 6.5 range now, and also your 600 dollar savings has been shot.
So what’s the point of doing anything right now.
It’s good to have options and time to decide them.
But to your question of 5.25 rates….Hope so Mo.
Unfortunately for your situation, I don’t see mortgage rates continuing to drop. They’re typically based on the 10-year treasury, not shorter rates. I’ve mentioned in a previous comment that I expect the 10-year to go up another full % or so.
Hopefully you can continue to afford those $3400 monthly payments, and watch out for your property tax bill & homeowners ins going up as well.
NB: not investment advice.
I’d think 5.25% would be a bottom. At best mortgage rates drop to where they were in the 2016-2019 market. Even that though had a lower fed funds rate than we’re currently targeting as the neutral fed funds rate. I’d maybe use those as a point of reference for what’s possible though.
Also everything is dependent on your credit score and other factors going into the calculation to determine if you could get that very bottom rate or more of an average rate. Also different lenders are different. I have found one that always comes in about .25% or more below any other lender and has lower fees. So maybe shop around.
My car, can’t be shut down, roadside, because i didn’t make the monthly payment for ‘heated seats’. Retro cars are in the money.
I have been tracking daily Treasury rates since 9-23-24, after all the hoopla had died down a little. What I see is the 1 month Tbill jumped from 4.675% to 4.864% from 9-23 to 10-4. The 3 month is down a little, 6 month up a little, and 1 year, 3 year, 5 year, and 10 year look like the Fed raised rates 25 basis points on 9-23 (historically speaking). Of course it is risky to draw conclusions from such a short time span, but I have some 3 month Tbills maturing soon, so I have to decide what to do. Looks like I will move to 1 month Tbills.
Seems not many are buying Powell’s “reality”, and just as well for me. I also notice that Schwab’s brokered CD rates used to be almost always among the highest, now they are just ho-hum and even lower than some banks I watch. Banks are nasty, and I try to avoid them.
“but I have some 3 month Tbills maturing soon, so I have to decide what to do. Looks like I will move to 1 month Tbills.”
A bunch of us are asking the same thing….
thurd, i like the casual commentary
Wolf,
Plot all the Treasury yields from 3 month to 10 year and you will find the spread remained close to 1.8% to the *highest* yield and not the 10-year.
Recently this broke down due to front-running of the Fed cuts, but now those cuts are not guaranteed and mortgage rates reverted back higher.
I have no idea what you’re looking at.
1. I assume with your expression of a spread of “1.8%” you mean a spread of “1.8 percentage points,” or 180 basis points.
2. The 3m-10yr spread was never -1.8 percentage points in 2024. It hit that very briefly for a few days in mid-2023 (8 days in May 2023 and 2 days in June 2023). The spread is currently -75 basis points.
3. The 2yr-10yr spread has been mildly positive (10yr higher than 2yr) since Sept 5, on Friday +5 basis points.
Wolf – when was the peak and trough for the spread between the 10yr and 30yr mortgage rate? You mentioned it ranged from ~0 to 4 pts in the last 4 decades, do you recall which years?
Cool article as always!
Wolf – re the spread between the 10yr and mortgage rate historically, why did the spread widen in 2023, as per your chart (scale not very clear but looks like 2023) ? Do you think of this spread as being representative of financial conditions/tightness ?
QT
As many of us have been saying, “higher for longer”…
Nothing has changed. CONgress is still failing to do their job.
Powell has used the term ‘data dependent’ to describe previous Fed funds outlook … I’d characterize this Fed as ‘data oblivious.”
They’re going to reinforce the policy error by stubbornly sticking to the rate cut script, even with a 300K jobs report next month and a higher CPI. They’re just too proud to admit they screwed the pooch.
So, get use to higher mortgage rates and let the glorious run to a 5% TNX begin!
I can envision a scenario where they cut 25 at the next meeting (so the 50 cut doesn’t look like a mistake), and then don’t cut at all at the next couple meetings. I guess that wouldn’t be the worst thing in the world – although I still hold that no cuts at the last meeting will be viewed as the correct decision in hindsight.
Looks like the ten year is solidly above 4% this Monday morning. Maybe the way this all plays out is that the 4-week bill stays pegged at 4.5-5% and the whole curve de-inverts to the upside. A gradual slope up to 7% long bonds and 8% mortgages. Let’s see if the 10y keeps climbing, I’d love to see 5% again by thanksgiving.
This is what *should* happen, but I’m skeptical it’s what will happen. Maybe hurricane/fire damage will push up MBS yields. Natural disasters are becoming too frequent and high dollar damaging. I would be demanding a higher yield for the higher risk as an MBS holder.
And to clarify here, just because people have home insurance (1) doesn’t mean that a claim will be paid and (2) doesn’t mean a paid claim will fully cover damages, and (3) doesn’t mean people will get the full repairs necessary. With natural disasters ramping up, MBS “investors” are more likely to be bag holders, and they need to be compensated with higher yields.
It is time to understand that a inverted yield curve is not anymore a recession indicator, especially since the GFC where central banks “nationalized” the bond markets.
The Fed seems to be afraid of the straw that breaks the Camels back and will tolerate some inflation and hope the market doesn’t force rates up.
A scenario for stagflation.
So, the ultimate hoped-for “soft landing” — some sort of emergence from 40 years of government’s too-casual overspending and underpriced credit — may be receding from sight. There appears a constraint against the USA inflating its way out. The markets may finally deliver a response to the “can’t fight the Fed” mantra, which could ripple all through our economy, and lives?
Housing sentiment jumps to highest level in over two years, Fannie Mae says
lol! Must be the increased mortgage rates and prices getting people excited….. maybe because yields are going higher, the inflation factor is pushing up sentiment?
LOL, article coming. You should at least once in your life read something other than just dumb manipulative headlines. And if that’s all you read, don’t drag them into here.
What jumped was SELLER sentiment — great time to sell, sell now.
But BUYER sentiment is still in the dumpster-kathoomphster, they’re still on buyers’ strike because prices are too high.
And the expectations of lower mortgage rates jumped after the rate cut, just as mortgage rates surged, LOL.
So this points to price declines as seller put their homes on the market and buyers are on strike because prices are too high, and now mortgage rates jumped — exactly what we have seen.
Then the composite of the factors — I gave you three (seller sentiment, buyer sentiment, mortgage rate expectations), but there are more, including rents — averages this all out, and it rose.
The FED made yet another critical policy error not only with the rate cut, but the jumbo rate cut. One can only conclude that this “error” wasn’t by accident, that it was meant to influence the outcome in November.
This will come back to haunt Jerome Powell’s legacy, and will be one of many diabolical decisions he made at the expense of the country as a whole.
Well, oil might push above $80, or even as much as $100 per barrel after the election, as China regains stimulus footing and the US Strategic Petroleum Reserve is being refilled. If the Fed’s goal is to cut rates “while they still can” (damn what happen in the future), now would be the time to do it.
Why would the price of WTI (West Texas Intermediate) change a single penny over the mid-east issues as the US is entirely energy independent and does not use a drop 9of mid-east oil?
Because the Strategic Petroleum Reserve is stored in artificial salt dome caverns. They are not geologically stable at low storage levels, so it would be prudent to refill, ASAP. Biden has been drawing down the SPR at a furious pace since March 2021, when there were 637 million barrels, down to 375 million barrels as of July 2024. Refilling will likely happen sometime “soon” after elections. Furthermore, if China starts ramping up again due to stimulus, they will be buying fuel, pushing up fuel prices in global oil markets, due to supply and demand issues.
1:04 PM 10/7/2024
Dow 41,954.24 -398.51 -0.94%
S&P 500 5,695.94 -55.13 -0.96%
Nasdaq 17,923.90 -213.95 -1.18%
VIX 22.70 3.49 18.17%
Gold 2,662.60 -5.20 -0.19%
Oil 77.31 2.93 3.94%
“The bond market is revolting against the Fed.
This morning, yields on the U.S. 10-year bond soared over 4%. This continues a non-stop rise in yields following the Fed’s 50 basis point rate cut on September 18.“
The Fed realizing the ship they are commanding is taking on large amounts of water. Sharks are circling. Sunset is nigh. Miles and miles and miles from shore. Titanic 2.0.
No, the bond market and the Fed are finally starting to see eye-to-eye. The bond market had been delusional and drunk with rate-cut mania.
Wolf, I asked AI if “the normalization of the 2-10 yr bond yield curve after an inversion correlates pretty well to the beginning of a recession?” It answered mostly yes, below are the main parts of its reasoning.
Historically, after the yield curve inverts, it often steepens again when the economy is nearing or entering a recession. This happens because central banks usually respond to slowing growth and recession risks by cutting short-term interest rates, which causes the short end of the yield curve to drop, resulting in a steepening.
2000 Recession: The 2-10 yield curve inverted in 2000, and its steepening began before the recession officially started. The Fed cut rates to address economic weakness, and the yield curve normalized as the recession unfolded.
2008 Financial Crisis: The 2-10 yield curve inverted in 2006-2007. It steepened in early 2008, right as the economy entered a recession. The Fed’s aggressive rate cuts contributed to this normalization.
2020 Recession: The 2-10 yield curve inverted in 2019, and it steepened dramatically in early 2020 as the COVID-19 pandemic hit and the Fed slashed rates.
Is AI the new God?