Chicago condo prices stall. Dallas boom slows. Minneapolis, Charlotte, Atlanta zoom higher. Detroit prices up 100% from 2012! Cleveland struggles.
I have cut the US housing market in two: The Most Splendid Housing Bubbles in America, where home prices have more than doubled at some point since January 2000; and the rest of the markets that make up the CoreLogic Case-Shiller Home Price Index, where prices have not yet doubled since January 2000, which includes some markets that had been totally crushed.
Chicago Home Prices:
In the huge and diverse Chicago metro, prices of single-family houses, according to the Case-Shiller Index, rose 0.7% in June from May, about in line with seasonal upticks at this time of the year, which left the index up 1.5% from June last year, but still down 13% from the nutty peak during Housing Bubble 1:
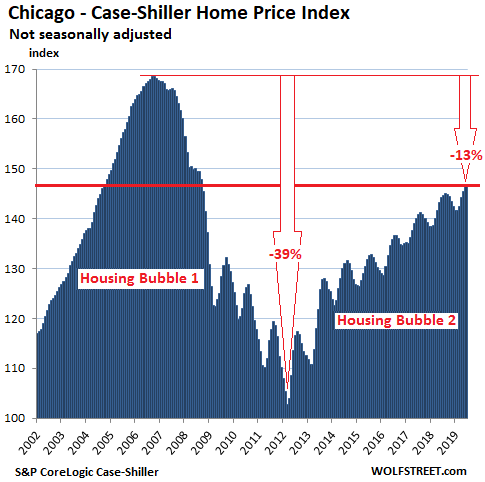
The charts here – except those for Dallas-Fort Worth, Minneapolis, and Detroit – are on the same scale, based on the Chicago chart above, with the vertical axis going from 100 to 170, which fits Chicago’s Housing Bubble 1. The Case-Shiller Index was set at 100 for January 2000. Chicago’s peak index value of 169 during Housing Bubble 1 means that house prices had risen 69% from January 2000 to September 2006. The index value for June 2019 of 146 indicates that house prices have risen 46% since January 2000.
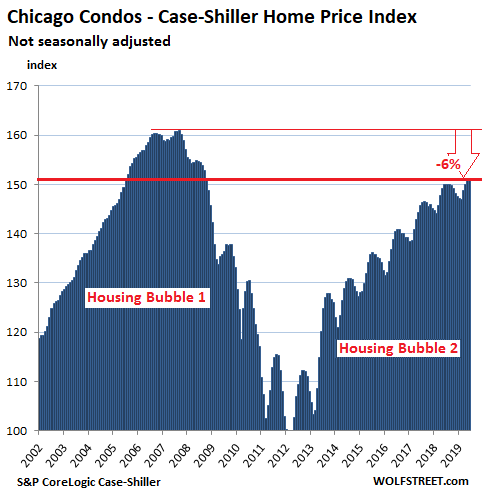
Condo prices in the Chicago metro were flat in June, compared to May (-0.04%), whittling down the year-over-year gain to just 0.8%:
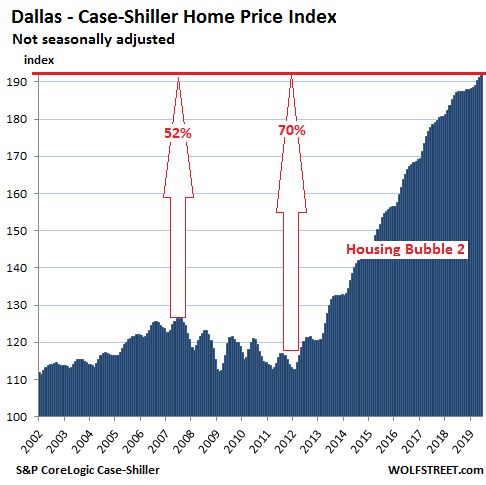
Dallas-Fort Worth House Prices:
The Dallas-Fort Worth metro missed Housing Bubble 1, and so it missed Housing Bust 1. But it has been party time ever since, with a housing bubble of historic proportion: Between January 2012 and June 2019, the Case-Shiller index has skyrocketed 70%! But over the last few months, the pace of the increases has slowed. In June, the index ticked up 0.4% from May. Compared to June 2018, the index has risen 2.7%, on par with the prior two months, but the slowest pace since March 2012:
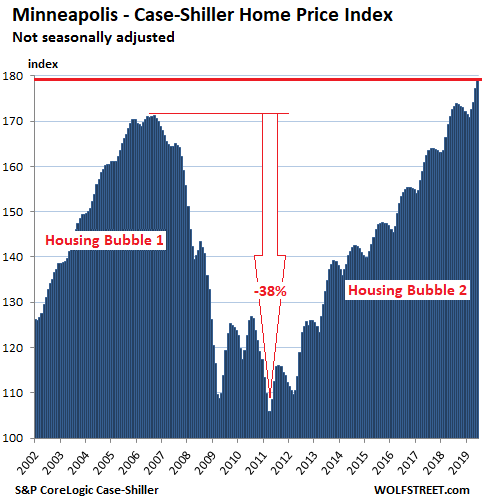
Minneapolis house prices:
The Case-Shiller Index for the Minneapolis metro rose 1.1% in June from May, and 3.9% from June 2018. Housing Bubble 1 and Housing Bust 1 were similar in Chicago and Minneapolis, but the metros have diverged since, with house prices in Minneapolis having risen 4.7% above the peak of Housing Bubble 1 while Chicago’s prices are still 13% below the peak:
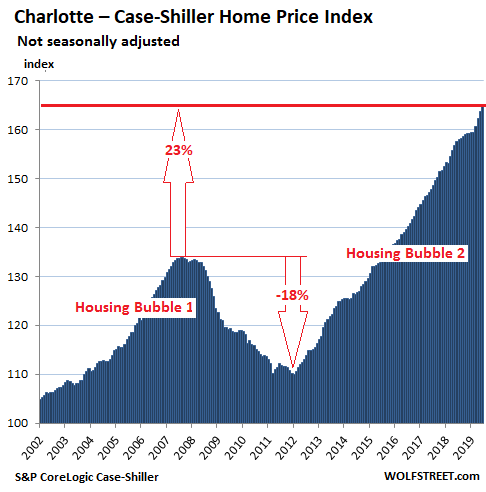
Charlotte house prices:
House prices in the Charlotte metro ticked up 0.6% in June from May, and rose 4.5% from June last year, to a new record, continuing a relentless push higher that started in early 2012 and hasn’t abated since:
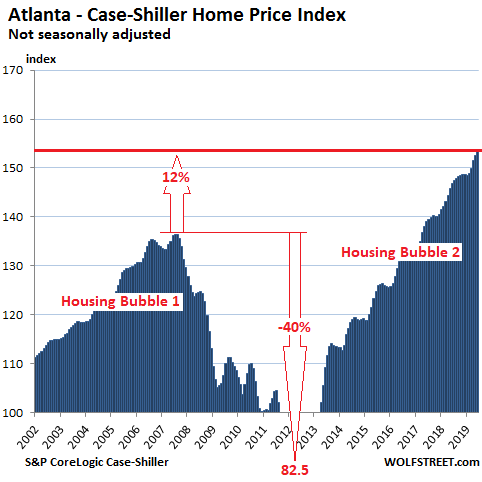
Atlanta house prices:
House prices in the Atlanta metro ticked up 0.5% in June from May, and rose 4.5% from June last year, to a new record. During Housing Bust 1, the Case-Shiller index had plunged 40% to an index value of 82.5 by early 2012, where it had first been in 1996. The chart is on the same scale as the charts for Chicago; note the larger amount of white space. Nevertheless, since January 2000, house prices according to the index have soared 53%:
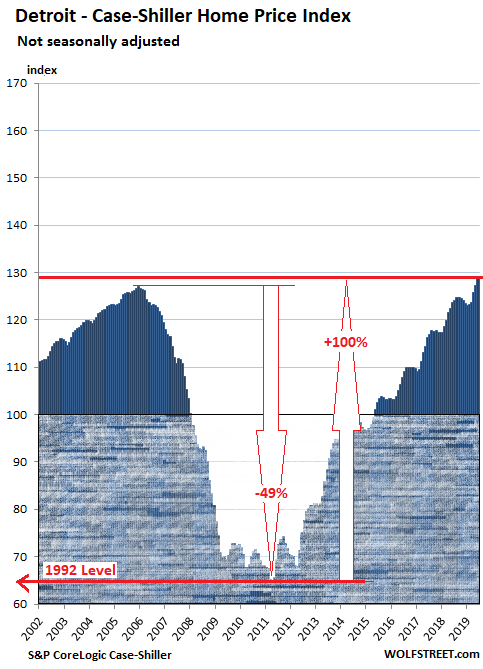
Detroit house prices:
The Case-Shiller index for the Detroit metro rose 1.2% in June from May, and is up 4.2% from June last year, hitting a new all-time record for the second month in a row. From the bottom of Housing Bust 1, just before the city’s bankruptcy, house prices have doubled (+100%).
Detroit’s housing market had essentially collapsed before its bankruptcy, from levels that hadn’t been high to begin with. To show how far prices plunged, and to what extent they have skyrocketed since then, I have extended the scale. The scale of all charts above starts at 100 (the value on January 2000). The scale of the Detroit charts starts at 60. The shaded area shows the part between 60 and 100:
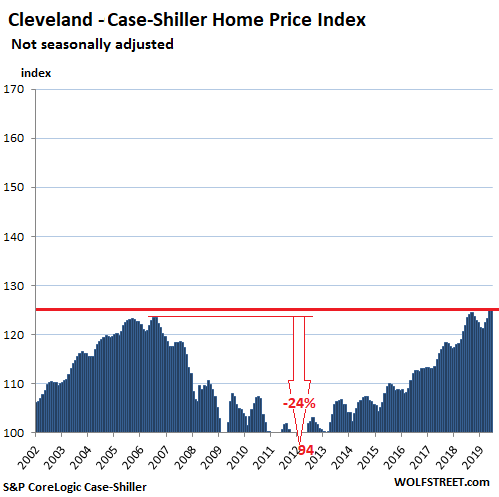
Cleveland house prices:
House prices in the Cleveland metro were flat in June compared to May, which reduced the year-over-year gain to 2.6%. This keeps the index for the second month in a row one notch above its record set during Housing Bubble 1 in 2006. Since January 2000, the index has risen 25%, which might be an appropriate price increase for a non-bubble market, but in our bubble-crazed times, it was the smallest increase since January 2000 among the 20 metros covered by the Case-Shiller Index:
The biggest increases since January 2000 occurred in Los Angeles, where house prices have nearly tripled, followed by a gaggle of other markets, some of which have started to reverse course once again.
According to the Case-Shiller Index, Seattle house prices fell year-over-year. New York condo prices dropped to August 2017 level. San Francisco Bay Area house prices were nearly flat year-over-year. Los Angeles, Denver, Boston set new highs while Las Vegas and Phoenix dream of crazy Housing Bubble 1. Miami stalled. Read… The Most Splendid Housing Bubbles in America, August Update: West Coast Markets “See the Dip”
Enjoy reading WOLF STREET and want to support it? You can donate. I appreciate it immensely. Click on the mug to find out how:

![]()
What do you make of the seasonality that’s sometimes there, sometimes not, in the climb towards a top? Generally bubble 2 seems to have more annual oscillation than bubble 1. I’m trying to correct visually for the fact that the same oscillation might be less obvious on a steeper slope (because instantaneous slope never goes negative).
Maybe just my imagination.
Looks as though those markets which missed B1 made up for it in B2, hence more vol. (Like the second tech bubble was better for Apple, than Microsoft). Maybe at this point in the global monetary bubble, B^, cash is looking to fill empty gaps. It’s not that someone says to heck with Cleveland I am going to Atlanta, but their money does.
There are some nice spots in Atlanta.
The Case-Shiller indexes are inflation adjusted. It seems like double bubble trouble in some areas.
Urban areas are less than 3% of America. Home prices in the country are not as bad.
The US 10 yr. treasury bond reached an all time low today. The S&P 500 dividend yield is higher than the 30 yr. treasury bond yield. Typical spreads are upside down.
The 30 yr bond yield reached an all time low today. The 10 yr bond yield is close to an all time low.
82% of Americans live in Urban areas.
Wolf’s charts are not inflation adjusted. An inflation adjusted CS index is available on FRED but youre not seeing it here. So the bubble is as bad as it seems, but fortunately not worse.
ocop,
These charts ARE inflation measures – “house price inflation.” Adjusting “house price inflation” to “consumer price inflation” is conceptually flawed. It’s like adjusting the Consumer Price Index to the Producer Price Index. It just doesn’t make sense, though you can do it, of course. If anything, adjust house price inflation to wage inflation, which gives you a measure of affordability, if that’s what you’re after.
‘Urban areas are less than 3% of America’
Geographically, no doubt, but largely irrelevant to a discussion of possible real estate bubbles or crashes. Roughly 80 percent of Americans live in urban areas, according to the U.S. Census Bureau.Dec 18, 2018. This trend to urban living has left much of rural US as near ghost towns. They are certainly immune to speculation.
I personally would dread living in Vancouver, BC but almost half the population of the province does live in greater Van. The province has a land mass roughly that of Germany and France combined.
Speaking of Vancouver, I think it is Ground Zero for this RE crash. Assessments are down about 10% but the market has blown through them with some sales 10% below assessment. Prices still make many counties of San Fran look cheap. Van just got its first listing of a detached house under a million- an unlivable shack on a tiny lot.
Developers have pulled 5000 concrete condos off the market to await ‘a better market’ But according to one
of the top realtors,quoted in the Globe and Mail, folks who delay listing are losing five thousand a day.
Next will be Toronto and the size of the boom (or bubble) may surprise some US readers. As of a few months ago Toronto was employing 25% of the high rise cranes in North America, at 109 almost double the runner up, Seattle. Many of these developers no doubt wish they could cancel, but they will have paid a fortune for the land, so by the time concrete flows…
Amen…good comment about BC.
I just returned from 2 days fishing and kayaking 30 miles from where I live. We shared the lake with a family of Ospreys. Wife is starting to fly fish. Vancouver? What kind of life is that?
The good, old ‘crane indicator’. Like Miami in 2006…poof
My heart bleeds. How can “ordinary’ people afford to live in these places?
My two older kids rent shoeboxes and it makes me very sad. I was able to buy a house in the early 90s and I guess I was lucky. Something terribly gone wrong in our country.
I really thought about Detroit back in 2013. Did NOT take any action. Don’t want to risk getting shot for renting cheap properties to folks over there. Looking back, just buy and hold would have worked. Same as S&P I guess.
I remember in the late 90s/early 2000s there being houses really cheap, like a few thou, in some pretty hairy parts of Los Angeles but I’m guess those areas are … less hairy now? I wonder if buy and hold could have worked there too?
@Alex
A few thou in LA? Don’t think so.
Who can turn the world on with her smile…
Who can take a nothing day and suddenly make it all seem worth while….
I’ve heard from family and work colleges my home town Minneapolis is booming. Three years ago I considered moving back and noticed home prices seemed a bargain compared to Boston area. But practicality intervened and kept me in Boston.
Life goes on.
Your equity is safer in Boston than Minneapolis.
The reason Dallas did not participate in the first housing bubble is because Texas has very accommodating laws regarding land use. The housing bubbles hit where they did because of restrictive regulations on land use. Thus even though Texas cities were growing at a significant rate housing prices were not blowing through the roof. Texas simply was not a good place for speculators because land use was not restricted as severely as the bubble areas.
By defending asset prices through LIRP, does the Fed cause homelessness?
Yup. It displaces low income families who live on the edge of housing affordability. You raise rents through asset price inflation as a result of low rates and those families now take up scarce resources for the homeless, pushing the needier [crazier, more addicted, less able to function in society] out of the few shelter beds and onto the streets. Price is set at the margin, and in shelters, price is really a function of a person’s ability to navigate the bureaucracies associated with help for the homeless, so a low income household with functional adults will take spots once open to the crazy/addicted homeless we now see on the streets.
To those complaining about not being able to afford to buy, there is an easy solution. Move out of San Jose or LA. There is an entire country between NY and SF with affordable housing. And yes you can find all sorts of micro brews, restaurants serving $15 toast sandwiches and hippie supermarkets that sell 17 varieties of kale in flyover country.
I recently rented an AirBnb in a mid sized flyover city. Really cool old renovated house, built in 1910, midtown section of the city. Walking distance or a short drive to tons of restaurants, coffee houses, bars, etc including a Whole Foods. 10 minute drive to downtown. 2 bedroom, 1 bathroom, 1400 sq ft. I looked it up on Zillow to see what it’s worth. $190K. Same house in San Jose would be $1.5M.
And yes incomes are higher in San Jose, but not 800% higher. And when factoring in taxes, the difference between salaries are nearly wiped out.
So if you really have you heart set on living in San Jose, great, do it. But please stop the incessant whining about housing costs. You are CHOOSING to live in the most expensive part of the country and ignoring hundreds of cheaper options. It’s like someone who insists on driving nothing but BMW 7-series and constantly complaining about how expensive cars are. Buy a damn Honda already!
Job opportunities are dismal in many of these middle America areas, that’s why houses are so cheap.
There are pockets of opportunity in secondary cities like Raleigh, but even there, the job market isn’t that great.
That’s really not true. But if you insist on believing that, be my guest. Enjoy your $3500/mo rent for a bedroom apartment. No skin off my nose.
Thank you!
I’d love to live in flyover country. Have a house with land. But there are some areas of flyover country that are definitely not receptive to minorities. That limits the options for some of us and we have to choose more carefully.
I can only speak for my little corner of fly over country.
No need to worry. And ignore the talk of ” no jobs ” & only
“ghost towns ” left between the coasts.
Just gotta learn to love the packers, supper clubs, and brandy old fashions.
The problem exists because there are no “Hondas” of the housing market in HCOL areas, not because we want to drive BMW’s. WTF are teachers, cops, and firefighters supposed to do?
Skyrocketing housing costs isn’t exclusive to the coasts. This is a crisis that will reach across all of America. Houses are now seen as a source of wealth, as a way to get rich. The same happened with Health Care and Insurance companies. We need to recalibrate our values on this in America.
Housing as a right is the next “Medicare for all”
Pending home sales down worse than expected at 2.5%. But socaljim, Ed and Broker Dan all told me there was another leg up “to the moon Alice” on real estate.
Even REIC shill Diana Olick can’t spin it as good news.
To be more accurate – eve Olick is now admitting lower rates aren’t doing anything.
She looked mighty depressed on CNBC this morning.
“It is difficult to get a man to understand something, when his salary depends on his not understanding it.”
-Upton Sinclair
sc7, the rates did not go low till August. In mid July, rates were just below 4%. Rates rlse from July1 to mid July. The big rate drop did not happen till August. Realtors are reporting upward price pressure in many markets.
Just LOL at quoting anecdotes from Realtors, aka professional liars. I’m seeing prices get slashed and sawed in the Boston suburbs. Just saw a half of a duplex in Waltham go 20k under asking. Would have been a bidding war last year.
You said back when rates were starting to dip below 4%, it would make the market pop. It didn’t. Rates have been significantly lower YoY for a while and it hasn’t helped. Another .125 isn’t going to be the magic that makes it work now, this pending home sales figure shows that.
Also, this pending home sales number is for August, when rates have been low. US10Y yielding higher today, this might be a rate bottom.
OK. That was July’s report … The August report gets released in Sept. Boston is doing very well … currently, in Wellesley and Newton, which are high priced markets, there are 276 homes available, and 193 are under agreement. That is an impressive number of homes under agreement relative to the pendings, especially in high priced markets. Mortgage rates were just under 4% in mid July, and had risen. The big drop in rates happend in August. The real estate market is doing fine and I don’t see a collapse on the horizon. I always said I expect a slow and steady grind with slowly rising prices with slow sales. I only said I expect a leg up in prices after the big drop in mortgage rates occurred, and that happened this month. I also said I expect the drop in rates to be short lived because I don’t buy the US recession hype.
I don’t see a collapse on the horizon either, but I disagree that things will continue to grind higher indefinitely.
I see a correction coming. Say whatever you will about under agreement versus inventory, it’s still noticeably slower than last year. The difference is this year those pending homes had a lot less bidding wars, a lot more concessions, and are going for much closer to, or in many cases, below asking. Just as Redfin noted, Boston bidding wars all but disappeared. Conditions are perfect for housing and things should be better. The reason they aren’t is prices are too high, demand was pulled forward.
If the deceleration continues, or if rates rise, or if unemployment rises, any one of those chips fall, prices will retract a little. I see inflation adjusted 2015 prices as a real possibility in the event of a mild recession.
but the mainstream press sure are promoting a recession. Stock market acts as though it wants to go up. Go figure! Housing in north Atlanta is hot! Like Wolf Says when the consumer is 70% of the economy a slowdown in manufacturing doesn’t seem to matter as much as it use to.
Consumer spending and sentiment always hits highs just before peaking. Terrible lagging indicator.
Hi Wolf,
Thanks for the great analysis!
I’m wondering if you’re planning to do a report on commercial real estate in the US and the source of investments. According to the article below, the 55% of total commercial RE investments last year came from Canada (#1). Knowing that Canada is (one of) the money laundry heavens, I’m not convinced the money came from retirement accounts in CA., and rather originated somewhere outside of Canada, brought in cash, converted to $CAN and funneled into US real estate via legitimate banking process….
https://www.cnn.com/2019/08/29/investing/real-estate-warning/index.html