The “yeah but” shows up again.
The services sector, which accounts for about 70% of the US economy – the biggest segments being finance and insurance, healthcare, professional services such as architects, engineers, and lawyers, and information services such as telecom and data processing – has been growing at a fairly decent level, unlike manufacturing. All eyes are now on services to see whether they can keep pulling the US economy forward a while longer.
This morning, we got a boots-on-the-ground view from executives in that sector, surveyed by the Institute of Supply Management. The ISM Non-Manufacturing Index rose 1.4 points to 56.9%, the strongest reading in three months. A value below 50 indicates decline. A value above 50 indicates growth. The higher the value, the faster the growth. The May reading is well in the range since 2011, but not as high as during most of 2018, which had been red-hot (horizontal blue line = May level):
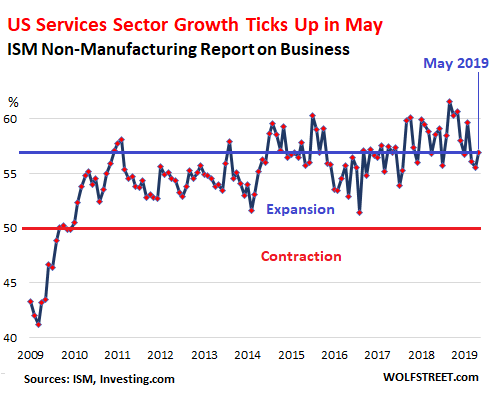
Among the sub-indices that showed growth that is increasing: The Employment Index jumped 4.4 percentage points to 58.1%; Business Activity/Production rose 1.7 points to 61.2; the New Orders Index ticked up 0.5 percentage points to 58.6%.
Among the sub-indices that showed growth, but at a slower rate: Backlog of orders index ticked down 2.5 points to 52.5%; and New Export Orders ticked down 1.5 points to 55.5%.
Imports showed no growth, at 50.0, having dropped five points from 55.0 in April.
Of the 17 non-manufacturing industries covered by the ISM, 16 reported growth in May, in order of growth:
- Accommodation & Food Services;
- Educational Services;
- Management of Companies & Support Services;
- Construction;
- Transportation & Warehousing;
- Real Estate, Rental & Leasing;
- Utilities;
- Wholesale Trade;
- Public Administration;
- Professional, Scientific & Technical Services;
- Mining;
- Health Care & Social Assistance;
- Other Services;
- Finance & Insurance;
- Information;
- Retail Trade.
Only one of the 17 non-manufacturing industries showed a decrease in economic activity in May: Agriculture, Forestry, Fishing & Hunting.
The ISM report explains that historically, a value of the Non-Manufacturing Index over 48.6% “generally indicates an expansion of the overall economy.” With the May index at 56.9, the ISM report estimates that the overall economy, as measured by real GDP (adjusted for inflation) on an annualized basis, grew at a rate of 2.9% in May.
This estimate is up from the April report, which had been slightly less strong, indicating that real GDP in April grew at an annual rate of 2.4%.
Yeah, but…
The IHS Markit US Services PMI was also released this morning. The data only goes back to 2010 and is narrower than the ISM Non-Manufacturing Index, covering only consumer services (but not retail), transportation, information, communication, finance, insurance, real estate, and business services.
Its headline reading for May dropped to 50.9 (above 50 = expansion), indicating growth but sharply slowing growth. Since Markit’s data only goes back to 2010, we don’t know what the index might have shown during the Great Recession. Note that the index dipped below the 50 line (into contraction mode) in February 2016, when growth in the overall economy was slowing but not enough to register a recession:
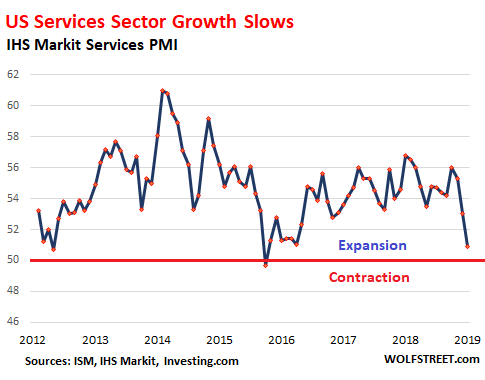
Service firms keep hiring and increasing their staffing levels: “A sustained increase in new work drove firms to employ greater workforce numbers,” the report finds. “The rise in staffing levels was stronger than that seen in April and moderate overall.” Some other details:
- Some firms “stated that greater competition and softer demand conditions had, in part, driven the slowdown.”
- New orders “increased at only a marginal rate in May.” And “new export orders were broadly unchanged” (at 50.0).
- “Business confidence was at its lowest level since June 2016 as service providers highlighted concerns surrounding softer demand conditions and uncertainty around ongoing global trade tensions.
- Backlogs of work remained the same as in April.
So what to make of these two diverging data sets — the ISM Non-Manufacturing Report on Business and the IHS Markit Services PMI? They rarely agree, and they have diverged strongly before, including in September 2018, when the Market PMI (blue) dropped to 53.5, while the ISM Index (red) soared to what was at least a decade high of 61.6:
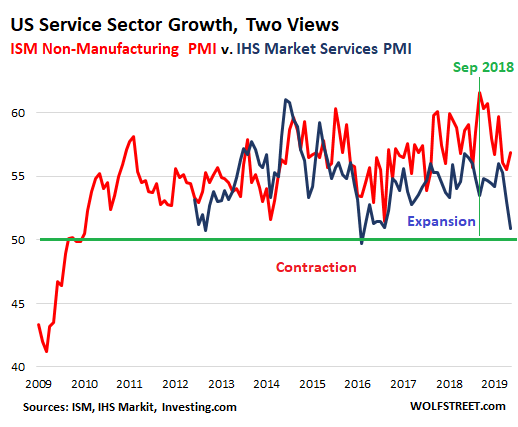
These indices are based on responses by industry executives (the “panelists”) on a monthly basis. They’re a quantified boots-on-the-ground view of their industry that is more immediate than economic data often reported months after the fact. The names of the companies and the panelists are not disclosed.
It would be nice to get pleasantly consistent economic data. But we normally don’t. So we got additional data points today that show the services sector is growing, but the range for May is somewhere between a slow rate of growth and a decent but not spectacular rate of growth.
Enjoy reading WOLF STREET and want to support it? You can donate. I appreciate it immensely. Click on the mug to find out how:

![]()
1) How do these survey companies have a clue where the boundary between “expansion” and “contraction” lies? Especially MarkIt with no data history during “contraction”.
2) What incentives do the respondents have to report thoroughly and accurately?
Theere is optimistic bias in these surveys. Especially Public companies don’t want to poo poo the party.
Neither the companies nor the executives are disclosed. So this — “Especially Public companies don’t want to poo poo the party” — is not an issue.
Also, these surveys can get very doom-and-gloomy. See what the ISM did during the Great Recession. It hit a low of 37.2 in Nov 2008. There is no optimistic bias. Sure executives can get excited, but they can also get scared. Both show up in the surveys.
These are “diffusion” indices. In the ISM, a value of 60 in a sub-index indicates that 60% of the panelists respondent to a specific question with “growth” in the current month compared to the prior month. When only 50% respond with growth to a particular question, it indicates that this indicator is flat (no growth) with prior month.
The headline Non-Manufacturing Index is a composite index based on four diffusion indexes with equal weights: Business Activity, New Orders, Employment, and Supplier Deliveries.
For more details, you can read the specific methodology in the linked reports.
Exactly.
The only consistent information is inconsistent, unreliable surveys, polls, statistics that say whatever the issuer wishes them to, and outright false, overly optimistic opinions.
Wading through this jungle of information is time consuming resulting in most cases, with little reward. Occasionally a nugget of pure unadulterated truth emerges, that molds itself with other nuggets and gives you a clear image of what lays immediately ahead.
Practicing your due diligence in this ongoing atmosphere, is a constant effort that approaches an art form. Without it you are quickly lost.
“Retail trade” grew???? I smell equine excrement–trust me, I’ve stepped in plenty. Can’t see that with the massive store closings, pitiful earnings, and insane foreign policy decisions that President Tweet has been making.
SPX stopped on dma20 and a resistance line coming from
Mar 8(L) to May 13(L).
From those x2 lows the SPX jump upside on a spring board, but today SPX
closed below, possibly creating a downtrend channel from May 3(H) to June 5(H) and a parallel line from May 13 to June 3 lows.
I’m guessing with all the flooding in the Midwest, agriculture may be slow for some time.
If the “employment” leg of the “bull” cripples then there will be nothing that could save this paper (interest rate) economy from falling….and how will the tenants be able to pay rent that is 2X since 2008?
With the economy made up of so many moving parts, conflicting reports seems perfectly normal!
Actually I can’t remember a single instance in my life when things were not as clear as mud!
Everybody is on their own unique cycle. Such is life!
Oil fall on EIA data.
CL, monthly, linear :
Feb 2016(L) to June 2017(L) to Apr 2019( monthly C).
Oil, from below, might test this line, sending CL > Apr(H)…..
“Service firms keep hiring and increasing their staffing levels” – compare that to today’s ADP May employment report. The lowest # since 2010 – 27k new private sector jobs. Another example of unpleasantly inconsistent data. Let’s see what kind of consistency we get with the BLS report on Friday.
On a not very related note, I wanted to share the best tweet I came across today.
That ADP report was a real outlier. When I see something like this, my quirk-feelers go out. I have my own theory about it. ADP bought the payroll business from Wells Fargo. So all the businesses whose payroll had been handled by Wells Fargo were switched over to ADP in April and ran their April payroll through the ADP system. I know because my company was part of this switch. The way ADP gets its data for its jobs report is off the payrolls it processes. And I think when they took on those many thousands of new accounts — from tiny outfits like mine to larger companies — something in their data didn’t properly account for the new accounts and the employment changes in those accounts that suddenly were in their system. That’s my theory.
This — making sure that the new accounts from Wells Fargo don’t mess up the payroll report — might have been a project for you to oversee, if I understand your expertise correctly :-]
Thanks for the insights Wolf. Also, the discrepancy between the estimate and the actual for the ADP report was so large that this could indeed be an outlier.
Regarding my expertise, years ago I could have done work similar to that – I have a rather different focus now.
Not a complete outlier. Plus, the April and March downward revisions were large.
Sandu,
Today was not an outlier (unlike yesterday’s ADP data). It was at the lower end of the three-year range. This is what the lower end looks like. Note that in May three years ago, only 15K jobs were created:
May 2019: 75K
Feb 2019: 56K
Sep 2017: 18K
May 2016: 15k
This comes after two months of (revised) of 153K (March) and 224K (April). As you can see, April was strong, even after revisions.
The labor market does NOT change from one month to the next like this, from 224K to 75K. But the estimates change like this because the data is volatile and subject to large revisions, as you pointed out, in both directions.
The rolling three-month average, which includes today’s revisions of March and April = 151K. In general, it takes about 100K new jobs a month to absorb the new entrants into the labor force. Anything above 100k, reduces unemployment in general. As you pointed out, this data is revised heavily over the next two months. So it’s not a good idea to get hung up on the first estimate.
These days, the big complaint by employers is that they’re having trouble hiring people without raising pay. That’s a big issue for employers. This speaks of a tight labor market in many industries – and high-paying industries: finance, healthcare, professional services, information… And it is one of the big reasons why growth in jobs is now harder to come by.
Sure, brick-and-mortar retail continues to melt down – as I have covered it for years – and it continues to shed jobs. That’s a structural change in how consumers shop, by shifting to ecommerce. Note that most of the people who work in ecommerce are not classified as “retail.” They’d coders, warehouse workers, drivers, delivery people, etc. “Retail” jobs are jobs at brick-and-mortar retail stores. And these stores will continue to shed jobs, no matter what the economy does.
So… give it a month or two until the trade war somehow affects the Service Sector?
Good morning Wolf,
On a completely different subject, the Federal Reserve has announced they will discontinue the runoff of their balance sheet this fall. I believe this is a strong indication that the economy may not be as peachy as numbers such as this IMS reading would have us believe. What is your take on this sudden turn around by the Federal Reserve? Thanks for the great work you do!
I’ve discussed this topic in prior articles. You can find them here, though you might have to scroll down quite a bit:
https://wolfstreet.com/category/all/federal-reserve/
Let me just say this: a “turn around” or “U-Turn” at the Fed would mean that the Fed is suddenly going in the opposite direction, meaning cutting rates and restarting QE. But it has simply stopped the rate hikes and the balance sheet runoff is now slowing down.
Also note that the Fed will continue to shed MBS for years to come until they’re gone.
“the Fed will continue to shed MBS for years to come until they’re gone” or get back into it when the housing market will need support again :].
Not sure what to read into the consideration for a $100B Fannie Mae public offering. At one level one could argue that this a sign of strength for these institutions. At another level Fannie Mae and Freddie Mac are now the backers of an even larger size of mortgage market on what you call here “Housing Bubble 2”.
75th anniversary of D-day today… Don’t forget…..
A struggling service economy might enjoy direct consumer subsidies, we have been giving money to Wall St for years, maybe they will try that?