Macau, the only place in China where folks can go and legally gamble away their money, and one of the most convenient places where they can illegally siphon money out of China and send it to destinations beyond the reach of the government – is it on the way to ruin?
Until last year, it was an awesome ride. In 2001, Macau permitted foreign casino operators to set up shop. In 2002, Macau blew past Las Vegas as the number one gambling destination in the world. Even during Financial-Crisis year 2009, Macau gaming revenues rose 9.6%. They’ve been a thermometer into China’s economic boom.
The first few months last year promised the same relentless glory. In February, gaming revenues soared 40.3% year-over-year to a record of 38.0 billion Macau patacas ($3.76 billion), according to the Gaming Inspection and Coordination Bureau (DICJ). But in the second half, all heck broke loose. VIP revenues, which used to account for 66% of total revenues, plunged. Increased marketing to regular folks with not much money to lose couldn’t fill the hole.
The year culminated with a “shocker” December, when revenues plummeted 30.4%, the worst decline in the history of the data going back to 2002. Gaming revenues for the year fell 2.6% to 351.5 billion patacas ($44 billion), the first annual revenue drop in the history of the data.
In January, revenues dropped 17.4%. All hopes were on February, the month of the Lunar New Year, which in 2014 had produced spectacular results. But revenues plunged 48.6% – worse even than the record plunge in December – to 19.5 billion patakas. It was the ninth month in a row of collapsing revenues, beating the financial crisis record of seven months.
This is what that series of events looks like:
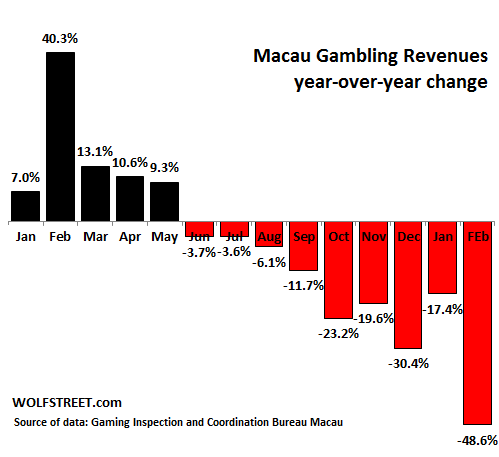
In an ironic – and by now typical twist – it was “leaked” a few days ahead of time that gambling revenues in February would plunge “50%.” The figure was picked up by the business media around the world, which set investor expectations. When the actual revenue plunge of 48.6% was published today, it beat expectations, so to speak. As a result, shares of the beleaguered Hong Kong-listed casino operators jumped initially (before giving up some of the gains during the day).
This is what it looks like when three-and-a-half years of surging revenues just dissipate, dropping to the lowest level since January 2011:
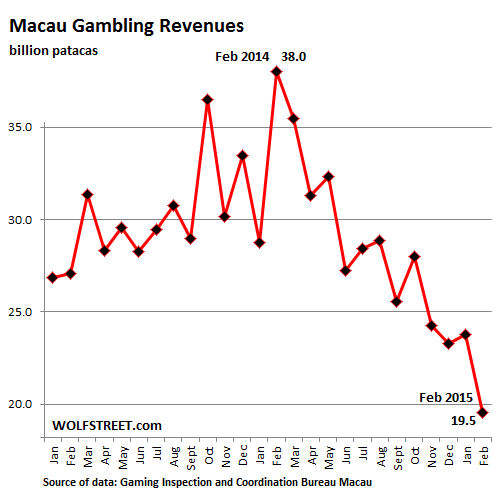
For the mainland Chinese, that’s a good thing. Macau’s gambling revenues are their losses.
For Macau, which depends on gaming revenues for its budget, it’s not such a great thing. Casino operators have been getting slammed. Junket promoters see their business model threatened. They’re commissioned by casinos to entice VIPs to Macau, and they do so by offering a variety of services, such as evading China’s currency controls. And these services are now being targeted by the Chinese government.
The reasons changed with the gravity of the situation. In June, the soccer World Cup was blamed. In July, it was the investigation of Zhou Yongkang, former head of state security, the most senior guy at the time to get tangled up in China’s corruption crackdown. VIPs were having second thoughts, apparently. In August, the blame hit Taipei’s District Prosecutors Office that had indicted the Taiwan branch of Macau casino operator Melco Crown Entertainment for alleged violations of banking and foreign-exchange laws.
New reasons bubbled up every month: pro-democracy protests in Hong Kong; Macau’s tighter visa regulations; new curbs on the UnionPay credit card which mass-market gamblers use to get around China’s currency controls. Then there was the smoking ban in casinos. In November, it was reported that Hong Kong had launched a money-laundering investigation into Cheung Chi-tai, one of the largest shareholders in VIP junket operator Neptune Guangdong Group, and seven of his closely held companies. This too shook up VIPs, it was said. In December, they cited President Xi Jinping’s visit to Macau.
But no economy dependent on one activity can survive that sort of revenue plunge for long without making serious adjustments. So what kind of adjustments? A number of multi-billion dollar casino projects are under way, and now the hope is that regular Chinese with little money to lose can somehow make up for the VIPs that have been sacred away by the corruption crackdown. This will be a tough slog.
The crackdown is real. It is impacting business in China. It is making wealthy and powerful Chinese nervous. But VIPs may have another reason to stay away: The property sector, a disproportionately large part of the Chinese economy where many of these VIPs made their highly leveraged fortunes, is crumbling. Property prices are dropping. Developers are getting in trouble. And this might ruin their remaining appetite for junkets to Macau.
China has long frustrated the hard-landing watchers. But maybe not much longer. Read… Housing Crash in China Steeper than in Pre-Lehman America
Enjoy reading WOLF STREET and want to support it? You can donate. I appreciate it immensely. Click on the mug to find out how:

![]()
You can expect the corruption crackdown to impact real estate sales in the west too. Anywhere Chinese money was being invested will be impacted, LA, NY, …
The only thing certain is that the stock market will rally because now all those money will have to go to the biggest casino in the world.
Maybe you are on to something.
NotSoSure, you are supposing that there is money. Could be that the reason that Macau’s revenue has declined is because the Chinese economy is going bust. Hard to launder losses.
What is driving our stock market has been stock buy backs. I’m sure some of that money came from China and some from outer space. There is still a lot of money floating around looking for a ROI. Interesting day today as both bonds and stocks sold off… Where is the money going? Loaning it to Greece?
@economicminor, it could be, but the thing is that a lot of these are self inflicted i.e. the “anti graft”. Actually laundering losses is way easier in the Chinese economy, I mean who’s keeping track? The fact that the Chinese economy will go bust one day does not prove anyone prescient. David Stockman, etc have been predicting this forever. The more important point is what will happen afterwards, if it recovers decently enough, then what’s a bust or two. I am generally a bear as well, but you’ve got to draw the line somewhere.
Today may just simply be a correction.
If the (Chinese) 1%’ers are having a hard time … hard to care a lot.
Is Macau the China’s canary in the coal mine? Fleeting of the “disposable” income to gamble? Loansharks accompanied by gangsters busy prowling the small to medium size private “mfg” companies built on razor thin margin with rising labor cost unable to pay back the loans and worse loan guarantees for friends/families gone bust?
Those glistening towers across the bridge from Zhuhai China with siren calls to draw in Chinese whose favorite past time happens to gambling and other vices like KTVs and saunas? Been to Zhuhai few times on business and made mistake of walking towards Macau surrounded by mobs of touts peddling women and sexy massages.
My 2-cent is that casinos overbuilt and high rollers rather gamble outside China in Korea or Singapore away from the commie cadres watchful eyes. In the mean time other gamblers’ disposable income may have come down quite a bit.
A lot of the dropoff is from the crackdown on corruption. Nothing calls attention to yourself like an ostentatious splurge at a casino. Xi Xin Ping has instructed all Party offficials, especially high-ranking ones, not to engage in behaviors that should not be emulated by the people. They were even told not to smoke in public.
Casinos and gambling do not contribute to the good of society like a business. It is just a transfer of wealth from one party to another without creating anything of value. Often it involves harm to the families of the gambler.
Casinos suffering?
Not a BFD.