CEOs, Wall Street are making hay while the storm moves in.
Pfizer’s revenues have been declining for what will be four years in a row by the end of 2015. Its liabilities have ballooned to $104 billion. Its “goodwill” and “intangible assets” – future expenses temporarily parked on the balance sheet – have swollen to $95 billion. It has so much debt in relationship to its real assets that its tangible stockholder equity is a negative $24 billion. It’s facing a “patent cliff,” as new generic drugs are eating into sales and profits of its old drugs. It’s in worse shape than even IBM.
And it no longer wants to pay taxes in the US. So it announced a miracle cure, a marvelous piece of financial and tax engineering: the $160-billion acquisition of Allergan.
It’s the second largest deal ever and has become target of political scorn from all sides for one of its primary purposes: transferring Pfizer’s legal headquarters on paper to Ireland in order to escape US taxes. But beyond the sound-bites, the deal propels global M&A so far this year to a record $4.2 trillion.
With over a month to go before the year is up, it blows away the all-time annual record of $4.1 trillion set in 2007, according to Thomson Reuters. US-targeted M&A activity, which accounts for nearly half of global M&A, has soared 55% from 2014 and exceeds $2 trillion for the first time ever.
Pfizer’s deal pushes global healthcare M&A to $649 billion, more than 2013 and 2014 combined! No other industry comes even close. Tech M&A, though it has more than doubled from 2014, is in distant second place. And Pfizer’s deal pushed pharma M&A to $416 billion, more than 2014, 2013, and 2012 combined.
Big Pharma is getting bigger. And Pfizer is the M&A queen among them: it engineered the largest two pharma deals ever, the Allergan deal and the $89-billion acquisition of Warner-Lambert in 1999. According to Thomson Reuters, six of the largest 20 pharma deals ever involve Pfizer.
Pfizer is expected to issue a ton of its overvalued shares, of which it can print an unlimited number, to buy Allergan. So in theory, the deal won’t necessitate additional debt. But there will be “large-scale share buybacks, to combat post-merger dilution,” S&P Capital IQ LCD reported, on top of the $5-billion pre-merger buybacks to be implemented over the first half of next year. Pfizer is expected to fund most of these buybacks by issuing a ton of new debt. And that “contributed to S&P’s decision today to place the AA rating on Pfizer under review for possible downgrade.”
The deal shows just how feverish M&A has become before the window closes – when the stock and bond markets deteriorate. That’s already happening at the lower end of the credit-ratings spectrum. Deals by junk-rated companies are getting in trouble as their stocks, bonds, and loans have gotten hammered.
Banks lend money to make these deals happen. Since these “leveraged loans” are too risky for banks to keep on their books, they offload them to institutional investors, such as loan funds. But now, banks are increasingly finding themselves stuck with these loans, such as those for the leveraged buyouts of software company Idera, apparel maker Fullbeauty, and generic drug maker Lannett.
Leveraged buyouts by PE firms are in particular trouble. Now banks have to offer big discounts, possibly at a loss, to bamboozle portfolio managers into taking these loans. The Financial Times:
But even discounting has not been enough – underlined last week by banks being forced to postpone the $5.5-billion sale of debt to finance this year’s largest leveraged buyout; Carlyle’s carveout of Veritas from Symantec.
The problem? The credit cycle is ending. Finally seeing some of the risks, investors are transitioning from loosy-goosy, everything-goes – a formula the Fed has espoused since 2008 through its destruction of yield – to a sense of caution or even foreboding. And they’re beginning to pull back.
Initially, junk rated energy, mining, and metals companies caught the brunt of it. But over the past two months, it spread to retail, pharma, and media companies. And this, according to the Financial Times, “has unnerved portfolio managers.”
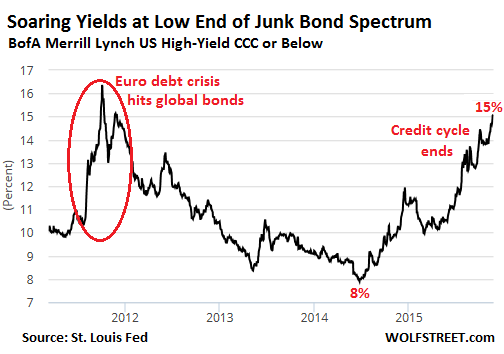
So the flight to quality, as it’s called, has begun. The least risky junk bonds (rated BB) have merely edged down as their average effective yield has edged up from around 4.3% in mid-2014 to 5.85% now, according to the BofA Merrill Lynch US High Yield index. But the bottom has fallen out of the riskiest end: junk bonds rated CCC or below have swooned, and their yields have soared from around 8% on average in mid-2014 to over 15% now:
And the Fed hasn’t even begun to raise rates yet.
Corporate deal makers and Wall Street aren’t blind. They see that the credit cycle is ending, that lower-rated companies are having trouble issuing bonds at survivable rates. They see rising defaults. They see a few mega-caps propping up the S&P 500 index, while numerous former darlings have been abandoned. And so they’re furiously making hay as the storm is moving in.
But M&A booms have consequences for the real economy. They tie up corporate resources, stifle innovation, and create bloated, unmanageable, over-indebted empires. They concentrate pricing power. They entail “efficiencies” and “synergies,” so shutdowns and mass layoffs. They’re the last leg in a bull market. And they’re always followed by deep trouble.
Moody’s has already warned about the coming credit crunch and has drawn unnerving parallels to 2008 and 1999. Read… Last Two Times this Happened, it was Mayhem.
Enjoy reading WOLF STREET and want to support it? You can donate. I appreciate it immensely. Click on the mug to find out how:

![]()
… a small point, but $4.2 trillion is between Germany n Japan’s GDP, n very far above France?
Yeah, that slipped in … and out. Thanks.
“Look again at that dot. That’s here. That’s home. That’s us. On it everyone you love, everyone you know, everyone you ever heard of, every human being who ever was, lived out their lives. The aggregate of our joy and suffering, thousands of confident religions, ideologies, and economic doctrines, every hunter and forager, every hero and coward, every creator and destroyer of civilization, every king and peasant, every young couple in love, every mother and father, hopeful child, inventor and explorer, every teacher of morals, every corrupt politician, every “superstar,” every “supreme leader,” every saint and sinner in the history of our species lived there-on a mote of dust suspended in a sunbeam.
“The Earth is a very small stage in a vast cosmic arena. Think of the endless cruelties visited by the inhabitants of one corner of this pixel on the scarcely distinguishable inhabitants of some other corner, how frequent their misunderstandings, how eager they are to kill one another, how fervent their hatreds. Think of the rivers of blood spilled by all those generals and emperors so that, in glory and triumph, they could become the momentary masters of a fraction of a dot….”
Oh yes, this is on subject. It is one of the greatest speeches I ever heard, made by one of the finest human beings I have met in my 75 years. I miss you so, Mr,. Carl Sagan
And these so called people living in that pixel like to call themselves “intelligent”.
It’s not that there are no intelligent beings out there, it’s just that they are actually intelligent enough to avoid us.
well….just you wait! If the multinationals have their way, with the passage of the TPP,TTIP, ISDS, etc., then the corps can will do whatever they want, however they want. They’re like those bulbous-headed aliens with their cookbook….coming in peace, persuading the plebs to buy into their fantasy, only to be eaten in the end!
Yes the blame lies fairly and squarely at the USA government. People go to jail for much less .
Riders on the Storm, get thee to a safe place, like a small town that has sufficient local resources to sustain its population.
Mergers are reset buttons for failing companies. They can’t grow, are shrinking or even going broke, so they target someone else’s success and feed off of it for awhile. That is some business model. When enough of them do it at once it is a failed economic system.
Good analysis Wolf. Didn’t realize that “stockholder equity is a negative $24 billion”. But hey yield hungry investors of all sorts are enamored by 3.5% dividend (never mind that can change on a dime not to mention losing your shirt if stock tanks).
I work in the biotech pharma industry. Pfizer has been a “sick” man for some time. My sister and brother-in-law both lost their cushy sales job there few years ago. Allergan tool have been in buying binge too like Inamed (my 1st job was at breast implant company literally across the freeway to old Inamed).
Anyway as long as the market teeters towards NIRP only viable option for the savers might be coaxed into risky bonds all the while trusting the good ol brand like Pfizer. Alas – what if there is tightening in the future and highly leveraged company sink in its own cesspool of unserviceable debt payments?
There are other options for savers and those are separate FDIC accounts (less than $100k each), precious metals and things you may need in the next year bought for cash. I would suggest that anyone with enough cash and a mortgage would use that cash pay it off.. Down isn’t good enough…
I try and stand back and analyze the picture. Once this huge pile of unsupportable debt starts to crumble, it will be chaotic and government will most likely call for the National Guard to quell the riots. It is just to big of a mess to end peaceably.
People are in such a fog of fantasy about all this. While they don’t trust the government, they also believe that the government will never let this huge pyramid collapse. Cognitive Dissidence in gross. Follow the crowd, don’t ask, don’t think, just believe in two opposites at the same time as if both are perfect representatives of reality.
And the money managers are the same.. Some how they believe in keeping employee costs down while giving nice bonuses to those at the top.. This is a receipt for lower consumer demand which lowers revenues into the system all the while they borrow more and more money to compensate. They consolidate larger and larger meganopolies who are less and less efficient with more and more debt to service.. More cognitive dissidence.
And the political division are also becoming so deep they are now impossible to bridge. The divide and conquer politics has become such a house divided that there is also an explosion facing us here. With neither party representing the will of the people, just the will of the competing corporate cabals. Yet people have to vote to support one cabal over the other and in the end, lose either way.
What is hard to guess is the day/week/month even year this changes. The math makes no sense yet it continues. Some day something will force the re-balancing, the reversion to the mean, but it has gone on so much longer than I ever thought probable. The pyramid has gotten so much bigger. The snap back has to be just huge.
Any “investor” who goes out on the yield curve in today’s environment DESERVES exactly what they get. Are investors gold fish with a 5 second memory or what? Personally, I have been through two bursting bubbles, with retirement funds/etc along for the ride, and they WILL NOT screw me the third go around.
Once I hit my hard, physical cash limit, I am going to Treasury Direct (rolling my savings on 30 day reinvest) and BitGold. Eventually I hope to find a business to either start or purchase – so I can work for myself.
The problem here is that “investors” think they can sit on their butt, shuffle paper, and make returns. Maybe it’s their job and “they have to dance if the music is playing.” or some equally inane tripe. They expect that they can take a modest input, compound it indefinitely, and cease to do anything productive with their life.
The problem is nothing can compound forever in a finite world. This whole idea of “retirement” is a lie precisely because it only works if the demographics make it work. Notice that all of this “falling apart” coincides nicely with demographics that are all but rolling over.
They can NIRP me for how ever much they want – I don’t care. It isn’t like they aren’t screwing me for many multiples of NIRP through food and energy inflation. I don’t get a retirement. I will have to work until the day I die. Fine. I will improve myself throughout my life, will pursue meaningful work I enjoy, will never borrow again, and I will generally squeeze the buffalo nickle of liberty until it s**ts.
Suck that BenYellen.
Regards,
Cooter
The phrase I used was “tangible stockholder equity,” which is stockholder equity minus “goodwill” and “minus intangible assets” (the expenses temporarily parked as assets on the balance sheet and to be written off later). IBM and many other M&A queens are in the same boat. These are very precarious balance sheets.
It means that every dime of cash on the balance sheet is borrowed money. And when they lose access to the credit markets, they’re finished.
But the US government has acted to keep the zombies going, crisis after crisis. And so while I agree that they are finished, in important financial metrics, they have political clout, which is one of those intangibles, that happens to be worth more than just about anything.
When they fall out of the crony club, or the crony hotel, whatever it’s called, then like Bear, or Lehman, it’s really all over. If you’re in the club, proceed directly to collect bailout. Or massive sales to gov, or like that something turns up.
I’ve been short IBM since it’s in the 160s, and it’s definitely taken a while, but now it’s showing results.
But since Uncle Warren (the biggest socialist in the US) is in it, I expect the US Government to step in and eventually bail out this “national institution.”
You are right— in a system where profits are created by monopoly pricing of life and death (the American medical system) the best investment Big Pharma can make is the purchase of political clout. Which works until the real world intrudes.
The law of Peak Debt is as mathematically verifiable as that of Peak Energy. Sustained exponential growth in consumption of a finite resource is impossible, just as is sustained growth of interest bearing debt obligations at a rate higher than real growth in economic output. At a personal level when you reach the point where the cost of servicing your debts overwhelms the ability to buy food and shelter you have reached Peak Debt and your next stop will be a shopping cart and residence under a freeway overpass.
When the combined forces of the medical extortion system and the Big Pharma drug pushers reach the point where they extract so much of the national wealth that they override productive investment as they do in the US, we have reached Peak Pharma, and it has the same effect as its companion Peak Debt.
That which is cannot be sustained inevitably ends.
” But the bottom has fallen out of the riskiest end: junk bonds rated CCC or below have swooned, and their yields have soared from around 8% on average in mid-2014 to over 15% now”
Here is another example of bond debt being fried up. Fortescue Metals just reported it has repaid over US 1.13 billion in debt out of some $8 billion outstanding over the last quarter. Bond holders were offered around 90c on its 2019 notes and between 75c and 80c on its 2022 notes.
The article I read quoted FMG’s CFO as saying the “process was well received by US capital markets” Errr…more like it was a tough pill to swallow.
So this is a new phase we’re entering where companies like FMG are reversing the play and scalping 20% from bond holders who are desperate enough to take what is on offer.
better to be approximately right than precisely wrong.
once upon a time the germans were sinking ships off the new jersey coast. times were tough then.