Number of people who newly lost their work and filed for initial state or federal UI in the week jumped to 1.43 million. A rate of 6 million a month.
By Wolf Richter for WOLF STREET.
What happened in the latest reporting week for unemployment claims was disconcerting: “Initial” claims under state unemployment insurance programs by newly laid-off workers rose. And initial claims under the federal Pandemic Unemployment Assistance (PUA) program provided by the CARES Act that covers gig workers, also rose. This means that people lost their work at a faster rate than they did in the prior week.
In terms of “continued” claims: The number of people on unemployment insurance (UI) under state programs (blue bars) declined, as some people returned to work. But the number of people on UI under federal and other programs (red bars) jumped. Combined, the number of people on UI under all programs ticked down by 199k to 28.06 million, the Labor Department reported this morning. It was the least catastrophic reading since mid-May, but still a horrendously huge number, representing about 17.5% of the labor force:
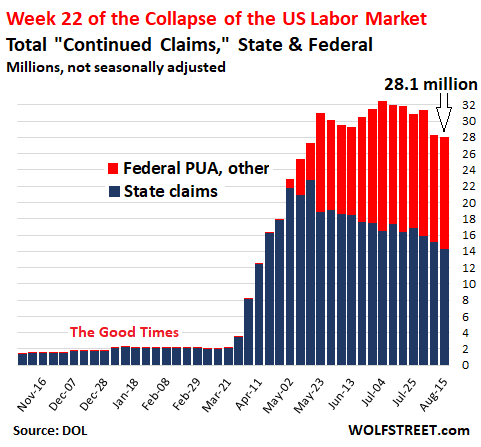
Blue columns:
The number of people who continued claiming unemployment insurance under regular state programs fell by nearly 1 million to 14.27 million (not seasonally adjusted), continuing the fairly consistent downtrend that had started in May.
Red columns:
The number of people on UI under all federal programs and some other programs – after having fallen by 2.4 million last week – jumped by 737k to 13.79 million (not seasonally adjusted), driven by increases in federal Pandemic Unemployment Assistance (PUA) claims and in federal Pandemic Emergency Unemployment Compensation (PEUC) claims:
- Federal PUA claims jumped by 502k to 11.2 million contract workers, self-employed workers, etc. who’d lost their work.
- Federal PEUC claims rose by 66k to 1.29 million.
- Extended Benefits fell by 33k to 93k.
- STC / Workshare claims fell by 142k to 309k. Under these state programs, an employer avoids layoffs by reducing the number of regularly scheduled hours of work; employees receive some wages plus a pro-rata share of weekly benefits based on the reduction in weekly hours.
- Claims by Federal Employees ticked down to 14.6k.
- Claims by Newly Discharged Veterans: ticked down to 13.9k.
The newly-out-of-work: Initial Claims, state & federal:
Initial claims under state programs, filed by newly laid off workers, caused some head-scratching this morning, because they “unexpectedly” rose – and they rose both on a seasonally adjusted basis (by 135k to 1.11 million) and on a not seasonally adjusted basis (by 53k to 892k). So we can’t blame some seasonal adjustments gone awry. This was the first increase since the week ended July 11:
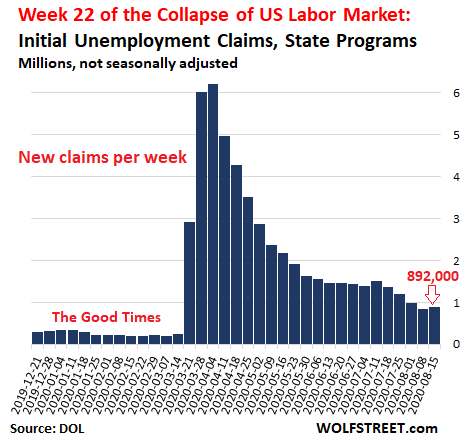
Initial claims under the federal PUA program for contract workers rose to 543k (not seasonally adjusted), from 490k in the prior week.
These state and federal initial claims combined rose to 1.43 million people who newly lost their work and filed for unemployment compensation during the week.
At this rate, about 6 million people per month lose their work and file for unemployment compensation. Thus, for continued unemployment claims of 28 million currently to stay even at this rate of initial claims, 6 million unemployed people must find new work during the month.
This is the dynamic the labor market is facing: 6 million people a month are still getting laid off, and for the labor market to improve, well over 6 million people would have to return to work.
What it boils down to.
Data chaos of the labor market continues with the two government data providers wildly contradicting each other: The weekly unemployment insurance report today by the Labor Department, which shows a still catastrophic situation of over 28 million people claiming unemployment insurance under all programs; and the monthly jobs report by the Bureau of Labor Statistics which asserted that in July, there were only 16.8 million unemployed.
There is still no clarity. But we know the labor market is still in terrible condition though the peak of the unemployment crisis is likely in the past. But today’s increase in both federal and state initial claims is a disconcerting factor.
Enjoy reading WOLF STREET and want to support it? You can donate. I appreciate it immensely. Click on the mug to find out how:

![]()
“Data chaos of the labor market continues with the two government data providers wildly contradicting each other: The weekly unemployment insurance report today by the Labor Department, which shows a still catastrophic situation of over 28 million people claiming unemployment insurance under all programs; and the monthly jobs report by the Bureau of Labor Statistics which asserted that in July, there were only 16.8 million unemployed.”
Does the Bureau of Labor Statistics count “Gig” workers, Uber and similar services workers, people who get temporary jobs from apps and so on?
They just count all those people out of the labor force when it suits them to lower the unemployment number. They’ll send the labor force participation rate to 40 before they ever allow official unemployment to be higher than 20%, but at that point angry protestors will have already burned down the BLS (hopefully) so you won’t see it on a chart.
I agree. It seems like the numbers of unemployed are lower than what I have observed. Certainly, some discouraged workers have given up looking for a decent job if they can be supported by family. Granted, in California things were better in earlier months thanks to our competent governor.
However, after I started seeing many Arizona, Texas, Florida, and other out-of-state license plates from states with many clusters of infections, California now is reporting surges in infections. Thereafter, I have heard of and seen many persons who lack work, but I do not know if they have applied for unemployment.
While many businesses have now opened tables outside (restaurants), etc., many have had no choice but to close. Thus, many, many people have been forced to either get whatever work they can get or apply for unemployment.
Additionally, I can readily believe that the delays in getting paid for unemployment claims, which I understand amount to months in California, may force people to desperately take whatever very undesirable work comes along. Otherwise, by the time that they got paid for unemployment claims, they would have defaulted on all of their debts and been evicted.
I need a quick explanation from anyone who knows the answer:
The “Continued Claims” is a measurement of the total number of people still getting unemployment. If that is the case, and without more extensions, there should be a cliff in the near future where all those claims beginning in March/April end, correct? If so, when does that happen in many states? 6 months from the initial claim?
Thanks
And if Federal assistance supposedly ended in July, what is constituting the PUA in the red area?
Mike Honcho,
The extra $600 a week has nothing to do with any of this. That $600 a week was on top of all these programs here, state and federal. PUA is the federal program that covers gig workers.
Mike Honcho,
“Continued” claims are all those people who filed their “initial” claim at least one week ago and that are still claiming unemployment benefits. In other words, they filed their initial claim at least a week earlier and still haven’t found a job.
So in theory, the total number of people claiming benefits would be continued claims PLUS initial claims (and some people add them together, but I don’t).
Unemployment insurance has a time limit. This depends on the state. All states now have a minimum of 13 weeks, and this can get extended depending on the state.
Didn’t some of the PPP expire, so that some companies which had been keeping workers “employed” had to let them go?
Under 500 employee “small businesses” got their loans converted into grants IF they kept their employees on payroll until June 30th.
500+ employees up to America’s biggest private employer, Walmart, 2,200,000 employees, get the same loans converted to grants if workers kept on payroll until Sept 30th.
October 1st is the day of reckoning for them as tens of millions more will be dumped and the company gets to keep the money.
Two week notice is required to lay off, so the bad tidings will gobsmack America mid-September. :-(
Heard a restaurant owner say his loan turned into a grant and now he owes taxes on the grant money. A lot of taxes. He says he’s sorry he bothered taking the money, it wasn’t worth it. This guy owns a lot of restaurants and has partners who now have the same tax exposure.
At least he will be turning a profit this year. A lot of restaurants can’t manage that during a non-pandemic year.
Wow!!! A guy has to pay taxes on a free money!? He is really suffering! We should forgive his taxes too!
Harold – What makes you think he was turning a profit?
Petunia,
Lawyer friend of mine who helps companies through the PPP entanglements says that indications are that the loan-forgiveness amount is not taxable.
But one thing seems obvious: companies that really were/are in trouble and really needed the PPP loans to survive, they’re losing money this year and won’t have to pay income taxes anyway.
PPP loan-forgiveness is not taxable income. HOWEVER, expenses paid for with that money are not deductible like they typically would be, equating to essentially the same thing. You will not owe any taxes if you are not profitable.
Wisdom Seeker,
We could very well be seeing some of that. October 1 there might be another wave, which is when the protections from the corporate bailout programs expire (unless it gets extended with more bailout payments).
Are the corporate bailout programs included the CCF or included in the CCF mentioned in your other article? “Corporate Credit Facilities: Buy corporate bonds, bond ETFs, and corporate loans.”
If not, what SPV do they fall under?
Lynn,
These corporate bailout programs we’re talking about here are part of the CARES Act, where the Treasury Dept (NOT the Fed) provides grants and loans directly to companies, such as airlines.
These bailout programs have nothing to do with the Fed and are not included on the Fed’s balance sheet and are not included in the CCF.
What the Fed is doing is on top of these bailout programs by the Treasury Dept.
Thanks Wolf
A lot of people were pushed off the rolls week before last, when the CARES ACT requirement to defer the looking for work requirement expired. There was no warning and they probably lost one week of eligibility. Now they are back. I doubt the numbers really fell at all that week.
And still most states insist all is getting back to normal. It’s not.
Well this is the new “normal”.
Probably will require 30 trillion on the Fed’s balance sheet to get back to the old normal.
How is it that the Labor Department reports 28 million unemployed, and the Bureau of Labor and Statistics reports 16.8 million unemployed? Are the two federal entities reporting on two different countries? What the heck?
Hoard your cash and blow out those credit cards on essentials that may not be available next month. A dizzying descent into depression awaits. The community of preppers are going to have the last laugh as they and their friends mostly survive.
The market optimists, hopium denizens, idpoliticanards and their fellow travelers are soon going to be searching for validation crumbs in the intellectual gutters of their vibrant communities.
Who would want to be in charge of this mess? What better way to deliberately lose than allowing Kamala’s nose under the Democratic tent? Less than 2% national support in the primary?
Difficult times await.
Kamala’s nose? Is that racist or misogynistic?
It’s a play on words from a traditional saying:
From Wikipedia
“The camel’s nose is a metaphor for a situation where the permitting of a small, seemingly innocuous act will open the door for larger, clearly undesirable actions.
The image entered the English language in the middle of the 19th century.[1] An early example is a fable printed in 1858 in which an Arab miller allows a camel to stick its nose into his bedroom, then other parts of its body, until the camel is entirely inside and refuses to leave.[2] Lydia Sigourney wrote another version, a widely reprinted poem for children, in which the camel enters a shop because the workman does not forbid it at any stage.[3]
ETC.
Educated people would know and recognize that. Reactionaries with nothing more in their intellectual toolkit than memorized victimization scripts wouldn’t.
Well, not all educated people would know an arcane expression from the 19th century, unless history/linguistics were one’s area of expertise and/or entertainment. I visualized it as a peaking under the tent kind of image, neither misogynistic or racist. But I can easily see how one might think differently. Those with the good fortune to not live a life painted with either broad brush might assume a “victim” response, when in fact, it could be a learned reaction, reinforced by endless everyday events big and small. Your pious last sentence might give you a nosebleed. Most educated people do not quote Wikipedia to call someone else stupid. You might do better to remember a less obscure expression…”Walk a mile in another man’s shoes”.
No. Harold’s comment is exactly what it appears to be–a sexist sneer embedded in a sort of cutsey literary reference.
I thought Wolf had ceased publishing this kind of gratuitous meanness directed at public figures.
Mary,
I missed it. I saw it only because of the reactions to it, but by that time, the reactions were already there, so I didn’t delete it because it would have automatically taken the replies to it down with it.
@KOL – point taken. “peaking” is reaching a high point. I think you meant peeking, a limited view. There are all kinds of literacy, often greatly improved by proofreading.
@Harrold says
+1
They all coming, crawling out, who want current ‘status quo’ continued with top 0.1% having more than the total of bottom 80%!
Is this MAGA?
Sorry Wolf, but i beg to differ. Camel’s nose metaphor is longstanding, tried and true. Don’t let the “woke” BS crusaders of “political correctness” take over your website as well, while the peeps of the world completely lose their collective minds.
NJGeezer,
“Camel’s nose” is fine. But that’s not the word that was used. Re-read it.
I just hope that Trump doesn’t succeed in privatizing our Post Office & killing SS & Medicare by eliminating the Payroll Taxes that fund it. But don’t worry, it will be replaced with something very very big and wonderful & very beautiful for the great American People.
And to think that I voted for this animal. Not that “Settle for Joe” is much better, but at least he doesn’t appear to be trying to throw himself across the 3rd Rail and fry the train with everyone aboard.
” A dizzying descent into depression awaits.”
Tony22,
I hope you’re wrong! But, I agree. Me and the wife have been stalking up on food (the types that store well), paper products, and gardening supplies (in case we have to expand our garden in a significant way). If you’re right, we’ll be ready (er), if you’re wrong, we won’t have to go shopping for awhile!
Oh, and .35 Remington and .22 shells. Just ’cause…
I meant ‘stocking’ up…
Good for you, MiTurn.
Isn’t it also long practiced that Mormons stock up a years worth of supplies and food?
I live in a country with a very good social safety net, (Canada), but my wife and I have always kept a large amount of stores and supplies. We have everything from months of food, to all manner of building supplies and fasteners. In fact, I have 50 lb boxes of every size of nail and screw I use. Why? We are rural. If there is a natural catastrophe, say a 9.0 subduction zone quake which is about 100 years overdue, we will be the last people helped due to simple logistics and the overwhelming needs of major centers. We accomplish this by simply buying extra along the way, then rotate. Example, I am putting on a new metal roof on my shop and wife’s studio. Since I am having materials delivered, might as well throw on some extra plywood sheathing and 2X4s.
Generator and fuel, firepumps, firehose, every tool imaginable; but if I don’t have it my neighbours will. Plus, we always save our own seeds and exchange with others. Easy enough to shell seeds while watching the Canucks beat Minnie or the Blues. :-)
Don’t forget cash and meds, just in case someone fiddles with the Post Office or hacks a bank.
This isn’t being a prepper. Preppers are loons that like to run around and play army and pretend an apocalypse is imminent. This is just rural boyscouting for adults. :-)
Paublo (above),
We’re on the same wavelength. The only weak link is stocking up on meds. I can get maybe three months out, but that’s it.
I appreciate your comments about hockey. I am a Minnesota boy who got transplanted to the hockey wasteland of Oregon (which I left 2 decades ago). Still missing the North Stars…
Sorry, meant Paulo…Paulo, Paulo
LOL MiTurn, the grocery isles are perfect for that sort of thing!
I bought 25 #’s of steel cut oats online as they do not always have them at the store. About $2 a lb. delivered.
Got three bids for a bathroom renovation. The lowest price from a contractor in yellowpages.com.
People getting $600 a week for doing nothing, other people doing nothing can not get free bread. That is politics. They should make them build hiking trails in the National Parks or other public works like during the Great Depression.
“They should make them build hiking trails in the National Parks or other public works like during the Great Depression.”
Well, this would require national leadership, which obviously has been lacking from the very earliest days of the present crisis. FWIW, Richard Wolfe (socialist economist who few may any attention to) has been clamoring for such a program since March.
But politics….since such a program might give folks the impression that government can provide solutions for people.
You’d think all states would be hiring people to process unemployment claims and maybe trace covid contacts i dunno it’s just a suggestion.
People who were getting an extra $600 a week in benefits were doing nothing because there weren’t any jobs to go to, not to mention we’re in the middle of a global pandemic where it’s not exactly safe to be out and about going to and from work, especially if it’s something that can be done from home. If anything, it goes to show how badly skewed the economy is for the working people as opposed to the upper classes. And as for getting these supposedly lazy people to build hiking trails in the national parks, why do you think AOC has been screaming into a megaphone for a green New Deal for the past year, only to gave people like yourself putting her down for even suggesting that?
Do you honestly think 44 wants to turn over the reins of the D machine to a senile old guy and a woman from California?
The correct answer is, NO he doesn’t.
Yeah, “a woman from California” really do you know who owns this place?
So Tony, are you saying that we’re about to experience an event so severe that only some preppers survive? And does that imply that most normies don’t make it?
Is there some kind of historical precedent that you’re relying on to make this statement? Or are you saying that what’s about to happen is so severe that there is no historical precedent?
Or perhaps I simply misunderstand your point.
If over 20 million people get evicted, I’d say that’s a catastrophic event. And a goodly chunk of the unemployed will be that way for the rest of their lives. I also live in the country and, fortunately for me, I doubt the tent cities will get this far out. I’m also somewhat of a prepper simply because you’ve got to be prepared for all emergencies. I’ve told everyone I know to start stocking up because it’s going to be a bumpy ride.
Jeff the obvious historical precedent is the fall of Rome. It is sad watching from overseas a once great nation that had vigour, hope and generosity become such a failing state. It is now reduced to supermarket aisle squabbles (shoot outs of course) over toilet paper. It has been rotted by opioids. It is as deeply blindly divided as the Hatfields and McCoys. And it is riddled with disease. It is coming down to the Presidents last card as his sun sets. That is a 3 letter word starting with W ending with an R. Thanks for your dream America.
Many democrats want to work together to build a better world. I don’t think they are asking for much. Police reform, letting the LGBT folks live their lives, healthcare, and some regulations on companies that pollute too much. I don’t exactly see the division from them. People keep talking about politicians as if Pelosi and the Democrats are not declaring fake news anytime someone asks why the post office isn’t working right. When police are violently beating innocent people (and some not so innocent) the Dems have largely been advocating for peace by working out the issues. The other party has been demanding that blood run in the streets for broken glass and stolen merch. Pretty sure the division is from the right.
@Not an idiot
+1
I concur: it’s very sad to see from outside the patent decline of the US: the decay of civil society, the shameless manoeuvres of deeply corrupt (intellectually as well as financially) cynical and irresponsible elites, the poisonous and divisive ideological conflicts, repression of free speech and rise of fanatical street violence reminiscent of Weimar Germany.
Rome does come to mind, but just as much Republican Rome as the Rome of the last centuries.
But this is coming to us all: I highly recommend Joseph Tainter’s ‘The Collapse of Complex Societies’ for an illuminating, just and completely apolitical perspective on what is occurring, with comparative studies of various civilisations.
As the lady pilot says in Aliens: ‘We’re in the pipe, 5 by 5’, and that pipe is terminal decline and disintegration.
It’s a long process from the point of view of an individual life, but perhaps now speeding up. ….
No Jeff, I’m saying that real preppers had a much easier time of it starting in March, the beginning of an event that has already started, than did the people lining up in a panic to buy a package of pasta, only to find the shelves bare.
Preparation is a mindset.
Look, if you prepare for the worst, tomorrow is either a relief, because it didn’t happen, or you are sitting pretty and are in a postion to help your neighbors and friends, if you so choose. Also, the money that you spent on buying stuff is ‘earning’ more as prices will go up, or the dollar will go down.
There is a noticible deterioration in quality in most retail items sold, and the selection is narrowing. That’s balanced by being able to push the buy button and have the stuff at your door the next day. How long that will last is up in the air.
Appocalypse tomorrow? Not likely, but there are going to be some ugly price/supply/public safety shocks along the way. A hundred pounds of Costco organic spaghetti fits under a cot. If kept dark, dry and cool, will last at least twenty years. The 175 bucks it cost would earn zero in the bank after taxes and if you went to buy it years down the line, it might cost double.
After all is done, take it easy and have a cold beer. Which unfortunately does have a shelf life.
Wise words.
Supply chain disruptions, collapses and quality/quantity issues are going to be a very big story going forward – very little about these matters in the MSM, of course.
Until only very recently, historically, householders who could afford to do so tried to keep at least 6 months of dried and preserved vital supplies on hand – it makes great sense in unstable times.
The oldest i can think of is Noah and his ark.
But that might be a fairytail.
(just humoring)
I think you mean Paulo and MiTurn.
This is what I and many other people do anyway if they live in a region like California north of Sonoma, Oregon and Washington where a 9+ earthquake is overdue. All bridges would be down and many roads not rebuilt for a year or even longer. Think Sumatra with it’s coastal ranges and slides- not Japan. It would take years to rebuild the main artery roads and bridges.
Tony22
I do like your word play Camels nose in to the tent / kamla’s nose in to the democratic tent . It is kind of sexist attention grabbing one. but no harm in it. I dont support democrats or their policies. I hate kamla’s politics & record in california .But if anti trump wave swing vote’s kamla in to office (“heart beat “away from being President of USA) , I will be atleast proud as Iam a Madras Tamil Brahmin myself ! Kamla Harris is from a Madras Tamil Hindu brahmin mother & carribean dad (both came to usa for PHd higher studies ) .
I trust the DOL over the BLS, the DOL has solid numbers, the BLS is a computational artifact from a survey.
Why are these people even bothering with unemployment insurance? Why can’t they just live off their Tesla and Apple capital gains?
I know folks down here in Florida who worked in the restaurant business still can’t get the Unemployment Office on the phone to get info on why their initial claims filed months ago were not approved.
Wait times are anywhere from 4- 6 hours, and when you do get through, they tell you to go online. It’s pure Kafkaesque.
Mean while Germany is experimenting with providing USD $1400 monthly UBI for next three years.
zagonostra,
UBI in Germany is a trial involving 120 people. Bigger trials have been conducted elsewhere, starting years ago, including in Stockton, CA, with 125 people ?
Canada did this in Dauphin Manitoba almost 50 years ago. They required a town of at least 10,000 or the results would be statistically insignificant. They looked at everyone’s income and topped them up to a universal standard. The experiment went for 5 years.
Results: There was an 8.5% decline in hospitalisations – primarily because there were fewer alcohol-related accidents and hospitalisations due to mental health issues – and a reduction in visits to family physicians. and: There was also an increase in the number of adolescents completing high school. Before and after the experiment, Dauphin students – like many in rural towns across Manitoba – were less likely to finish school than those in the city of Winnipeg, with boys often leaving at 16 and getting jobs on farms or in factories.
Look it up. It was called Mincome. Look for the BBC article. I would post the link but don’t want to get spammed up.
In Finland, they tried with 2000 people in 2017
what would be more hilarious is that after two years, that program blew a hole in the budget of the local government.
Can’t really see how these UBI can continue under current circumstances unless it became a federal program.
Tip For Florida Residents:
The trick to getting the govt on the phone in Florida is to press for a foreign language line. I’m not kidding. When applying for any benefits of any kind in Florida, they never answer the English line.
Obviously there is a direct relationship between the NASDAQ and the unemployment numbers.
So long as you pay people not to work, they will not work…..
When you subsidize something, you get more of it.
So you are against unemployment insurance? That is pretty brutal considering many people can not afford a $1000 unexpected expense.
“At this festive season of the year, Mr. Scrooge,” said the [one of the gentlemen], taking up a pen, “it is more than usually desirable that we should make some slight provision for the Poor and destitute, who suffer greatly at the present time. Many thousands are in want of common necessaries; hundreds of thousands are in want of common comforts, sir.”
“Are there no prisons?” asked Scrooge.
“Plenty of prisons,” said the gentleman, laying down the pen again.
“And the Union workhouses?” demanded Scrooge. “Are they still in operation?”
“They are. Still,” returned the gentleman, “I wish I could say they were not.”
“The Treadmill and the Poor Law are in full vigour, then?” said Scrooge.
“Both very busy, sir.”
“Oh! I was afraid, from what you said at first, that something had occurred to stop them in their useful course,” said Scrooge. “I’m very glad to hear it.”
A very large number of folks cannot manage an unexpected $1000 expense because they have already spent it on big screens, SUVs, sports gambling, and Starbucks. Oops, I forgot the $1000 cellphones (which they add on to their monthly cellphone bill by over-paying. Changing that mindset will require a couple of generations. Or a Depression.
Exactly, just look at the American corporate bond market: trillions of taxpayer dollars were provided to subsidize “the market” but we all know “the market” will be coming right back to the Fed shortly, looking for yet another handout.
We’ve got to break this cycle of dependency. “The market” has become the world’s worst crackhead.
Thank you, Lance Manly. People need to understand that in a society of plenty, poverty is a deliberate policy decision. Our Dear Leaders believe that fear of destitution is what keeps people’s nose to the grindstone. Society is being reduced to work-or-starve. And people that can’t work, too bad. It’s always their own fault somehow.
The various experiments in basic income all show that most people want to engage in socially useful activity when given the opportunity. That doesn’t always involve work that pays in money.
Some people might consider raising children and caring for family elders to be socially useful work. Creating works of literature, music, and visual art can be socially useful as well, but being a starving artist pretty much sucks. That sort of work might even be more important that generating profits for the boss. But not in this society, at this time.
There are always a few slackers. So what? There’s plenty to go around, unlike 10,000 years ago. Fussing over who got a slightly bigger cookie is a bad look. And for most of those slackers, potential work mates would rather pay them to stay home and stay out of the way. That especially applies to most bosses.
I’m doing socially valuable work by making conservative comments on websites. I need to be paid.
Well, here we are, mid 2020 of the great USA and everyone is clueless about where to go from here. We think the only profitable venture is owning tech stocks. Even if we had someone in government who knew how to use the next free trillions to do something productive, it’s beneath most people to commit manual labor. And those ‘lower-class’ faceless people, whom we never notice, but are willing to work for a living, with the misfortune of having a family to support, are the first to go under.
Well some people are not clueless. Same thing next quarter:
– More iPhones sold.
– More Nintendo consoles sold.
– No money for rent/mortgages.
That’s what UBI means. Universal Basic IPhones.
Worth noting that BLS unemployment metrics have always be intentionally structured as a bucket with a large hole in the bottom.
Real unemployment could remain unchanged and BLS will always report falling unemployment due to ‘discouraged’ workers dropping off their list. Not to mention counting a worker who’s replaced a full time job with a part time one as fully employed.
I am still waiting for the time when a sufficient number have 2-4 part time jobs and the BLS shows negative unemployment.
Outside New York, all the train commuter lots have been empty since March. Parking lots which hold hundreds of cars, have maybe 2-3 regular cars at most (usually the same cars every day). The trains are near empty, every day (5% capacity?).
I see no evidence of a recovery, although the roads are very crowded. Many small businesses have gone under.
Once the cold weather hits, I see many restaurants going out of business.
The cars in those parking lots are the transit employees that have to be there.
Oregon still has a large backlog of unprocessed claims. My girlfriend was laid off at the beginning of all this back in March. So far zero benefits and radio silence from the UE office. She calls daily and still hasn’t gotten through. On the plus side, the petition to recall the governor looks like it will pass!
check above in the comments- someone mentioned pressing the “button” for a non-English language number.
Check the FRB Velocity of Money charts, it’s been slowing down for years. /sarc
You know 170,000 people are dead and a thousand more are joining them every day? I know you think that macho rugged individualism will somehow protect you and masks are for fairies, but you’re and idiot so please shut up.
+1
The real # of deaths are probably double. There are thousands of “excess deaths” that are being swept under the rug.
Here in FL where I live, the books are being cooked.
I can’t fathom how the country that sent a man to the moon and back safely can’t get everybody to engage in basic science during a pandemic.
The anti-vaxxers, Q-Anon and even garden variety Republicans seem to have lost their collective minds. If the Covid-19 response hadn’t been botched by the “administration” , we’d be getting back to normal by now. Instead, the death and destruction will continue to drag out.
I guess having a competent President is actually important.
We all knew Trump would have “his 9/11″…we knew the day would come when he would face a real crisis. His response? He shit the bed…..his incompetence is deadly.
Keep in mind that a large fraction of the 170,000 were being clueless in the absence of clear guidance, back in the early stages of this.
Also note that about 2,000,000 have died naturally over the same time period. Some of the COVID folks would have been among that group even if COVID hadn’t come along.
So COVID is a problem and left unchecked it would be the leading cause of death – but with sensible precautions it’s manageable.
Some jobs & industries don’t make sense with COVID out there, but government should be finding ways to help people regain their livelihoods, not telling them they can’t have any life at all.
Where the fuck has 2 million people “naturally died” in the US over the last few months?
@wisdom seeker
‘COVID is a problem and left unchecked it would be the leading cause of death’
It is NOW the 3rd leading cause of death in USA, after cardiovascular diseases and cancer!
With politification of mask, mask shaming and ‘freedom’ to go without mask, it is on it’s way to be FIRST !
for the idiot claiming not to be:
”In 2018, a total of 2,839,205 resident deaths were registered in the United States—25,702 more deaths than in 2017. From 2017 to 2018, the age-adjusted death rate for the total population decreased 1.1%, and life expectancy at birth increased 0.1 year.”
That copied and pasted from CDC annual report of mortality, pretty easy to access these days.
VintageVNvet,
So divide that 2.839 million per year by 12, that’s your monthly rate = 236,600 per month. Then multiply by 5 months to get Widsom Seeker’s period = 1.18 million. But Widsom Seeker said “2,000,000.” Which was an exaggeration of 817,000, or 69%!! When it comes to human lives, you can’t exaggerate these number at will.
I wasn’t exaggerating, just approximating. USA has population about 320 million and life expectancy around 80 years. So in steady-state there would be about 4 million deaths per year, or 2 million in 6 months, March thru August. I should have just looked up the 2018 mortality tally. Looks like 1.5 million is a more realistic number for 6 months.
I stand behind my conclusions though. And no, COVID is not currently the 3rd leading cause of death on a monthly or weekly basis. And hopefully in 2021 it won’t be on the top 10 list, and we’ll also see a reduction in flu+pneumonia since the COVID precautions also block other respiratory illnesses.
To get COVID off the top-10 causes of death list, the annual mortality needs to drop below 47,000 per year. Need to get monthly deaths below 4000, daily deaths below 130. (And not including “deaths from other causes with COVID present”.).
For context – Influenza & Pneumonia runs ~60,000/year per CDC stats, or 5000/month. I wrote an article here a few months ago postulating that the US COVID response would balance economy vs. health and end up with COVID having a mortality level in the same general range as flu.
Currently USA is running 1000 COVID deaths per day (so it is currently 3rd leading cause of death actually). But 2 months ago there were only 500-600 per day, before everyone got stupid about taking precautions. As more of the population adapts and adopts the successful precautions, the numbers should come down. At 400/day, COVID would drop to 6th leading cause of death.
There’s room for optimism if we quit squabbling and all pull together to build a productive COVID-aware economy that puts people back to work, producing for AND protecting one another.
+100 But idiots tend to pontificate and have to make sure everyone knows they’re idiots.
Me Levy, can you please tell me exactly what your post has to do with Wolf’s article re unemployment? If you want to name call, ‘you’re an idiot’ , perhaps you should redirect your comments to a site that is currently discussing Covid matters and possibly closer to your level of intellect. Until then I suggest you strongly consider your own suggestion.
Lucky we have a fed, or there would be 28 million plus their families starving in the streets. That’s what’s happening right now in most of South America, Africa and Asia.
Instead of complaining that a few dozen got rich, let’s remember that 100 million are being helped to survive. Most of them don’t have the God-given talent to write code or provide skills valued in a modern economy.
Macro Investor,
BS. The Fed didn’t send them the money. The US Treasury did, after Congress passed the CARES Act. Do you really not know the difference???
Really? Are you that thicc in the mind? LOL. The only thing the fed did was to purchase a bunch of useless corporate Apple bonds and bring socialism for the MNCs and capitalism for the SMEs
You mean rioting and burning down mansions?
Quick, we have a moral imperative to send more aid ($$) to South America, Africa and Asia. Too many just don’t have enough compassion. After all, they’re worse off than we are.
AntiFa is the favorite ‘Boogey man’ to whip by those politically can’t stand the ‘other’ guys’ opinion.
AntiFa : Who runs this organization? Who are it’s leaders? Where it’s HQ – which city/cities? Who finances them? What’s their mission? Are they Anarchists?
Fake news recyled without factual evidence, unlike KKK, NRA!
We have such a tough road ahead. So many lives impacted by this whole mess. Independent restaurants and even some of the larger ones are being annihilated — PPP money is keeping some afloat but at mandated 30-50% capacity they lose money just by opening their doors. What happens when the weather gets colder? Already, my husband and I have not been to an indoor restaurant in 6 months. If we can’t eat outside, we don’t go.
My mother with alzheimers fell ill this spring, I couldn’t put her in assisted living with covid so I moved her in with us. And as her caregiver, we can’t afford to get sick although we’re healthy. Nursing homes / assisted living facilities must be facing revenue issues due to situations such as ours.
My daughter started back to university less than two weeks ago and they just went all online today due to covid clusters. So now the university will issue refunds for boarding. Without facility fees and sports, many colleges and universities will fold.
Online or brick and mortar — did they even have a back to school season this year for sales? I imagine many did not. Halloween, trick or treating? Forget about it. Football, tailgating? Thanksgiving? Christmas? Even family is afraid to get together for fear of spreading this virus. I haven’t seen much of my family since last Christmas. They said Q2 earnings would be bad, wait til we get Q3 and Q4.
And on and on. So many businesses and jobs will be destroyed. Sure, new businesses will replace them some day but that doesn’t happen with the flip of a switch. I just don’t see a V shaped recovery. Sure it may feel like it now because of all the fiscal stimulus, but this can’t last forever.
It’s like we had an earthquake and the tide rolled way out. Now we’re just sitting on the beach but that tide is coming back in and it will do so with a vengeance.
I speculate that I’m in a small minority who was “prepared” — plenty of food, water and such on hand — but even I didn’t prepare enough. We’re fortunate that we have a second chance to prepare for what lies ahead. Whether what we see next is loss of money, loss of supply chains, lack of product, chaos or whatever, we have the benefit of hindsight now and I hope that we use it wisely.
Yes I feel we’re all in a state of suspended animation…waiting to exhale and resume life again. I agree; I believe it’s gone but not realised yet. Yesterday I walked home from a hospital appointment through the City of London, past the BOE, down Fleet Street and the Courts, all normally packed with foot and road traffic, late lunchers packing the pubs and coffee shops…all but deserted now or reduced to takeaway. The odd open pub operating on a ‘order by app and we’ll bring it out to you’ system. No thanks!
Seriously it’s like a post nuclear apocalypse. So sad. What’s to become of all those buildings not to mention the livelihoods? But I guess the City boys can still work from Surrey so all is well.
The “Sloane Rangers” will always do well.
“[The Samoan Islands] were completely isolated from areas of human settlement, except for the Samoans themselves,…until European discovery in 1722. For yet another century contacts with the outside were seldom and then always with sailing vessels which had been at sea for weeks during which time epidemics of diseases of short duration, like influenza, had burned themselves out. Thus were the Samoans defended against epidemics – not by antibodies in their blood, but by the distances of the Pacific.”
Alfred Crosby, “America’s Forgotten Pandemic: the influenza of 1918”
Similarly, I foresaw a rather bumpy ride to come, and acted accordingly over the last decade or so, but the rapidity of events, and their magnitude, exposed certain failings in preparation, both physical and mental.
This has been THE wake-up call and a wonderful opportunity to learn – about oneself as much as anything else.
And also to observe one’s fellow humans, both individuals and institutions -not at all edifying in many case.
Time to adapt in earnest, to develop a fighting mentality, a philosophy appropriate to unsettled times, and abandon all pleasant dreams of a return to normality and good times.
@ Lt
I’ve been through similar, caregiving an elder for 7 years, so I just want to offer that I hope you take care of yourself too. It’s impossible to go it alone. When things get overwhelming, reach out to others for help. Good luck!
When the programs to help the unemployed end, there will be a disaster like we have never seen in our lifetimes. No jobs, no money, no rent, little food if the SNAP program holds up.