30-year Treasury yield looks like it’s setting up to break out past 5%. A rate cut while inflation is heating up could do it.
By Wolf Richter for WOLF STREET.
The US government sold $723 billion of Treasury securities this week, spread over 10 auctions. Of these auction sales, $483 billion were Treasury bills, with maturities from 4 weeks to 26 weeks, most or all of them to replace maturing T-bills.
The massive flow of cash into the government’s checking account – Treasury General Account or TGA – from estimated quarterly taxes, capital gains taxes, and underpaid income taxes from businesses and individuals began on April 10 and continued past Tax Day, with the TGA balance maxing out at $1.038 trillion on April 20, the highest in five years. Since then, the TGA balance has started to decline and on April 30 fell to $969 billion, still well above the treasury Department’s “desired level” of $900 billion.
In response to this flood of tax receipts, the Treasury Department has reduced the auction sizes of the shortest T-bills by $65 billion combined (4-week, 6-week, and 8-week T-bills), compared to the same week in January. But it increased the 26-week T-bill auction and all four note auctions (2-year to 7-year) this week by $30 billion compared to the same week in January, in line with its longer-term needs to raise more money.
| Type | Auction date | Billion $ | High Rate | Investment Rate |
| Bills 4-week | Apr-30 | 82 | 3.60% | 3.66% |
| Bills 6-week | Apr-28 | 75 | 3.59% | 3.66% |
| Bills 8-week | Apr-30 | 77 | 3.62% | 3.69% |
| Bills 13-week | Apr-27 | 95 | 3.59% | 3.67% |
| Bills 17-week | Apr-29 | 71 | 3.62% | 3.72% |
| Bills 26-week | Apr-27 | 82 | 3.59% | 3.71% |
| Total Bills | 483 |
Inflation rose to T-bill yields. The auctions that took place early in the week came with lower yields than the week before. But that changed on April 29 and April 30 when yields rose.
April 29 brought the Fed meeting that resulted in hawkish dissents by three voting members, and Powell’s subsequent press conference. Ending the FOMC’s statement’s “easing bias” in face of rising inflation, and replacing it with a neutral bias in the future was the topic, where the next move could then be a hike instead of a cut.
April 30 brought two disconcerting inflation releases. One was the Fed-favored PCE price index which, after already accelerating for months, jumped by 3.5%; the Fed’s target is 2%; and T-bills went through the auction earlier in the week at 3.59%.
The other was the index that tracks inflation in the overall economy, not only for consumers but also for businesses and governments. This “GDP Deflator” jumped by an annual rate of 3.6% in Q1, after having already jumped by 3.7% each in Q3 and Q4.
T-bill auctions will ramp up again when the TGA balance falls below the “desired level” of $900 billion. And that’s in the process of happening.
The influx from the tariffs has slowed after the Supreme Court invalidated part of the tariffs, and replacing them with new tariffs will take some time. In addition, the government will start paying out the refunds of the invalidated tariffs, possibly $160 billion. So the ramp-up of T-bill issuance could be significant.
Treasury note auctions increased by $27 billion compared to the same week in January. The government also sold $240 billion in Treasury notes this week, including 2-year Floating Rate Notes (FRNs).
The 2-year FRNs were sold at a “spread” of 0.103%, up from the last sale at 0.099%. Investors who bought them get an interest rate that resets every week, based on the yield at which the most recent 13-week T-bills were sold at auction. Plus investors get this 0.103% “spread” (discount margin). So if the auction yields of the 13-week T-bills rise over those two years, the yield of the FRNs will rise with them but will be 0.103% higher, unlike the regular 2-year Treasury notes that the government also sold this week, with a fixed yield of 3.812%.
| Notes & Bonds | Auction date | Billion $ | Auction yield | Spread |
| Notes FRN 2-year | Apr-28 | 34 | 0.103% | |
| Notes 2-year | Apr-27 | 78 | 3.812% | |
| Notes 5-year | Apr-27 | 79 | 3.955% | |
| Notes 7-year | Apr-28 | 50 | 4.175% | |
| Total | 240 |
All combined, the government sold $723 billion in T-bills and Treasury notes, still $35 billion lower than in the same week in January ($766 billion).
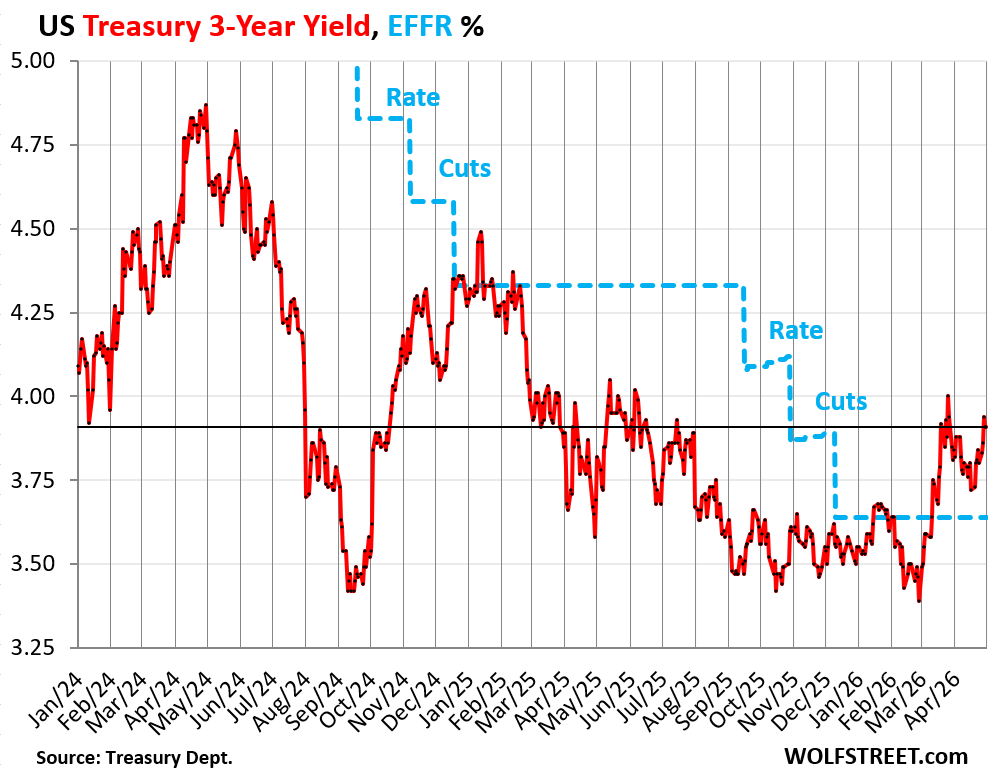
The 3-year Treasury yield was well ahead of the rate cuts and overshot substantially, falling as low as 3.42% in early September 2024, before the rate cuts even started, anticipating lots of deep cuts. At the end of February, it was down to 3.39% anticipating further rate cuts despite inflation that had been for months rising before the energy price spike. In March, it began to shoot higher.
But at 3.91% on Friday, it’s still only 20 basis points higher than inflation in the overall economy was in Q1, and does not look appealing at all amid these inflation dynamics.
The Effective Federal Funds Rate (EFFR), which the Fed targets with its policy rates, has remained at 3.64% since the December rate cut.
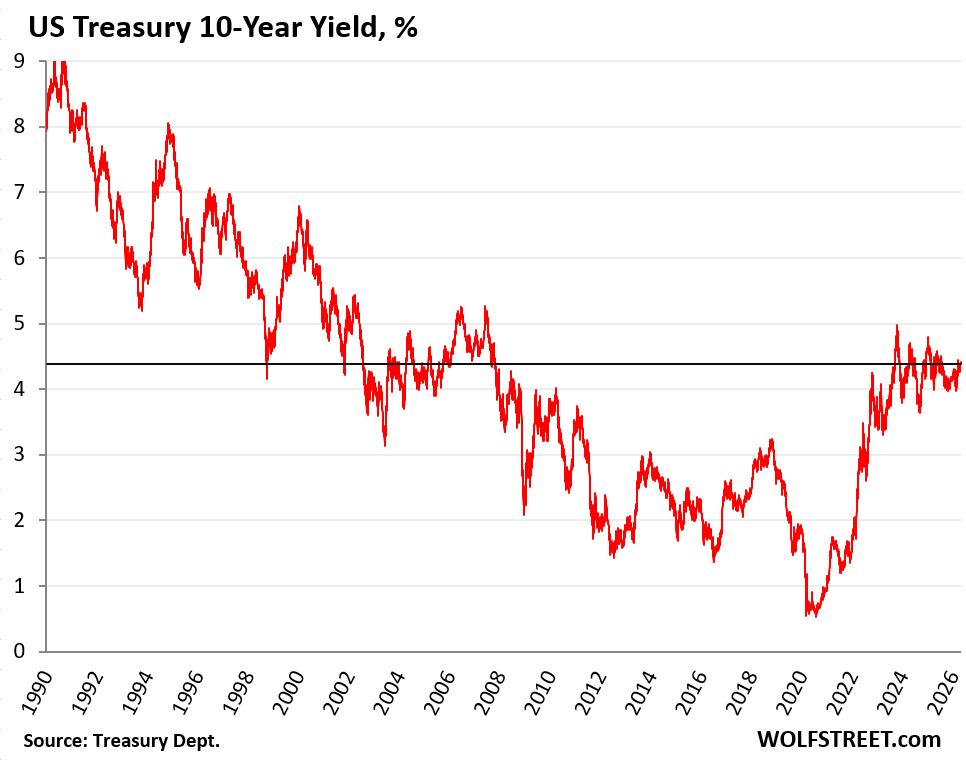
The 10-year Treasury yield rose 8 basis points during the week and ended Friday at 4.39%, after having jumped to 4.42% on Wednesday, following the FOMC meeting and press conference.
For long-term debt, inflation can be devastating if the yield is too low and doesn’t compensate the holder for the loss of purchasing power plus some.
This is the view of the 10-year Treasury yield back to 1990. From a historical perspective, the 10-year yield is not high.
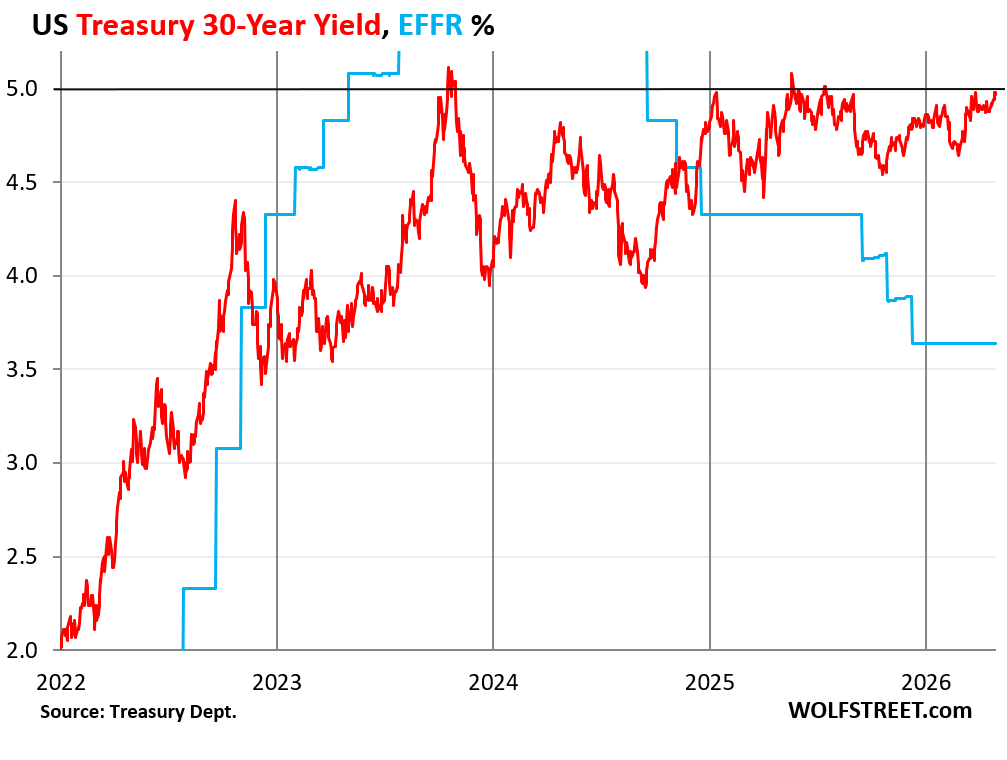
The 30-year Treasury yield had gone over 5% briefly on Thursday morning following the inflation data and on Friday settled at 4.97%. It has gone over 5% several times briefly since October 2023. And the fluctuations back down have been getting smaller and smaller.
It looks like the yield wants to break out to the upside past the 5% line. A rate cut while inflation is heating up all over the place could do it. If the bond market thinks that the next Fed, under chair Warsh, will “look through” inflation and let inflation ride, on the hopes that future efficiencies from AI or whatever will knock it back down someday, it could light a fire under long-term yields.
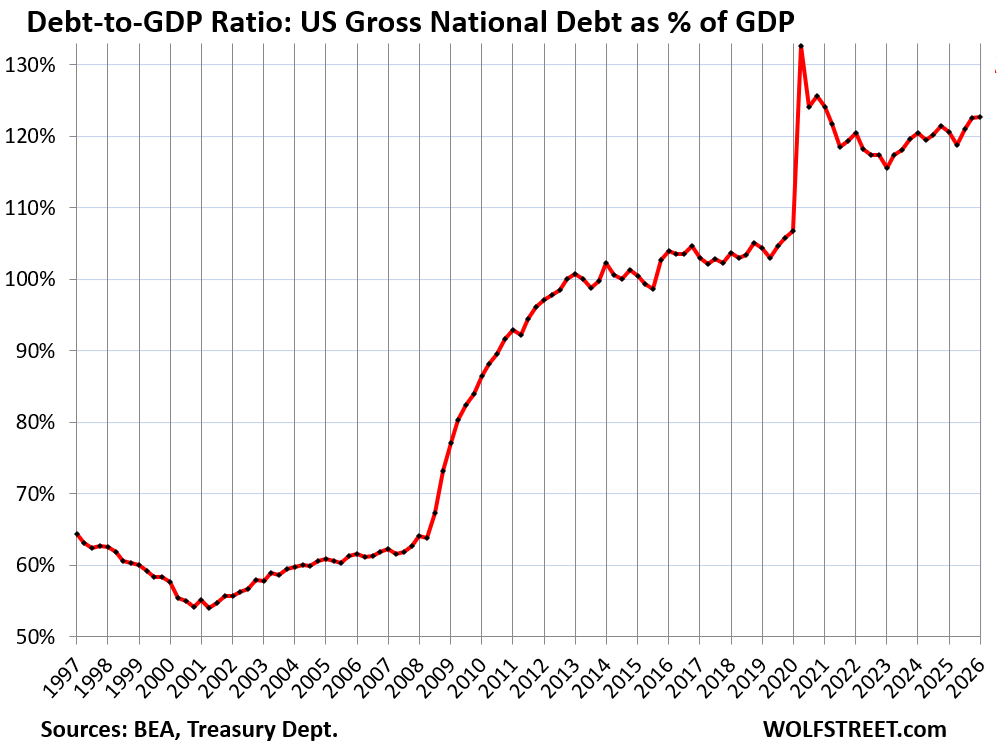
And fiscal recklessness – and the resulting surge of Treasury securities that need to be issued to fund this fiscal recklessness, and that the market has to absorb by attracting more investors possibly with higher yields – is another aspect of what bondholders have to worry about. But they’re not worrying about it much just yet. One of the metrics that tracks this fiscal recklessness is the Government’s Debt-to-GDP ratio, which ticked up to 122.6% in Q1.
Enjoy reading WOLF STREET and want to support it? You can donate. I appreciate it immensely. Click on the mug to find out how:

![]()