Big structural changes in spending patterns created winners and losers.
By Wolf Richter for WOLF STREET.
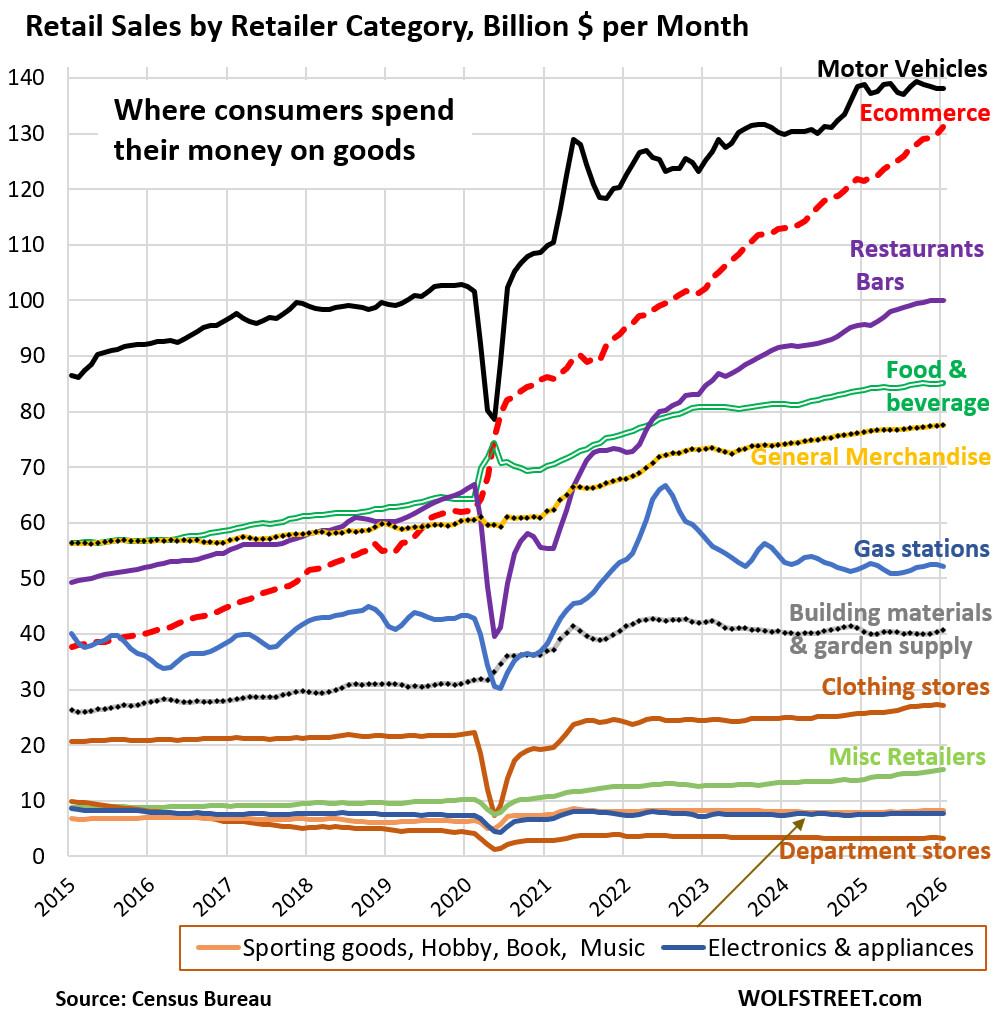
Americans spent $8.7 trillion over the past 12 months at brick-and-mortar stores and at online retailers to purchase all kinds of goods, from shoes and groceries to RVs and cannabis – up by 3.6% from the same period a year earlier, according to the retail sales data from the Census Bureau today. But how are consumers spreading these trillions around among the retailers? How has it changed since 2015? And among those retailers, who are the winners and losers?
The winner is ecommerce: 250% growth since 2015. Sales in January by “nonstore retailers” hit a record three-month average of $131 billion. And their share of total retail sales nearly doubled to 17.5%, up from 8.9% in 2015, and up from a share of 5.4% in 2003, when retailers such as Walmart were still blowing off ecommerce; that newfangled thing would never threaten their brick-and-mortar business.
But a few years later, Walmart saw it coming, and it threw its entire corporate weight behind ecommerce (and groceries), and today Walmart is the second-largest ecommerce retailer behind Amazon, and its ecommerce sales count as ecommerce sales (and it’s the largest grocery store). The rest of the stuff in its aisles, meh.
In 2020, ecommerce became the #2 retailer category behind motor-vehicle and parts dealers, up from #5 or #6 in 2015 (dotted red line in the chart). And it’s closing in on motor vehicle dealers.
Ecommerce has structurally changed how Americans shop, and Americans are not backing off. It is even making headway into grocery sales, which many people said would never happen.
Restaurants and bars are the other big winner: 105% growth since 2015. Their share of total retail sales doubled to 13.6% from 6.8% in 2015. Sales rose to a record $100 billion three-month average in January (purple line in the chart).
Americans love to eat and drink out at “food services and drinking places,” as they’re called. And they’re doing more and more of it. This is largely discretionary spending that people do because they want to, not because they have to.
Sales of restaurants and bars surpassed sales at general merchandise stores and sales at food and beverage stores before the pandemic and became the #3 retailer category. During the lockdowns, they got crushed more than any other category, but then came roaring back.
Nevertheless, they’re still losing share to ecommerce. Nothing can keep up with the momentum of ecommerce.
Motor vehicles and parts dealers are still #1 in retail sales but are getting reeled in by ecommerce (black line in the chart). They sell new and used vehicles, recreational vehicles, motorcycles, ATVs, snowmobiles, other motor vehicles, boats, tires, and parts.
Their sales rose by 61% since 2015, but that was less than overall retail sales (+71%), and their share eased to 19.0% (top black line in the chart).
These top three retailer categories – motor vehicle and parts dealers, ecommerce, and restaurants and bars – accounted for 50.3% of total retail sales.
As total retail sales increased by 71% since 2015, the retailer categories that increased by less than 71% lost share. The ones that increased by more than 71% since 2015 gained share; there were only three:
- Ecommerce: +250%
- Restaurants & bars + 105%
- Misc. retailers (includes cannabis retailers): +77%
The gains of the first two – ecommerce and restaurants & bars – are the result of big structural changes in how Americans spend their money and what they spend it on. The third was a result of the increasing legalization of cannabis retailers in more and more states.
All other retailer categories lost share.
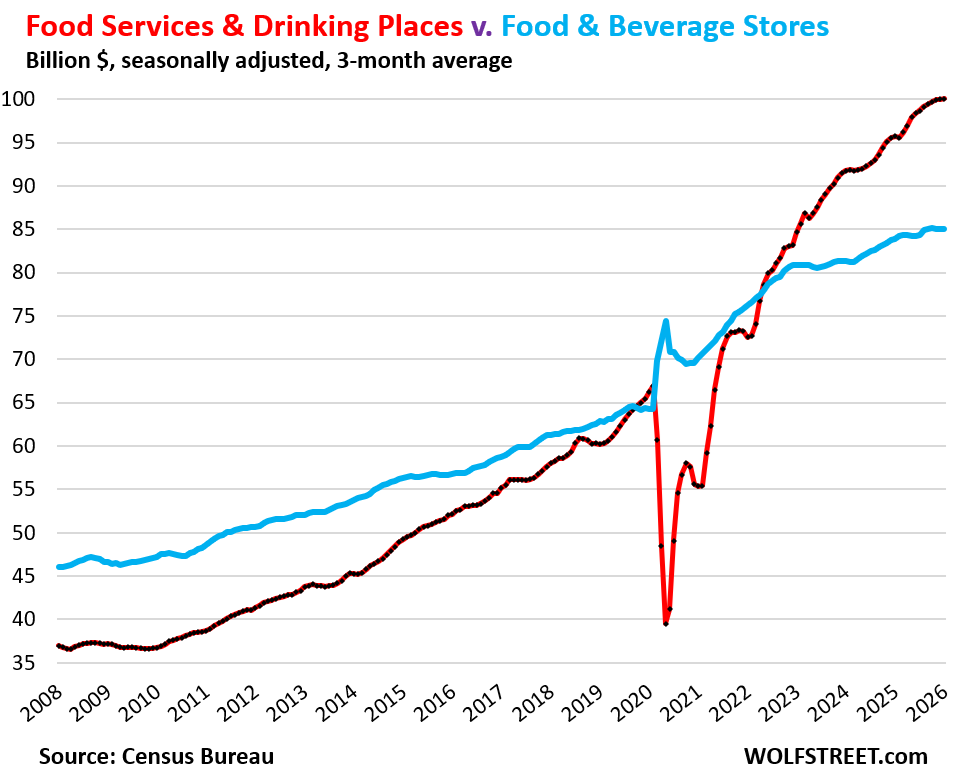
Food and beverage stores, the #2 category in 2017 and 2018, dropped to #4 in 2022 and gave up more share since then (double green line in the chart above).
Since 2015, their sales increased by 51%, substantially below total retail sales.
Some of those sales have wandered off to “general merchandise” retailers like Walmart, and some sales have wandered off to ecommerce, and they’re counted in those categories. And some of the sales have wandered off to restaurants as people eat out more often.
Here is how food & beverage store sales (blue) duked it out with restaurant & bar sales (red).
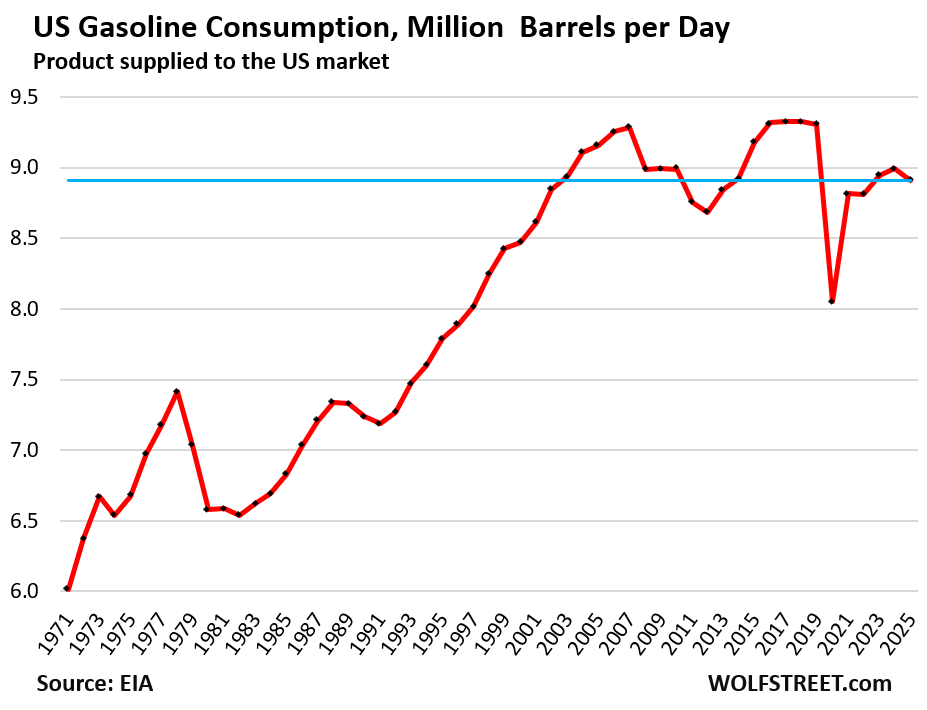
Gas station sales, the #6 category (blue in the first chart), rose by only 22% since 2015, way below the increase of total retail sales of 71% over the same period. But that increase, as small as it was, was driven entirely by the price increase of gasoline.
Gasoline consumption, measured in millions of barrels per day, fell in 2025 compared to 2015, and has been on a long-term structural decline I discussed and illustrated here.
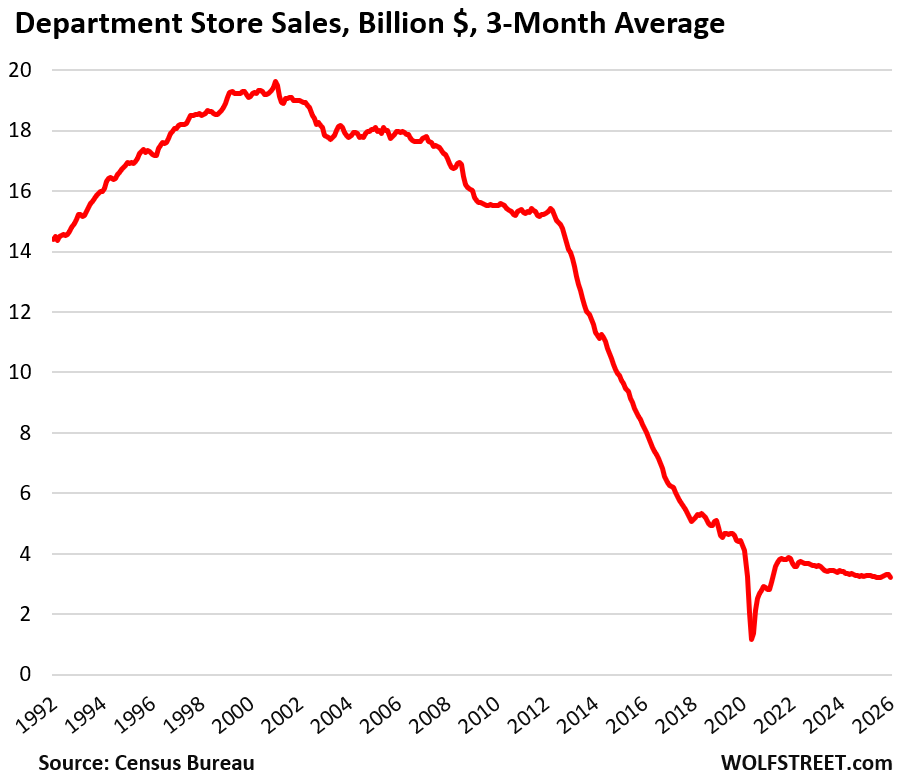
Department stores are the biggest losers (brown line at the very bottom of the first chart). They have been crushed by bankruptcies, first the independent local stores and regional chains, and then the big ones. Thousands of stores were closed. Malls became zombie malls when their anchor store vanished. This drama has been going on for 10 years. The smaller and smaller number of surviving stores are splitting up amongst each other the shrinking sales.
They were once the iconic way in which Americans shopped. Their slow demise started in 2001 when their sales began their relentless decline as people could buy anything online that a department store had – and they did, and ecommerce pulled the rug out from under them. I have documented some of that drama since 2016 in my series, Brick-and-Mortar Meltdown.
But the surviving department store chains have substantial ecommerce sales, and they’re not included here; they’re included in ecommerce sales. The chart shows their brick-and-mortar sales:
In case you missed it: Supply of Labor Fell in 2025 on Immigration Crackdown: Massive Change in Labor Market Dynamics that Explains a Lot
Enjoy reading WOLF STREET and want to support it? You can donate. I appreciate it immensely. Click on the mug to find out how:

![]()
I have to wonder if the uptick in Bar and Restaurant spending is because Americans are actually going out more often, or simply because prices have risen in this sector almost as much as housing?
Another trend I’ve noticed is how price increases seem concentrated at the low to middle range of the market. How much is a Big Mac in California today (at $20/hr. for a high school dropout)? While the higher end doesn’t seem to be as affected, at least not as a percentage of, say, the 2016 price. But then nearly everyone is succumbing to the 5 – 15% “surcharge” added to the check in lieu of adjusting the menu prices accordingly.
While we go out much less often these days, when we do it’s to a more upscale venue.
You need to read my CPI articles, which discuss inflation by product category in detail. When people see these restaurant sales, they always think that it’s only because of inflation. No:
Restaurant sales rose by 105% since 2015, and CPI inflation for “food away from home” (restaurants) was 54%… restaurant inflation was half the rate of the increase in sales at restaurants.
Food store sales rose by 51% since 2015, and CPI inflation for food stores was 31%, so more than half of the increase in food store sales was inflation.
Since 2015:
Retail sales: +71%
Restaurant & bar sales: +105%
Food & beverage store sales: +51%.
Inflation since 2015:
CPI, overall: +39%
CPI food away from home: +54%
CPI food at home: +31%
I also said in the article about restaurants: “Their share of total retail sales doubled to 13.6% from 6.8% in 2015.”
we had small family gathering with sister in town
13(3 small kids)
did take out at Italian restaurant – $120 NO TIP
still was $10 each and very little left over
we still leave around 10% tip and if it has surcharge then factor that in
have left $0 and inform manager to pay out of surcharge instead
10% tip?!? Just stay home. You should be ashamed leaving your server that
Will,
He said it was takeout. 10% is ok for takeout.
Actually $12-15 an entree for takeout isn’t bad.
That’s a huge douchebag excuse, period. Make your own food at home. Ignorance of the fittest. God knows hmyou wouldn’t last 1 day in that industry
With takeout, they get to see your tip *before* you have your food.
Thanks, Wolf. Very enlightening.
This helps explain why everyone is broke. With all the crowing about affordability crisis, people are spending more and more on the ultimate discretionary expense — going out to eat (and drink).
The base price of a cocktail is now around $15 for a well drink, more for call liquor. While the price of a bottle of booze in a store hasn’t seemed to have budged, if at all. This would suggest more of service sector inflation than a producer one, no?
“This helps explain why everyone is broke.”
You didn’t even read my comment carefully enough to understand that restaurant sales rose at TWICE the pace than restaurant inflation over those 10 years.
That’s just the same inane BS over and over again. All Americans are broke, they’re all living from paycheck to paycheck in cardboard boxes, etc. Just dumb BS.
INCOMES HAVE SURGED over those 15 years, and faster than inflation. Disposable income has risen by 73% over those 10 years, inflation by 39%.
I absolutely love information. I consume quite a bit, I truly appreciate you wolf! The time you take gathering all the information, along with presenting what you have learned. I wish there were more people that cared like you do about your craft! My good man you are a craftsman the way you build your articles! Thank you for giving us the knowledge that is power and also drives away fear with fact!
I’ve found the higher end to be affected just as much.
My theory is that more people are going out because they feel, rightly or wrongly, that housing and other assets are getting away from them, and just figure they’ll live for the moment.
High housing prices is one of the biggest problems in the modern economy, in my opinion.
“High housing prices is one of the biggest problems in the modern economy, in my opinion.”
I’d add the cost of healthcare/health insurance and child care to that list.
Agree. Poor government policy has led to massive asset inflation and a rise in the cost of “adulting” like housing, child care, health care, and insurance, so some young people just delay it and do other things with the money.
Asset inflation definitely has been the way to go- especially since 2008.
I wonder if you broke down a child care center’s business costs.
Revenue, Salaries, Profit etc.
Where might the money go? And are they making money hand over fist or is it maybe employees and insurance that are so expensive to the business?
there actually is a mega trend in progress as pointed out by wolf
The winner is ecommerce: 250% growth since 2015. Sales in January by “nonstore retailers” hit a record three-month average of $131 billion.
I can’t believe this site doesn’t have 50 times the subscribers it has now. And I’m not exaggerating. I’ve consumed tons of macro content and have now whittled it down to a select few, with Wolf Street being one of them. Thanks Wolf, not only for your articles, but taking the time to respond and correct erroneous comments.
Totally agree. It’s so much better than WSJ, and every other newspaper for online research-based articles.
Wolf street is the only site I read any more. No BS here.
The only site I consider informative. The rest of them are entertainment to me.
I guess if you’re consuming cannabis, you’re gonna get the munchies and want to go out to eat and drink, and then be too tired to shop at a store, so you use e-commerce.
Does ordering a pizza on your couch constitute going out to eat? Honest question
Why does your couch need a pizza?
/s
Excellent article and very interesting stats. I live rural and absolutely love E Commerce. It reminds me of when rural folks, 60 years ago, would order entire wardrobes and all household needs from the Sears Catalogue to arrive before school started….or in time for Christmas. Now? Even with no direct delivery my friend the mail lady makes it happen with her smile, and you can track the route and arrival in almost real time.
I can see buying a new vehicle online if you know exactly what you want, but used? Not me. It would be fantastic to skirt the auto dealerships and nix the constant email bombardments for their overpriced service centres, but used? Modern ICE are/is fantastic quality. You don’t even need to check fluids for God’s sake. But no to online used vehicles. Too big of purchase, only second to buying a home.
Online is fantastic for just about everything else, imho. Amazing service for those who hate shopping and wasting time driving to stores, etc. Cheers
As noted in the WSJ today the days of fast FREE shipping from e-commerce vendors are ending so I expect a flattening of the growth and possibly even some decline in the channel over the next few years.
The key words are “FAST free”… The same WSJ article said that consumers don’t mind if the shipment takes a few days longer, and they’re ordering that way to keep shipping free. It’s not that consumers order less, it’s that they don’t mind waiting a little longer to get free shipping, and that the shift by online retailers to SLOW FREE shipping is working. It helps to read more than just the headline.
The cost difference between FAST and SLOW delivery is huge, I know that from the Wolf Street mugs I send out. If I were to ship them overnight, the cost would be about 10x as high as shipping them “within 5 business days.”
Oh wolf have you tried pirate ship?
Great discounts on shipping
Astounding really
Their software is for UPS. Being a commercial shipper, I get a discount from UPS and from FedEx. But after my discounts, UPS turned out to be a lot more expensive on average than FedEx OneRate in a FedEx Pak. UPS prices by zone. FedEx OneRate is the same rate anywhere in the US. If I just ship within California and especially within the Bay Area, UPS would be a little cheaper, but only a little. But too much hassle to deal with both.
Amazon now offers a 3 hour delivery window here in Raleigh-Durham. For $4.99 extra.
3 hours! Wow
I think this article clearly shows that Americans won’t have to choose between food and gasoline for the extra money to get their tanks filled.
Well that all depends on what one’s understanding of what constitutes an American whether it be the average or the more accurate statistic, the median.
The wealth inequality has distorted the shape of the actual normal distribution to the extent that predictions based on the normal distribution. like AI are unreliable.
I dunno, I’ve taken my busy self to Costco gas this week.
And I really dislike lines. Even Costco here in Raleigh has gone up 20%. Kroger gas like 35%
It is amazing how many of my tenants get their morning coffee delivered by DoorDash. Many (especially white males) also get dinner delivered every day they don’t eat out. It is crazy how many young white males will move out after two years and it looks like they didn’t use the stove even once. The Indian software guys that bring a wife over are the opposite and they use the stove so hard that is is cheaper to just dump it and buy a new one than try to clean the thing after two years of heave use.
Perhaps white males clean the stove before moving out? Is that even remotely plausible?
I have always cleaned my stove,am I doing something wrong as a male?
You’re doing great, 1911.
I also clean my stove and cook at home. Who wants overpriced cold food delivered? If I am going to spend money I’d rather go to a restaurant with a nice bar with pretty women.
There is a limited number of white males that would not even use the oven
I am not sure where you are located, probably near tech areas. When you are young, free and single techie, you have lots and lots of disposable income. Half of the time, your company feeds you or eat somewhere nearby. The currency is time. It is not worth for them to go shopping and to buy nutritious food to cook and to prepare. When they do go shopping for food, they will buy ready to eat/cook meals. Next time, pop in a grocery popular with techies, you will see the choices these kids have, let alone DoorDash or other delivery.
On the other hand, these Indian guys are probably H1-bs or L-1. If they are single, they go to the Indian versions of white guys. These guys do not know how to cook. There can be cafeteria style Indian restaurants/grocery/delivery nearby the companies. If they bring home a missus, she has nothing but free time, since she can not legally work here. She will cook, shop, clean, etc and most likely have a puppy or two if she can to anchor. Those guys will get even fatter and use up your kitchen. Notice the difference between single and married guys.
Cannabis? Not a growth business, friends. There is some substitution for
alcohol, but like the trend with younger people and alcohol, cannabis is
for older people and the addicts. Harm profile is getting more apparent
now, especially with younger users. Good luck.
There’s also an economy of scale with buying groceries and cooking.
When I was single long ago, I would buy deli sandwiches, Thai food specials and things like that. I wasn’t spending much more than if I cooked
Microwave Ovens, my socially blind but rich friend…..see Sinclair Lewis quote on income vs social facts.
I unplugged or shut off gas in my stove when I move in…..to; (1) avoid accidental fire, (2) avoid nasty cleaning fees (likely done by poor immigrants) and loss of deposit…….for what it’s worth, I have only been given my partial deposit back a couple times in many years and many apartments……usually got nothing……landlord always got…richer.
Yes, before microwaves were so cheap I did use stoves….sparingly.
One of my MANY jobs during the 80’s recession was quick and dirty fixing and cleaning/painting for a realtor who owned several single family homes…..for min wage.
Bye-Bye deposit, and rent goes up on new stove?
What, exactly, wears out?
Microwave.
Haha I used my stove super hard too. lol
That’s funny. It’s cheaper to cook!
“.. motor vehicle and parts dealers, ecommerce, and restaurants and bars – accounted for 50.3% of total retail sales.”
Quickly, sell your car, and buy triplе-short semiconductor ETF.
Is there data that breaks apart e-commerce? It’s become such a huge category that it’s a very different situation than 2015.
Yes, experimental data from the Census Bureau. The data is quarterly and has gaps and is incomplete. I rarely post it because few people read it and because the data is incomplete and experimental and has to be caveated appropriately. but it is interesting. Last article I did was was in August when the Q2 data was released:
https://wolfstreet.com/2025/08/19/where-americans-spend-1-2-trillion-a-year-at-ecommerce-retailers-and-how-that-changed-over-time/
These are the only four groups that don’t have big gaps:
Every once in a while I’ll be out and about and give real-world retail a try:
– Casual clothing store: “we don’t have that in your size”. Bought online.
– Suit store: wait 15 minutes for service, left when no one showed up. Bought online and took to neighborhood tailor/drycleaner for alterations
– Hardware store: Didn’t have the type of tube light I needed, or I have to wander the giant box store for 20 minutes to buy the $1 box of hex nuts I needed. Bought on line.
And if I do find my size or the gadget I need in the real-world, the check out process is so bad (or self check out) it makes me avoid retail even if they have a good chance of having what I need in inventory.
The convenience and inventory of on-line just makes buying stuff so much easier that way, which is creating a negative feedback loop for real world shopping.
Happened to me too. Time after time. Including at our local hardware store, which now has more kitchen items than actual hardware. Those places are useless. Now I’m down to buying almost nothing other than gasoline and some food & drink at brick-and-mortar stores. We even switched a substantial part of our food purchases to ecommerce because it’s cheaper, and because we can get types of fish and produce that we cannot even get at any regular store, such as at Trader Joe’s, Safeway, or Costco. Try to get some pompano, mackerel, mackerel pike, smelt, hamachi collar, shishamo, etc. No regular store has them. I could go maybe to a fish store in Chinatown but that’ll take an hour, and they might not have it either though they have a lot of stuff that’s good, and they have pretty good deals. The online-only food retailer we use is a Bay Area operation (they expanded to other areas too), and if you get your order in by deadline in the afternoon, they deliver the next day. They don’t ship, they deliver, often using their own staff, and sometimes contractors, and delivery is free if the order is over a certain amount. And I’m older than dirt, set in my ways, I’m not an early adopter, and just sick and tired of wasting time in brick-and-mortar stores.
Yes. Every time I go to a real store other than Costco or Publix I live to regret it. The other thing you left out: bad behavior from other customers, whether in the parking lot or inside.
I just don’t have the patience anymore.
Howdy Youngins This 68 year old fool now spends most of his $$$$ by e commerce. Online deals seem to be cheapest rather than at a brick and mortar store. You can get online discounts at auto parts stores cheaper than going into the place too. Walmart gets most if not all my grocery $$$$. Just bought a brand new car online and got the best price ever. 20 % off the MSP. I did have to then go to the dealer and pick it up though.
What brand model? Did you offer the dealer a lower price online and they accepted? Used it new? Private dealer?
Howdy Jake. I hope Lone Wolf does not get mad. Check out Doggett Ford. They are in Houston TEXAS. Then check the vehicles listed. I called and talked with a salesperson and sure enough, the prices listed were for real. I went in and bought a new car for the best price I ever got on a new car…
Thanks bubba. I am in Philadelphia but love the people in Texas. Those giant gas stations buckee are intense. We went to Houston a few years ago to visit, very nice and huge zoo down town. Very hot in summer
Howdy Jake. I full time RV and am hanging in Galveston for the winter. I saw the online prices for a new vehicle and could not believe 20 % off of list and YEA HAW. I could not resist…..
I am old school and fairly archaic in my ways, but I have to admit ecommerce is pretty darn convenient as well as all the other advantages described by commenters.
Is this true?
So yesterday I asked AI, how much a mile per ownership time is per mile driven.
It spit out something like 50-75 cents a mile.
Then I said how much is a mile driven when the car is financed?
It says $1-$1.50 per mile.
It was just a random thought, but does financing a car add that much cost over the life of the car?
Perhaps some data point was off
Depends on how much you drive. If you drive 1 mile per month, and pay $600 a month in interest on your car loan, then your cost per mile is $600.75 per mile. So that’s on up there. If you then double your mileage to 2 miles per month, the cost per mile collapses by 50% to about $300.38 per mile. Now imagine your cost per mile if you drive 10,000 miles per month …
That’s how it goes with fixed expenses. The more you drive, the less they are per mile. But variable expenses, such as gasoline and maintenance, increase in parallel with the miles you drive, and remain the same per mile.
Ahhh yeah ok. Nice
Gonna squirrel away some cash in a cd for the next car to avoid the financing a bit.