Domestic private demand, without government and trade, rose by 2.4% adjusted for inflation.
By Wolf Richter for WOLF STREET.
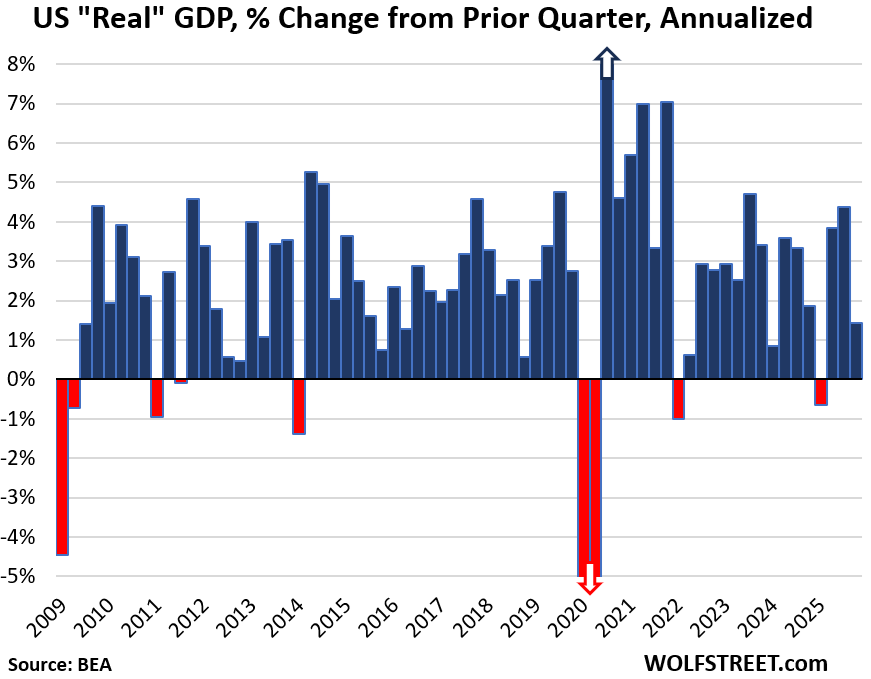
Gross Domestic Product, the broadest measure of spending and investment in the economy, grew by an annual rate of 1.4% in Q4, adjusted for inflation (“real” GDP), after the 4.4% growth in Q3, and 3.8% growth in Q2, according to the Bureau of Economic Analysis today.
Accelerating inflation was a big factor, and the inflation adjustments were the highest in two years. Not adjusted for inflation, “current dollar” GDP rose by 5.1%.
The other big factor was the plunge in federal government spending and investment due to the longest government shutdown in history.
What slammed “real” GDP?
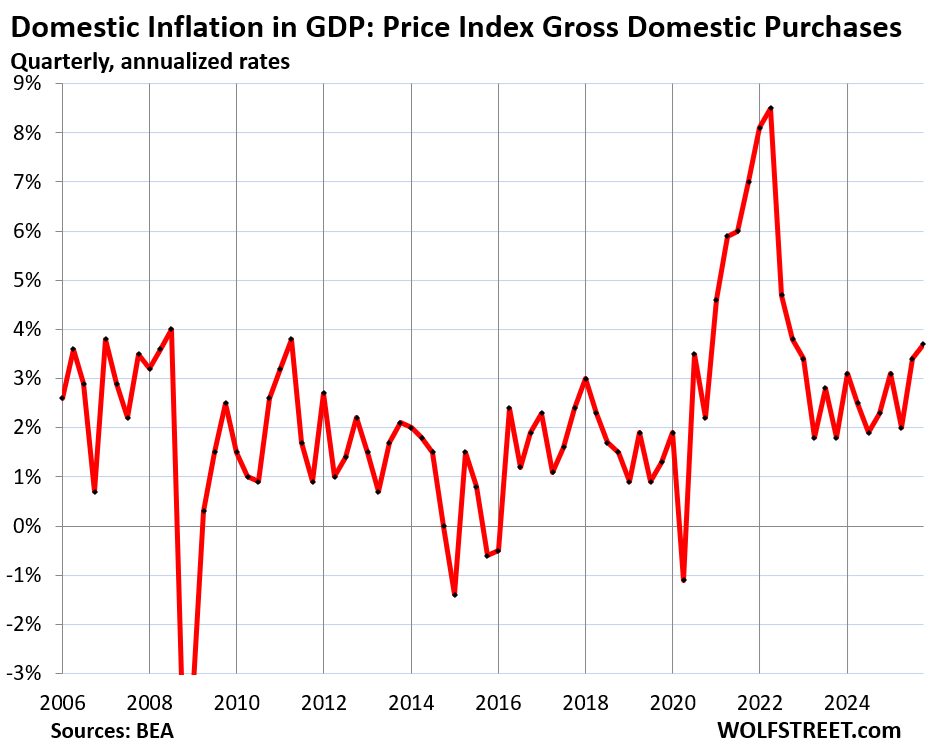
Hot inflation adjustments. The inflation measure for the overall economy, the GDP Price Deflator rose by 3.7% in Q4, after having already risen by 3.7% in Q3, both the hottest since Q1 2023.
The Price Index for Gross Domestic Purchases, which reflects inflation adjustments in GDP except for imports, so domestic inflation, accelerated to 3.7% in Q4, the worst in three years.
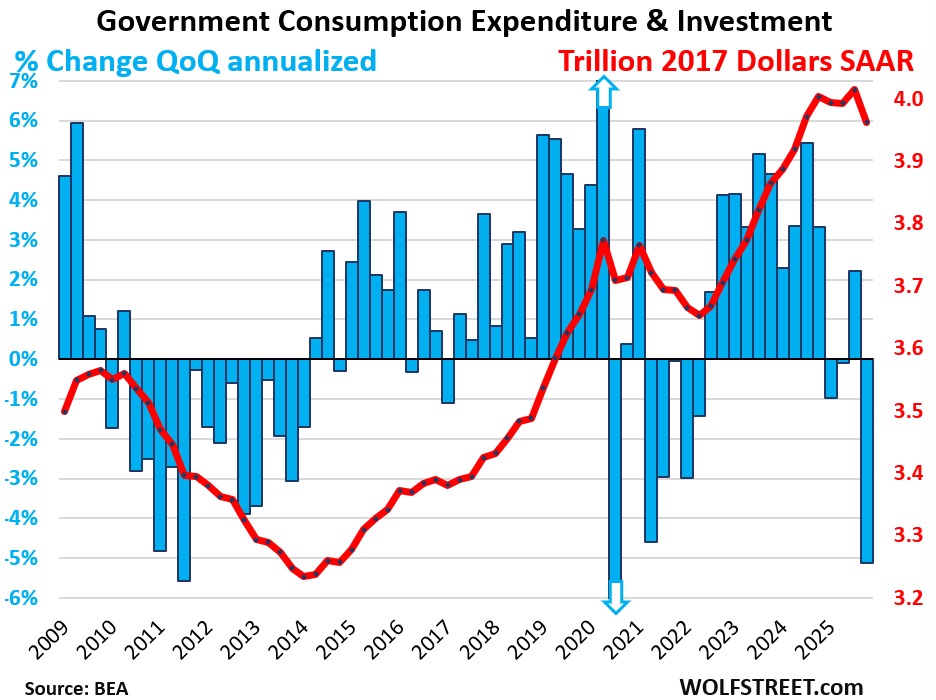
Plunging federal government spending hit real GDP. Government consumption expenditures and gross investment plunged by 16.6% as a result of the longest government shutdown in history: Nondefense spending collapsed by 24.1%. Defense spending plunged by 10.8%.
The plunge in federal government spending subtracted 1.15 percentage points from real GDP growth of 1.4%. That’s a huge hit.
This does not include interest payments. And it does not include transfer payments directly to consumers (the biggest part of which are Social Security payments), which are counted in GDP when consumers and businesses spend these funds.
State and local government spending rose by 2.4%, and contributed 0.25 percentage points to GDP growth.
Combined, federal, state, and local government consumption and investment fell by 5.1% and reduced the GDP growth rate by 0.9 percentage points.
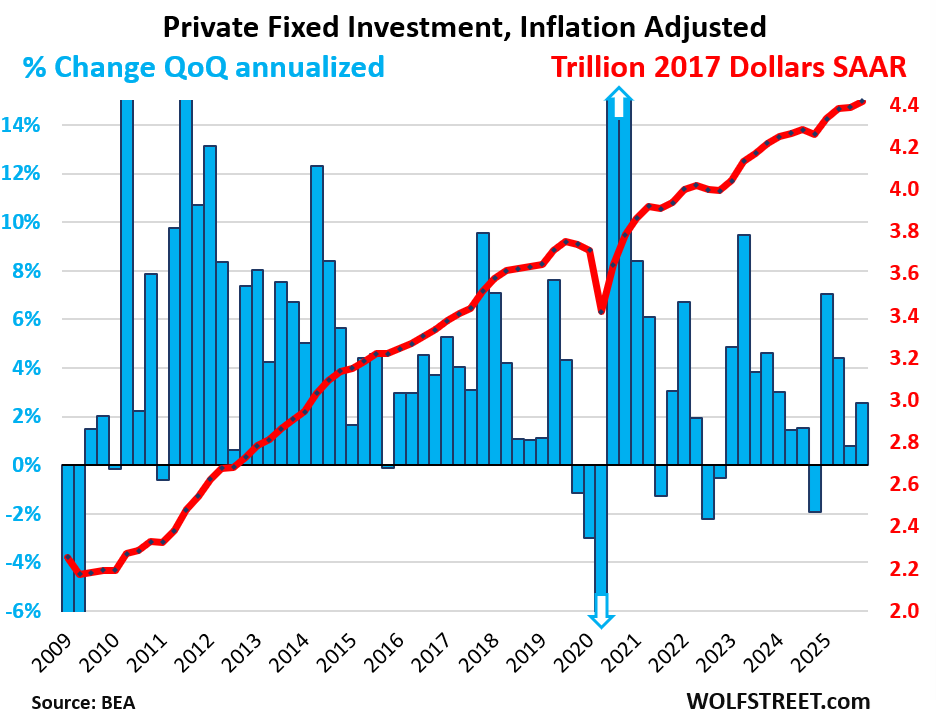
The blue columns show the growth rates (left axis), the red line shows the dollars (right axis), all in seasonally adjusted annual rates (SAAR):
What boosted GDP?
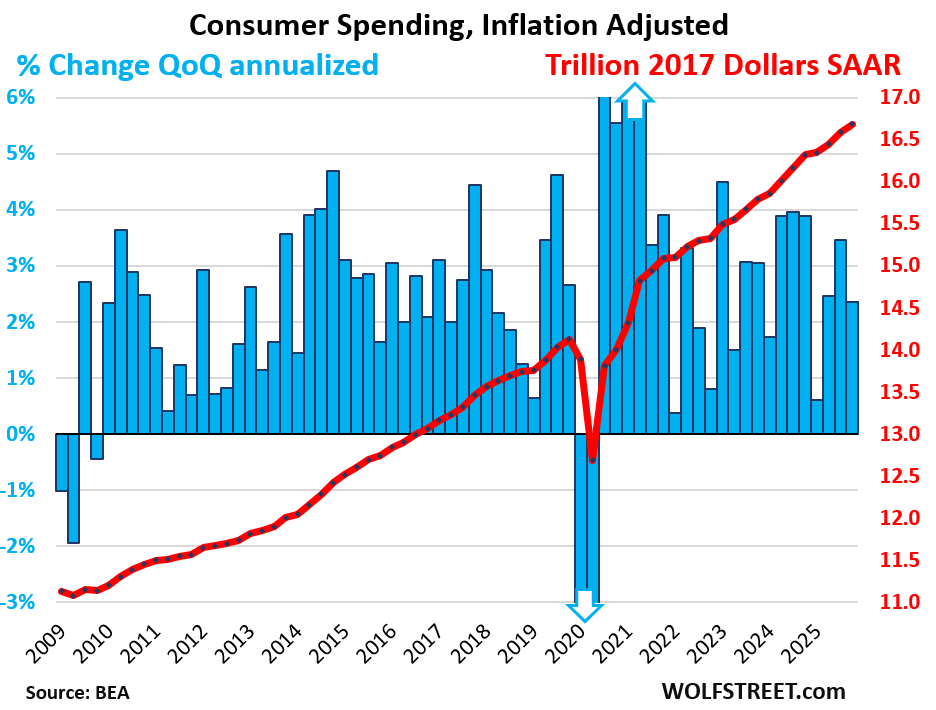
Consumer spending boosted GDP growth. Adjusted for inflation, personal consumption expenditures rose by an annual rate of 2.4% in Q4, despite the government shutdown that had rattled so many nerves.
This growth rate added 1.58 percentage points to the GDP growth of 1.4%.
Consumer spending accounted for 69% of the US economy.
The spending growth came from services (+3.4% adjusted for inflation), with spending on goods dipping a hair (-0.1%):
The blue columns show the growth rates (left axis), the red line shows the dollars (right axis), all in seasonally adjusted annual rates (SAAR):
Private fixed investment boosted GDP growth, rising by 2.6% in Q4, adjusted for inflation. Of which:
- Nonresidential fixed investments: +3.7%:
- Structures: -2.4%
- Equipment: +3.2%.
- Intellectual property products (software, movies, etc.): +7.4%.
- Residential fixed investment: -1.5%.
Private fixed investment accounted for 18% of the US economy.
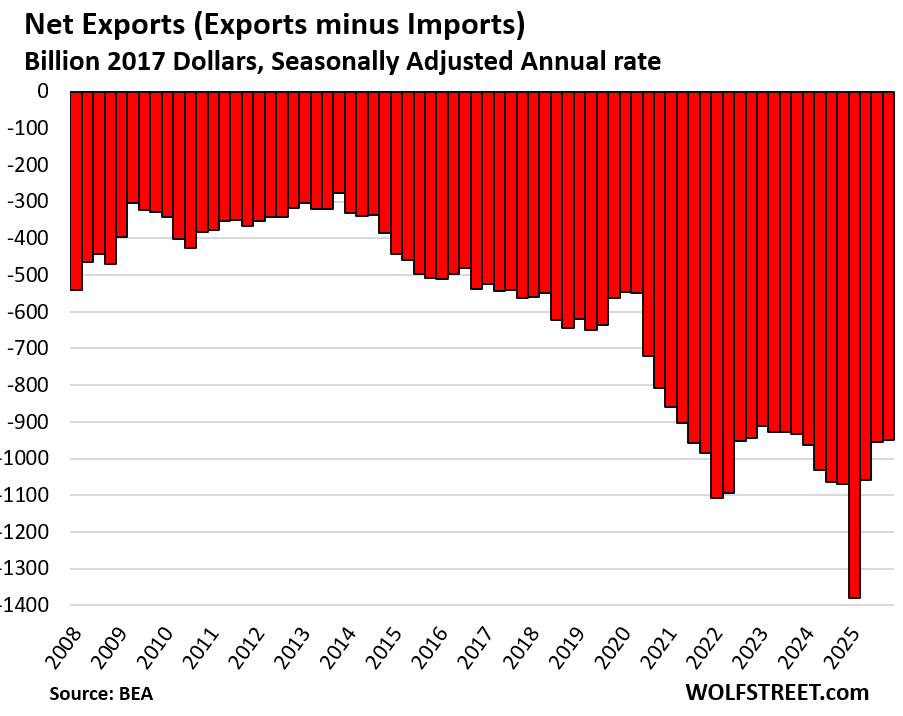
Trade deficit improved and boosted GDP. Net exports (exports minus imports) were the least bad since Q4 2023 and improved by 11% from Q4 a year ago.
Imports dropped by $12.2 billion from the prior quarter, adjusted for inflation, with imports of goods dropping by $20 billion.
Exports fell by $6.3 billion.
And “net exports” (exports minus imports) improved by $5.9 billion, adjusted for inflation, the third consecutive quarter of improvements. The Q1 trade deficit had been the result of massive frontrunning of the tariffs.
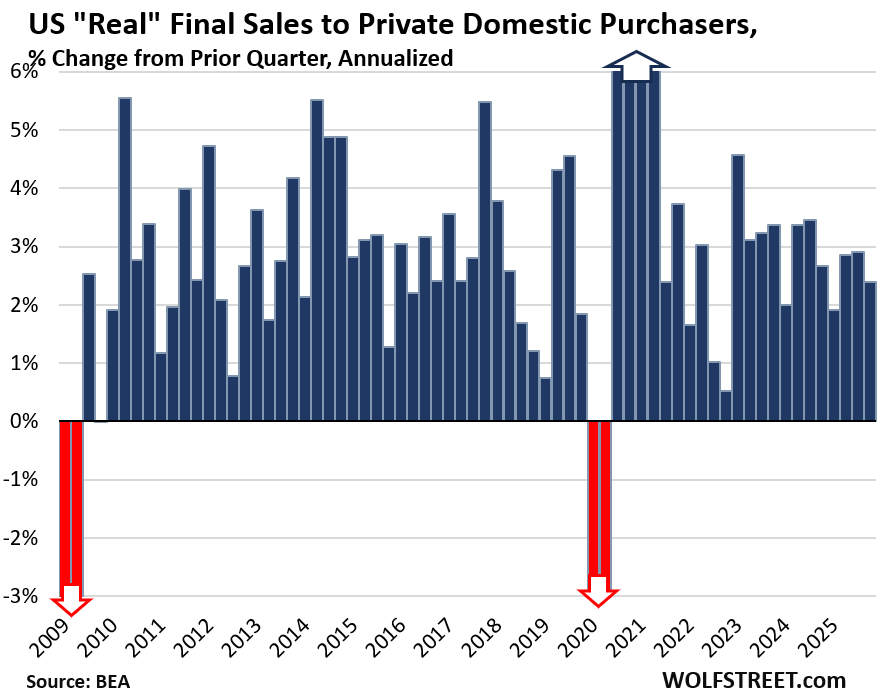
GDP without government and trade deficit.
“Real Final Sales to Private Domestic Purchasers” rose by 2.4% in Q4, adjusted for inflation. Solid domestic demand, despite the big inflation adjustments and the jitters caused by the government shutdown.
The measure is part of the GDP report today and tracks demand in the private US economy. It excludes exports, imports, government consumption expenditures and investment, and changes in inventories. It covers about 87% of GDP and represents the core of the private US economy.
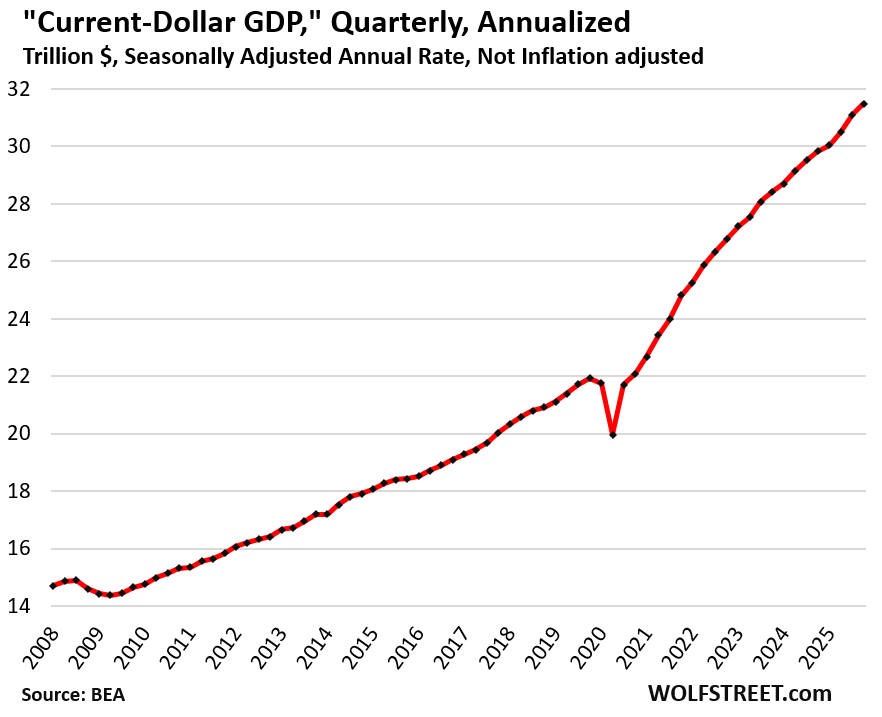
Not adjusted for inflation, “current-dollar GDP” grew by an annual rate of 5.1% to $31.5 trillion, after the 8.3% growth in Q2.
This “nominal GDP” represents the actual size of the US economy in current dollars and forms the basis for the Debt-to-GDP ratio and similar GDP-based ratios.
Enjoy reading WOLF STREET and want to support it? You can donate. I appreciate it immensely. Click on the mug to find out how:

![]()
This is the only place to get real facts. Thank you
With tariffs under the International Emergency Economic Powers Act now eviscerated, unless the Trump admin can make good on their prediction/promise that they will find other statutes to support executive- ordered tariffs – the trade deficit will go back up, maybe to even higher levels.
They have lots of other options, one of which Trump already invoked, section 122 tariffs, as explained in the opinion of dissenting justice Kavanaugh:
“The decision might not substantially constrain a President’s ability to order tariffs going forward. That is because numerous other federal statutes authorize the President to impose tariffs and might justify most (if not all) of the tariffs at issue in this case—albeit perhaps with a few additional procedural steps that IEEPA, as an emergency statute, does not require. Those statutes include, for example, the Trade Expansion Act of 1962 (Section 232); the Trade Act of 1974 (Sections 122, 201, and 301); and the Tariff Act of 1930 (Section 338). In essence, the Court today concludes that the President checked the wrong statutory box by relying on IEEPA rather than another statute to impose these tariffs.”
Good info. Thanks. I am an attorney, but I did not read the decision.
BTW – my experience is that the general press does not provide good insight into court decisions. Reading the opinions, and the dissents, is really necessary to understand, which you did !
Talking about options. Was the big beautiful bill a good thing to reduce deficit?
The Section 122 tariffs can only last 150 days without further approval by the US Congress and that certainly won’t happen.
If I’m the greatest negotiator in the history of the world, I go to congress and make a deal.
Kinda like other great presidents have done before.
Bullsht walks. When the curtain is opened on the great and powerful Oz, what was there?
Kavanaugh had to spell it out for the prez staff….
🤣 That did occur to me too.
But Bessent had mentioned them already weeks ago as an alternative.
Actually, they talked about the alternatives months ago. They went with the emergency act as it gave them an ability to instantly charge a tariff without any required paperwork and bureaucractic shuffling required by other statutes. In one sense, the SCOTUS gave them time to put that all together by taking so long to make its decision.
The principal dissent surmises that the President could impose “most
if not all” of the tariffs at issue under statutes other than IEEPA. Post,
at 62 (opinion of KAVANAUGH, J.). The cited statutes contain various combinations of procedural prerequisites, required agency determinations, and limits on the duration, amount, and scope of the tariffs they authorize. We do not speculate on hypothetical cases not before us. -John Roberts
The slope change of the “Current-Dollar GDP” curve from pre-2020 to post-2020 is frightening, considering that population is growing *much* slower post-2023.
Wolf, what is your explanation for the 3 month divergence between CPI (now 2.4% annualized and falling) and PCE (now 2.9% annualized and rising). Usually these two metrics follow each other around, but lately they are splitting and going different directions.
The doctored OER in CPI. I have written about it several times.
OER is also in PCE, but with at much smaller weight, with a weight of only about 10% or so, instead of 26% in CPI. All housing combined weighs only about 16% in PCE, v 35% in CPI. But PCE includes things that are not in CPI.
Wolf, sorry if you answered this previously, but what are your thoughts on Truflation estimates?
It’s a bad blockchain joke.
How will the tariff reimbursements work out in the trade deficit / surplus calculations?
Any amounts reimbursed won’t figure into the trade deficit figures. The tariffs collected also don’t figure into the trade deficit figures. They all figure into the budget deficit figures.
Trade deficit and budget deficit are two separate but huge deficits.
There will be no tariff reimbursements.
I agree.
The administration should embrace this decision though I wish the court would have ruled much sooner.
The 10% for 150 days or whatever is fine. Some tariffs are fine as well.
Time for stability
Domestic inflation is an expected response to taxes on imported goods (tariffs). The weakened dollar also makes imported goods more expensive. Massive deficit spending is keeping the economy growing, but it also leads to the trade deficit that tariffs cannot eliminate. Foreign money flowing in to buy U.S. government debt is balanced by dollars flowing out to purchase foreign goods and services. So, short of a recession that reduces demand we can expect inflation to continue its upward trajectory, especially if new tariffs are applied to replaced the old ones that have been stopped by the court. And so it goes.
IDK, the inflation trajectory has changed a couple of times over the past 15 years, even though the various deficits have persisted and increased.
If anything, I had expected tariffs to reduce consumption of imports (they didn’t) causing foreigners to buy fewer treasuries (they didn’t) causing higher interest rates (been relatively range-bound). Apparently there was both lots of fat in the margins of importers AND lots of willingness to pay more from US consumers.
PCE barely even mentioned in US press. The largest Italian paper, Corriere della Sera, has our hot inflation as the #2 story on their front page. WTAF? No one cares about inflation anymore?
I think that John Hussman captured what I have thinking. “To love a bubble but hate a crash is to misunderstand the market. A bubble is a crash on its way to becoming”
Whether a financial structure is a bubble or not can only be determined after it collapses.
I would argue otherwise, actually. There’s usually very clear indicators of a bubble during its formation and expansion.
When people start talking about any asset – doesn’t matter what it is – as if it can’t crash, or can’t lose, or is riskless, or similar – that’s when you should know it’s a bubble. This is because bubbles are ultimately caused by groupthink and herd behavior.
Doesn’t matter what bubble it is – when people start talking about any investment as if it can’t fail, that’s when you should get out.
What happens if the world decides to significantly reduce their buying US treasuries? Trump’s speech with further tariff threats have surely got to be making other countries look elsewhere.
Yields would rise by enough to bring out the US buyers. Every time the 10-year Treasury yield gets anywhere near 5% yield, demand just exploded… US demand, demand from commenters right here, and that demand pushed the yield back down. Just imagine the explosion of US demand at a 6% yield. At some point, even I would be buying.