Oakland, Austin, Cape Coral, New Orleans, San Francisco, Birmingham, Fort Myers, Washington DC, Sarasota, Denver, Hayward, Portland, Phoenix, Naples, St. Petersburg.
By Wolf Richter for WOLF STREET.
Prices of mid-tier single-family homes in 15 bigger cities have dropped by 10% to 24% through September from their respective peaks in 2022 or 2024, seasonally adjusted – one more than a month ago, the new addition being St. Petersburg, FL. None of them had set a new high in 2023; it was set either in 2022 or in 2024 (year of peak):
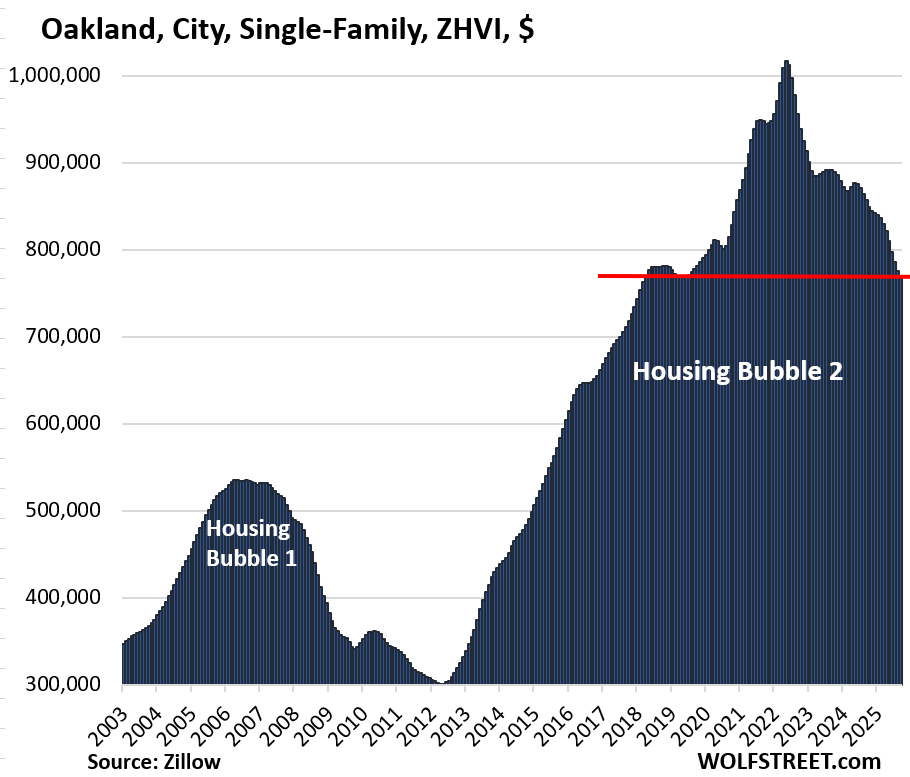
- Oakland, CA: -24% (2022)
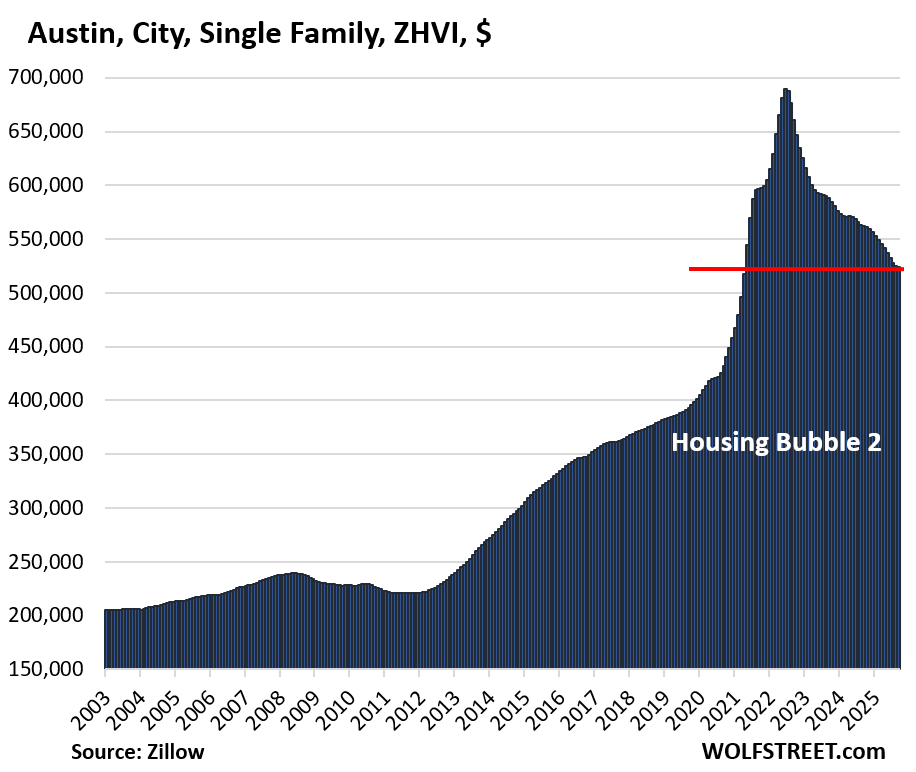
- Austin, TX: -24% (2022)
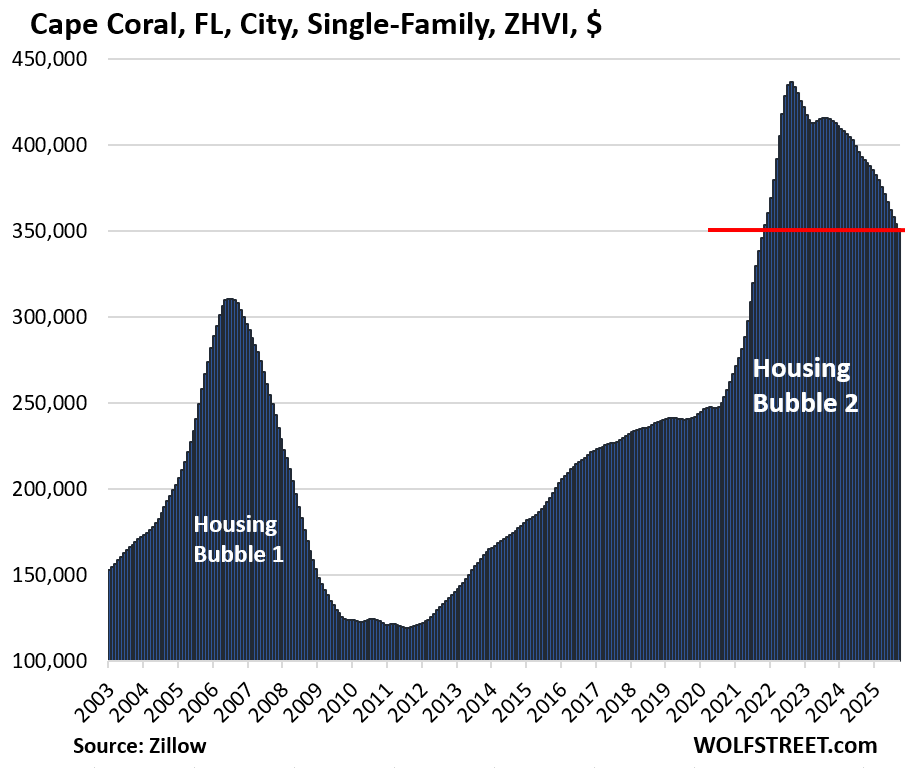
- Cape Coral, FL: -20% (2022)
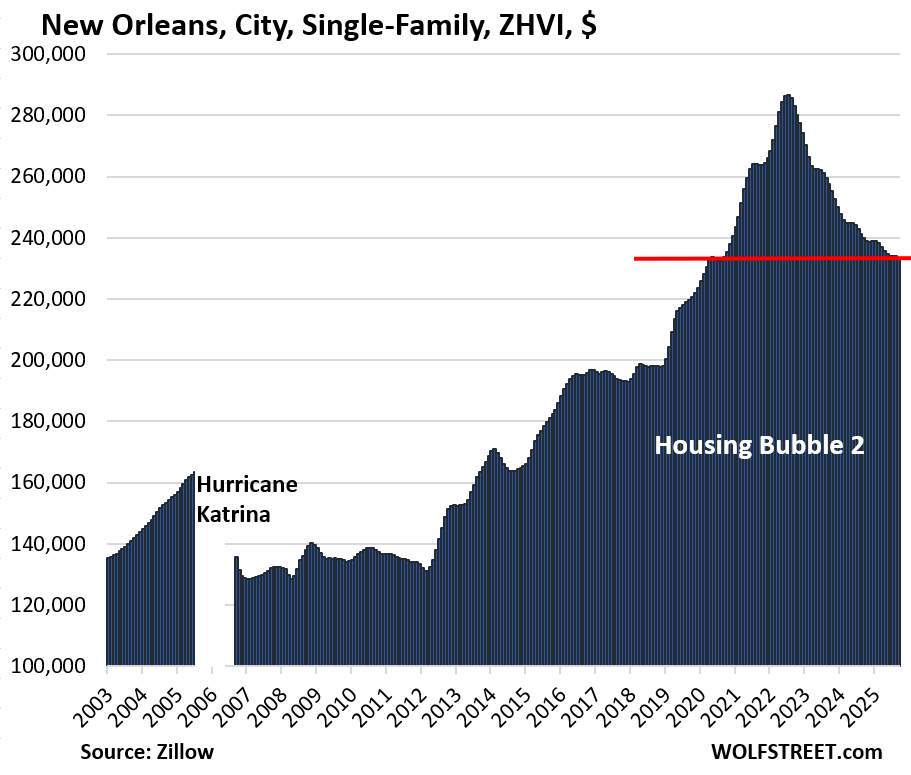
- New Orleans, LA: -19% (2022)
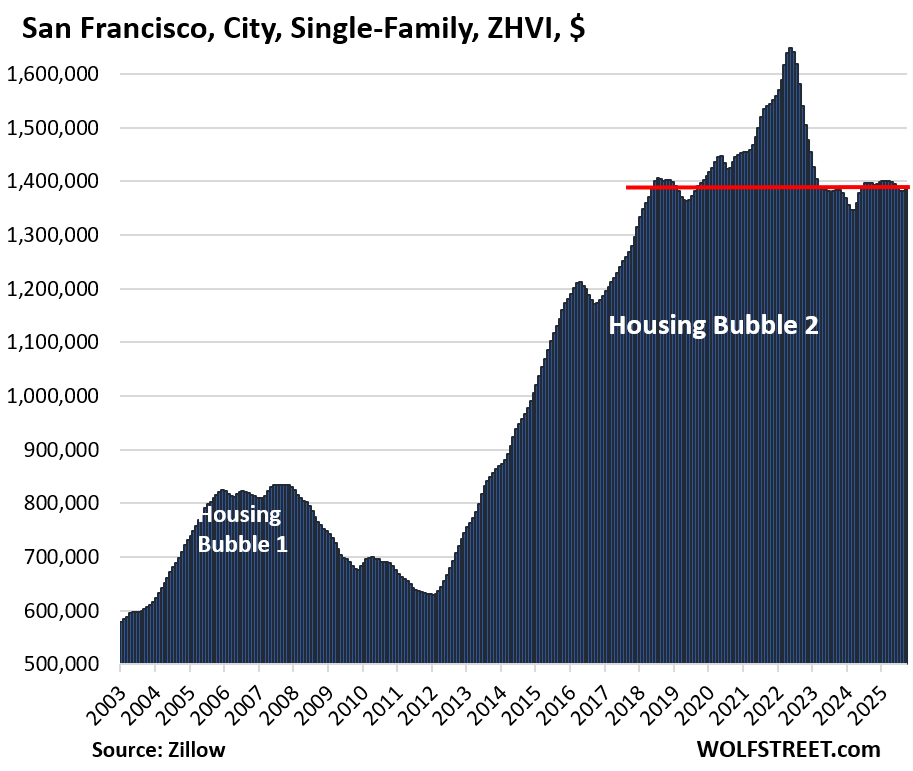
- San Francisco, CA: -16% (2022)
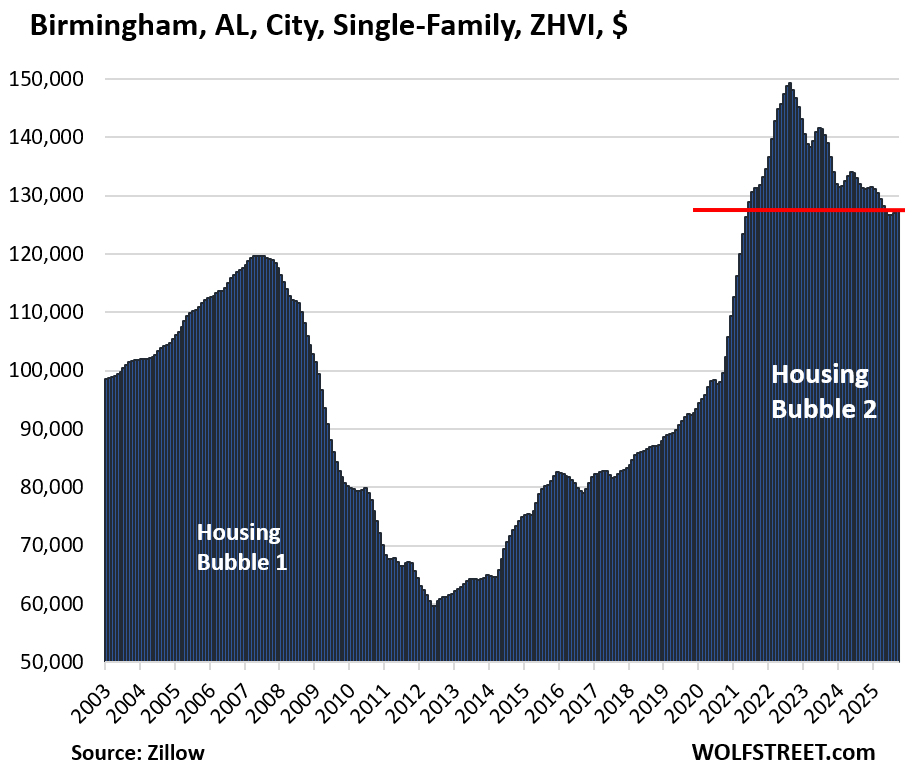
- Birmingham, AL: -15% (2022)
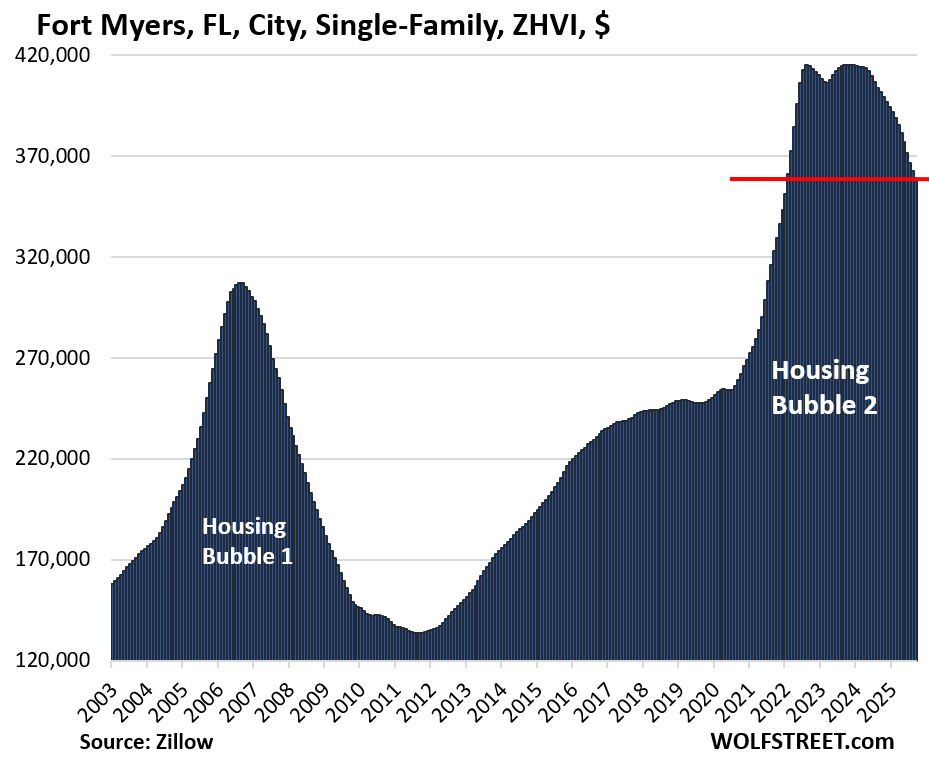
- Fort Myers, FL: -13% (2022)
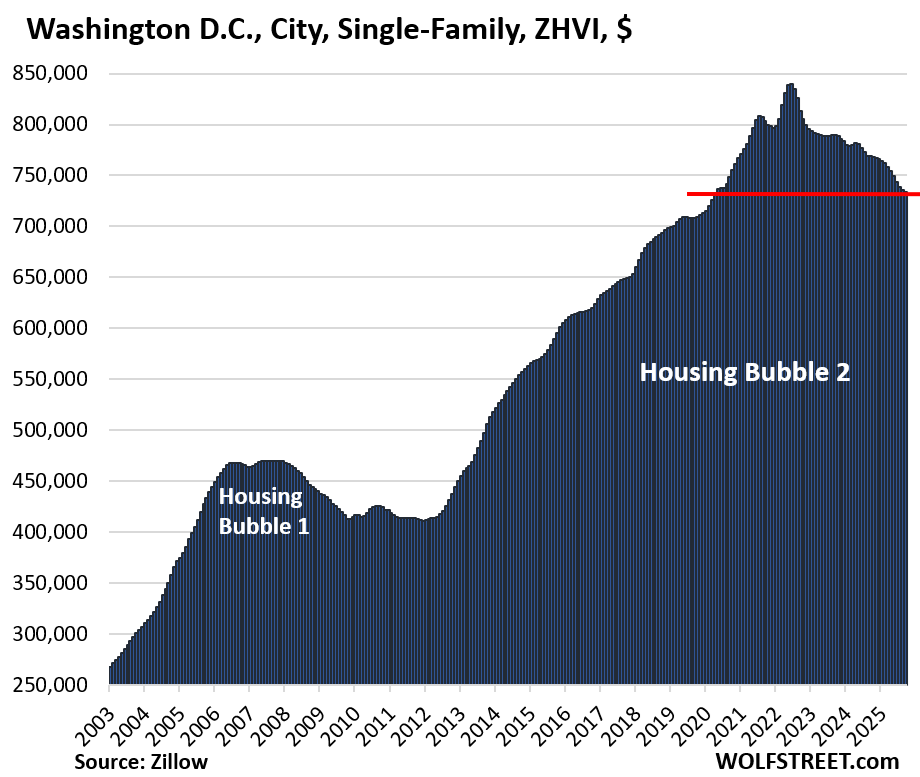
- Washington, DC: -13% (2022)
- Sarasota, FL: -12% (2022)
- Denver, CO: -11% (2022)
- Hayward, CA: -11% (2022)
- Portland, OR: -10% (2022)
- Phoenix, AZ: -10% (2024)
- Naples, FL: -10% (2024)
- St. Petersburg, FL: -10% (2024)
Didn’t make the list: There are many other bigger cities where mid-tier single-family home prices have declined from their respective peaks in 2022 or 2024, but not enough to make the 10% cutoff. None of them had set a new high in 2023.
Four of them have dropped by about 9%; each monthly decline gets them closer to the double-digit zone. Others are still quite a bit away from the 10% line.
Here are some salient examples (year of peak):
- Fort Worth, TX: -9% (2022)
- Mesa, AZ: -9% (2022)
- Glendale, AZ: -9% (2022)
- Aurora, CO: -9% (2024)
- Gilbert, AZ: -8% (2022)
- Seattle, WA: -8% (2022)
- San Antonio, TX: -8% (2024)
- Sacramento, CA: -8% (2022)
- Boise, ID: -7% (2022)
- Memphis, TN: -7% (2022)
- Colorado Springs, CO: -7% (2022)
- Arlington, TX: -7% (2022)
- Tampa, Fl: -6% (2024)
- Dallas, TX: -6% (2024)
- Plano, TX: -6% (2024)
- San Jose, CA: -5% (2024)
- Atlanta, GA: -5% (2022)
- Jacksonville, FL: -5% (2024)
- Spokane, WA: -5% (2024)
- Orlando, FL: -4% (2024)
- Los Angeles, CA: -4% (2024)
- San Diego, CA: -4% (2024)
- Corpus Christi, TX: -4% (2024)
- Miami, FL: -3% (2024)
- Reno, NV: -3% (2024)
In some other bigger cities, prices of single-family homes have continued to rise or have flattened out. My discussion and charts of the price gains and declines in 33 large and expensive metropolitan areas from Austin-Round Rock-San Marcos (-23% from peak) to Chicago-Naperville-Elgin (new high, +3.5% year-over-year), is here.
The entire pandemic price spike got wiped out in 4 of 15 cities. But in these four cities, the mid-2020 to mid-2022 price explosion was less pronounced than in other cities.
- San Francisco
- Oakland
- Washington, DC
- New Orleans.
Year-over-year, prices declined in all 15 cities in September, led by:
- Fort Myers: -10.6%
- Oakland: -10.2%
- Cape Coral: -10.2%
- Sarasota: -9.3%
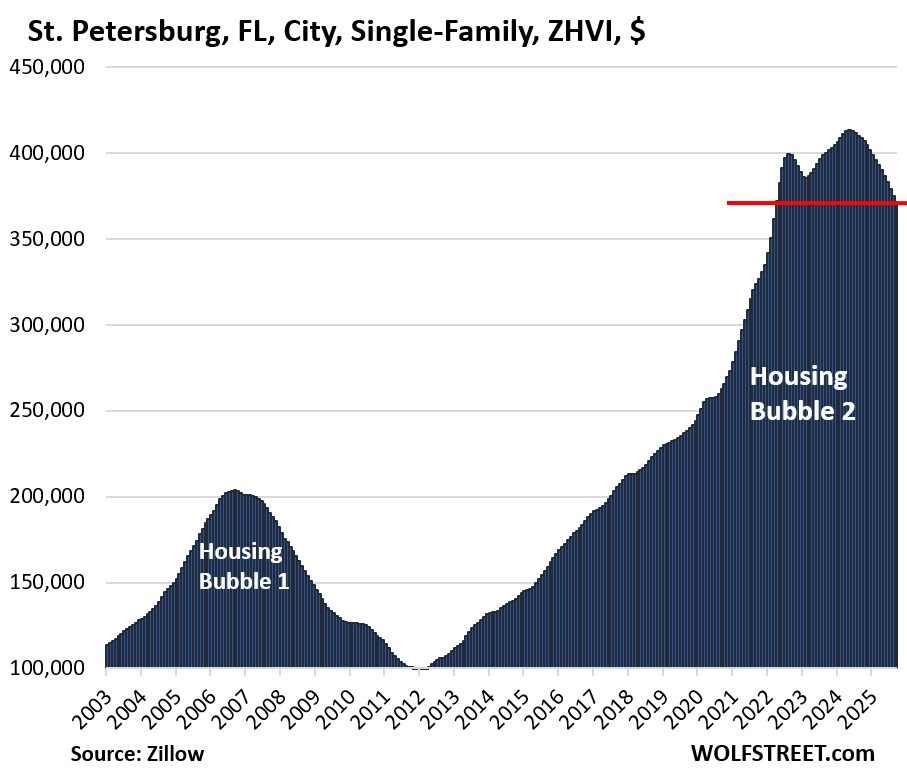
- St. Petersburg: -9.1%
- Naples: -8.0%
- Hayward: -7.5%
- Austin: -6.8%
Methodology and data: These prices are seasonally adjusted three-month averages of single-family mid-tier homes in “cities” (not in Metropolitan Statistical Areas, which are much larger). All data here are from the Zillow Home Value Index (ZHVI), which is based on millions of data points in Zillow’s “Database of All Homes,” including from public records (tax data), MLS, brokerages, local Realtor Associations, real-estate agents, and households across the US. It includes pricing data for off-market deals and for-sale-by-owner deals. These are not median prices.
The 15 bigger cities with the biggest price declines:
The metrics in each table from left to right: price decline from the peak, month-over-month change (MoM), year-over-year change (YoY), and the remaining increase since January 2000 (for Birmingham, since 2002, which is as far as the data goes back).
| Oakland, City, Single-Family Home Prices | |||
| From May 2022 peak | MoM | YoY | Since 2000 |
| -24% | -0.8% | -10.2% | 277% |
Another big month-to-month drop in prices of mid-tier single-family homes after -1.3% in August, -1.5% in July, -1.6% in June, and -1.4% in May!
Back to April 2018. The drop since May 2022 has more than wiped out the entire 24% price explosion from May 2020 to May 2022.
In the 10 years from mid-2012 to the peak in May 2022, prices exploded by 236%, which was obviously unsustainable.
| Austin, City, Single-Family Home Prices | |||
| From Jun 2022 peak | MoM | YoY | Since 2000 |
| -24% | -0.2% | -6.8% | 166% |
Lowest since April 2021. Prices have given up more than half of the 63% price explosion from mid-2020 to mid-2022.
These kinds of housing charts are absurd, a work of FOMO mania and the Fed’s free money that ended in 2022.
| Cape Coral, City, Single-Family Home Prices | |||
| From Aug 2022 peak | MoM | YoY | Since 2000 |
| -20% | -0.8% | -10.2% | 214% |
Lowest since October 2021. Between mid-2020 to mid-2022, prices had exploded by 76%.
| New Orleans, City, Single-Family Home Prices | |||
| From Jun 2022 peak | MoM | YoY | Since 2007 |
| -19% | -0.3% | -2.7% | 108% |
Back to April 2020. Prices have given up the entire 23% price spike between mid-2020 and mid-2022.
| San Francisco, City, Single-Family Home Prices | |||
| From May 2022 peak | MoM | YoY | Since 2000 |
| -16% | 0.4% | -0.7% | 234% |
Back to May 2018.
| Birmingham, AL, City, Single-Family Home Prices | |||
| From Jul 2022 peak | MoM | YoY | Since 2002 |
| -15% | 0.3% | -2.9% | 32% |
Back to June 2021. From mid-2020 to mid-2022, prices exploded by 53%, and have now given up about one-third of that.

| Fort Myers, City, Single-Family Home Prices | |||
| From Aug 2022 peak | MoM | YoY | Since 2000 |
| -14% | -0.9% | -10.6% | 189% |
Lowest since January 2022. Prices had exploded by 62% from mid-2020 to mid-2022.
| Washington D.C., Single-Family Home Prices | |||
| From Jun 2022 peak | MoM | YoY | Since 2000 |
| -13% | -0.2% | -4.5% | 272% |
Lowest since April 2020, having undone the entire price spike from mid-2020 to mid-2022.
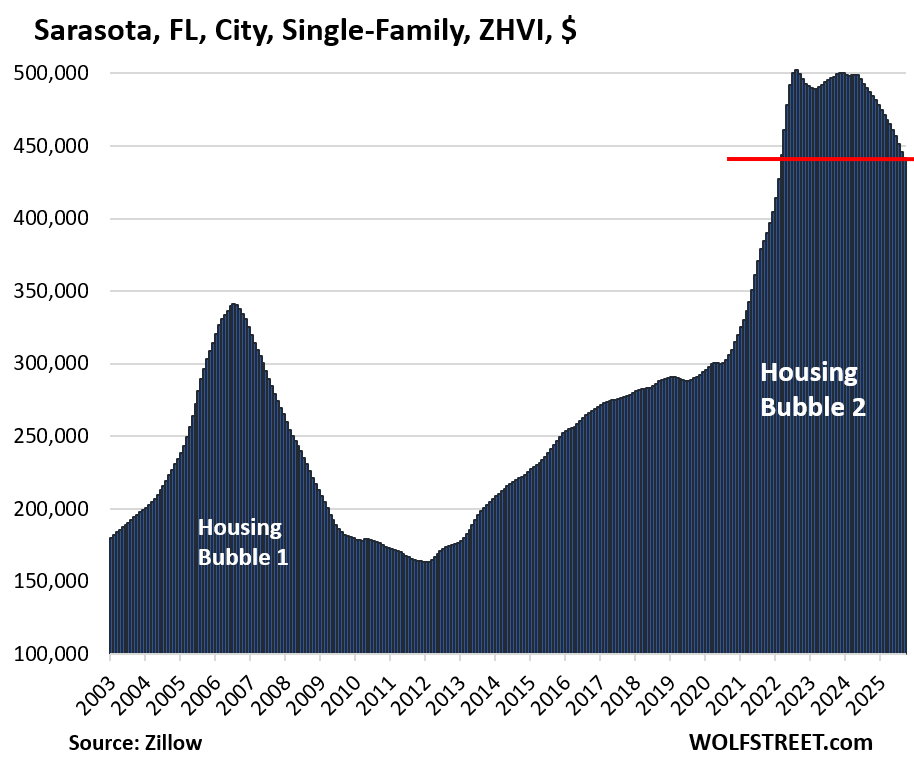
| Sarasota, FL, City, Single-Family Home Prices | |||
| From Aug 2022 peak | MoM | YoY | Since 2000 |
| -12% | -0.9% | -9.3% | 227% |
Lowest since February 2022.
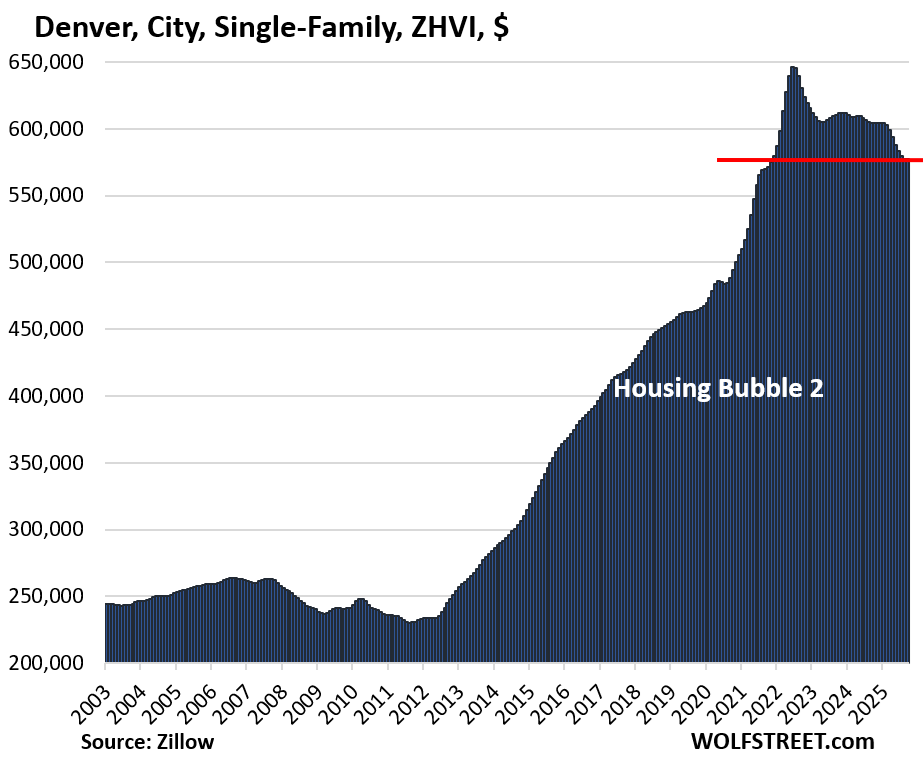
| Denver, City, Single-Family Home Prices | |||
| From Jun 2022 peak | MoM | YoY | Since 2000 |
| -11% | -0.1% | -4.5% | 212% |
Lowest since November 2021.
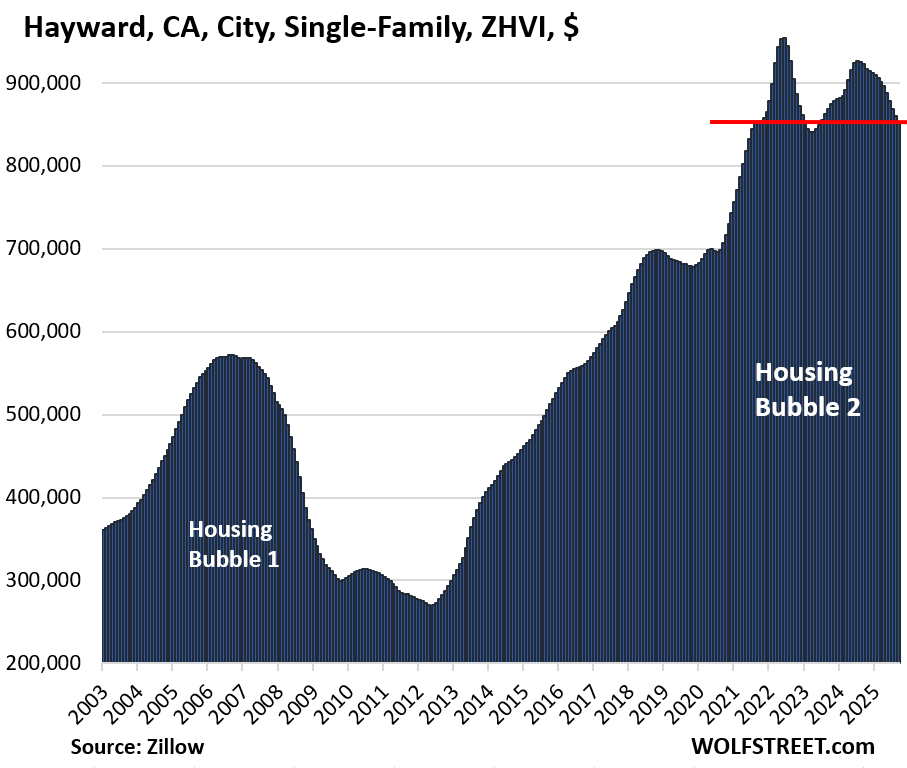
| Hayward, CA, City, Single-Family Home Prices | |||
| From Aug 2022 peak | MoM | YoY | Since 2000 |
| -11% | -0.8% | -8% | 274% |
Back to July 2021. Prices in this East Bay city spiked by 35% from mid-2020 to mid-2022, and soared by nearly 300% in the 10 years from 2012 to 2022.
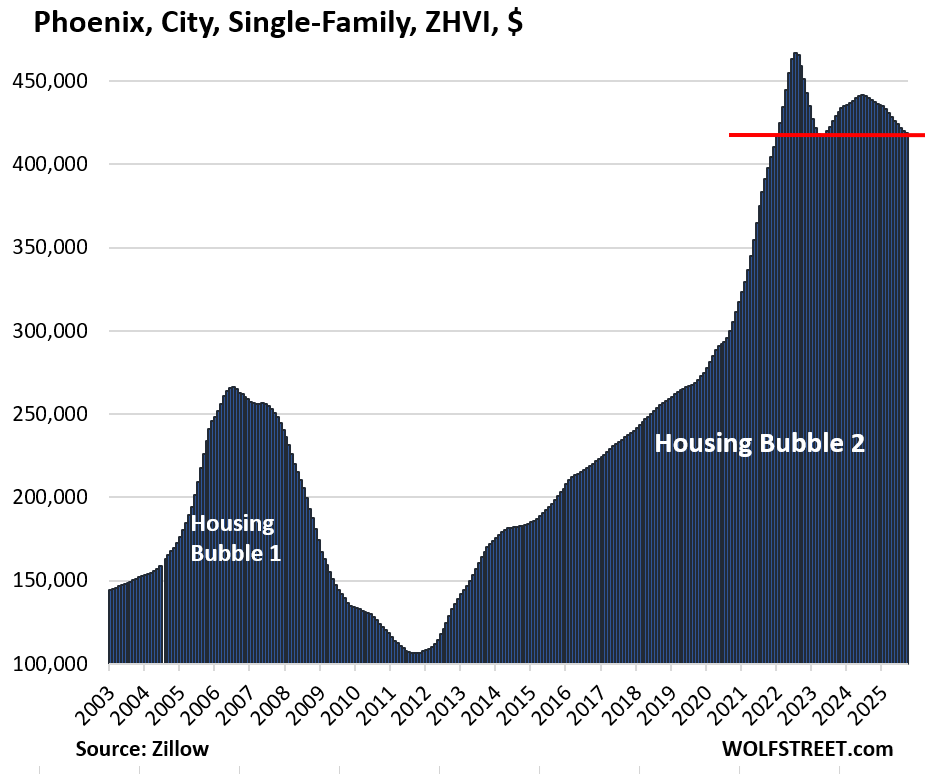
| Phoenix, City, Single-Family Home Prices | |||
| From Jul 2022 peak | MoM | YoY | Since 2000 |
| -10% | -0.3% | -4.5% | 248% |
Lowest since December 2021, only making a dent in the 60% price explosion from mid-2020 to mid-2022.
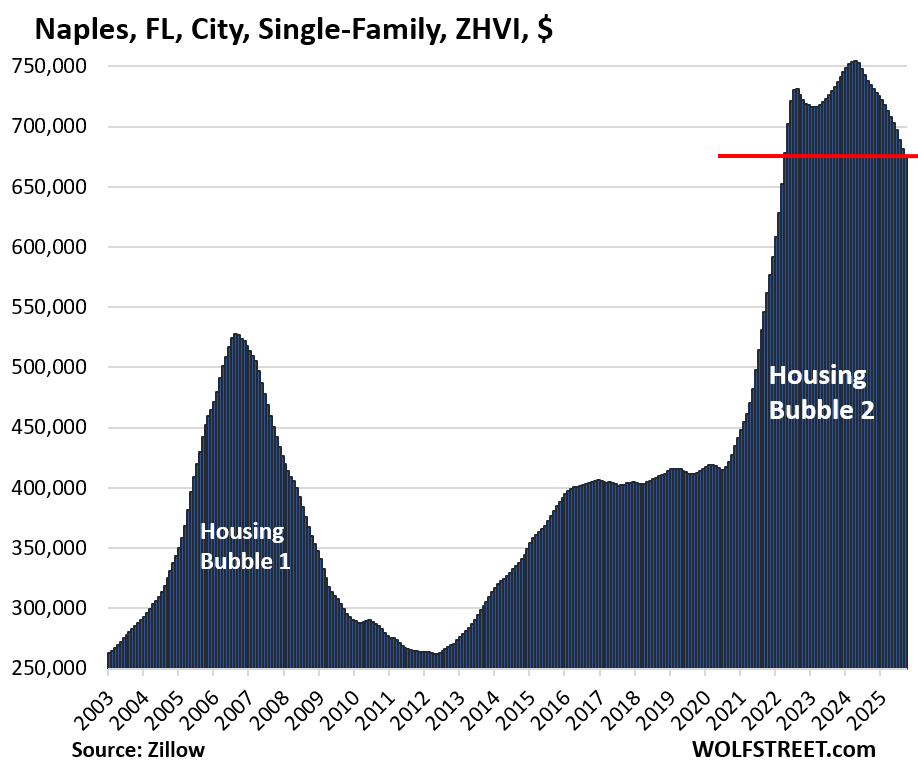
| Naples, City, Single-Family Home Prices | |||
| From Apr 2024 peak | MoM | YoY | Since 2000 |
| -10% | -0.9% | -8.0% | 246.6% |
Lowest since March 2022. Between mid-2020 and mid-2022 prices exploded by 76%. between mid-2020 to mid-2024, prices exploded by 82%.
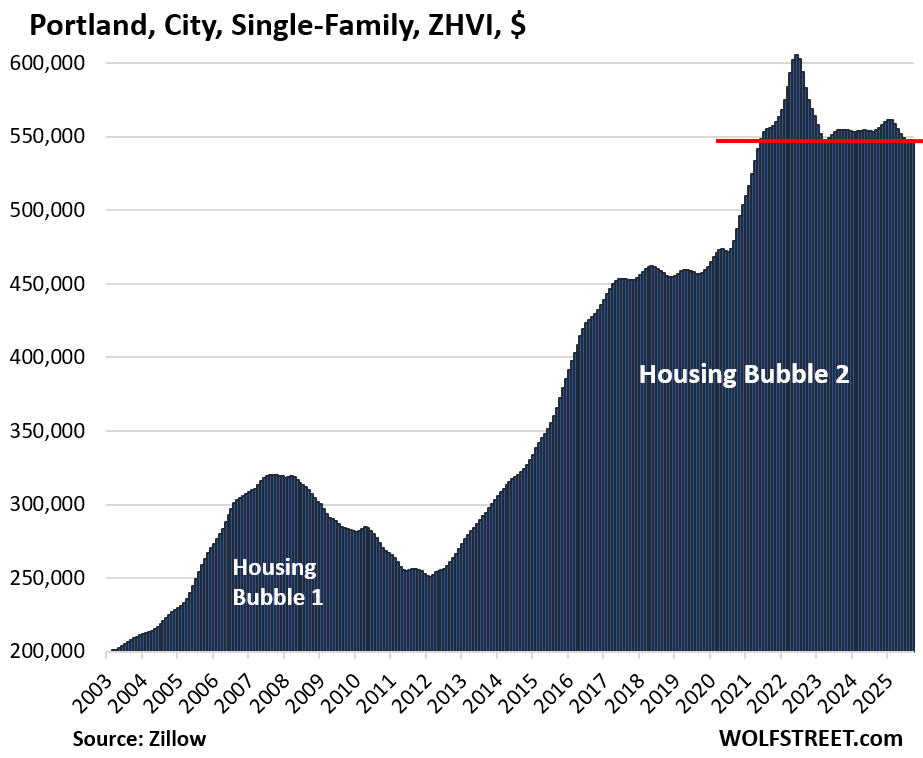
| Portland, City, Single-Family Home Prices | |||
| From May 2022 peak | MoM | YoY | Since 2000 |
| -10% | 0.0% | -1.2% | 222% |
Back to June 2021.
| St. Petersburg, City, Single-Family Home Prices | |||
| From May 2024 peak | MoM | YoY | Since 2000 |
| -10% | -0.9% | -9.1% | 354% |
Lowest since March 2022.
And in case you missed it: The Most Splendid Housing Bubbles in America: Price Drops & Gains in 33 Large Expensive Metros in September 2025
Enjoy reading WOLF STREET and want to support it? You can donate. I appreciate it immensely. Click on the mug to find out how:

![]()
Interesting, thanks. You don’t have a chart for Coloma or Watervliet, Michigan, do you?
I could build one but I’m not going to.
Just curious, what software do you use to make these?
Excel.
Thanks. I need to take a class on how to do charts, pivot tables, and all of that in Excel. It’s amazing what you can do with it if you know what you’re doing (which I don’t.)
TSonder305,
Time for Wolf to have his own master class!
TSonder305, you should try Copilot with Excel. Pivot tables are a PITA for me because I use them just infrequently enough to forget how. Now Copilot does them for me :) Great for conditional formatting too.
Try R programming for charts. Excel is great. R has some open source packages that are astonishing, like ggplot2. They look suitable for annual reports, The Lancet, etc.
It feels like a lot of them are platuing their progress down. I wonder if the even slower winter season helps or hurts the prices.
Depends on how badly the seller needs to sell. Only motivated sellers are still in the market and chasing the prices down; everyone else has pulled their listings or suffers from “I know what I’ve got, make me move” delusion.
This spring should be a positively epic show of sellers who have largely gotten the memo that prices are falling and the time for getting out is at hand if you have a mind to sell in the next five years or so. Some select locations have prices that are holding steady or going up, but those were not the Covid bubble hot spots.
I keep a spreadsheet of properties that we are tracking and I’m going to build an AI tool to make it easier to analyze my “portfolio” and look at trends. Yes, I know Zillow and Realtor will do that for me by Zip Code, but I only want to look at properties over a certain acreage and within a narrow price band and track their performance/listing history. By this time next year, there will be a dozen of these types of AI based tools for buyers.
I agree with all of this. The ones that went up 20% during COVID will likely hold or drop a little.
The ones that went up 100% are going to drop dramatically, if they haven’t already.
The fact remains, there simply wasn’t enough income in those areas to sustain those prices, and all of the overbidding was happening with people buying with remote work money from a higher-pay locale. There is still remote work, but not nearly enough at the high paying level to sustain those increases. Prices in those places will gradually revert back to the prices that you’d expect based on the incomes in the area.
The one exception are farther out suburbs that are commutable on a hybrid schedule like 2-3 days a week, but not really easily commutable if you had to do it 5. Those, the suburbs that are maybe 30-50 miles outside their city, may hold up better.
Sandy,prices went up a lot in north-east but seem to a large degree to still be holding.
As I said before,have seen more for sale signs then in the last few years/about a third seem to be pending with in 3 weeks or so.
Some of the sales I saw the last few years were true insanity in my view/felt those buyers really needed mental health care,time will tell if they were wrong.
Sandy
I would be very surprised if the tools via AI were not already available. Decision making from data is the key . Let us know when you start to buy or sell stuff based on AI !
Fine as far as it goes…..
But,… By the time those 5 year horizon motivated sellers realise their pants are down so have the much much smaller number of motivated buyers. Why so few buyers – well wages, interest rates and prices imply a price halving at least but that’s only the spot view on a mortgage contract. The overwhelming majority won’t find a buyer inside that 5-7 year price slump.
The broader demographic issue is that the generation baby boomers got to make rental slaves of in politics for 30 years is not planning on buying homes and raising families and paying off student debt. They are planning on getting to age 50-55 with the largest cash hedge possible, a viable future social security claim, and simply deserting the country in front of Great Depression 2.
Yes, it was a vicious ponzi scheme. Yes, it was deliberate – positively engineered politically and financially for 3 decades. And it’s over. No ponzi is forever. They all fall under their own weight. It’s ideological. The USA runs on an engine of conflated mass fraud basically. American culture regularly conflates mass fraud as an unlucky entrepreneurial risk taken. For the rest of us, it’s a serious crime. There are fraudsters (the winners) and fraudees (the workers in the real economy). What could go wrong huh?
The really dangerous thing about generational ponzi schemes is that you lose a generation out the borders in the early stages of the hangover.
Not that american labor is worth much on education and productivity to begin with. There is walking the walk, talking the talk, and guzzling the national essentially fascist-delusional Kool aid. Yanks are V8 Kool aid guzzlers and pukers. Each and every one, in my experience.
Depression imminent.
Most people don’t think like you and me……I know hou are right.
Hmm…
I wonder how the 2.5 illegal aliens leaving one way or another, plus the Baby Boomers, selling will affect the housing bubble at some point.
This doesn’t even account for the AIRBNB Bubble/Rental Bubble either….
Regards, Gustave.
Doesn’t the fact that Oakland is the biggest loser of all support the theory that the “housing shortage” narrative was all BS and this is just a classic bubble with a symmetrical decline?
What I always find the most interesting about the plots in this article and your other articles is the general trend is downward nationwide at a pretty good pace, except one or two outliers.
In this article, the two outlier cities that baffle me the most are the Chicago-Naperville-Elgin area and Portland. Usually, steady or increasing prices would indicate lots of new people (hence jobs). Neither the Chicago area (Illinois-high taxes) nor Portland (no heavy manufacturing or high tech industries) would seem to meet this criteria.. Granted, my knowledge of Portland is mainly from the show “Portlandia” and TV scenes of Antifa fighting the police. LOL
Anyone from these areas have any thoughts?
The City of Portland and the metro of Portland have declining prices, though the decline is slow.
The City of Chicago and the huge Chicago metro (million pop) has been hitting new highs in prices.
I am familiar with PDX, and within the “Portland metro” region is Clark County WA (across the Columbia river north of the City, which is where Vancouver WA is located). Clark County is seeing higher pricing and lots of new construction since it is a natural option for people who want to escape the chaos of PDX. Further, WA has no State Income Tax vs OR, so if someone has a concern about taxes, they will live 10 miles north of Portland across the State Line. Without the growth in Clark County, PDX numbers would be much lower.
Prices in Clark County have been declining just about all year and are now below where they had been in mid-2022, just like like Portland, but the price decline is a little smaller than Portland’s decline.
Thanks for including Naples. The 2021/22 increase there was extraordinary.
It’s also interesting to me that Naples is only down 10% from peak, while Cape Coral, less than a hour’s drive away, is down 20%. It goes to show how local everything is.
My theory is that Naples has gone down less because it’s a richer city, and is being propped up by people who just are price indifferent.
People also forget that if prices go up by 100% (double) and then drop by 20%, then you’re only up 60% from where you started. So in a few more months, Cape Coral may have given up half of its 2020-2022 increases.
Zoning: Some, most of this price drop resistance is going to be due to government. Government benefits greatly from increases in property tax revenue and they control the throttle of the market, not so much with building permits, but areas that are even open for subdivisions; i.e., the “dividing” in “subdividing.”
For the Sacramento market there is plenty of water available that is doing nothing but pushing the bay (essentially ocean) back and forth a couple of sloshing miles at the end of a very long Sacramento river delta. For decades (half a century +) there has been talk of a southern freeway south of the city from Elk Grove to El Dorado Hills that would provide a housing, mixed use area like I880 did on the North side of Sacramento. Right now the main road out there where a Freeway will go is a 2 (two) lane road!; not even 4 lanes for safety for decades; it has traffic jams just from the flow of cars at commuting hours, in a “greater Sacramento area” of 2.6 million people. Sacramento is the Capital of the most populated state in the nation (richest country on earth), if California was a country it would be the 4th richest in the World.
Wealthy Californian yet broke – factoring debt will provide a different perspective on whether Californians are rich. Too many distressed people living in 🍊county – multimillion dollar homes, fancy cars, expensive apparel … oh don’t forget the huge unpaid credit card balance with a huge mortgage balance … welcome to the world of keeping up with the Jones 😂 being financially responsible & conservative is a virtue in an area where irrational behavior has collectively pushed up the housing price to the point of “I got a money printer @ home” delusion 😂😓 😮🫢
What’s striking with these charts, is the variable of time, necessary, for the symmetry to unfold — the parabolic process of the upward spike, and the plunge downward.
Seems like years to go for housing to reinvent itself — and likely stocks (and the everything bubbles) headed for a similar journey.
Agree R:
Last major crash unfolded ”slowly” and then quickly where I was watching in southwest coast of the flower state, and eventually ended for some properties down 75% after HUGE increases… Some places back to beginning in one year,,, others not so soon.
NEW house behind us in a good hood in the Saintly city of the TPA bay area, finished in August, has now reduced price from $1.6MM to most recently I saw $1.1MM,,,
Probably getting close to the builder’s costs at this point.
We need anotherr crash, I was able to afford a house in Phoenix during the last one.
I know a couple of the areas mentioned in this article well, Austin and New Orleans. I am not surprised at how the run up in prices happened or how the decline is totally merited.
Austin-Round Rock was pushed up by tech and construction. The lifestyle in this area does not warrant the hype in home prices. It is a bedroom community at best. Austin does have good shopping, but nowhere to show it off. I know this for a fact, a $100 dress will make you the best dress woman in town. This is why the California crowd leaves, nothing to do and nowhere to go. Now the jobs are gone too.
New Orleans was pushed up by lack of availability after Katrina. Everybody with money moved north towards Baton Rouge and this delayed the redevelopment. The crime also surged everywhere. Earlier this year, I warned a family member who was going on a business trip there to be very careful. She says it took a whole hour, the first day, before she came upon a major crime scene. The city is a historic and cultural powerhouse but badly managed and it shows.
You wonder why we haven’t seen a housing crash and why gold is soaring
24 month rate of change in money flows
7/1/2024 3.3
8/1/2024 8.1
9/1/2024 10.3
10/1/2024 12.0
11/1/2024 12.6
12/1/2024 21.3
1/1/2025 21.3
2/1/2025 16.8
3/1/2025 25.9
4/1/2025 27.8
5/1/2025 28.6
6/1/2025 31.4
7/1/2025 33.1
8/2/2025 35.4
Where do you come up with the laughably false notion that gold is of any financial relevance whatsoever? And, what is a ‘money flow?’
Money flow data source ?
How do you define money flows?
So here we are more than three years past the peak of the 3% mortgage bubble, and prices have only dropped 10% in Phoenix? After HB1 which peaked in mid 2006, prices plummeted by 50% or more in three years. And they might have kept dropping if it hasn’t been for the (in the long run stupid) QE MBS buying by the Fed.
I continue to suggest that this bubble will be corrected more by time and inflation than by price. Flat for a decade is the same as 50% off and then 7% growth for a decade. It seems that a lot of people are waiting for that big plunge so they can buy and then get rich on housing appreciation. As long as this “investment mentality” continues in the housing market it’s going to stay broken. Houses are to live in and if you’re lucky the land underneath might appreciate as the local economy improves. And constant inflation of the money supply makes housing prices go up too even if there is no change in value.
Interesting comment…..I suppose those price declines….in the article…you have to add another 10% inflation adjusted. However, they are still unaffordable and those price declines may not even be half way to equilibrium, though adding a few years of 3-4% inflation, lowers the price by 10%, and if they go down another 25% in nominal terms, then you might be getting close to where normal transaction volume can occur.
We don’t have distress sales now. We need an uptick in unemployment or foreclosures.
9:52 AM 10/20/2025
Dow 46,629.18 +438.57 0.95%
S&P 500 6,731.30 +67.29 1.01%
Nasdaq 22,990.84 +310.87 1.37%
VIX 18.92 -1.86 -8.95%
Gold 4,363.10 +149.80 3.56%
Oil 57.03 -0.51 -0.89%
Wolf
Fascinated by the uptick in a more regional area Corpus Christi ,Tx .
My guess is a result of the massive buildouts of LNG export facilities and maybe Factory Manufacturing as a result of tariff, energy , and export capabilities.
Do you have any guess for the reason for the rise?
LOL, no, that was a typo. The “-” of “-4%” turned into a “1” and became “14%” instead of “-4%”
Thanks, fixed.
Homes are not that liquid in a down market. Rich people have multiple homes and they are trying to unload their extras. Looks like sell the rally in equities sell the rally in bonds and buy the USD could be the new mantra starting now or this week!!! Liquidity is drying up as wolf has posted last week. Today was a mop up liquidity day, trying to keep the bull buy signal intact.
Las Vegas, where all the world’s disposable income goes to happily disappear, hangs tough.
These price bubbles, rising and falling, oddly remind me of a 1960s “Lava Lamp”. Blobs that slowly rose to the top, cooled, then slowly fell to the bottom, repeating all day and night. Sorry, I have a weird sense of humor.