Below 2022 highs: Austin, San Francisco, Phoenix, San Antonio, Denver, Sacramento, Dallas-Ft. Worth, Portland, Salt Lake, Seattle, Tampa, Raleigh, Houston, Atlanta, Charlotte, Nashville, Las Vegas, Minneapolis, Orlando…
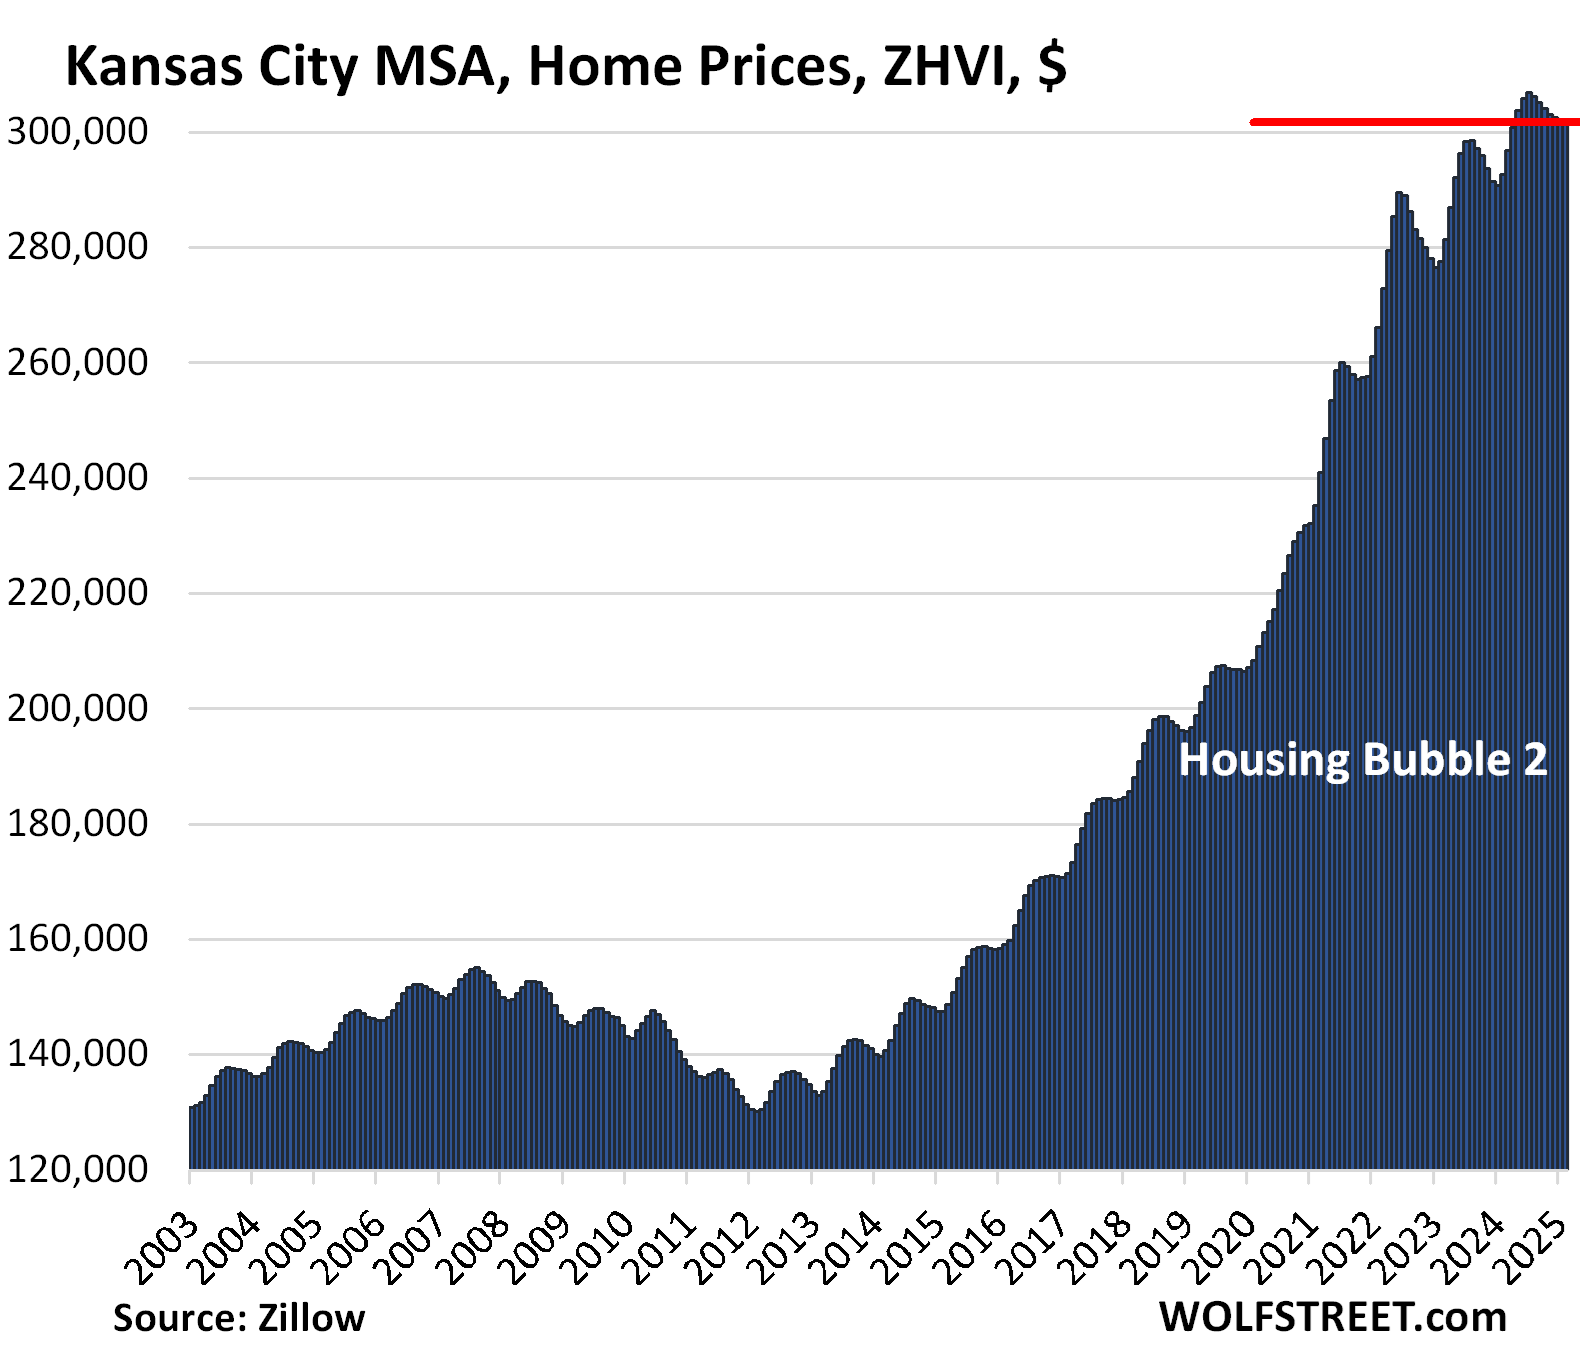
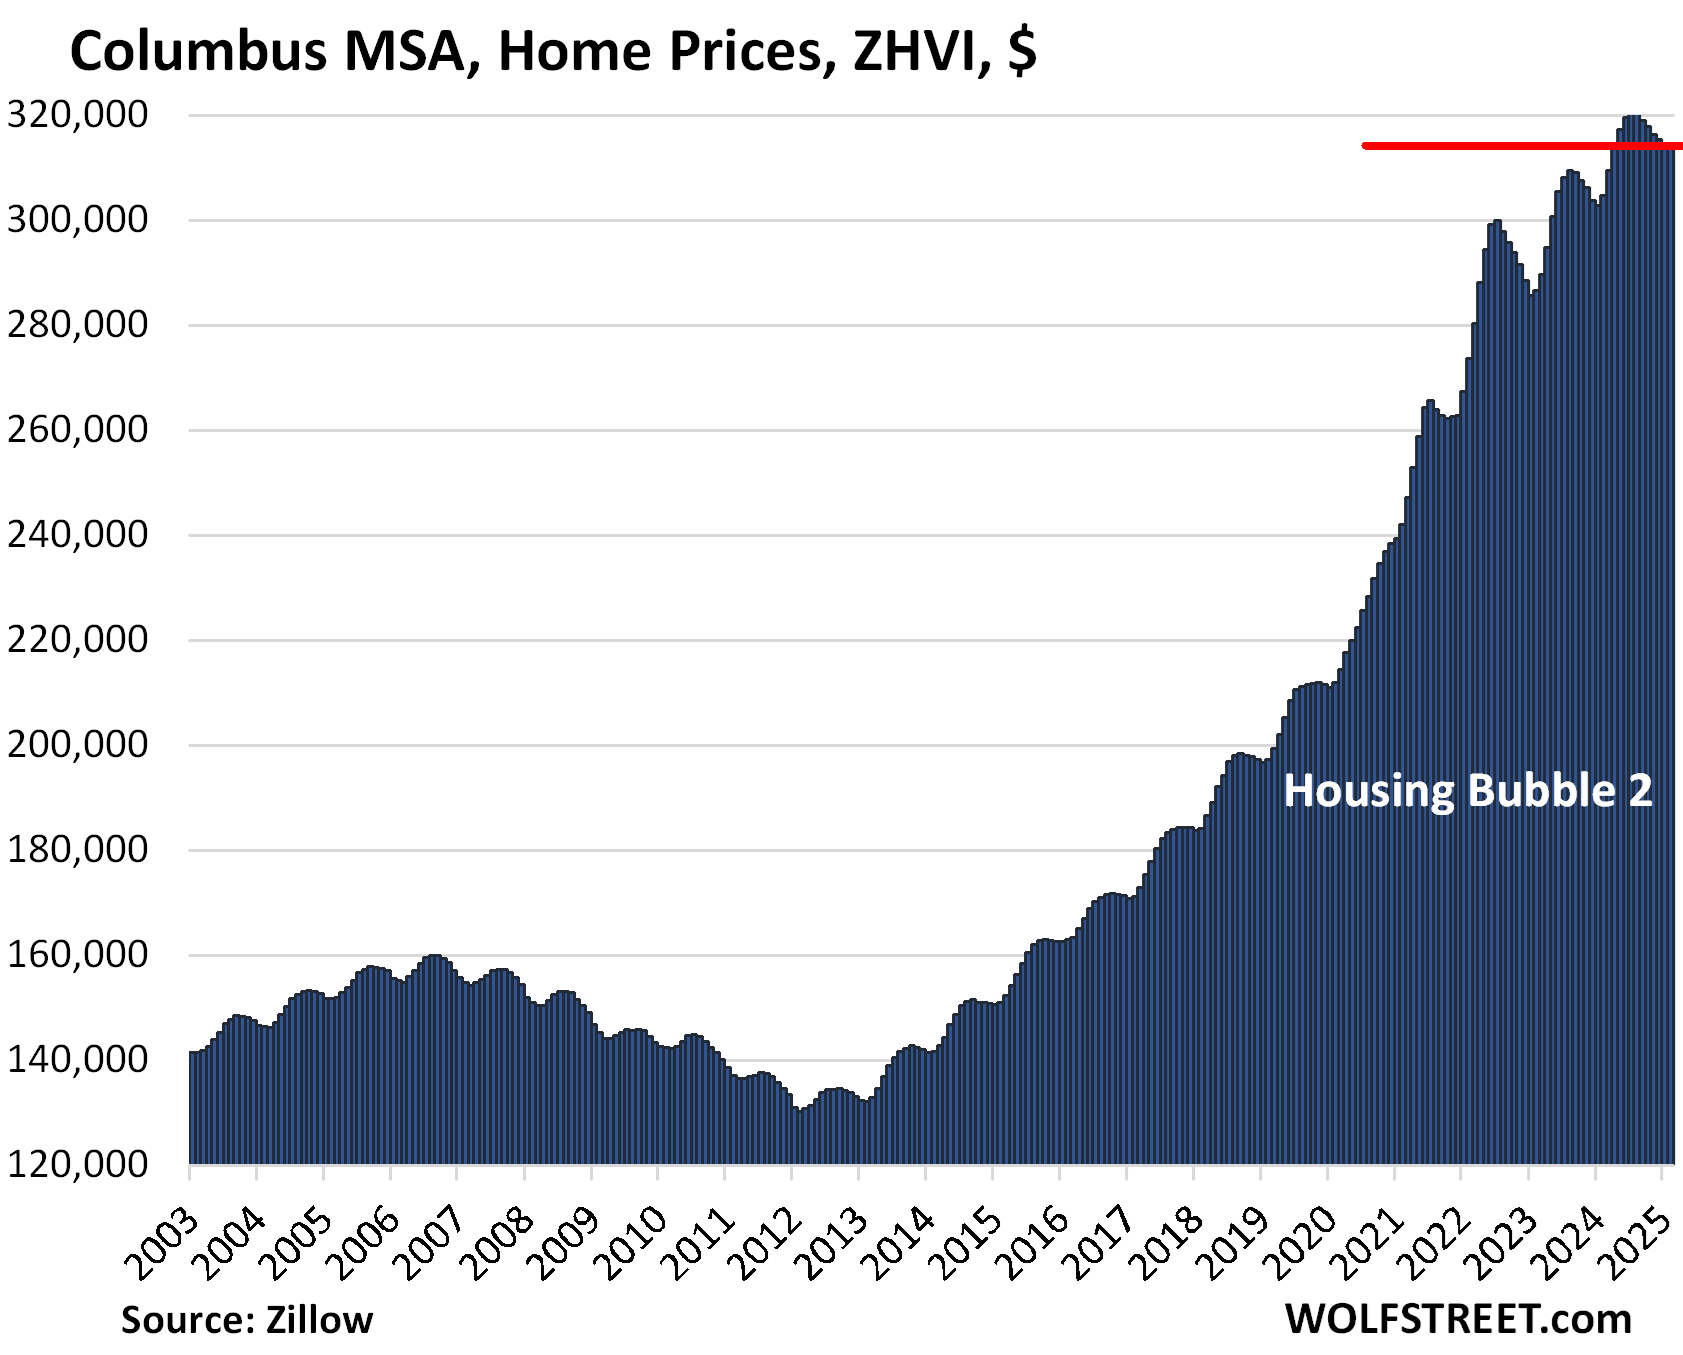
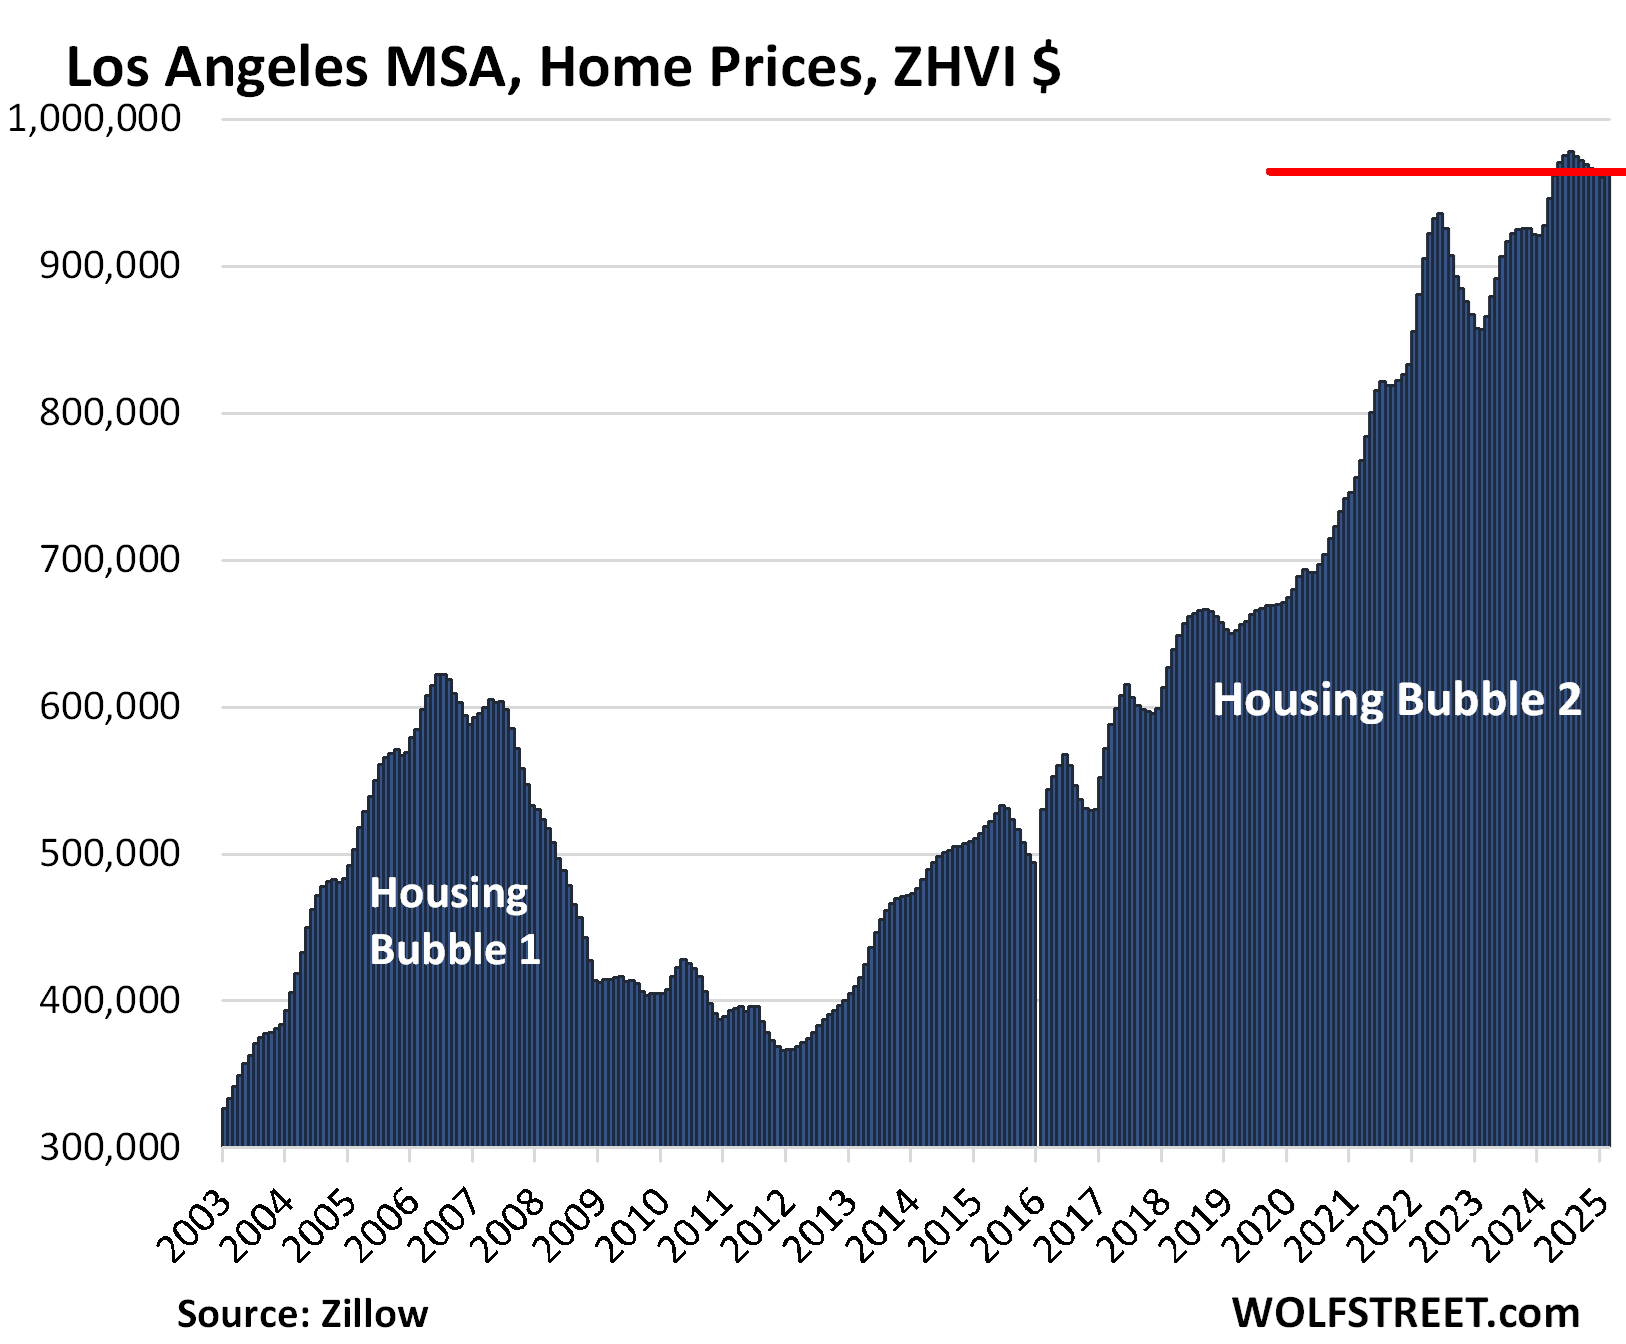
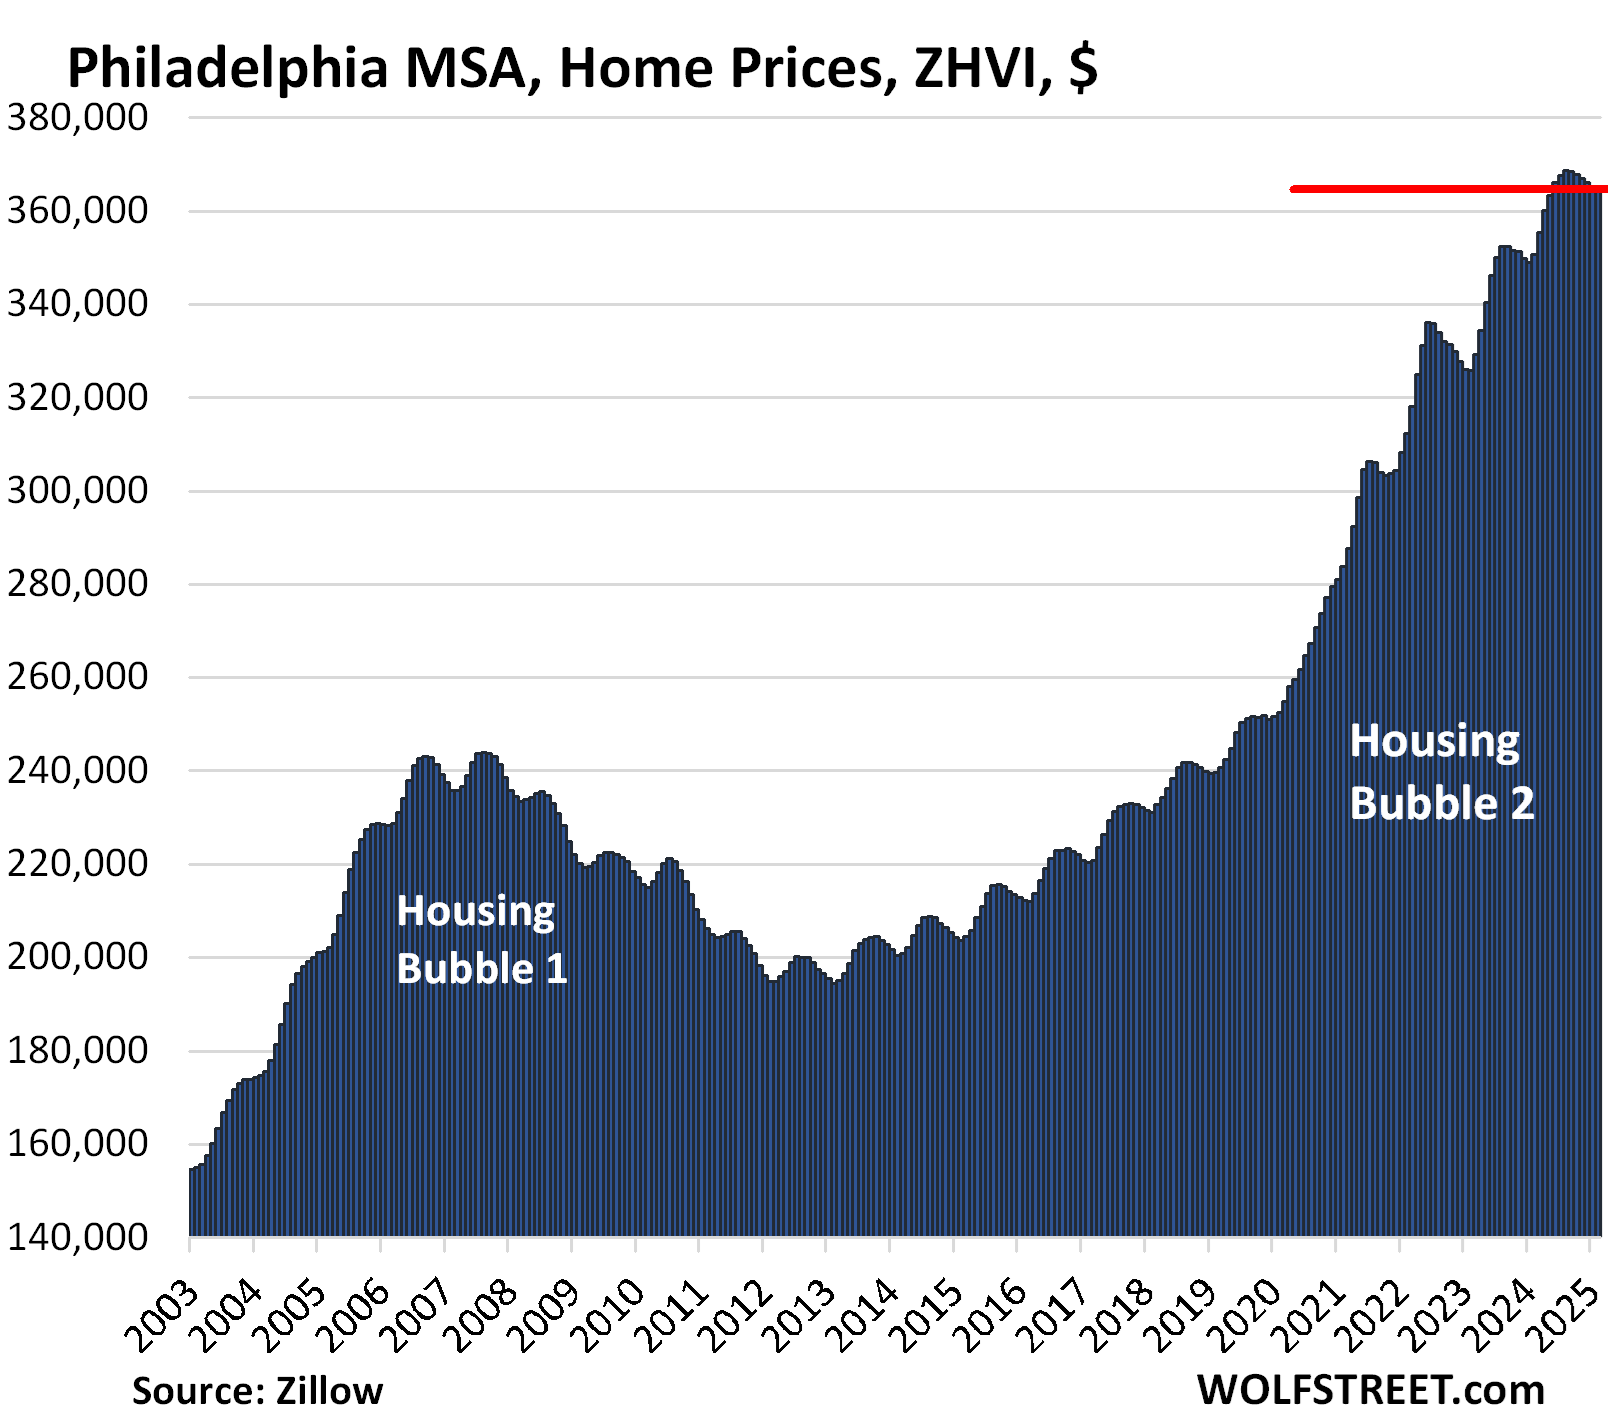
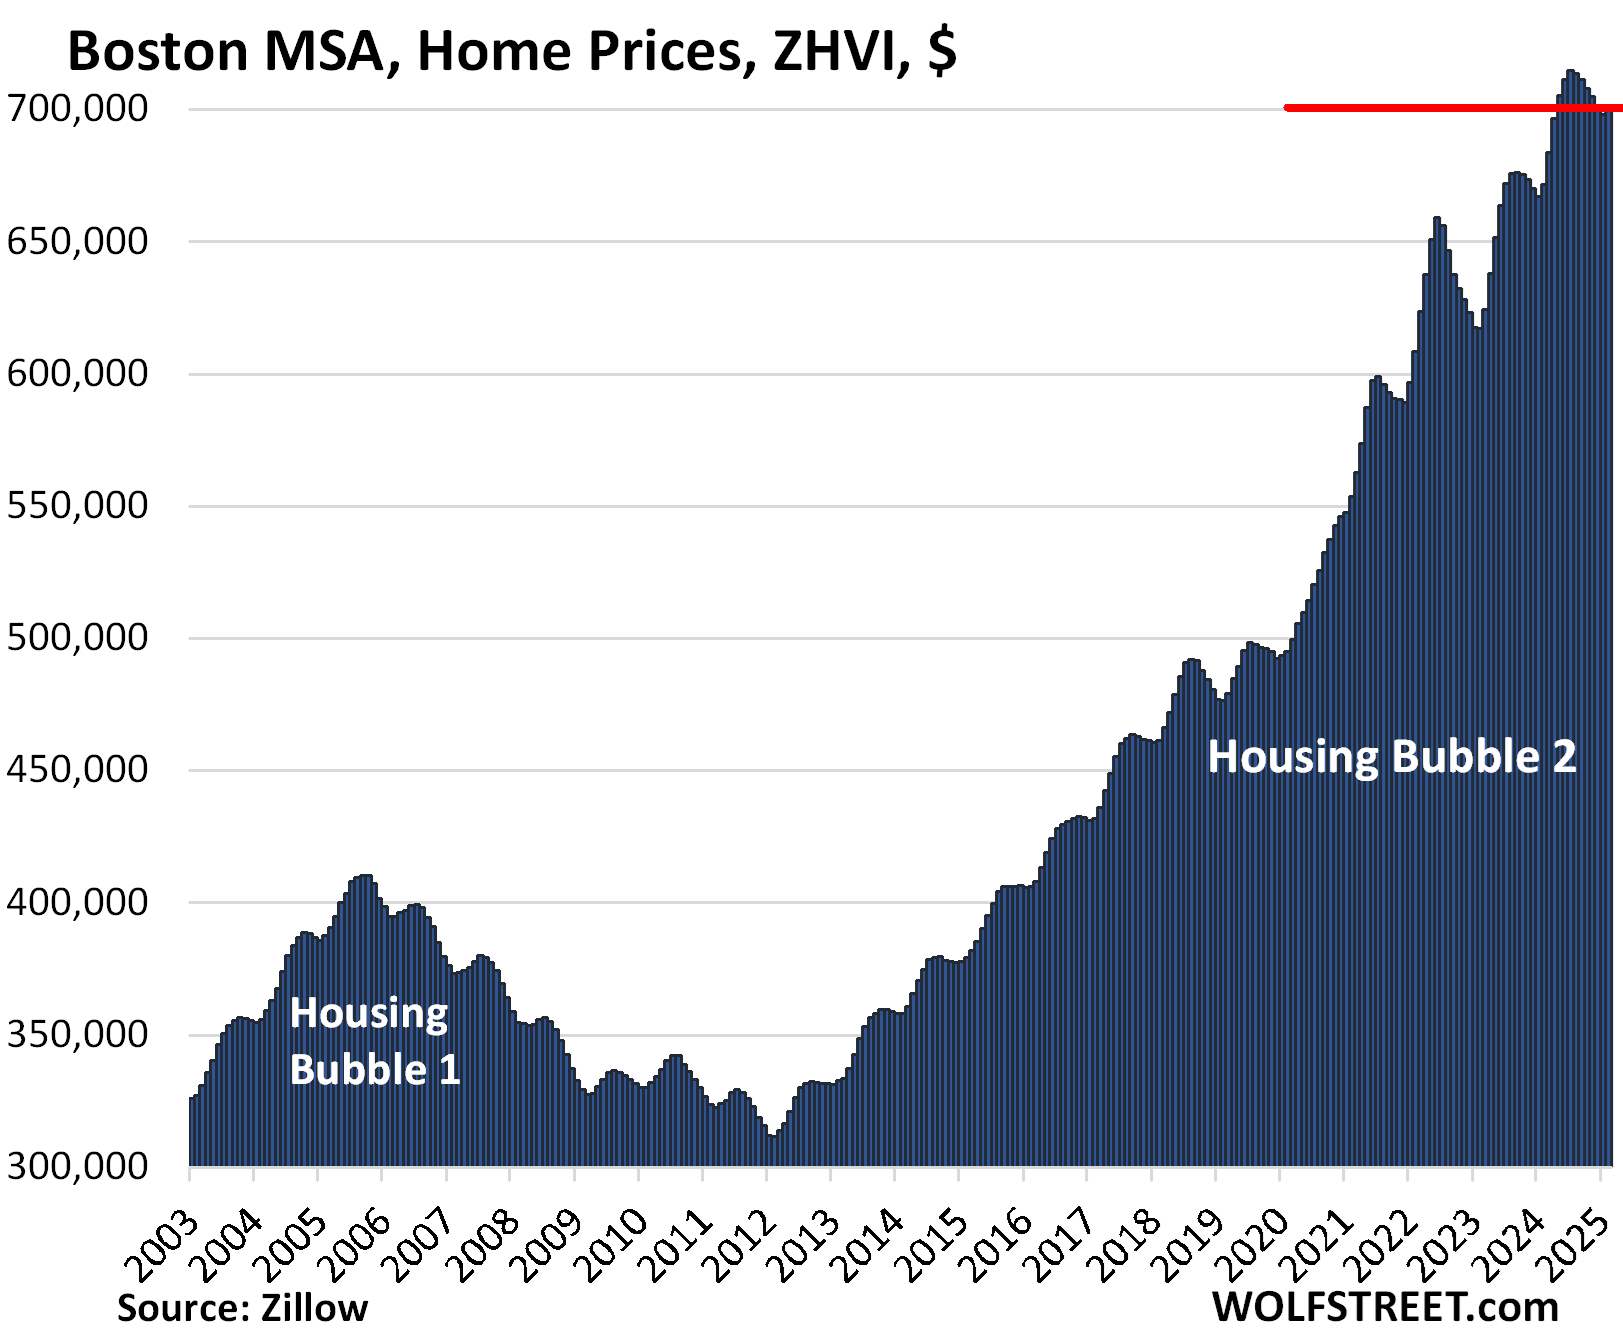
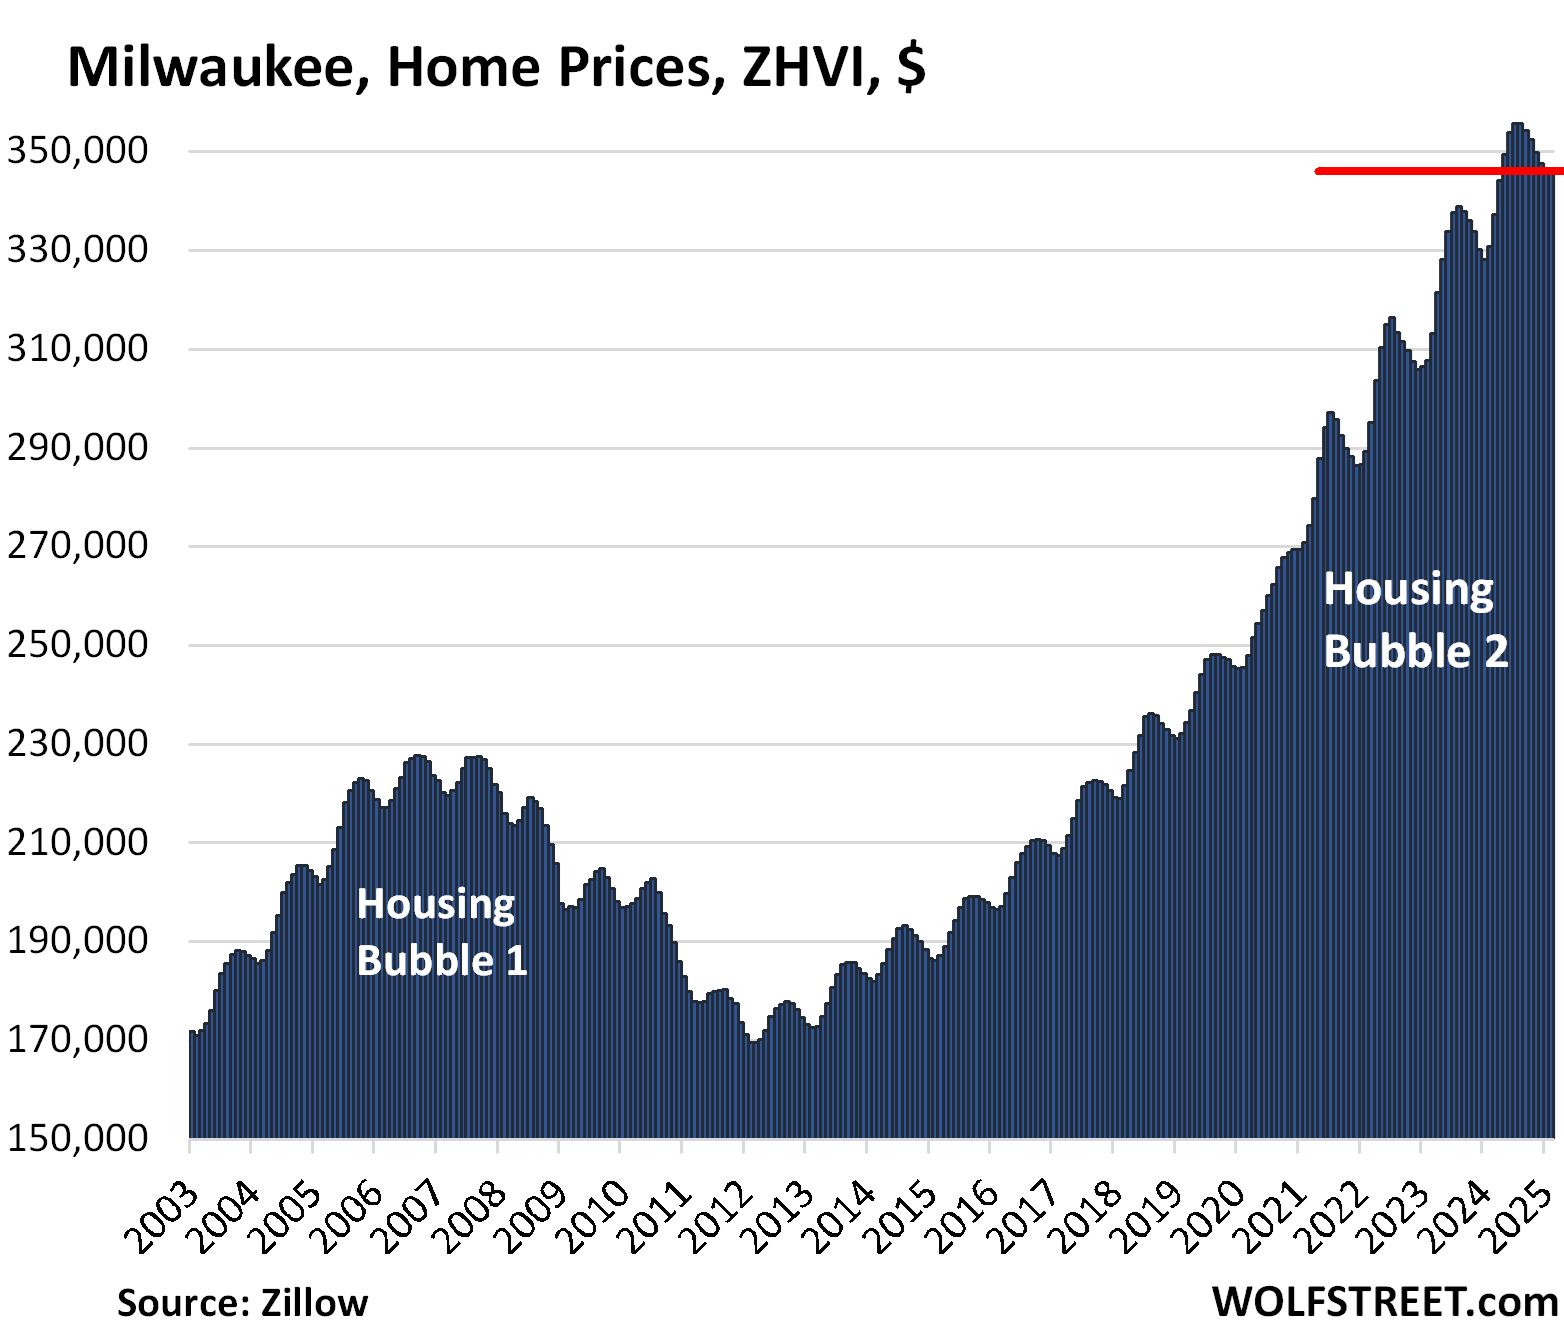
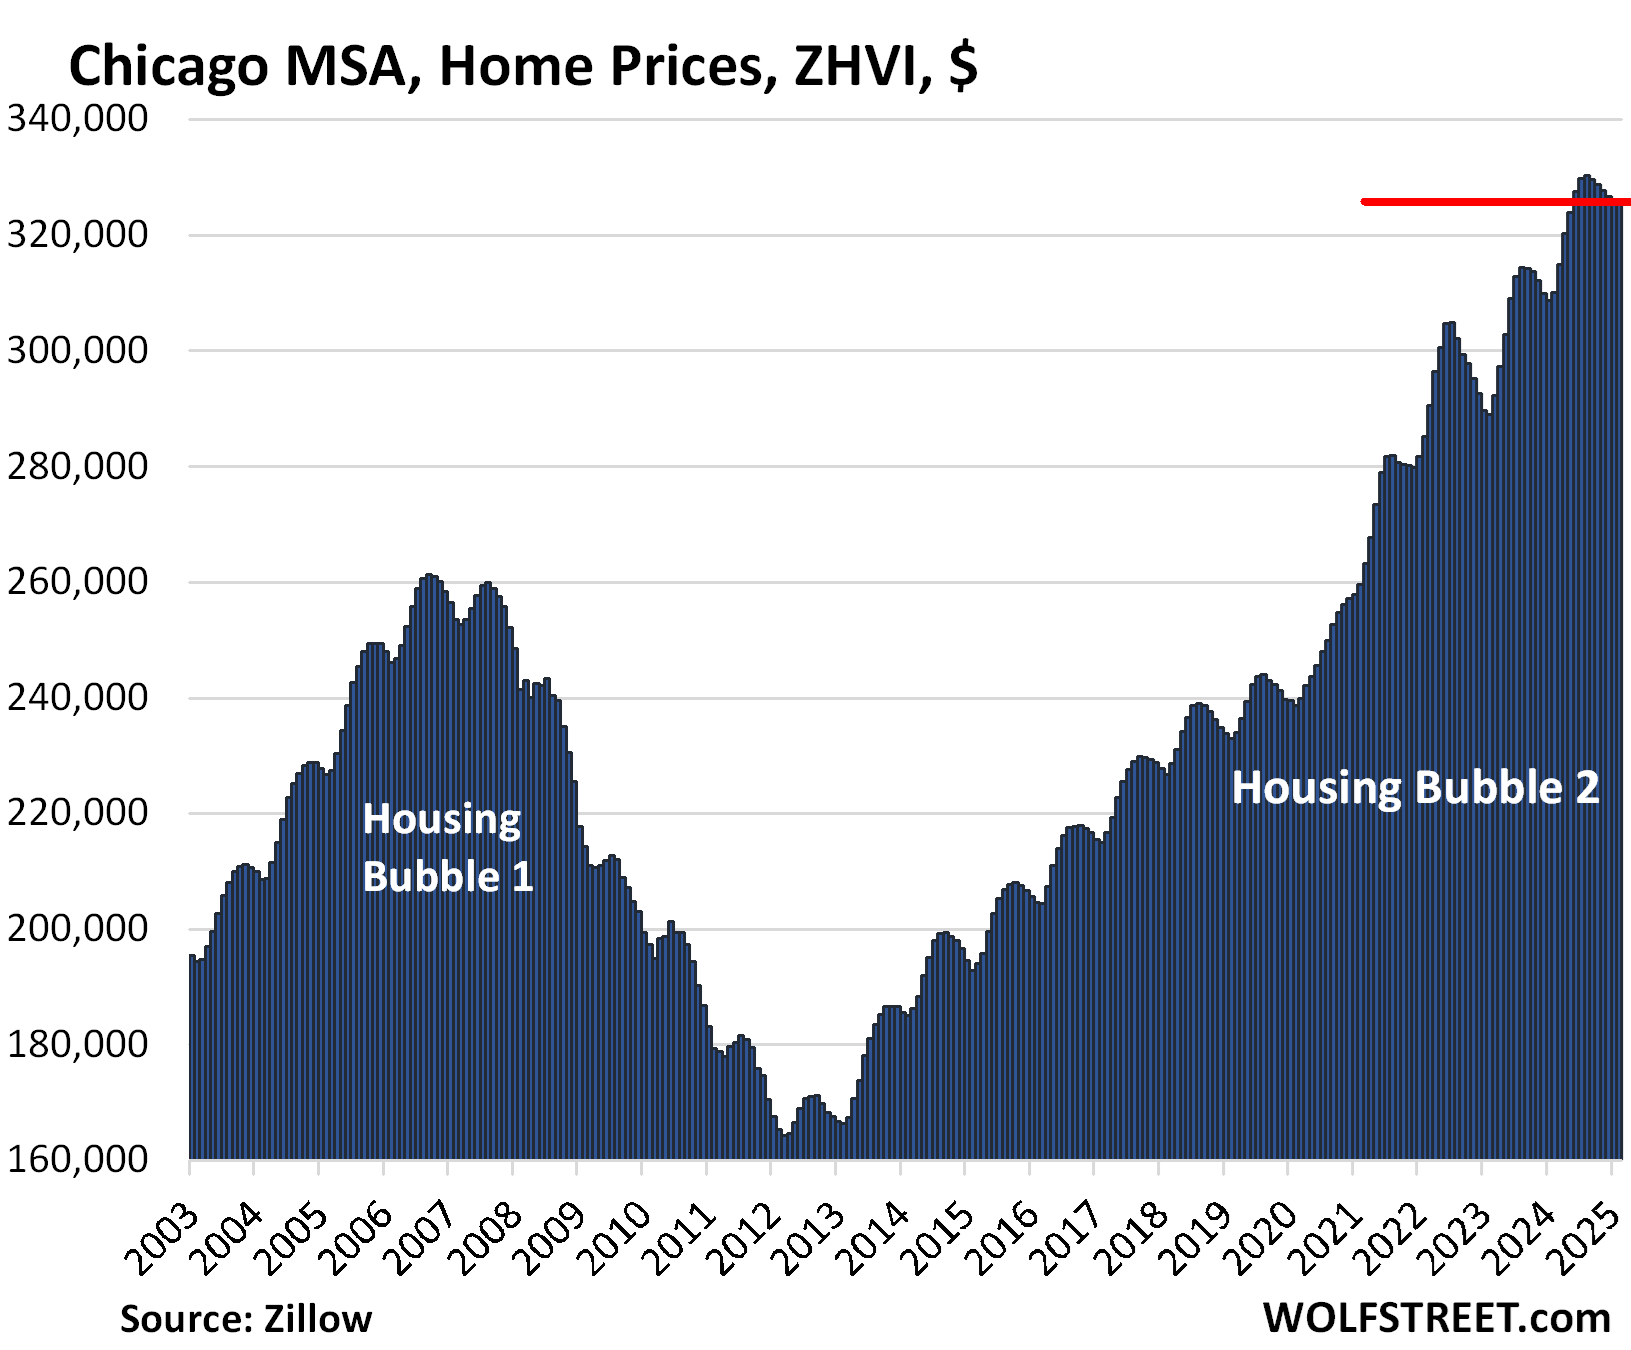
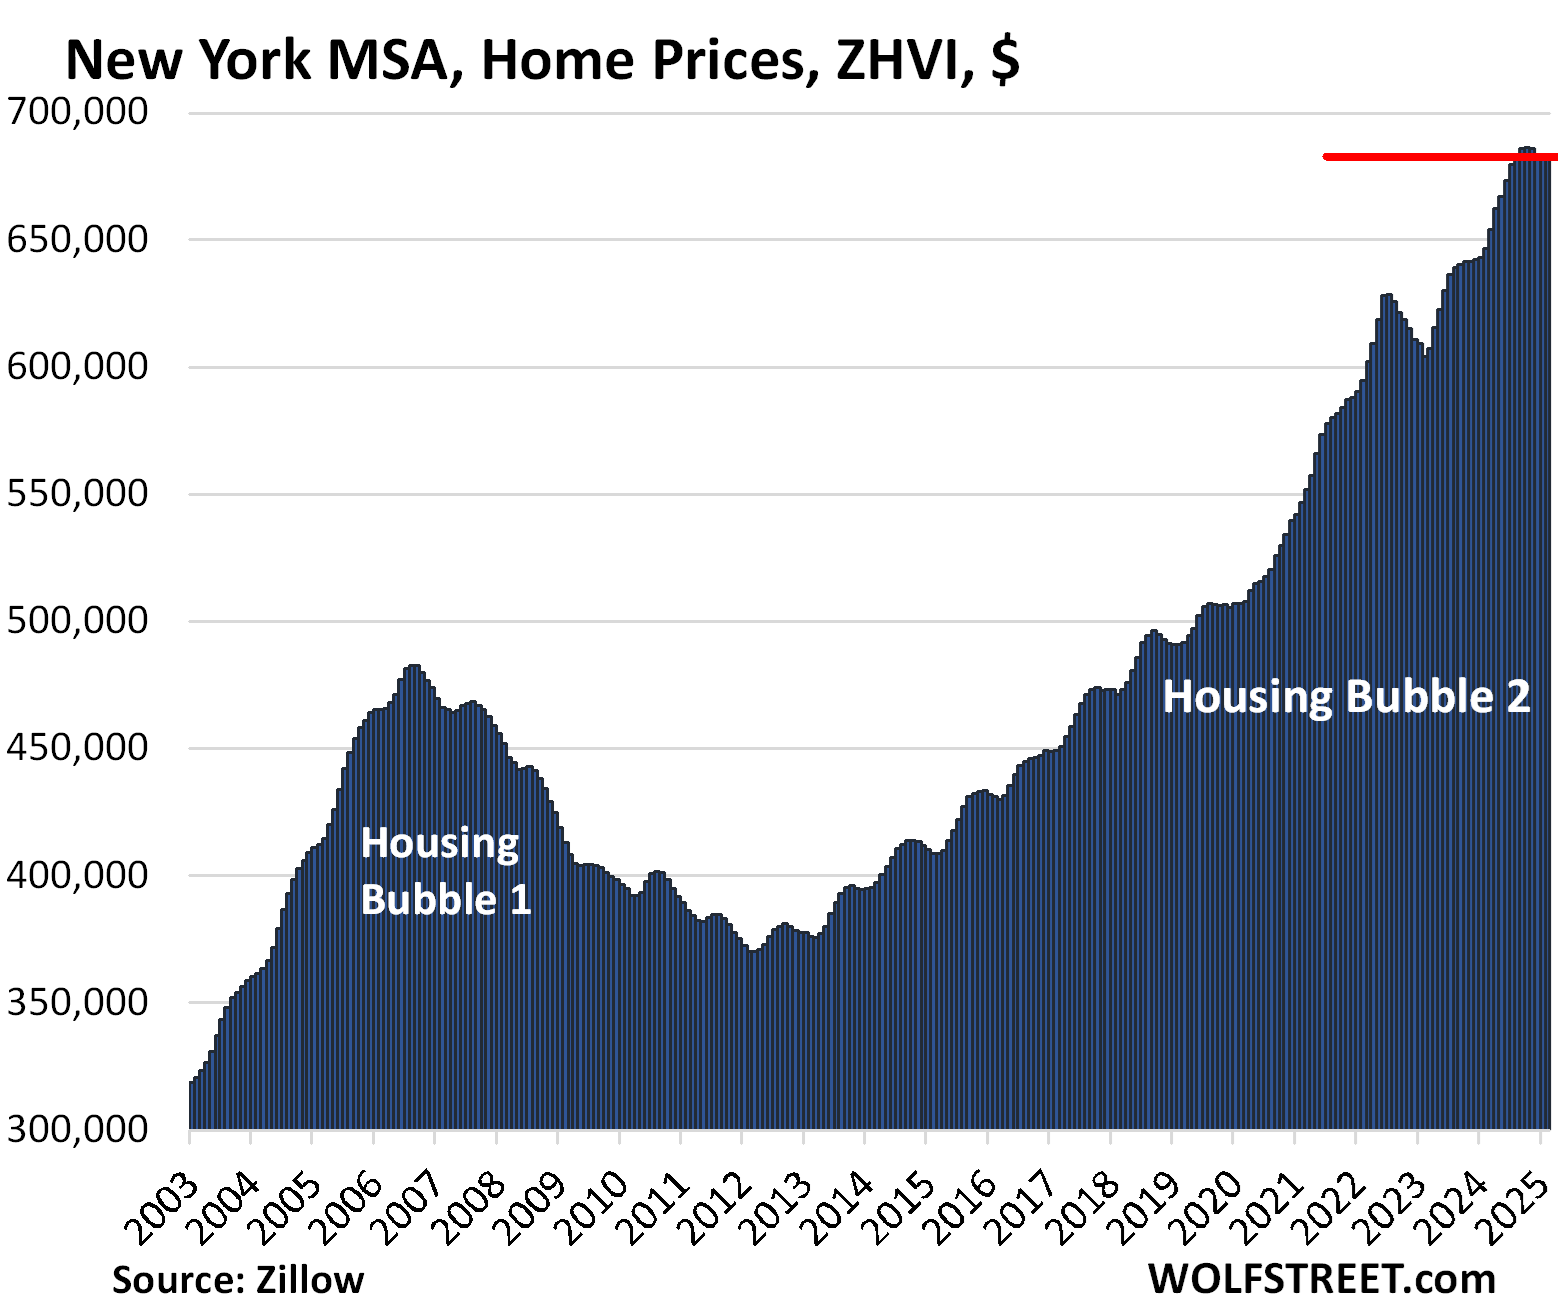
Rose past their 2022 highs (but some are now sagging): Miami, San Diego, Los Angeles, Baltimore, Kansas City, Columbus, Washington D.C., Philadelphia, Boston, Chicago, New York…
By Wolf Richter for WOLF STREET.
Prices of single-family houses, condos, and co-ops in February fell in some of the 33 large Metropolitan Statistical Areas (MSAs) on our list here. And in 21 of these metros, prices are down from the 2022 peaks. In other metros, prices rose. None made new highs in February.
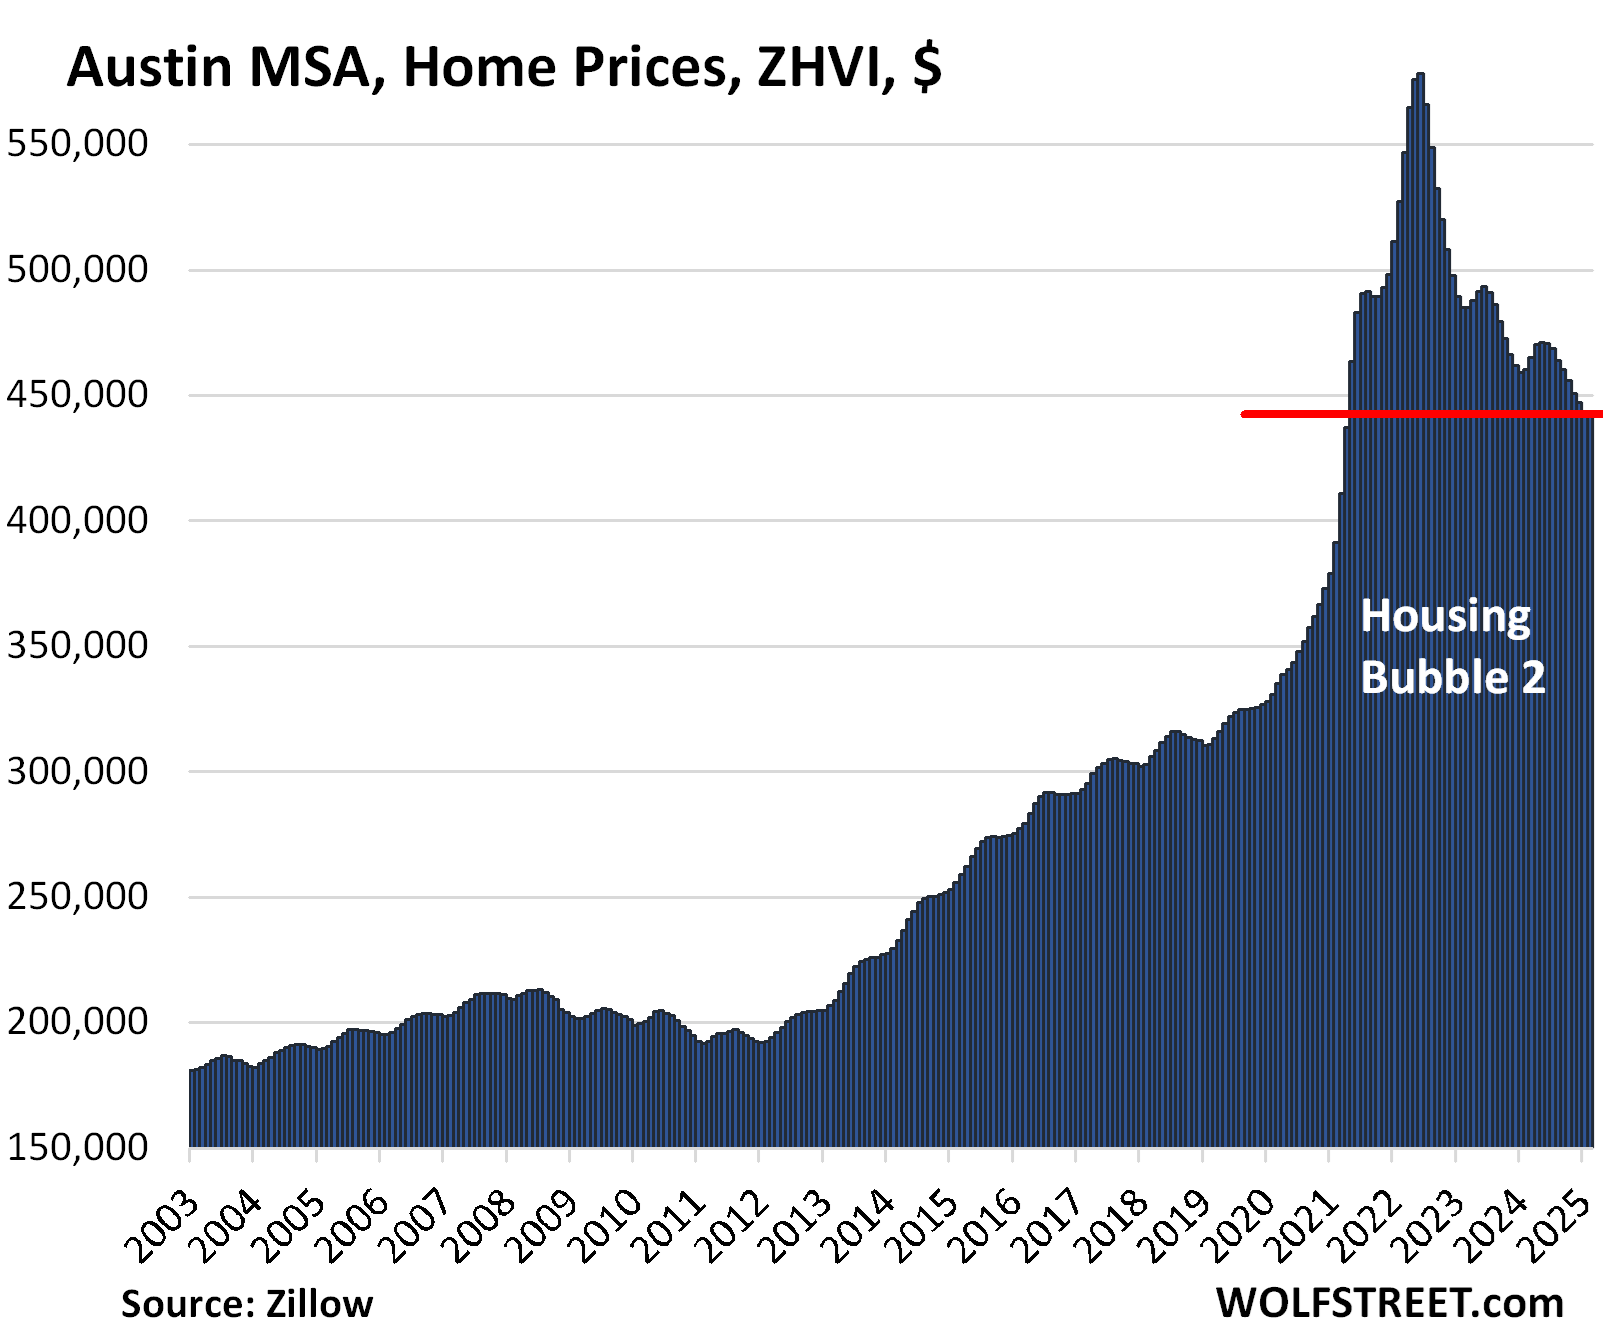
Down from the 2022 peaks: Prices in 21 metros of our 33 metros are down from their 2022 peaks, led by the metros of Austin (-23.4%), San Francisco (-10.6%), Phoenix (-10.1%), San Antonio (-9.4%), and Denver (-8.2%).
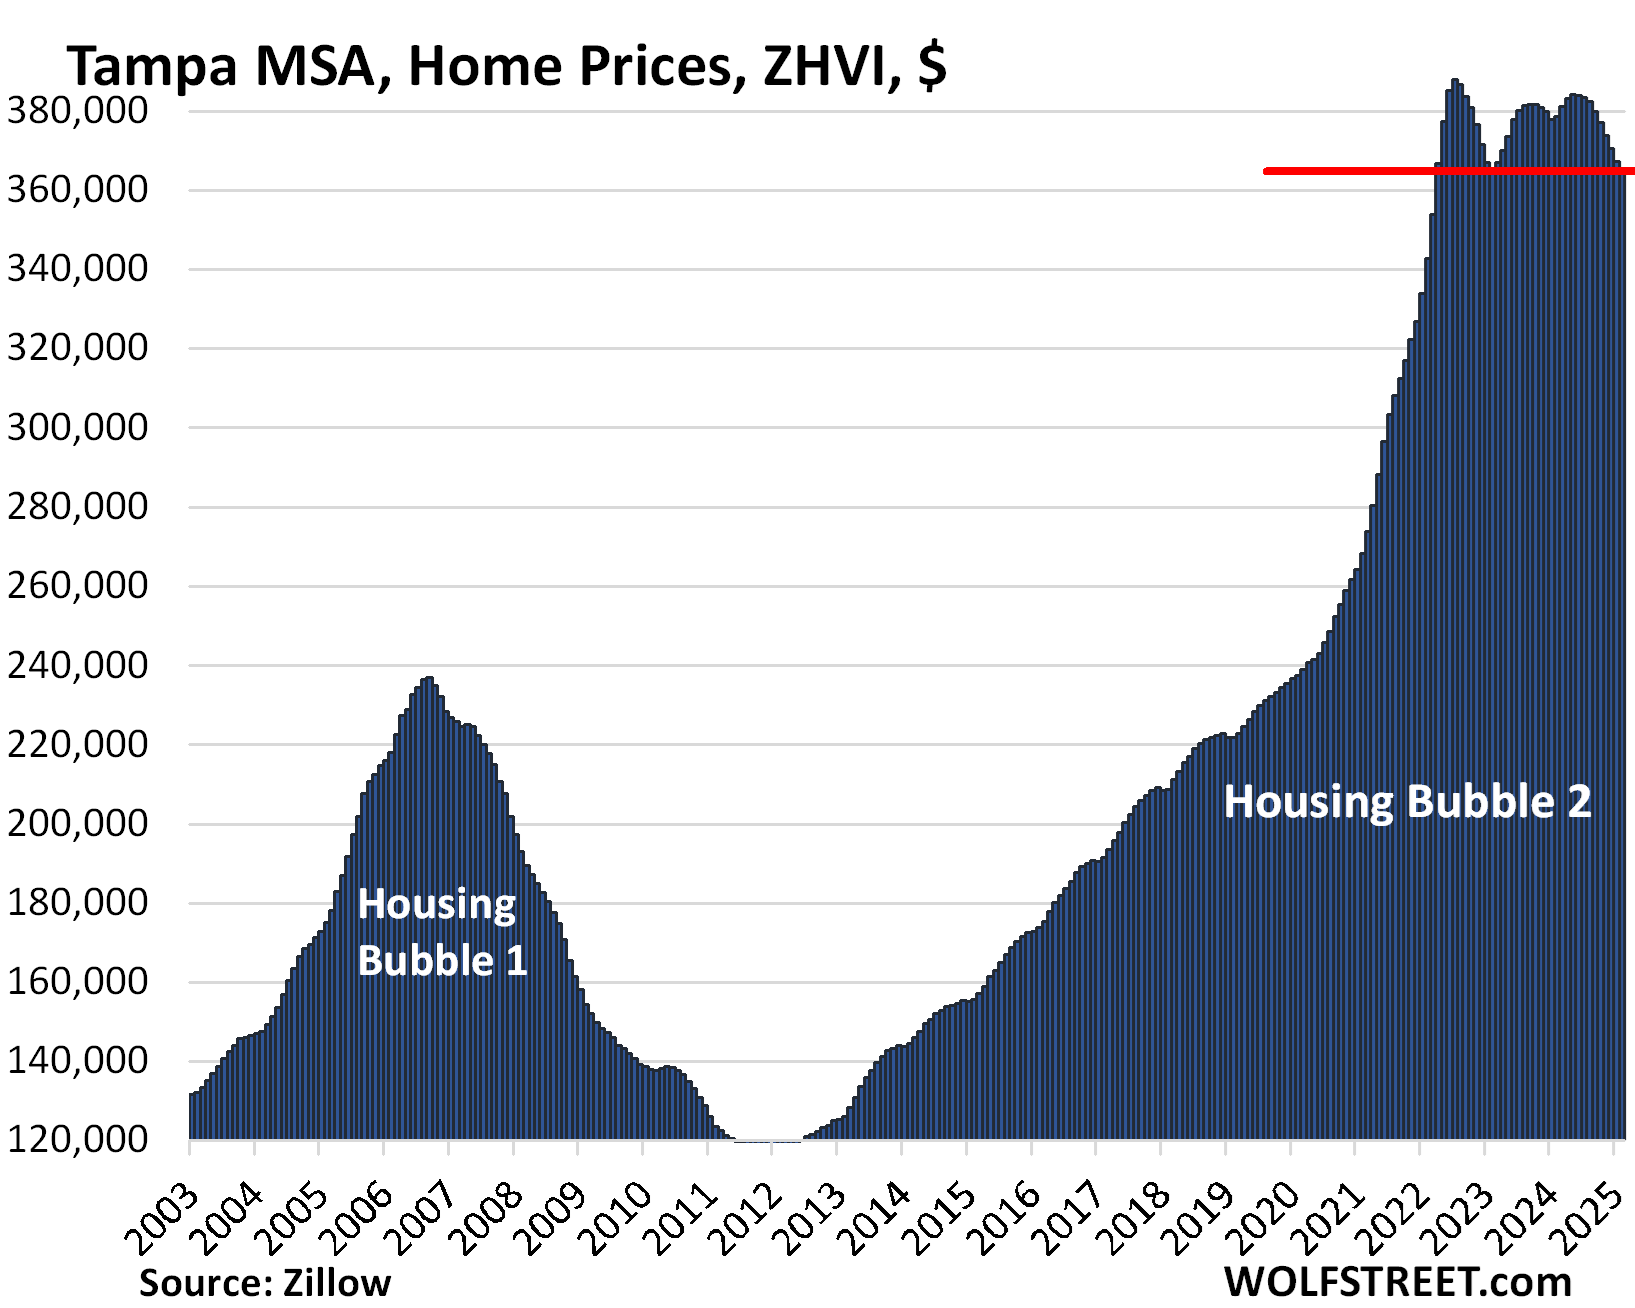
Down year-over-year: Prices in 7 metros were down year-over-year, led by Austin (-3.8%), Tampa (-3.6%), San Antonio (-2.0%), Phoenix (-1.6%) … including now Miami (-0.2%). Denver was down just a hair (-0.02%), so essentially unchanged.
No New highs in February 2025: No metro of the 33 metros here made a new high.
Some technical points. All data is from the “raw” mid-tier Zillow Home Value Index (ZHVI), released Sunday. The ZHVI is based on millions of data points in Zillow’s “Database of All Homes,” including from public records (tax data), MLS, brokerages, local Realtor Associations, real-estate agents, and households across the US. It includes pricing data for off-market deals and for-sale-by-owner deals. Zillow’s Database of All Homes also has sales-pairs data.
In some markets, there is no seasonality to home prices, as you can see in the charts below, which are not seasonally adjusted. In other markets, there is distinct seasonality, with annual price peaks occurring at roughly the same month of the year.
To qualify for this list, the MSA must be one of the largest by population, and must have had a ZHVI of at least $300,000 at the peak. The metros of New Orleans, Oklahoma City, Tulsa, Cincinnati, Pittsburgh, etc. don’t qualify for this list because their ZHVI has never reached $300,000, despite the surge of home prices in recent years, but from low levels.
The 21 metros below their highs of mid-2022.
Home prices exploded during the pandemic and through mid-2022 in these markets, driven by the Fed’s interest rate repression, including trillions of dollars of QE at the time, resulting in below-3% mortgages.
But the Fed gradually backed away from interest-rate repression starting in 2022, hiked rates, and has shed $2.2 trillion in assets from its balance sheet. Since September 2022, mortgage rates have been around 7%, give or take some – they’re currently at 6.65%, according to the Mortgage Bankers Association – and these rates were normal before QE started in 2008.
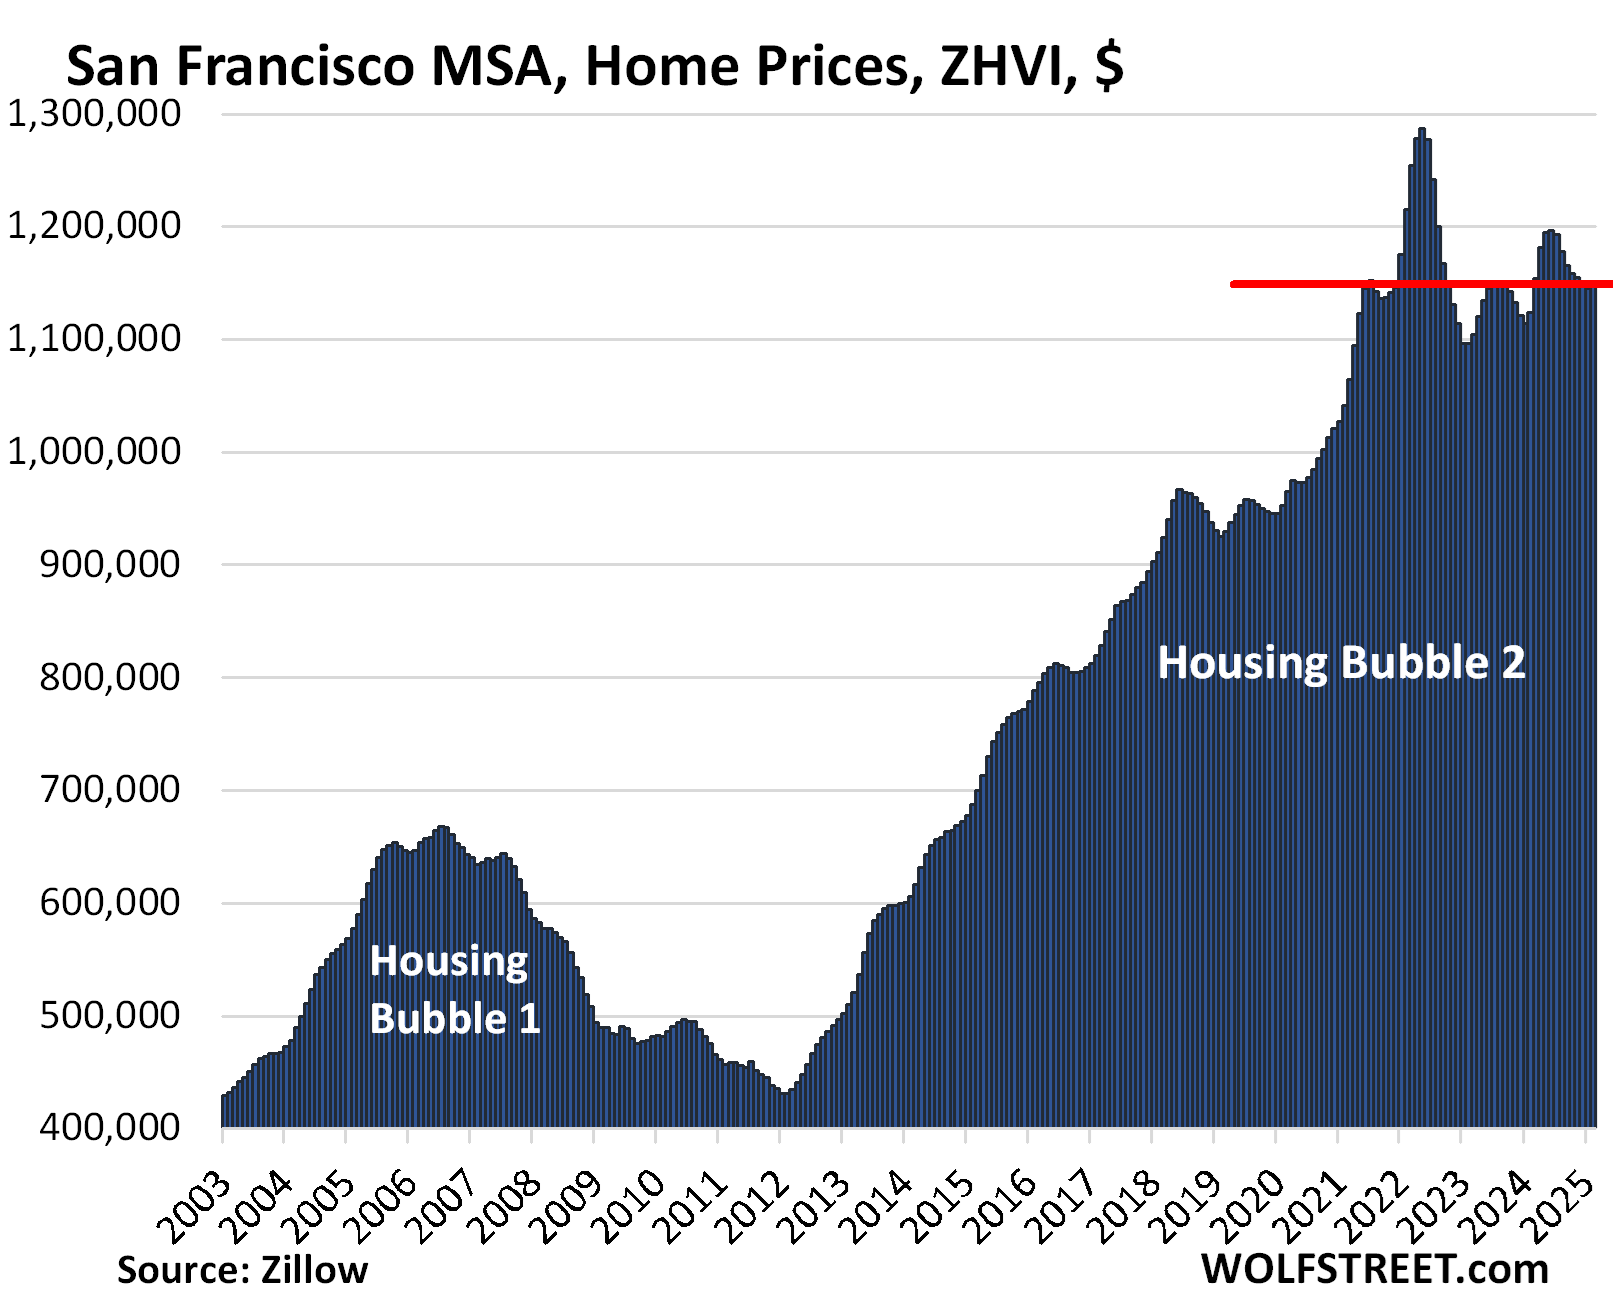
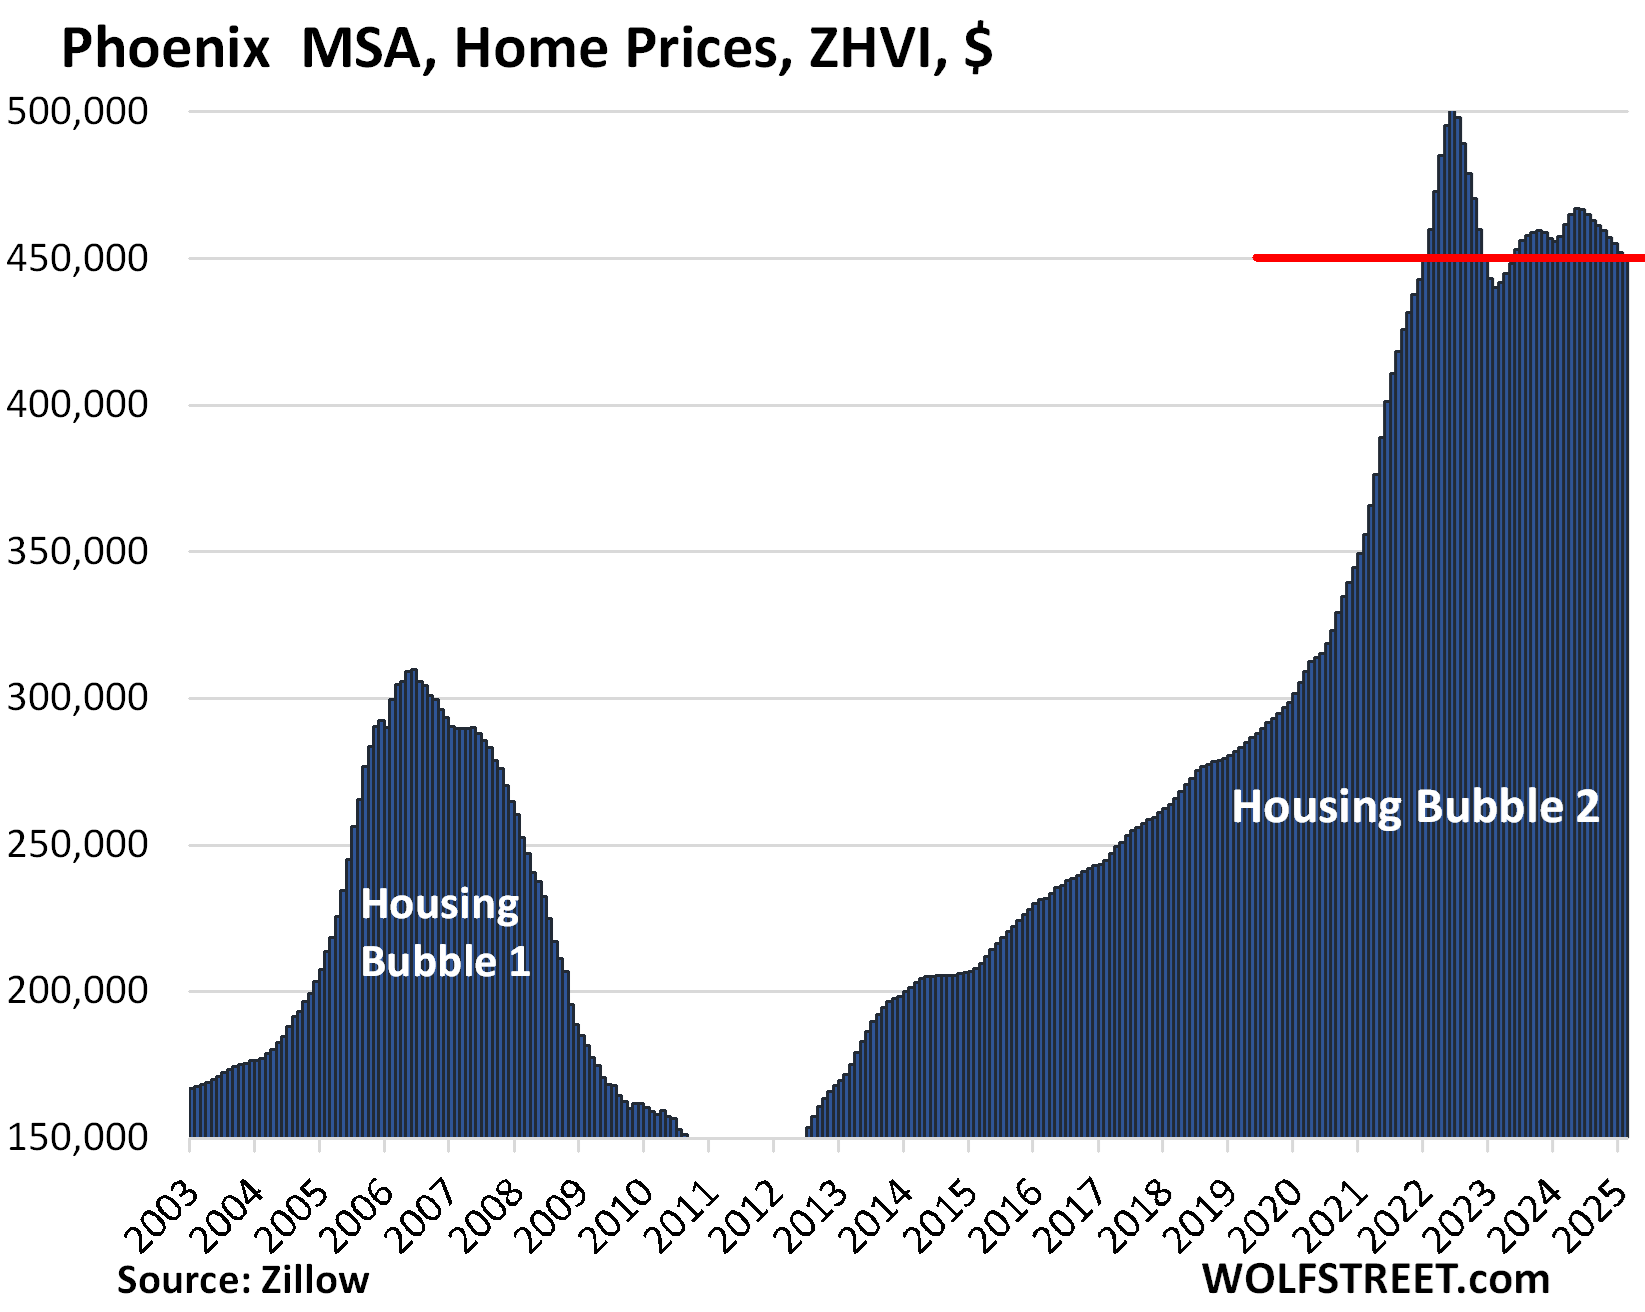
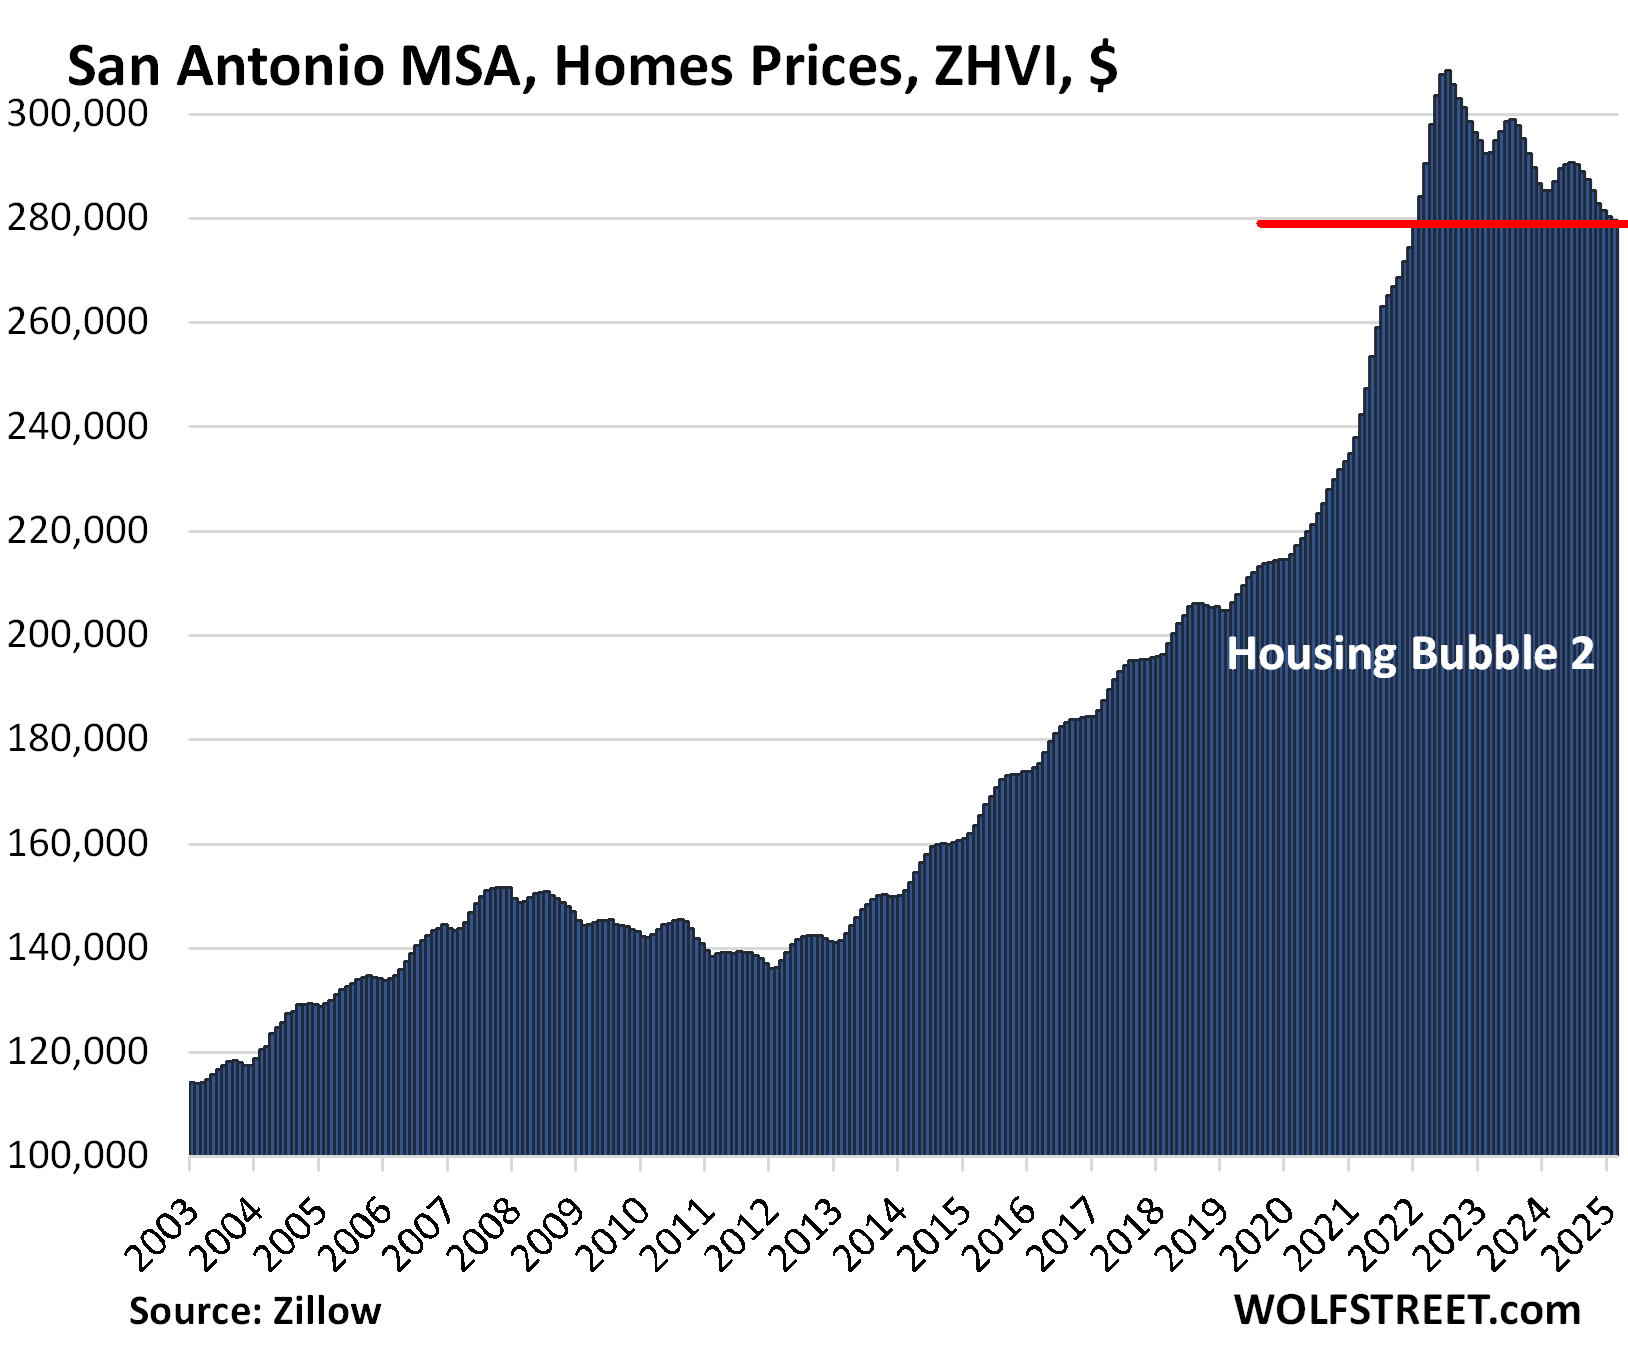
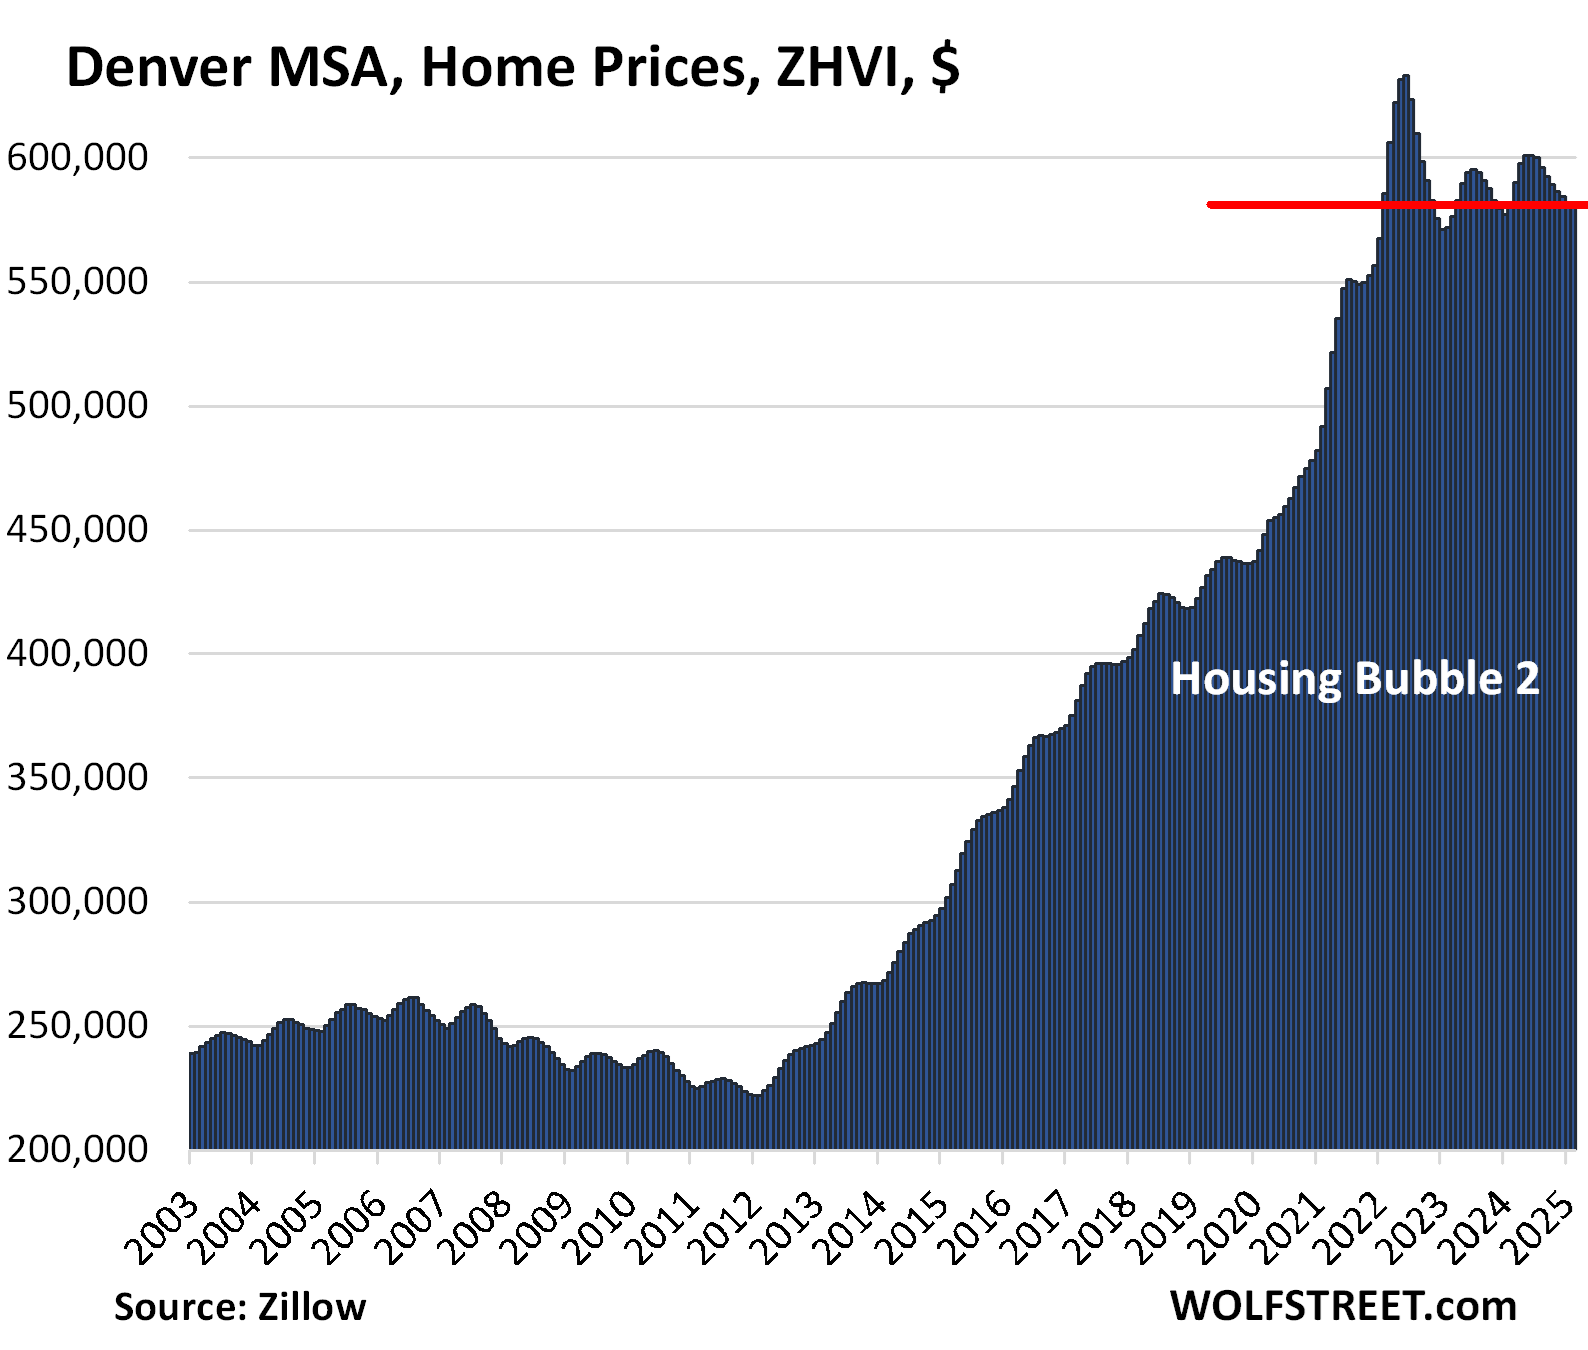
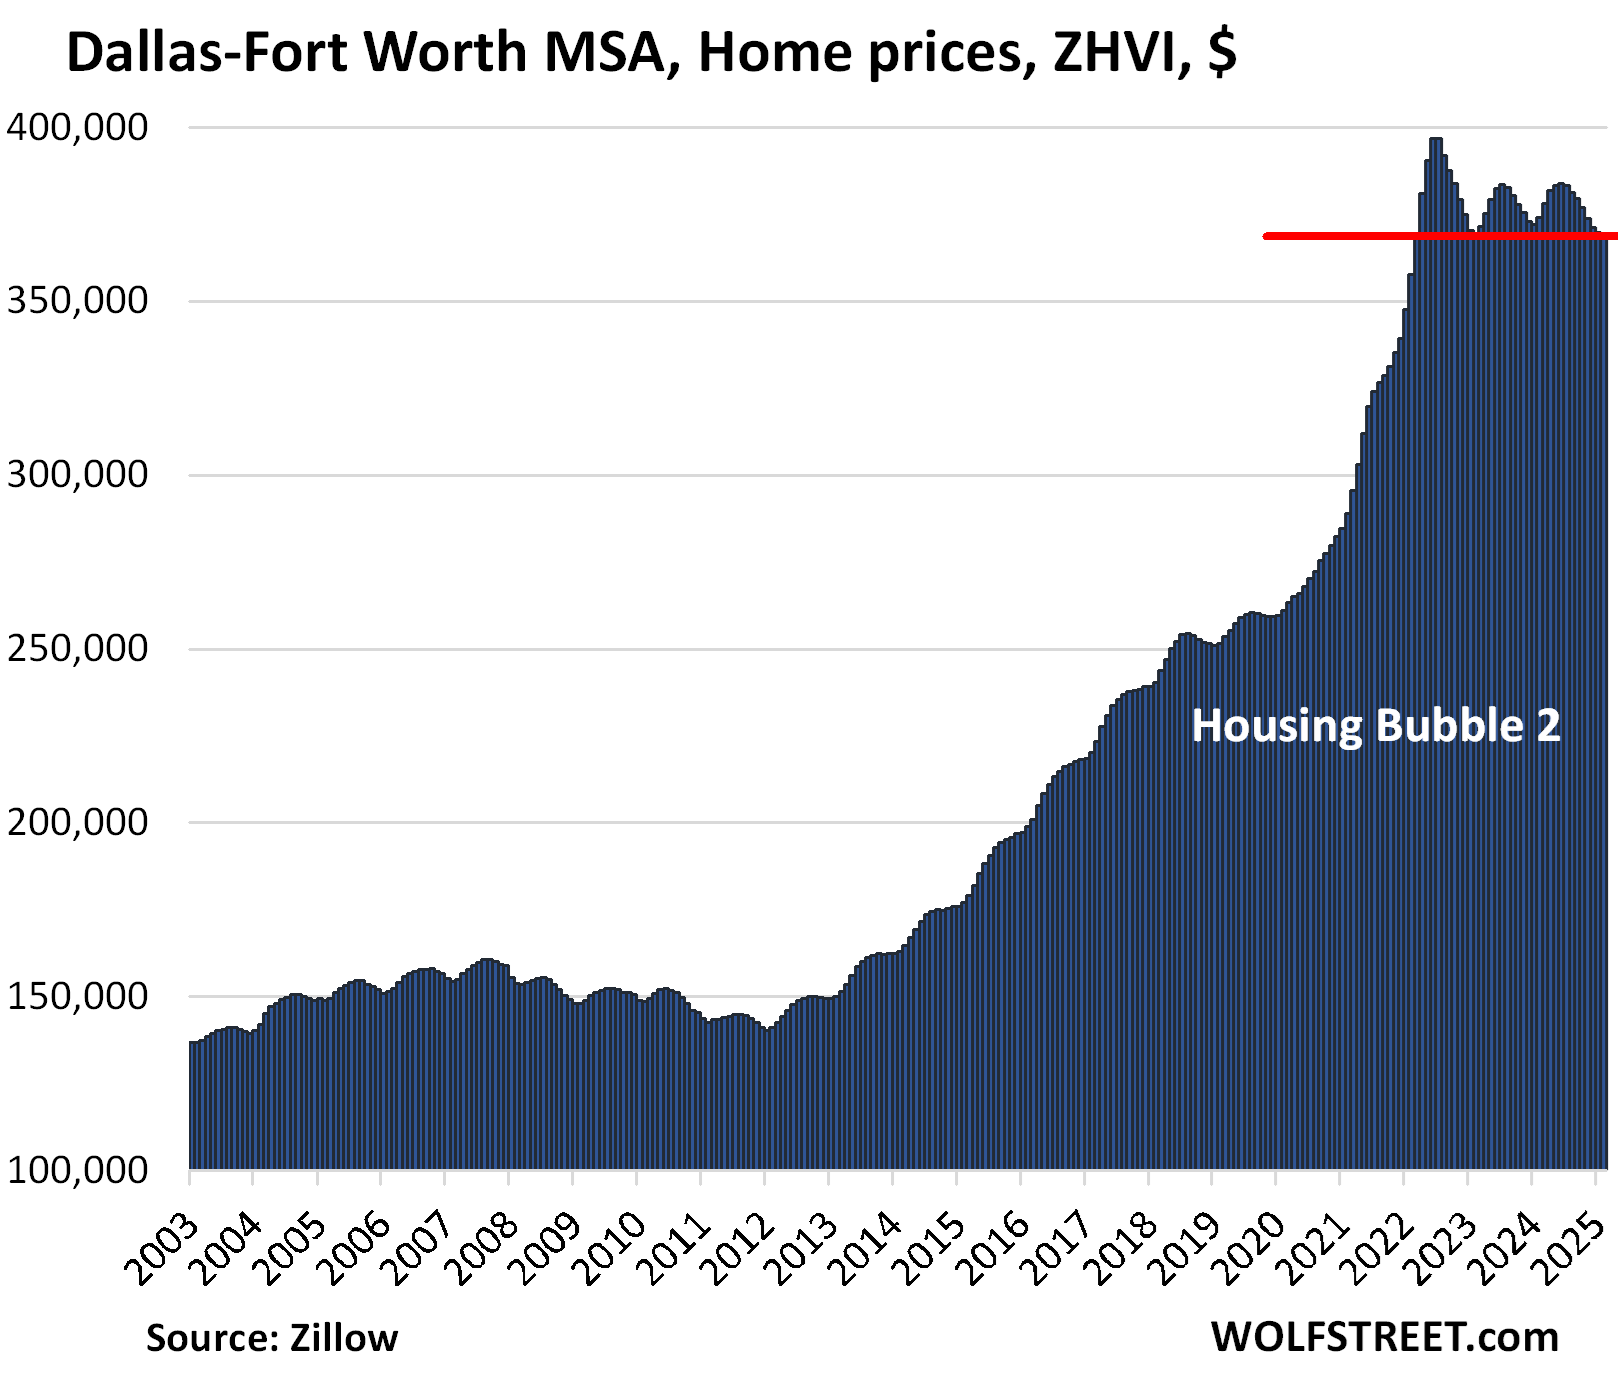
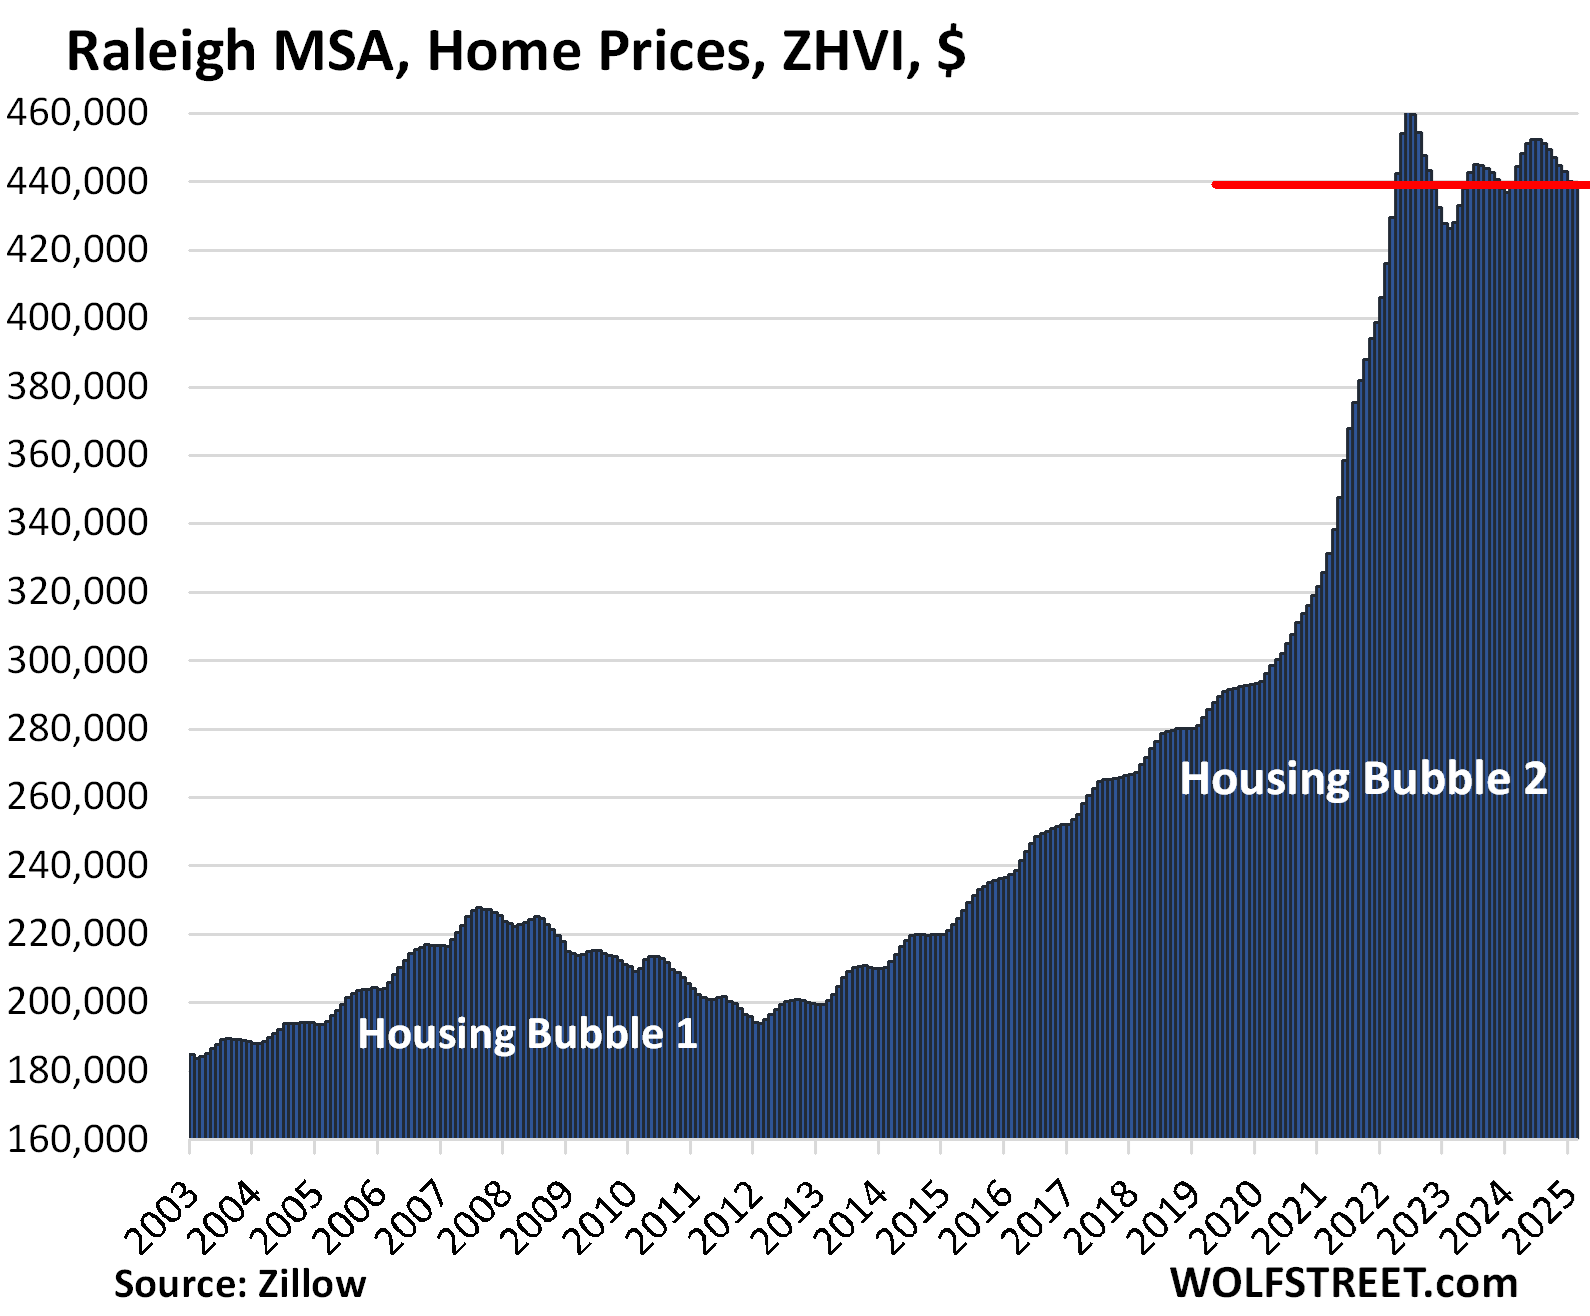
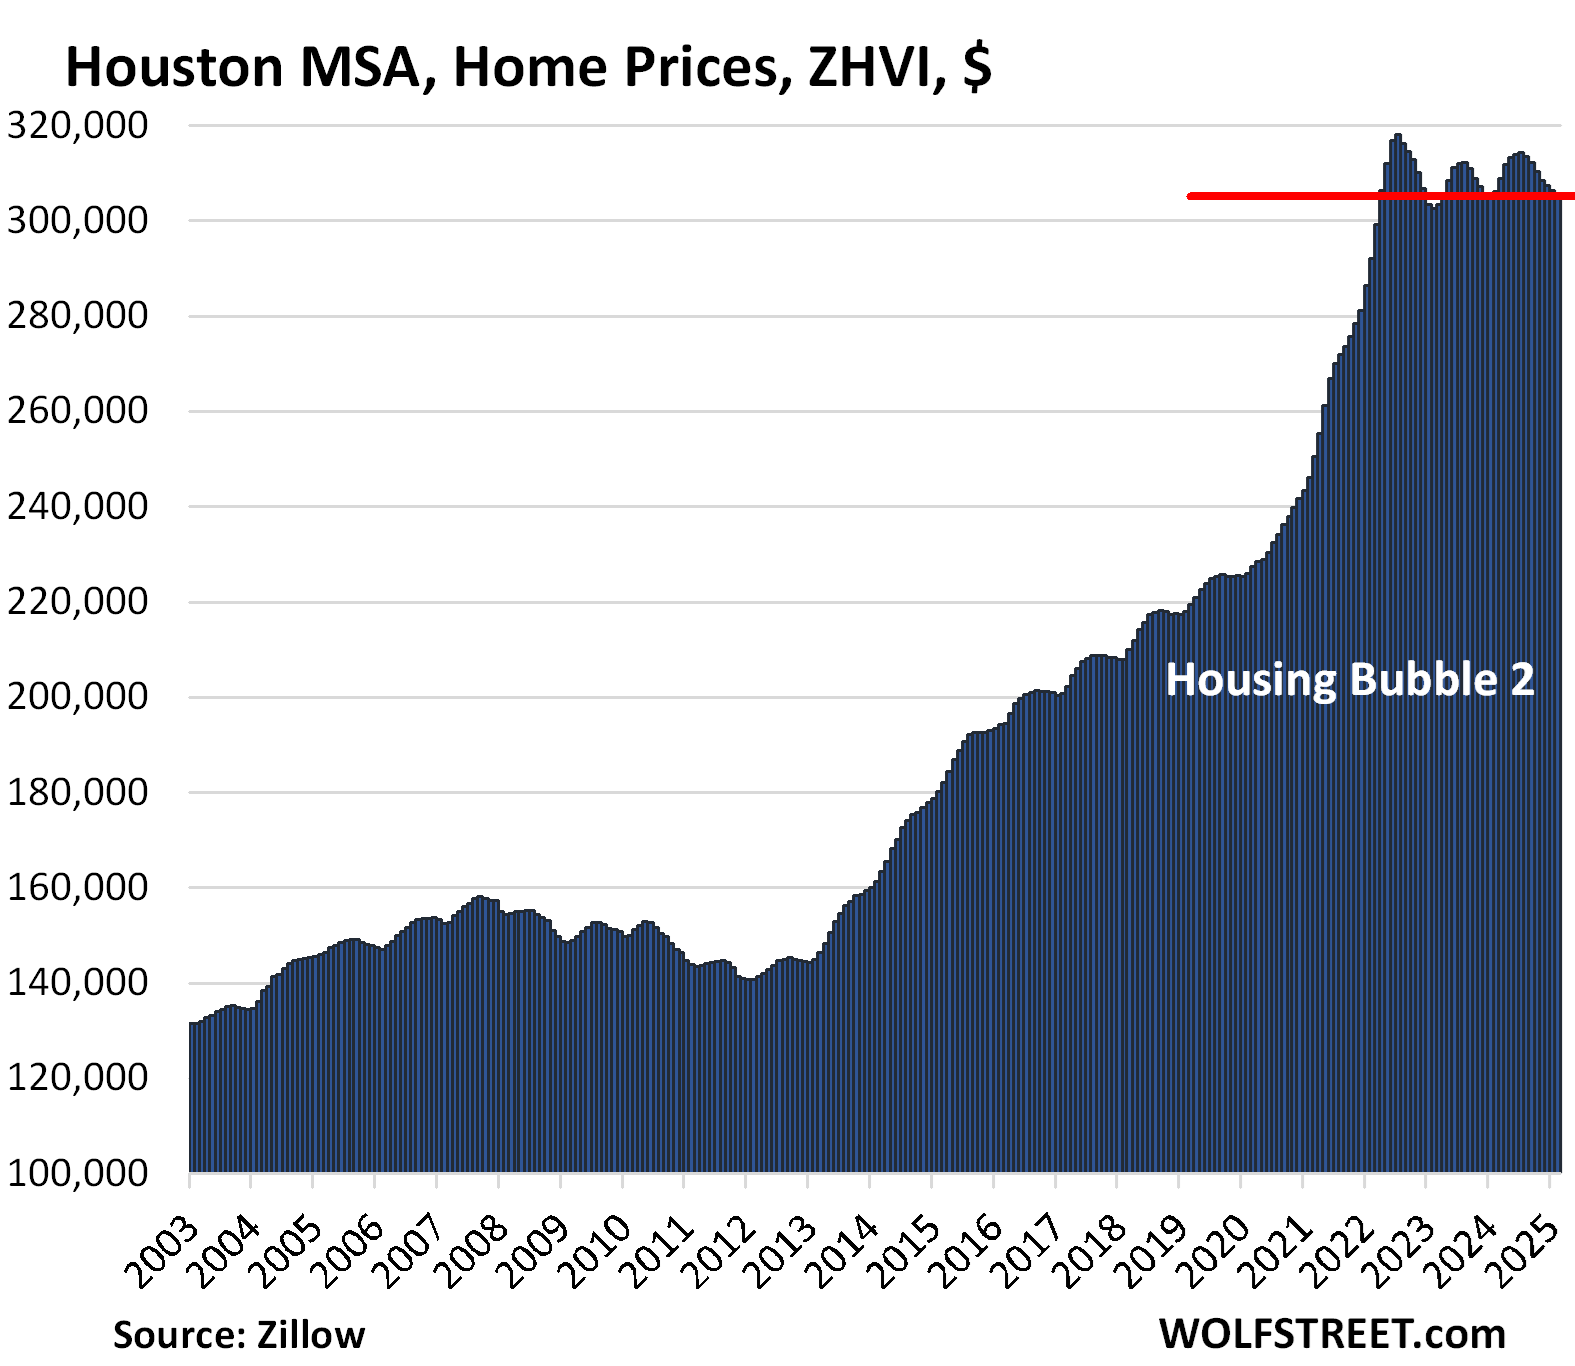
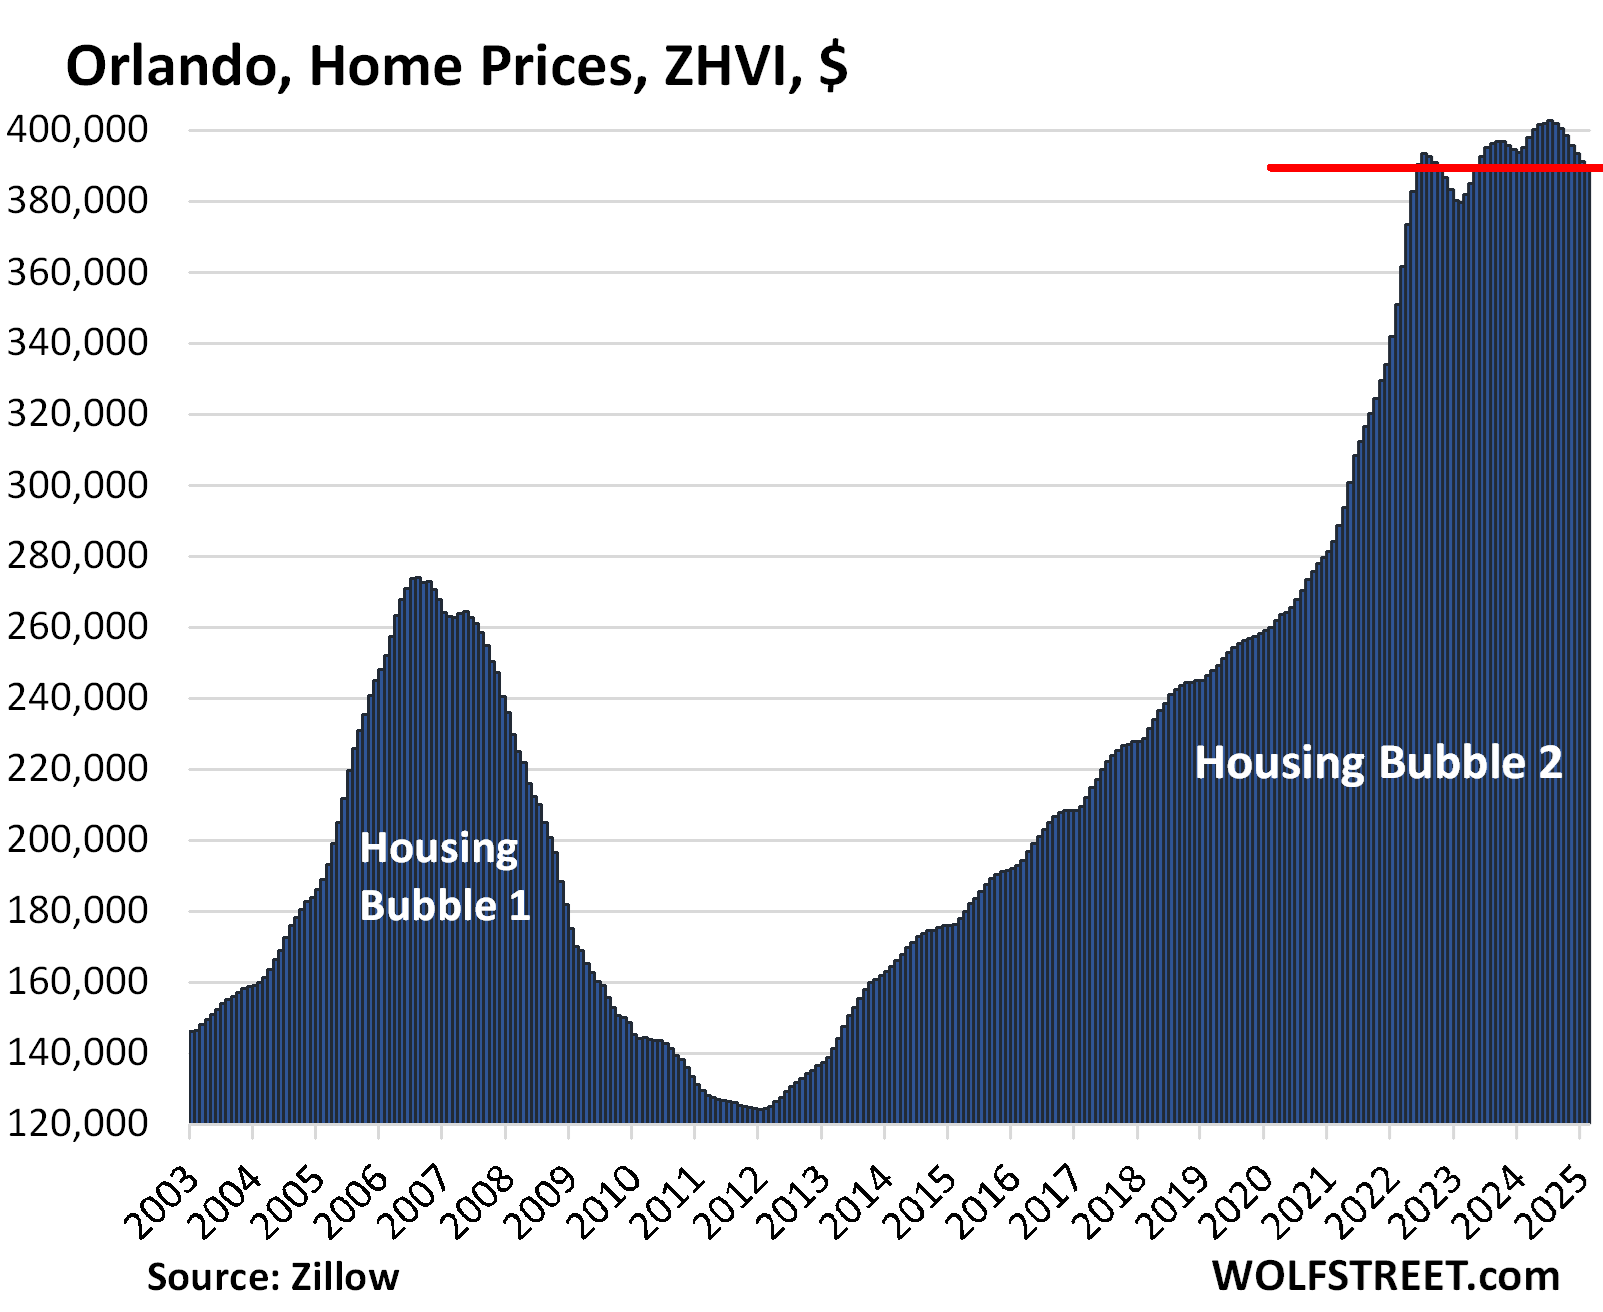
One curious thing visible in the charts – on top of their inherent absurdity – is that the metros in Texas, the Denver metro, and a few other metros didn’t experience Housing Bubble 1 which began to implode in 2006. Texas had finally gotten through with a huge housing bust some years earlier, and it therefore didn’t experience the big price drops in 2006 to 2012, just moderate declines. But its Housing Bubble 2 was a doozie.
| Austin MSA, Home Prices | |||
| From Jun 2022 peak | MoM | YoY | Since 2000 |
| -23.4% | -0.1% | -3.8% | 153% |
The Austin MSA includes the counties of Travis (Austin-Round Rock), Williamson, Hays, Caldwell, and Bastrop.
Prices are back where they’d been in April 2021. No real estate chart should ever look like this absurdity.
| San Francisco MSA, Home Prices | |||
| From May 2022 peak | MoM | YoY | Since 2000 |
| -10.6% | 0.5% | 2.4% | 290% |
The MSA includes San Francisco, Oakland, much of the East Bay, much of the North Bay, and goes south on the Peninsula into Silicon Valley through San Mateo County.
Prices are back where they’d first been in June 2021.
| Phoenix MSA, Home Prices | |||
| From Jun 2022 peak | MoM | YoY | Since 2000 |
| -10.1% | -0.4% | -1.6% | 216% |
Prices are back where they’d first been in January 2022:
| San Antonio MSA, Home Prices | |||
| From Jul 2022 peak | MoM | YoY | Since 2000 |
| -9.4% | -0.3% | -2.0% | 145.6% |
Prices have dropped to the lowest level since January 2022.
| Denver MSA, Home Prices | |||
| From Jun 2022 peak | MoM | YoY | Since 2000 |
| -8.2% | 0.0% | 0.0% | 209% |
Prices are back where they’d first been in February 2022.
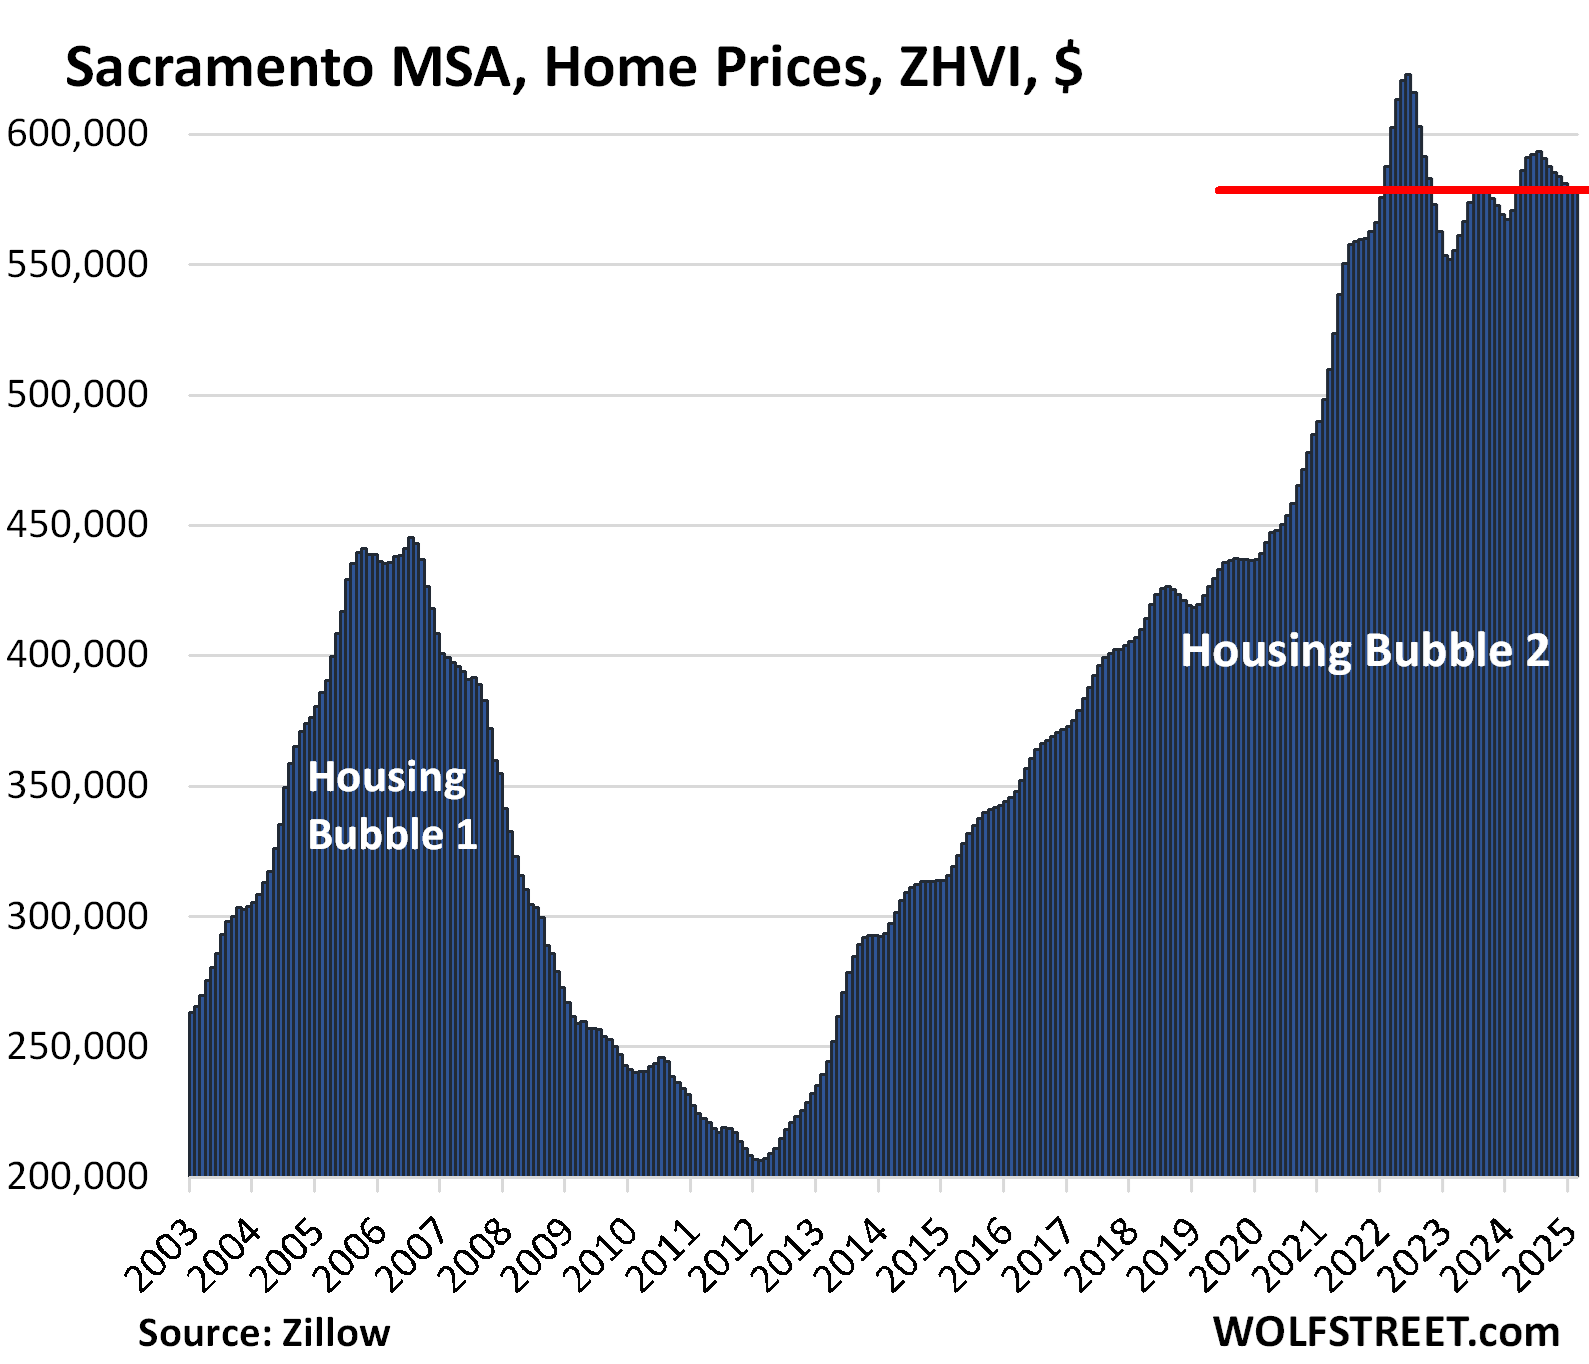
| Sacramento MSA, Home Prices | |||
| From July 2022 peak | MoM | YoY | Since 2000 |
| -7.2% | 0.0% | 1.3% | 243.1% |
| Dallas-Fort Worth MSA, Home Prices | |||
| From Jun 2022 peak | MoM | YoY | Since 2000 |
| -7.1% | -0.2% | -1.4% | 190% |
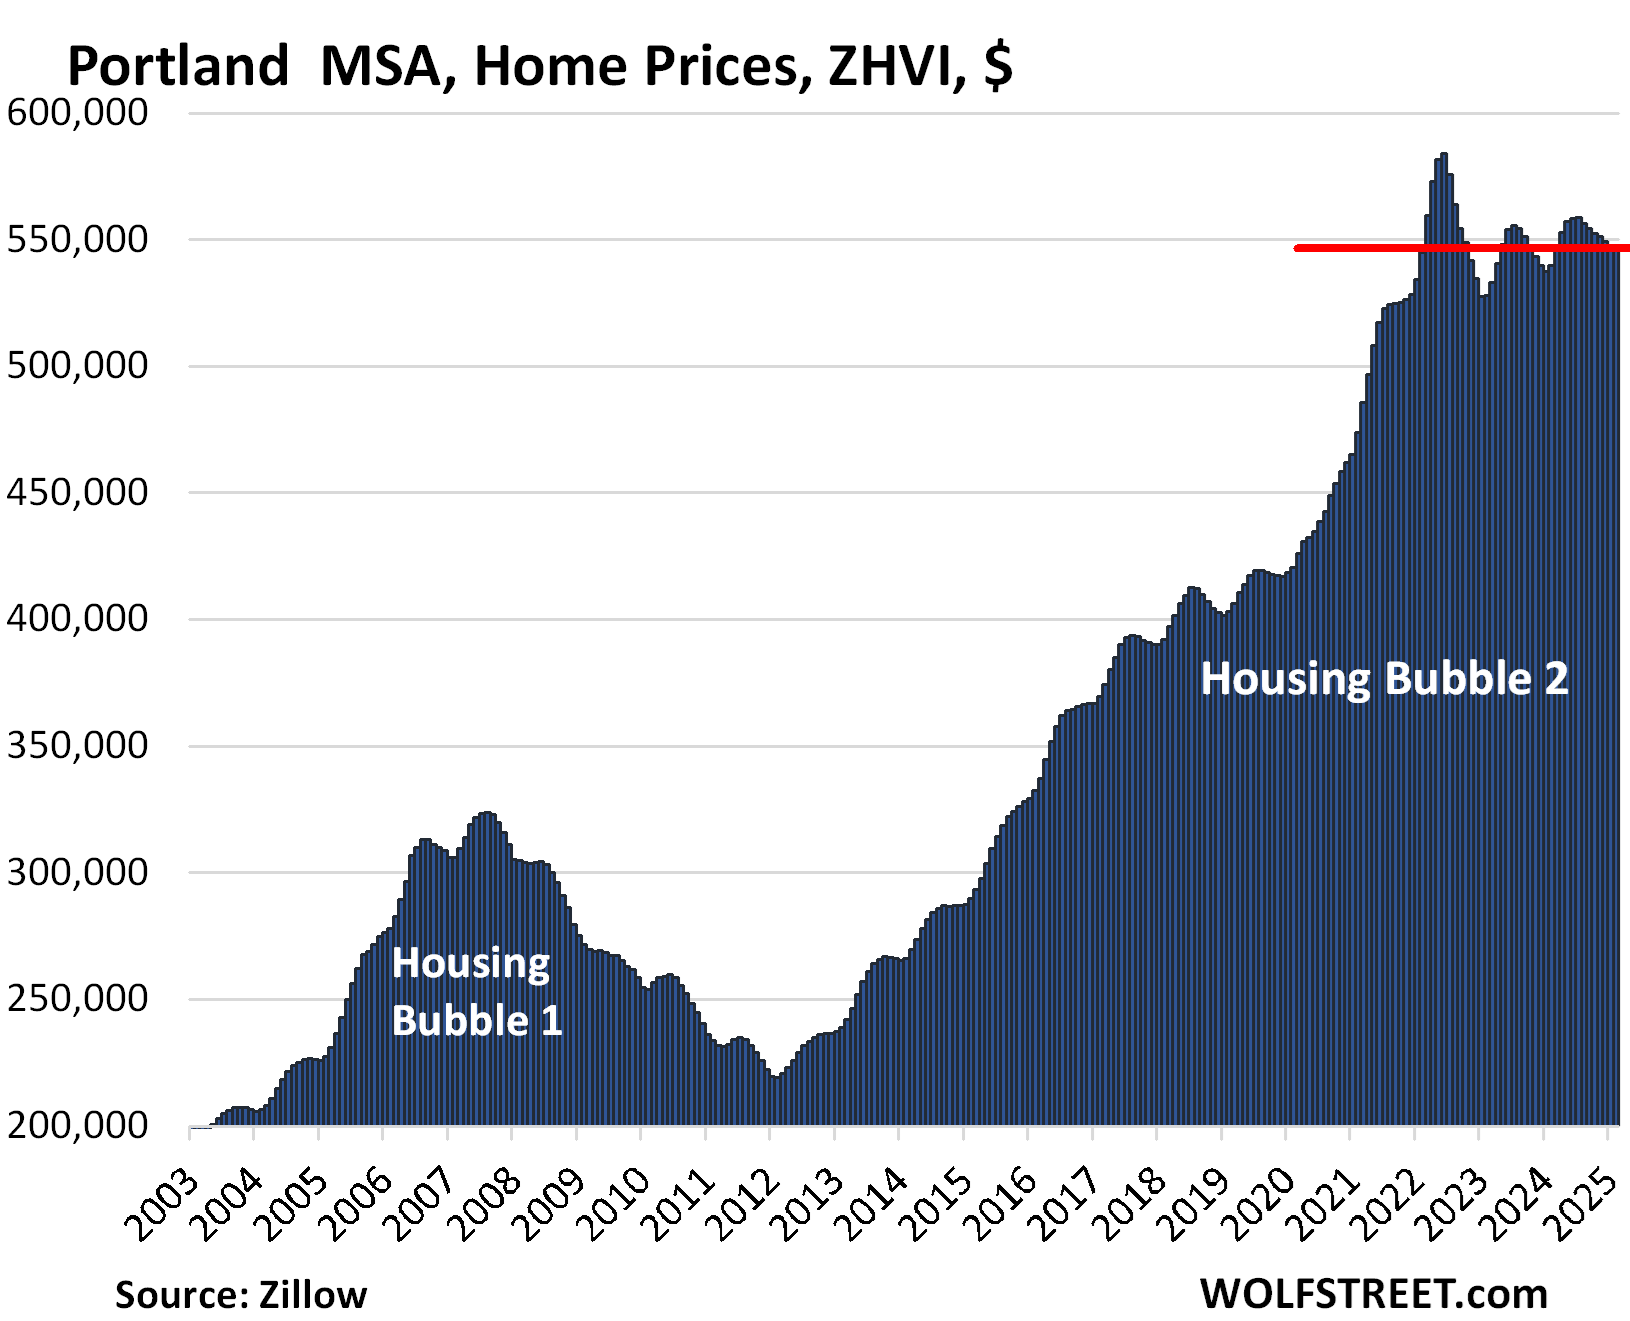
| Portland MSA, Home Prices | |||
| From May 2022 peak | MoM | YoY | Since 2000 |
| -6.3% | 0.1% | 1.3% | 216% |
Prices are back where they’d first been in January 2022.
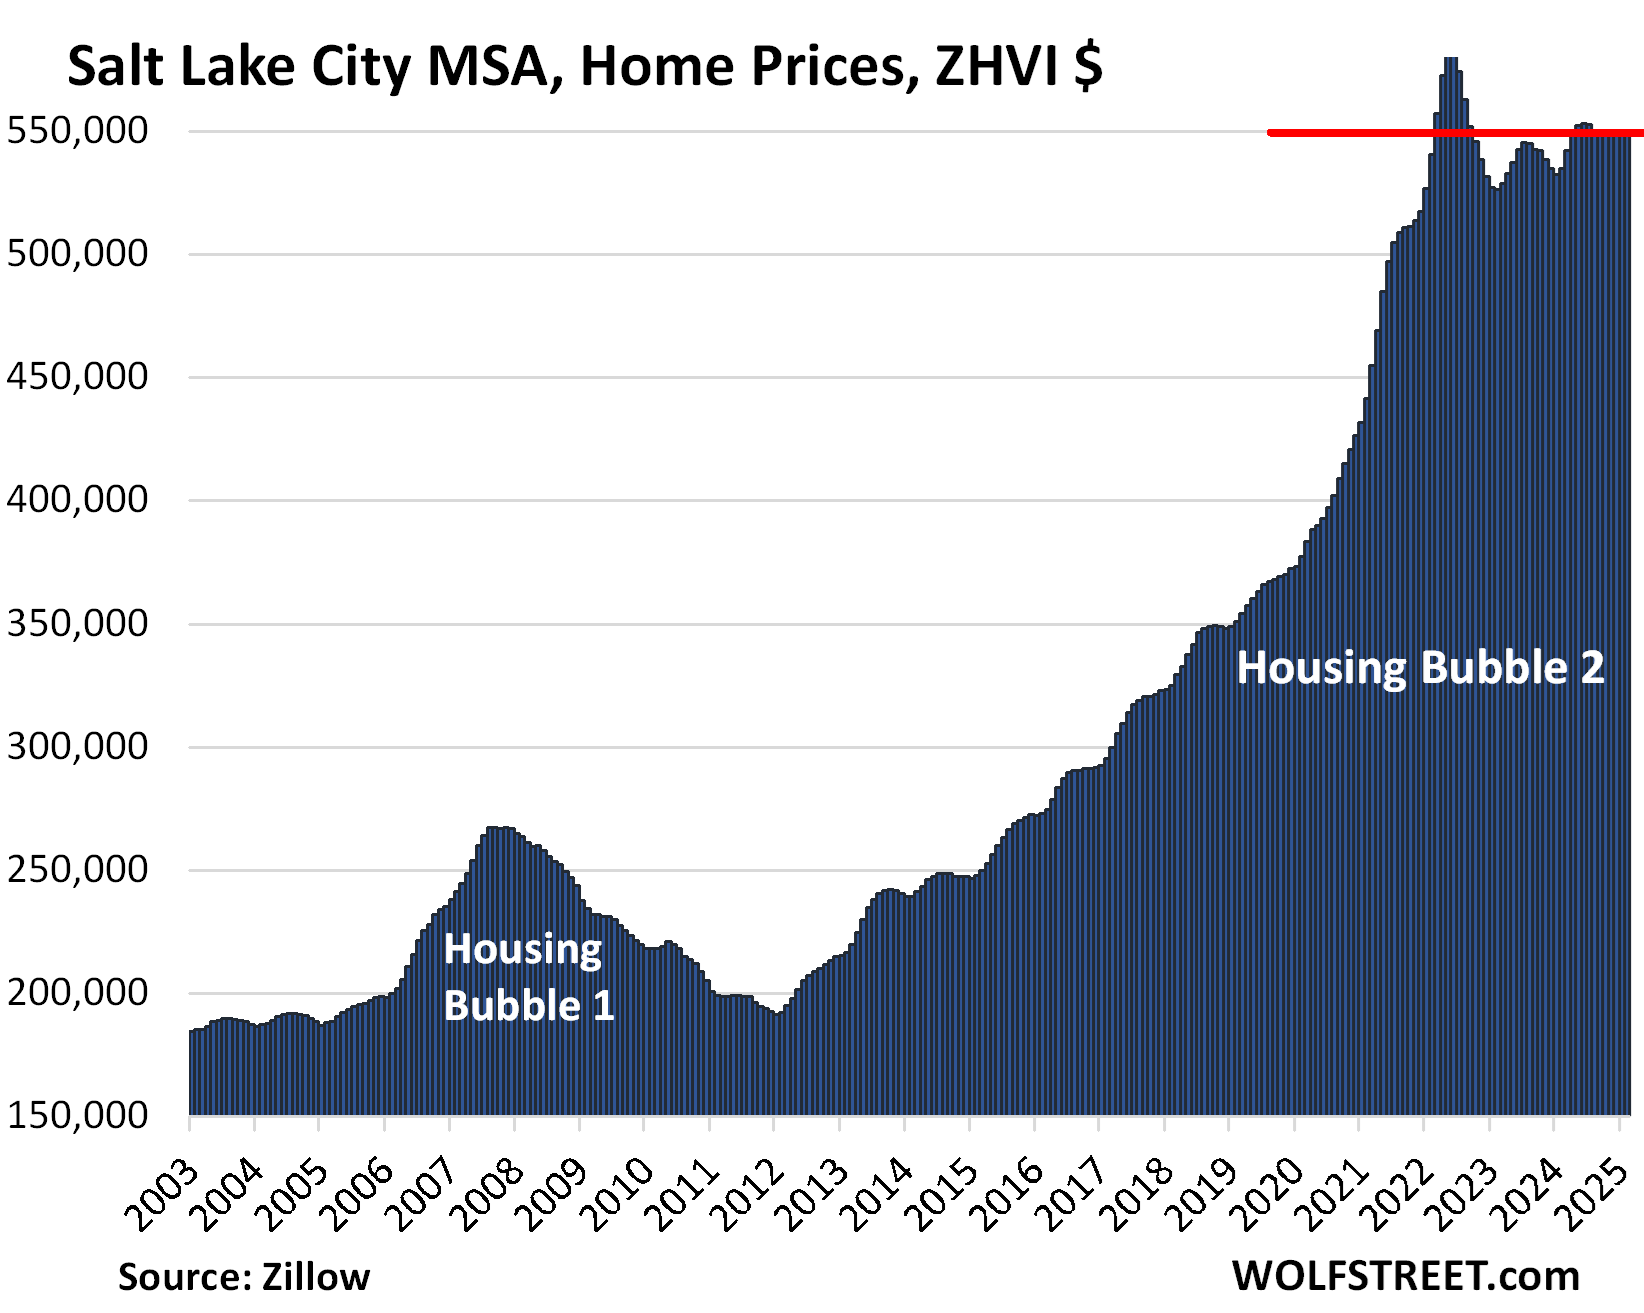
| Salt Lake City MSA, Home Prices | |||
| From July 2022 peak | MoM | YoY | Since 2000 |
| -5.8% | 0.2% | 2.7% | 214% |
First seen in March 2022:
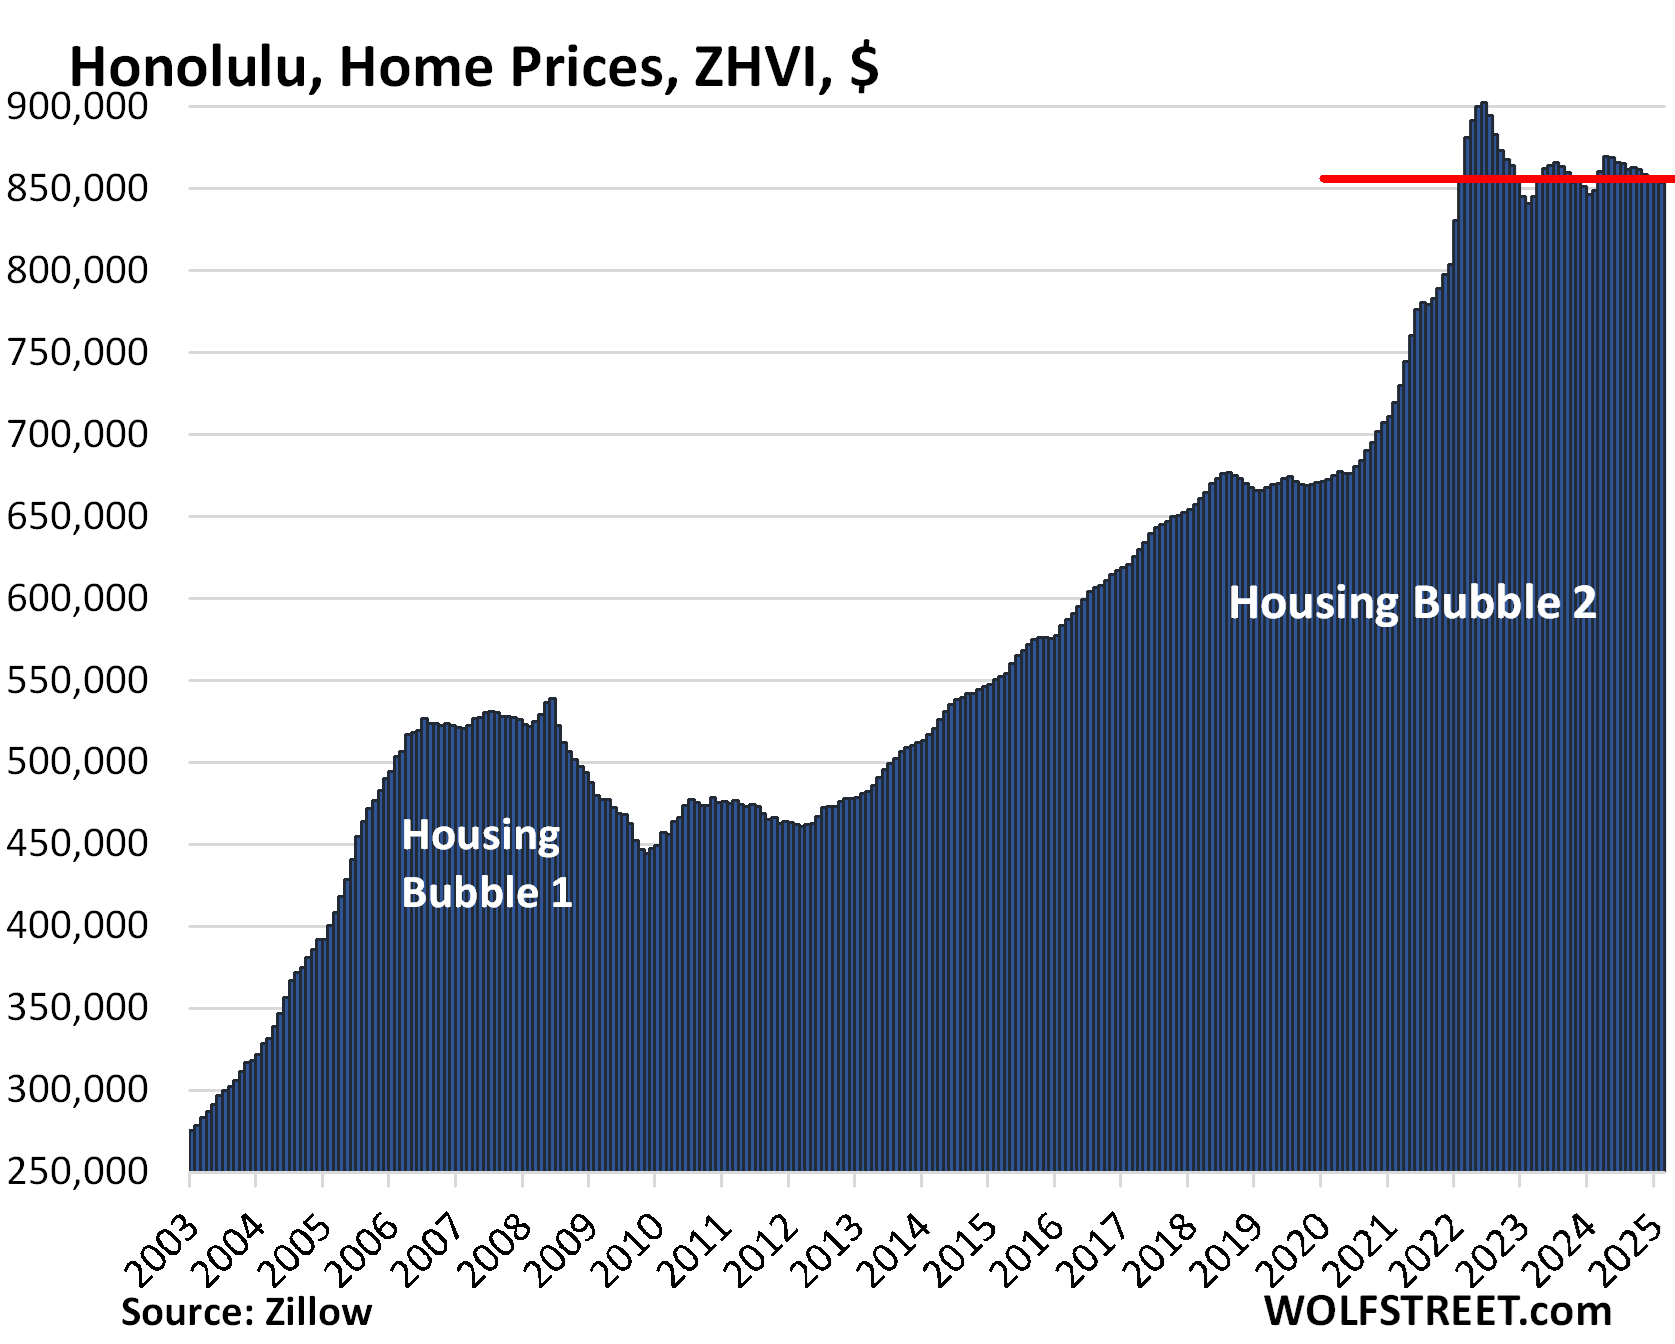
| Honolulu, Home Prices | |||
| From Jun 2022 peak | MoM | YoY | Since 2000 |
| -5.4% | 0.0% | 0.6% | 278% |
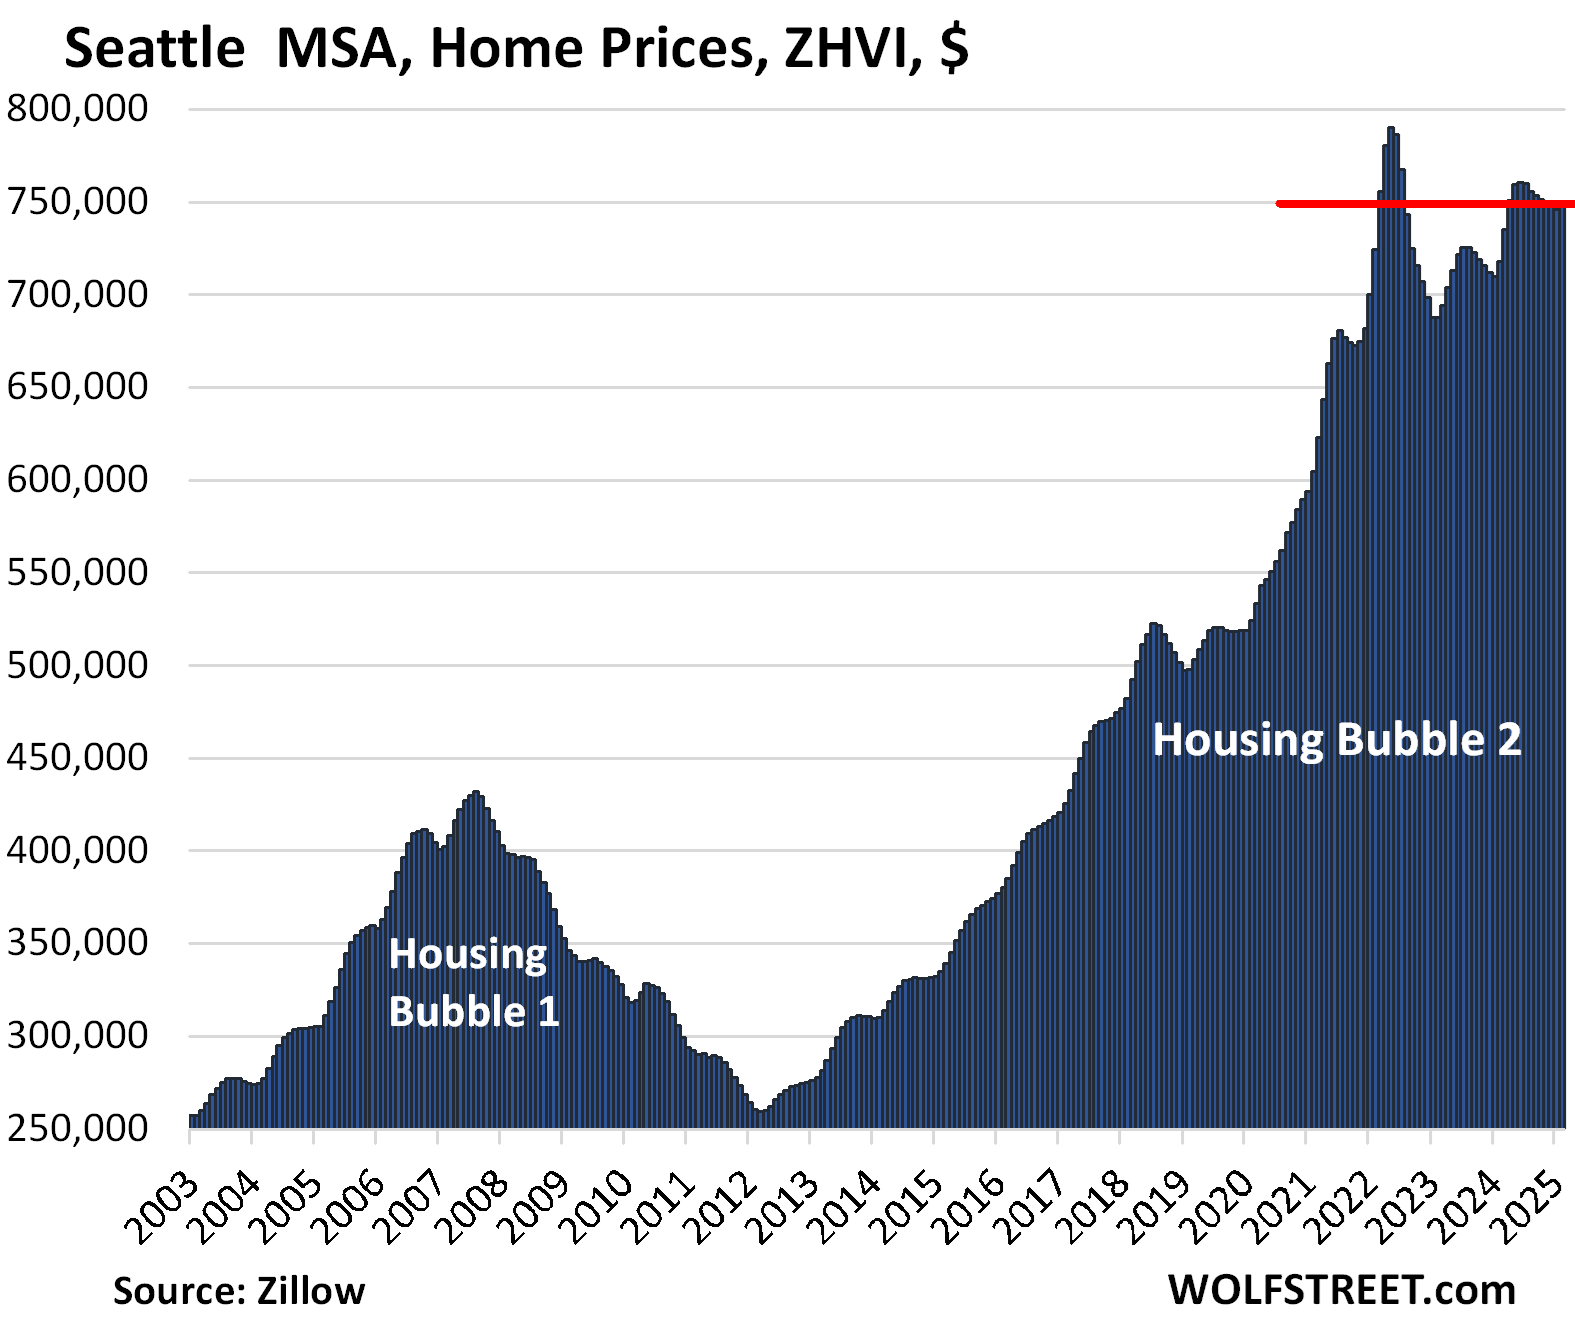
| Seattle MSA, Home Prices | |||
| From May 2022 peak | MoM | YoY | Since 2000 |
| -5.2% | 0.4% | 4.3% | 238% |
| Tampa MSA, Home Prices | |||
| From Jul 2022 peak | MoM | YoY | Since 2000 |
| -4.9% | -0.4% | -1.5% | 207% |
| Raleigh MSA, Home Prices | |||
| From July 2022 peak | MoM | YoY | Since 2000 |
| -4.6% | -0.2% | 0.0% | 155% |
| Houston MSA, Home Prices | |||
| From Jul 2022 peak | MoM | YoY | Since 2000 |
| -3.9% | -0.2% | -0.2% | 148% |
First seen in April 2022.
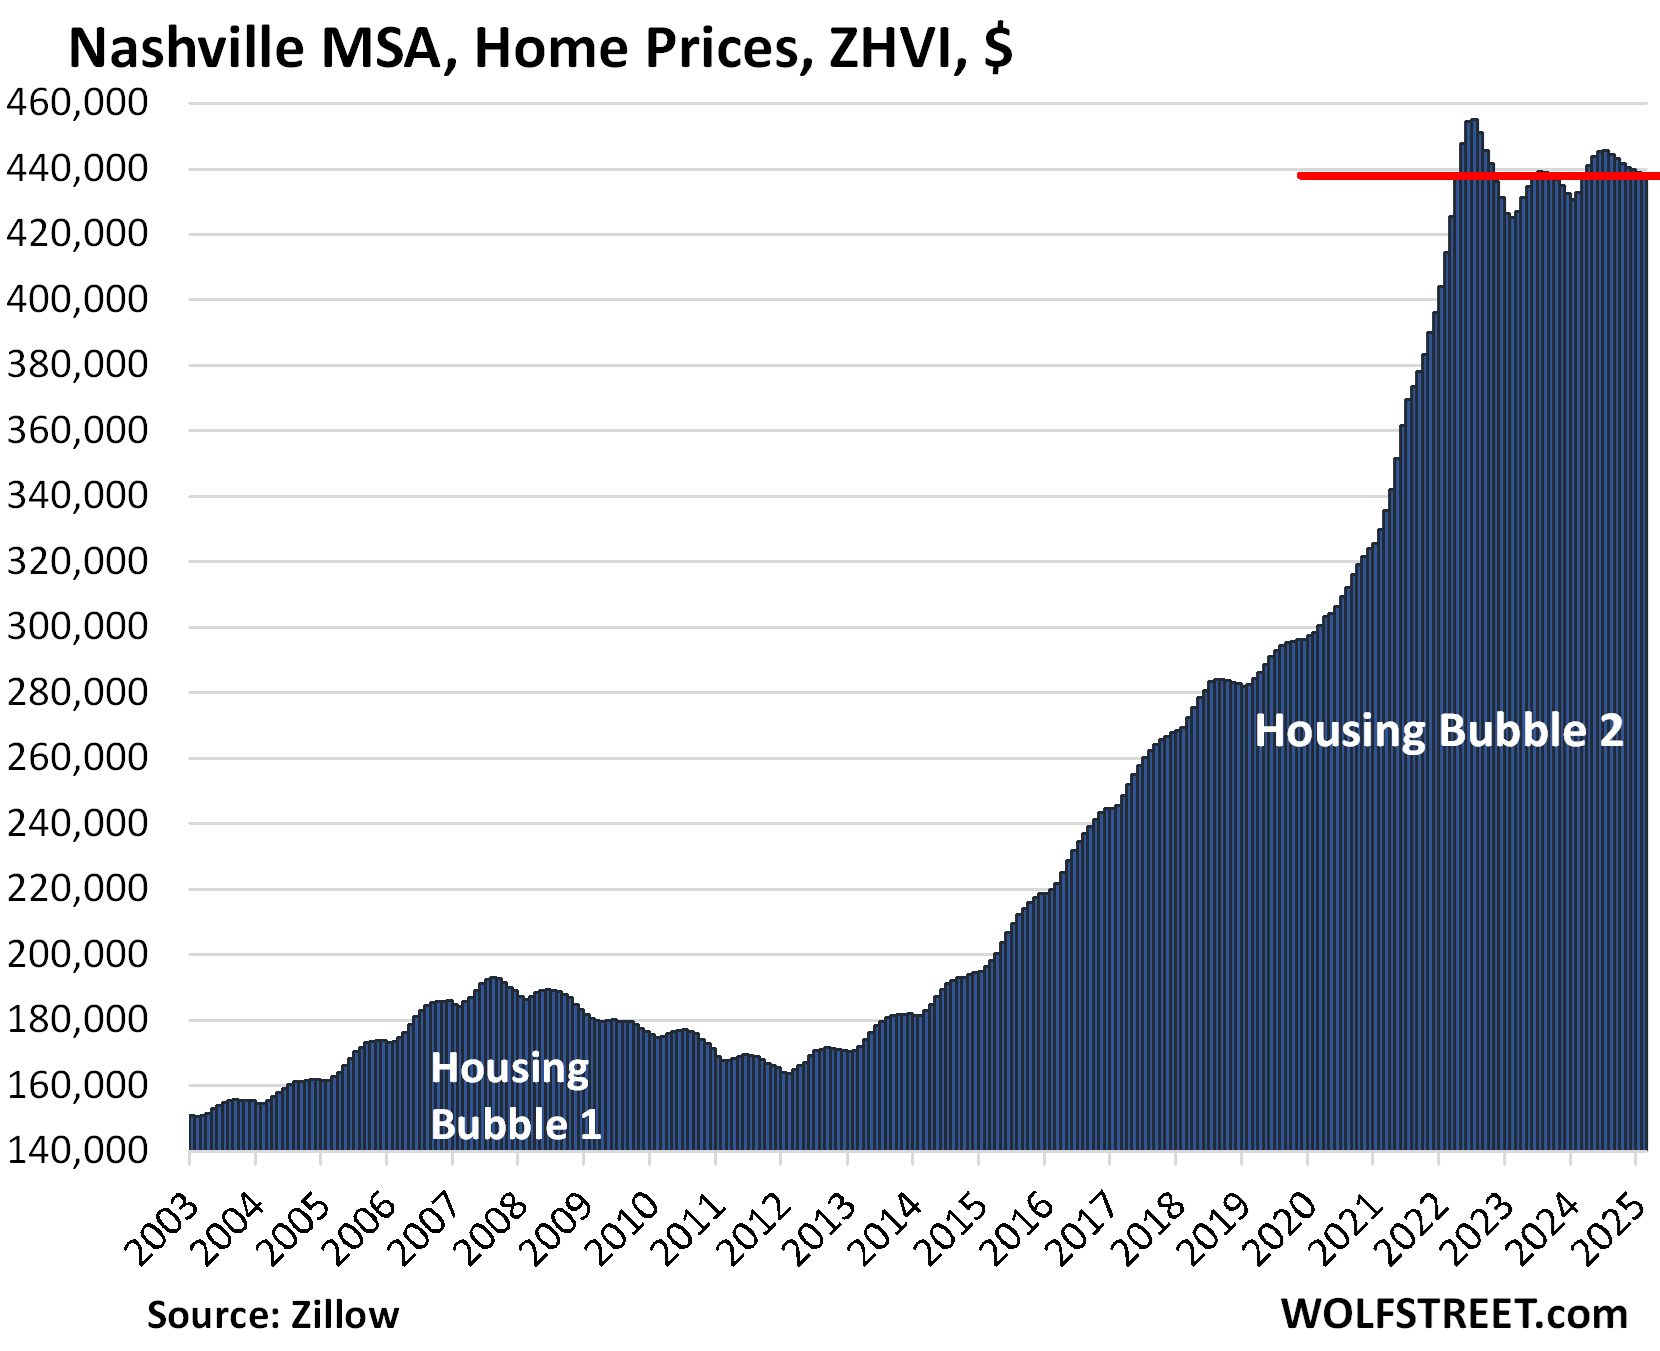
| Nashville MSA, Home Prices | |||
| From July 2022 peak | MoM | YoY | Since 2000 |
| -3.7% | -0.1% | 1.3% | 216% |
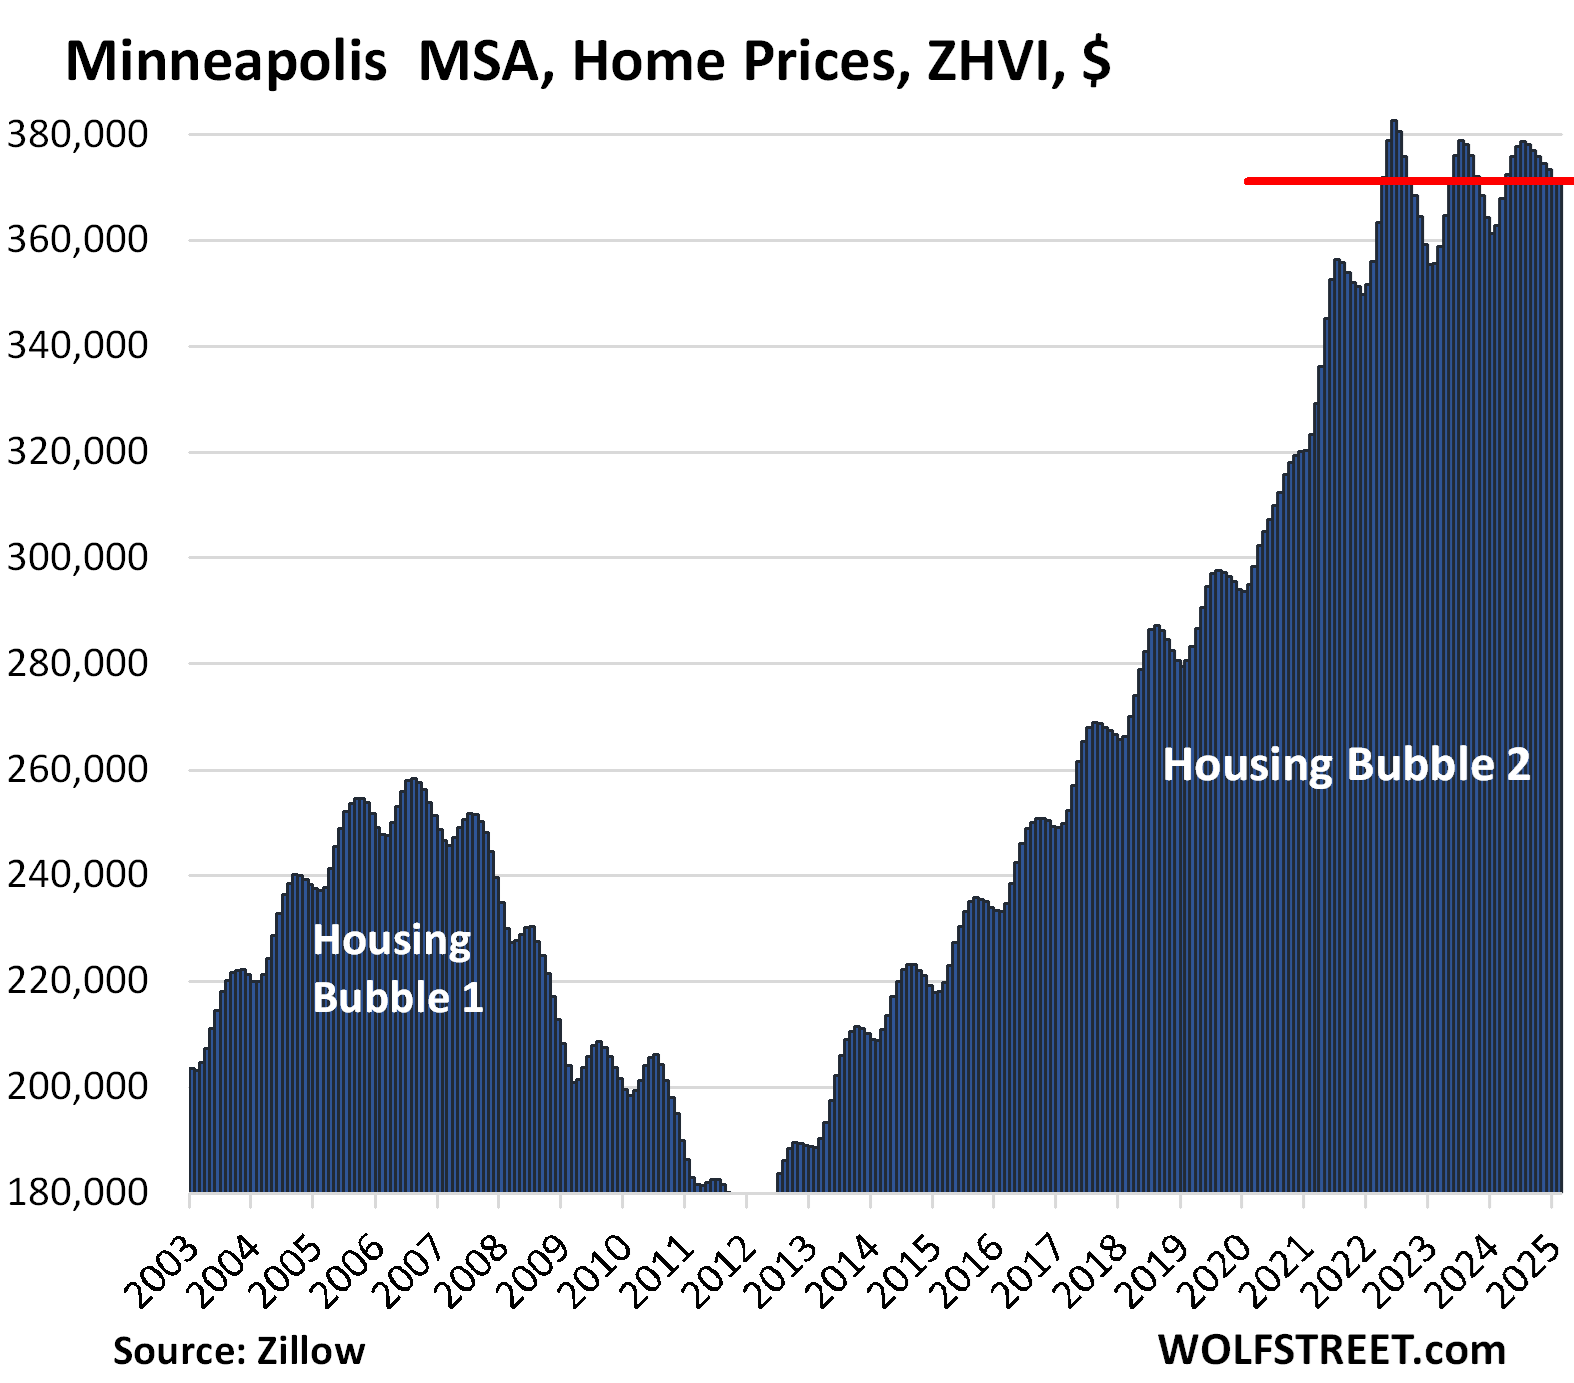
| Minneapolis MSA, Home Prices | |||
| From May 2022 peak | MoM | YoY | Since 2000 |
| -3.0% | -0.1% | 2.4% | 155% |
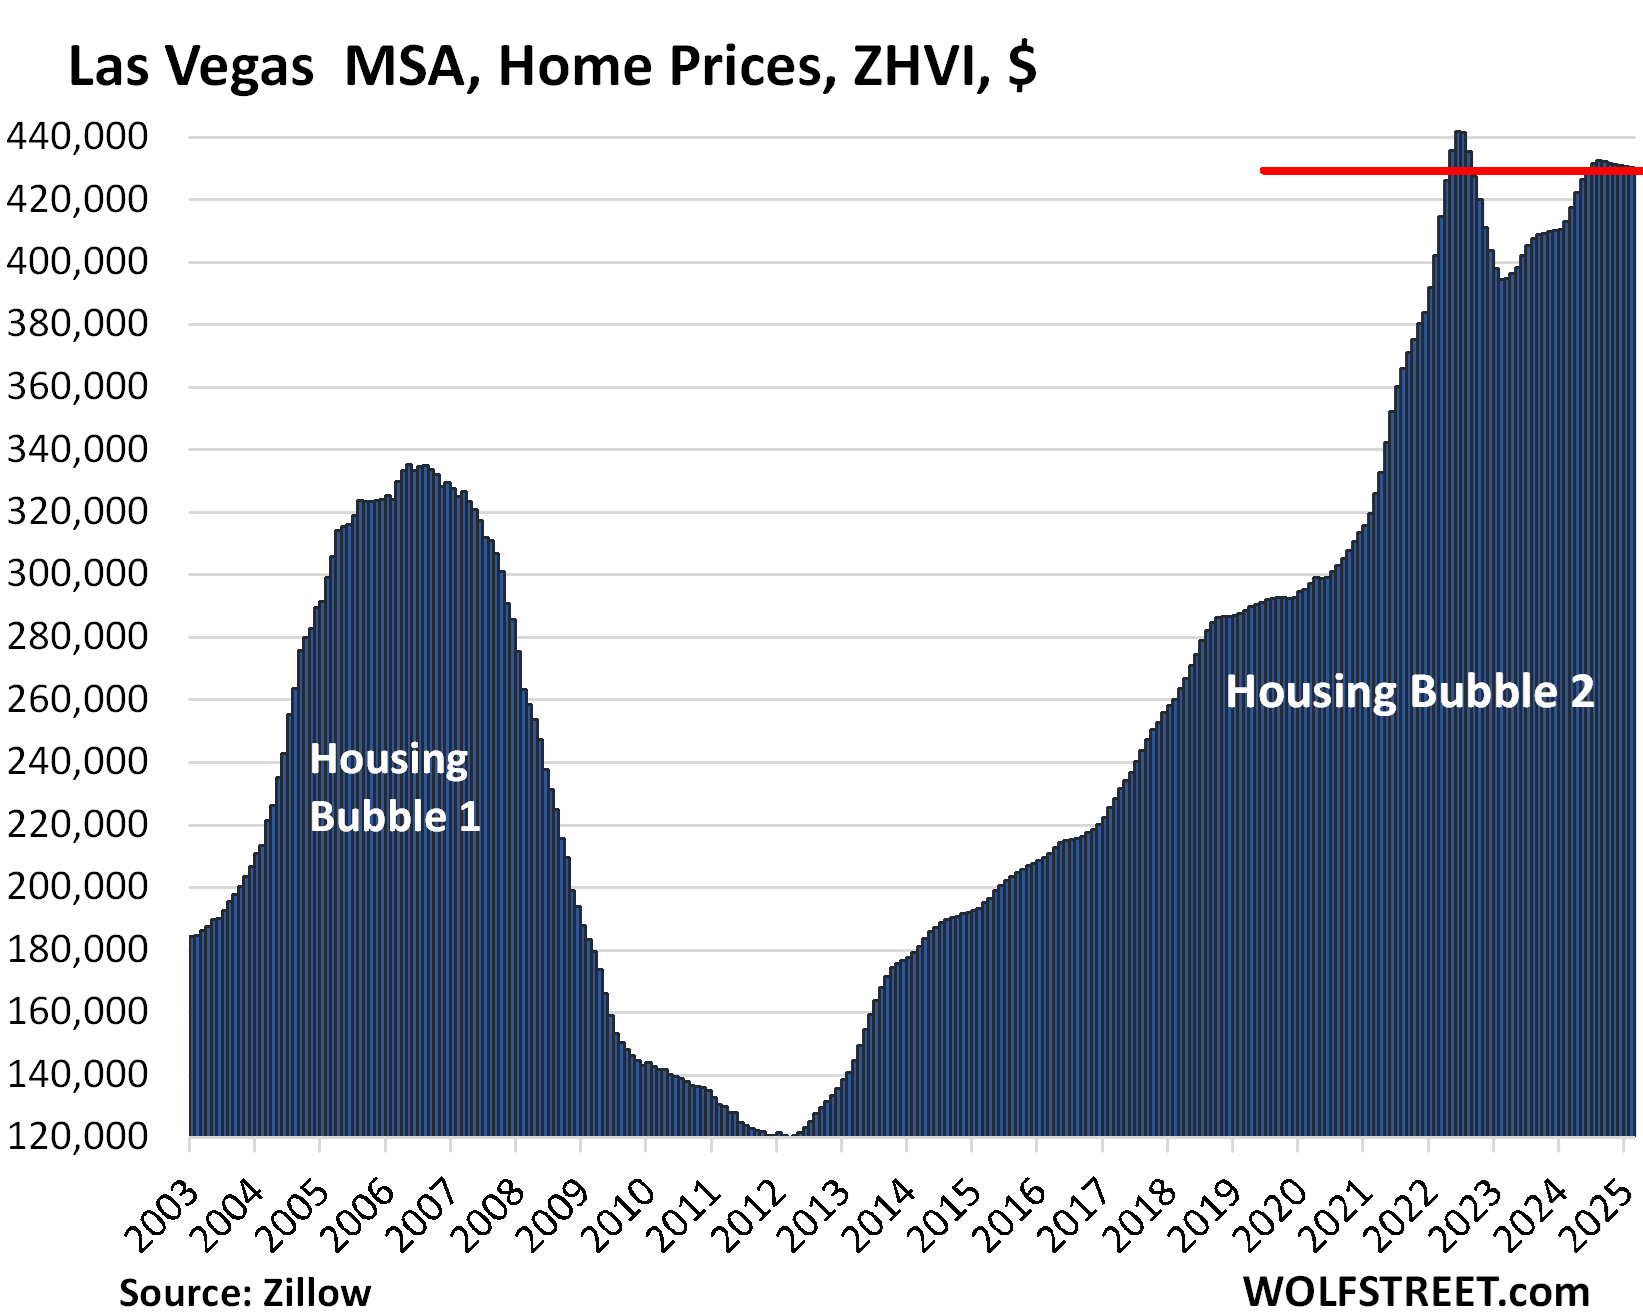
| Las Vegas MSA, Home Prices | |||
| From June 2022 peak | MoM | YoY | Since 2000 |
| -2.6% | -0.1% | 4.2% | 178% |
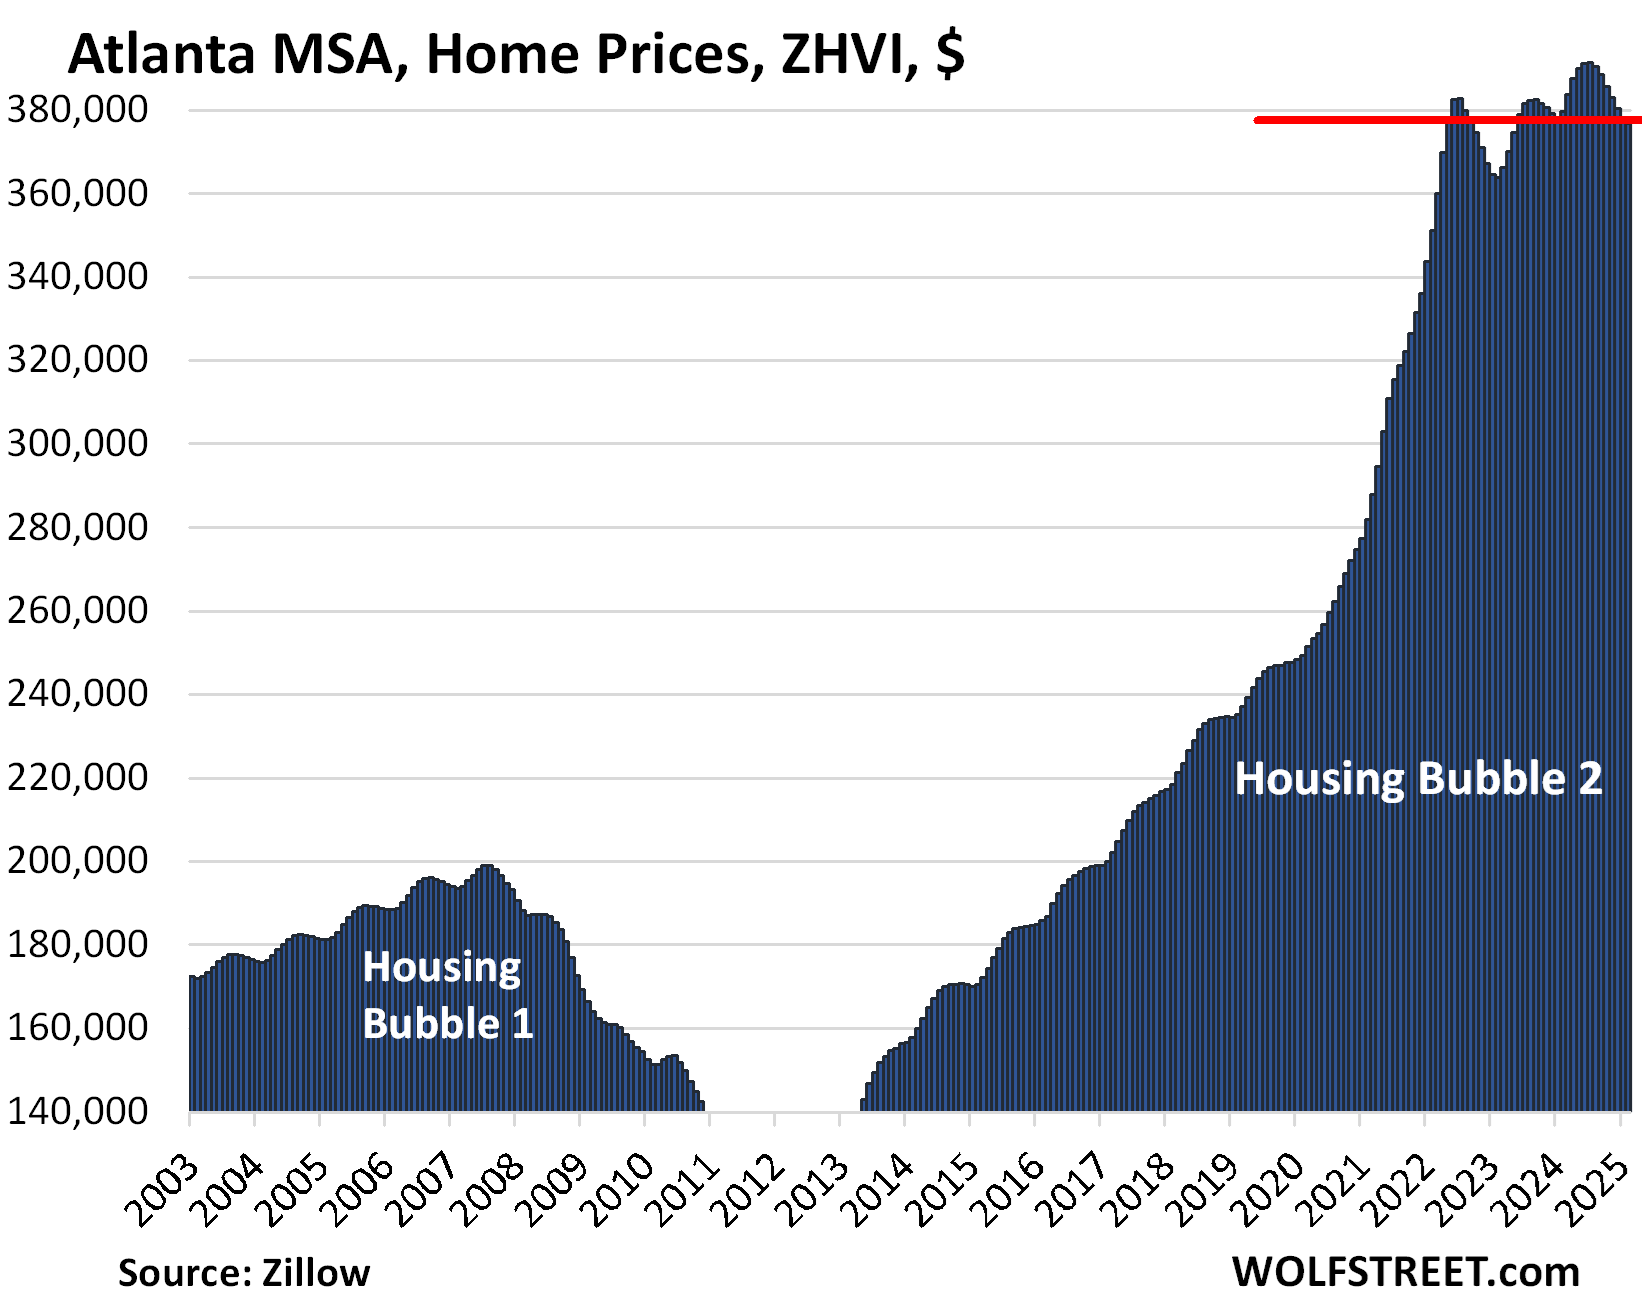
| Atlanta MSA, Home Prices | |||
| From July 2022 | MoM | YoY | Since 2000 |
| -1.6% | -0.3% | -0.7% | 158% |
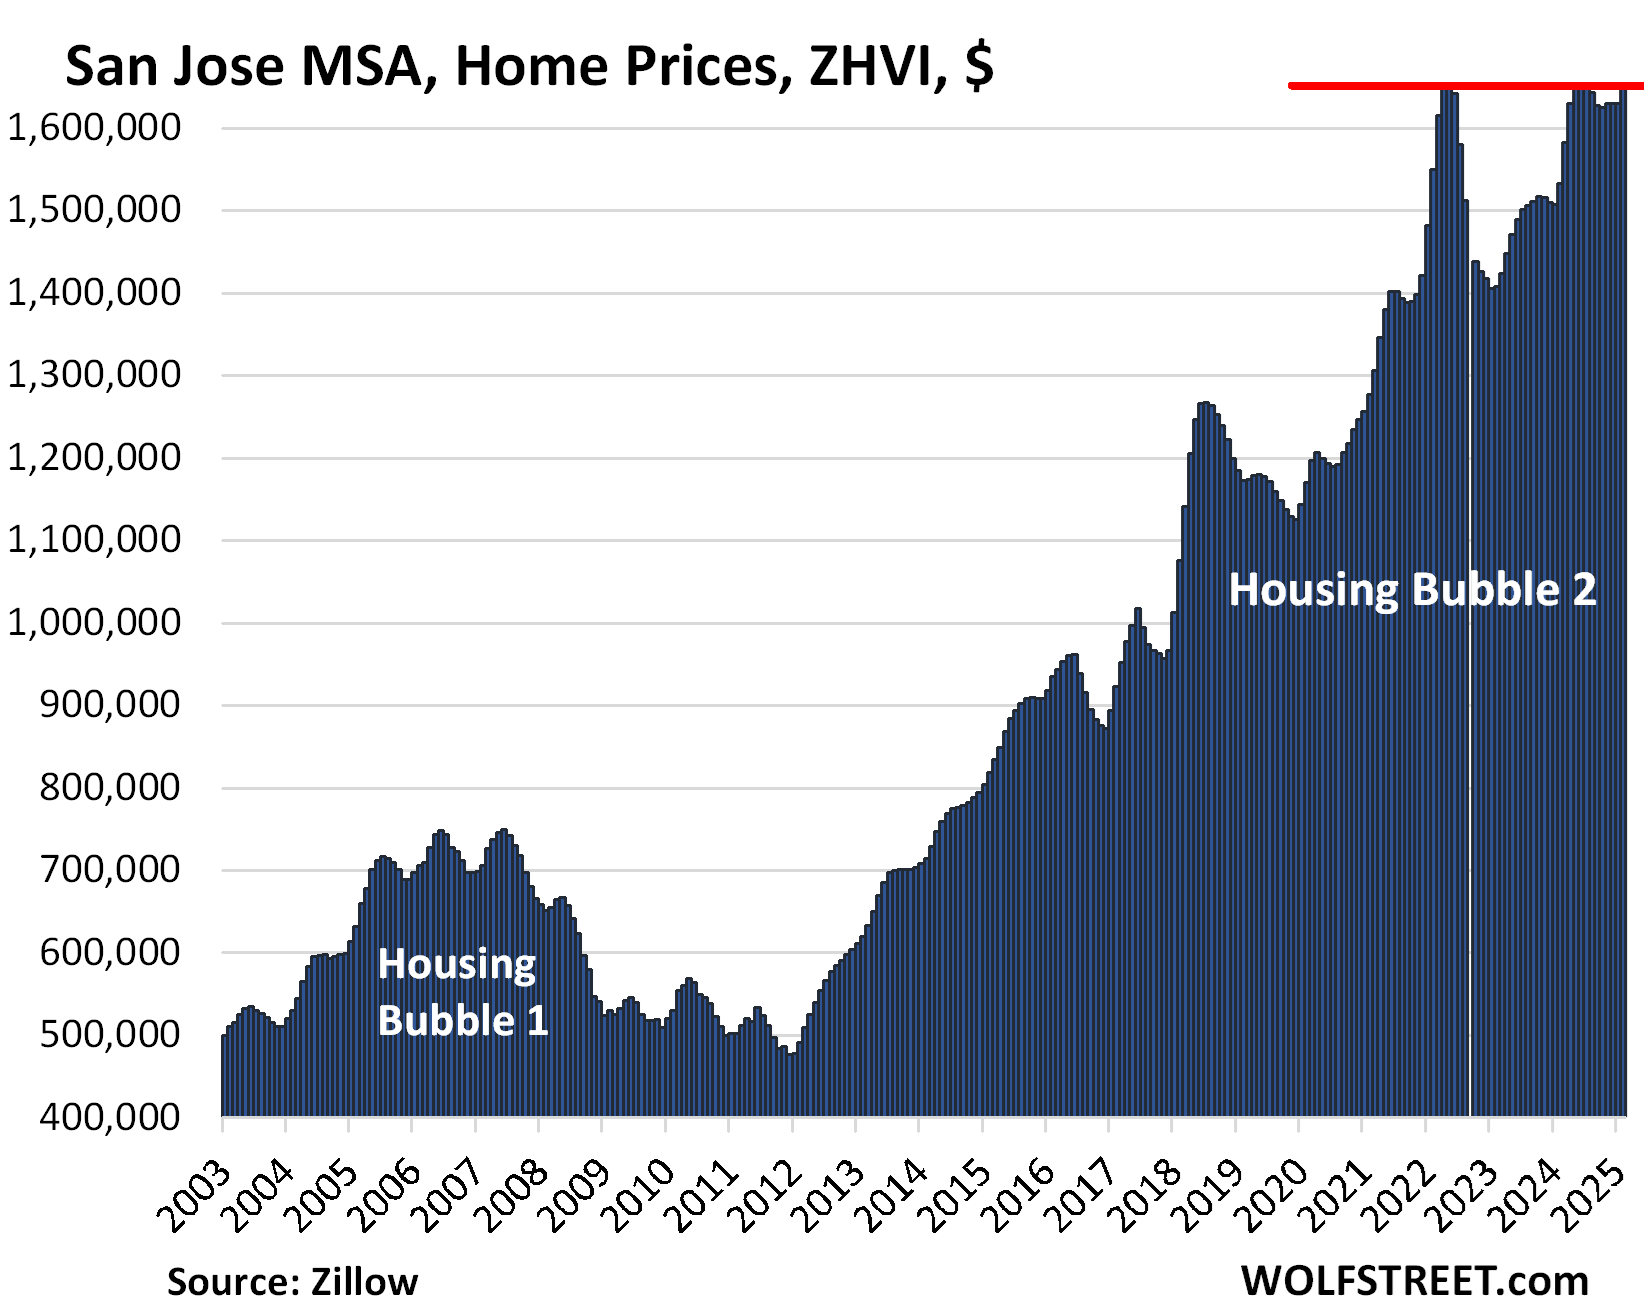
| San Jose MSA, Home Prices | |||
| From May 2022 peak | MoM | YoY | Since 2000 |
| -1.1% | 1.1% | 7.6% | 342% |
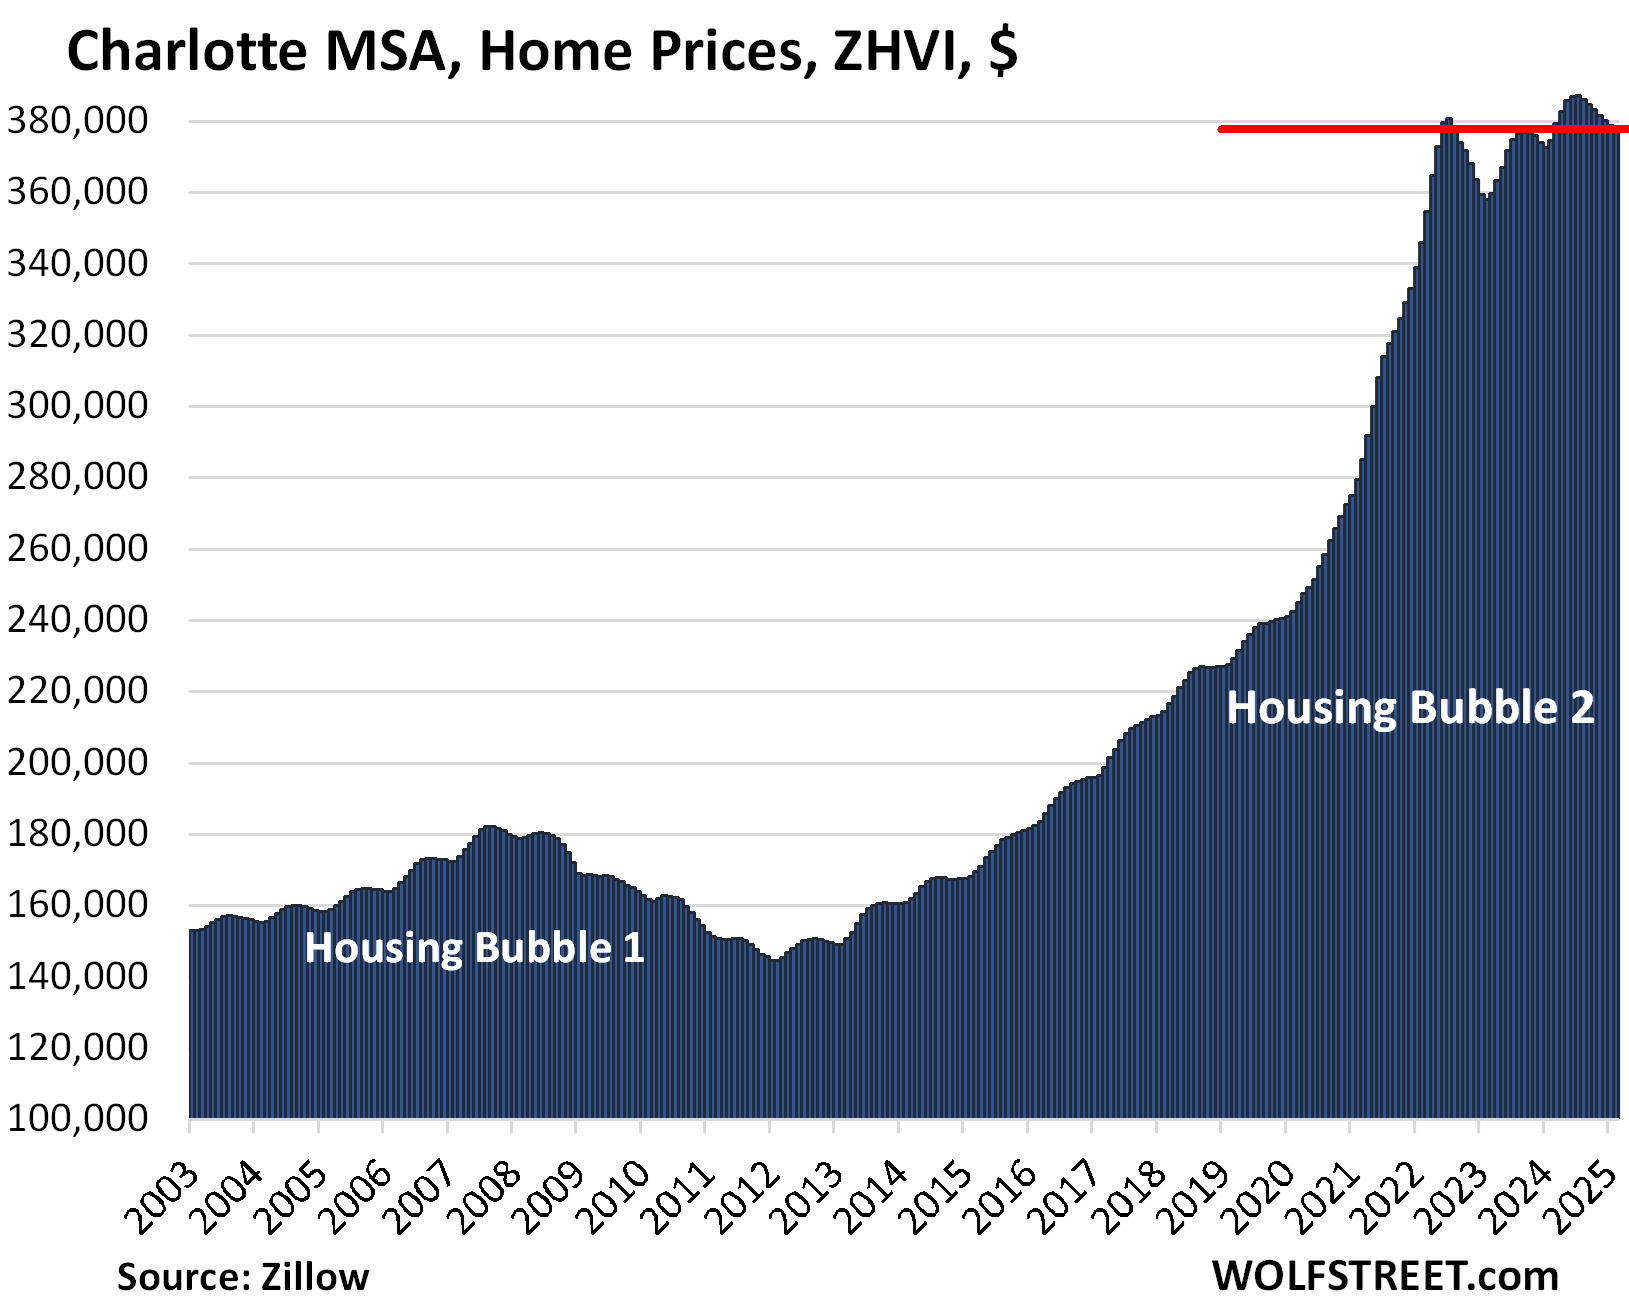
| Charlotte MSA, Home Prices | |||
| From June 2022 | MoM | YoY | Since 2000 |
| -0.7% | -0.2% | 0.9% | 168% |
| Orlando MSA, Home Prices | |||
| From June 2022 | MoM | YoY | Since 2000 |
| -0.92% | -0.4% | -1.4% | 231.4% |
The 12 markets that rose after mid-2022 (but some are now sagging):
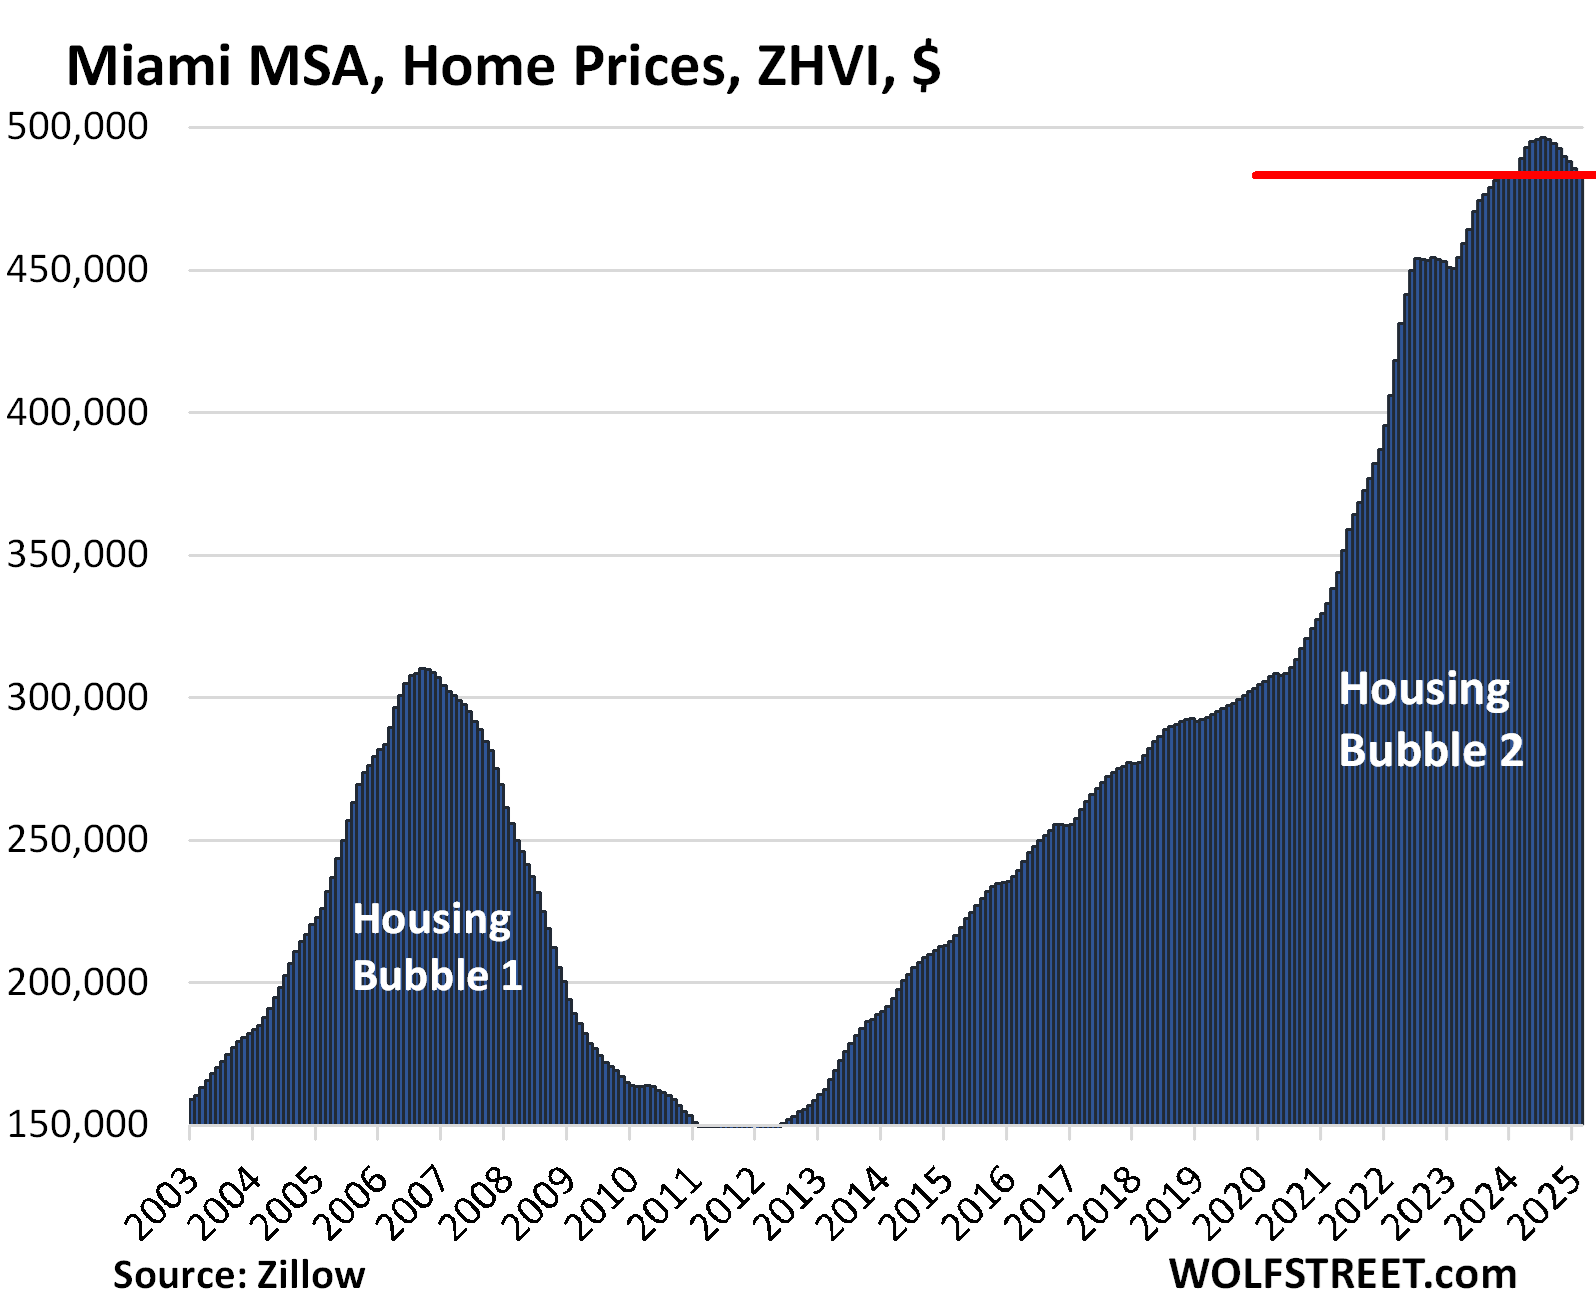
| Miami MSA, Home Prices | ||
| MoM | YoY | Since 2000 |
| -0.4% | -0.2% | 325.6% |
Miami prices have dropped enough to where they’re not down year-over-year.
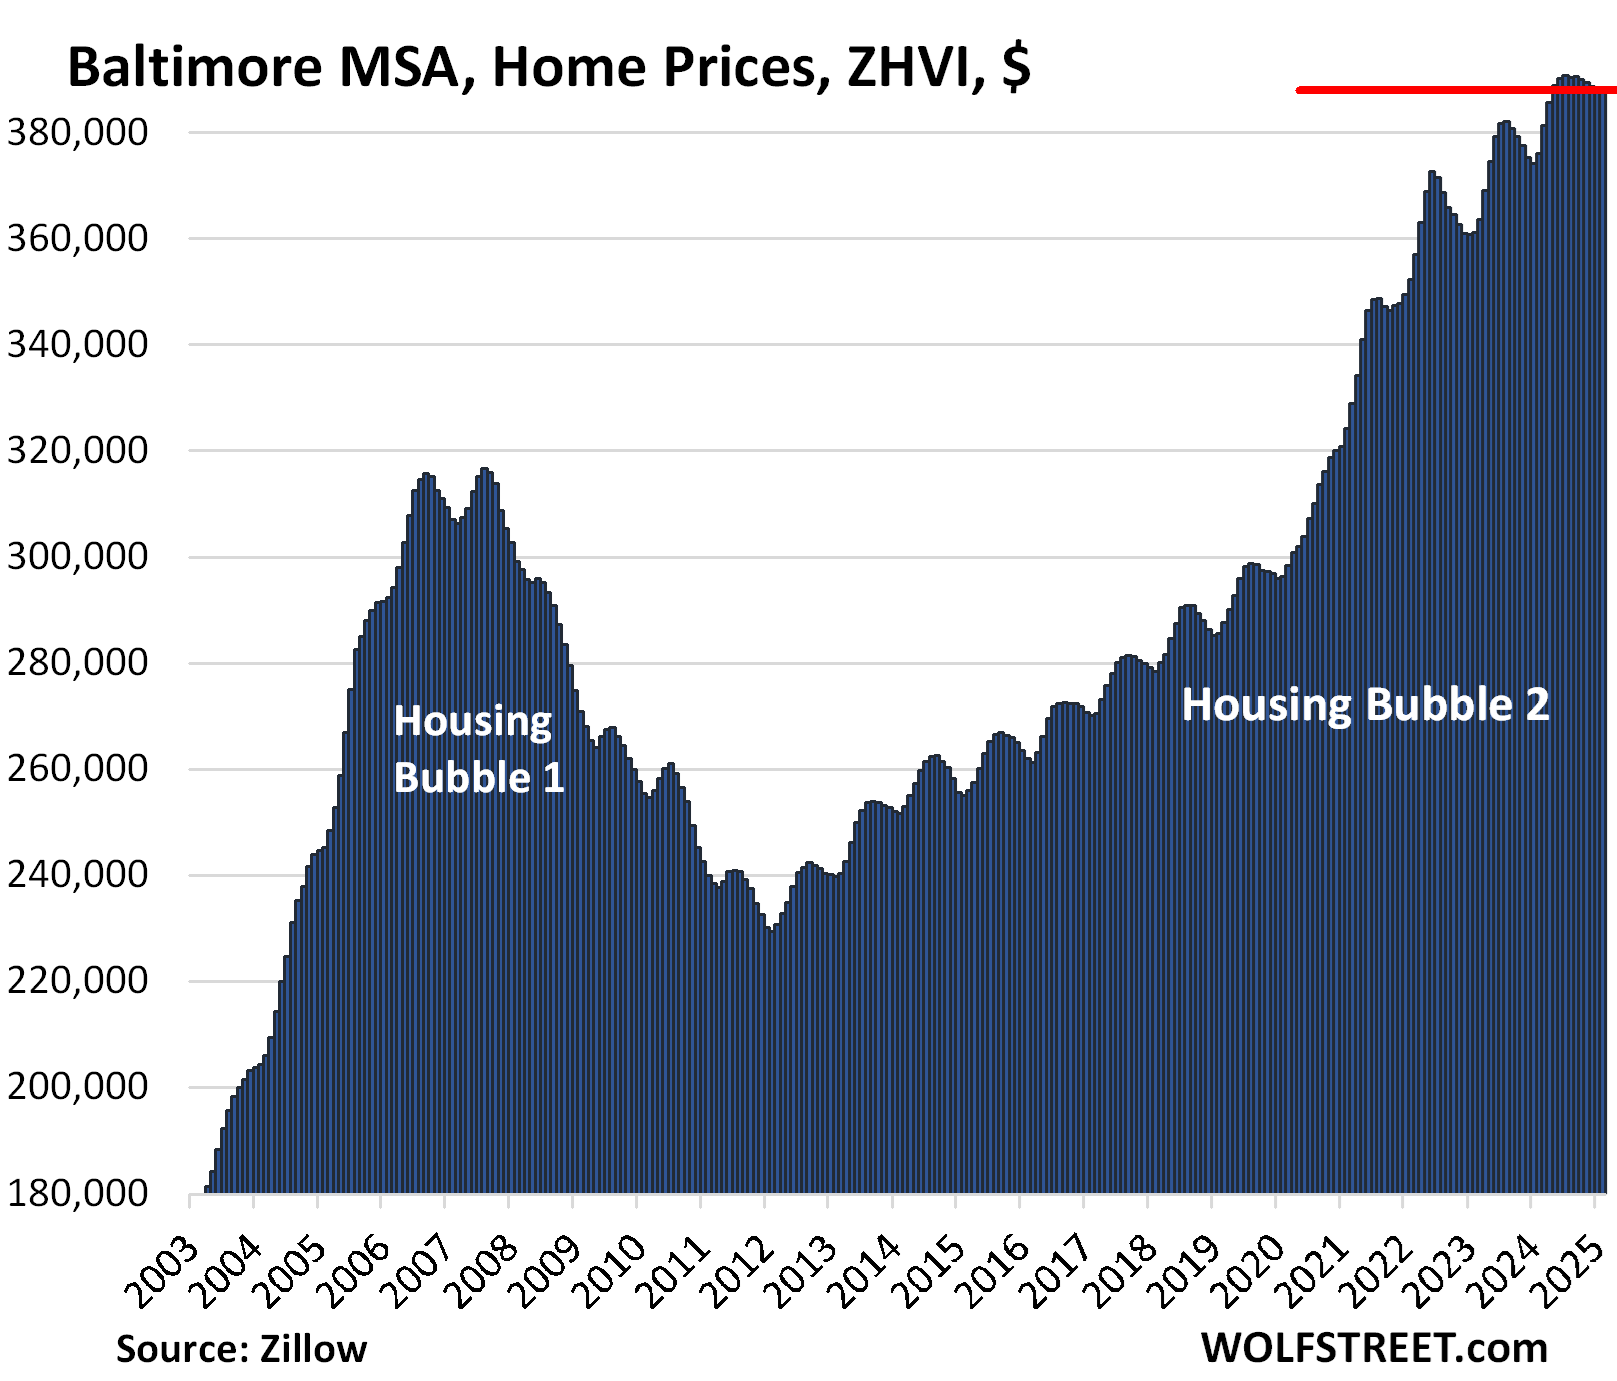
| Baltimore MSA, Home Prices | |||
| MoM | YoY | Since 2000 | |
| 0.0% | 3.1% | 173% | |
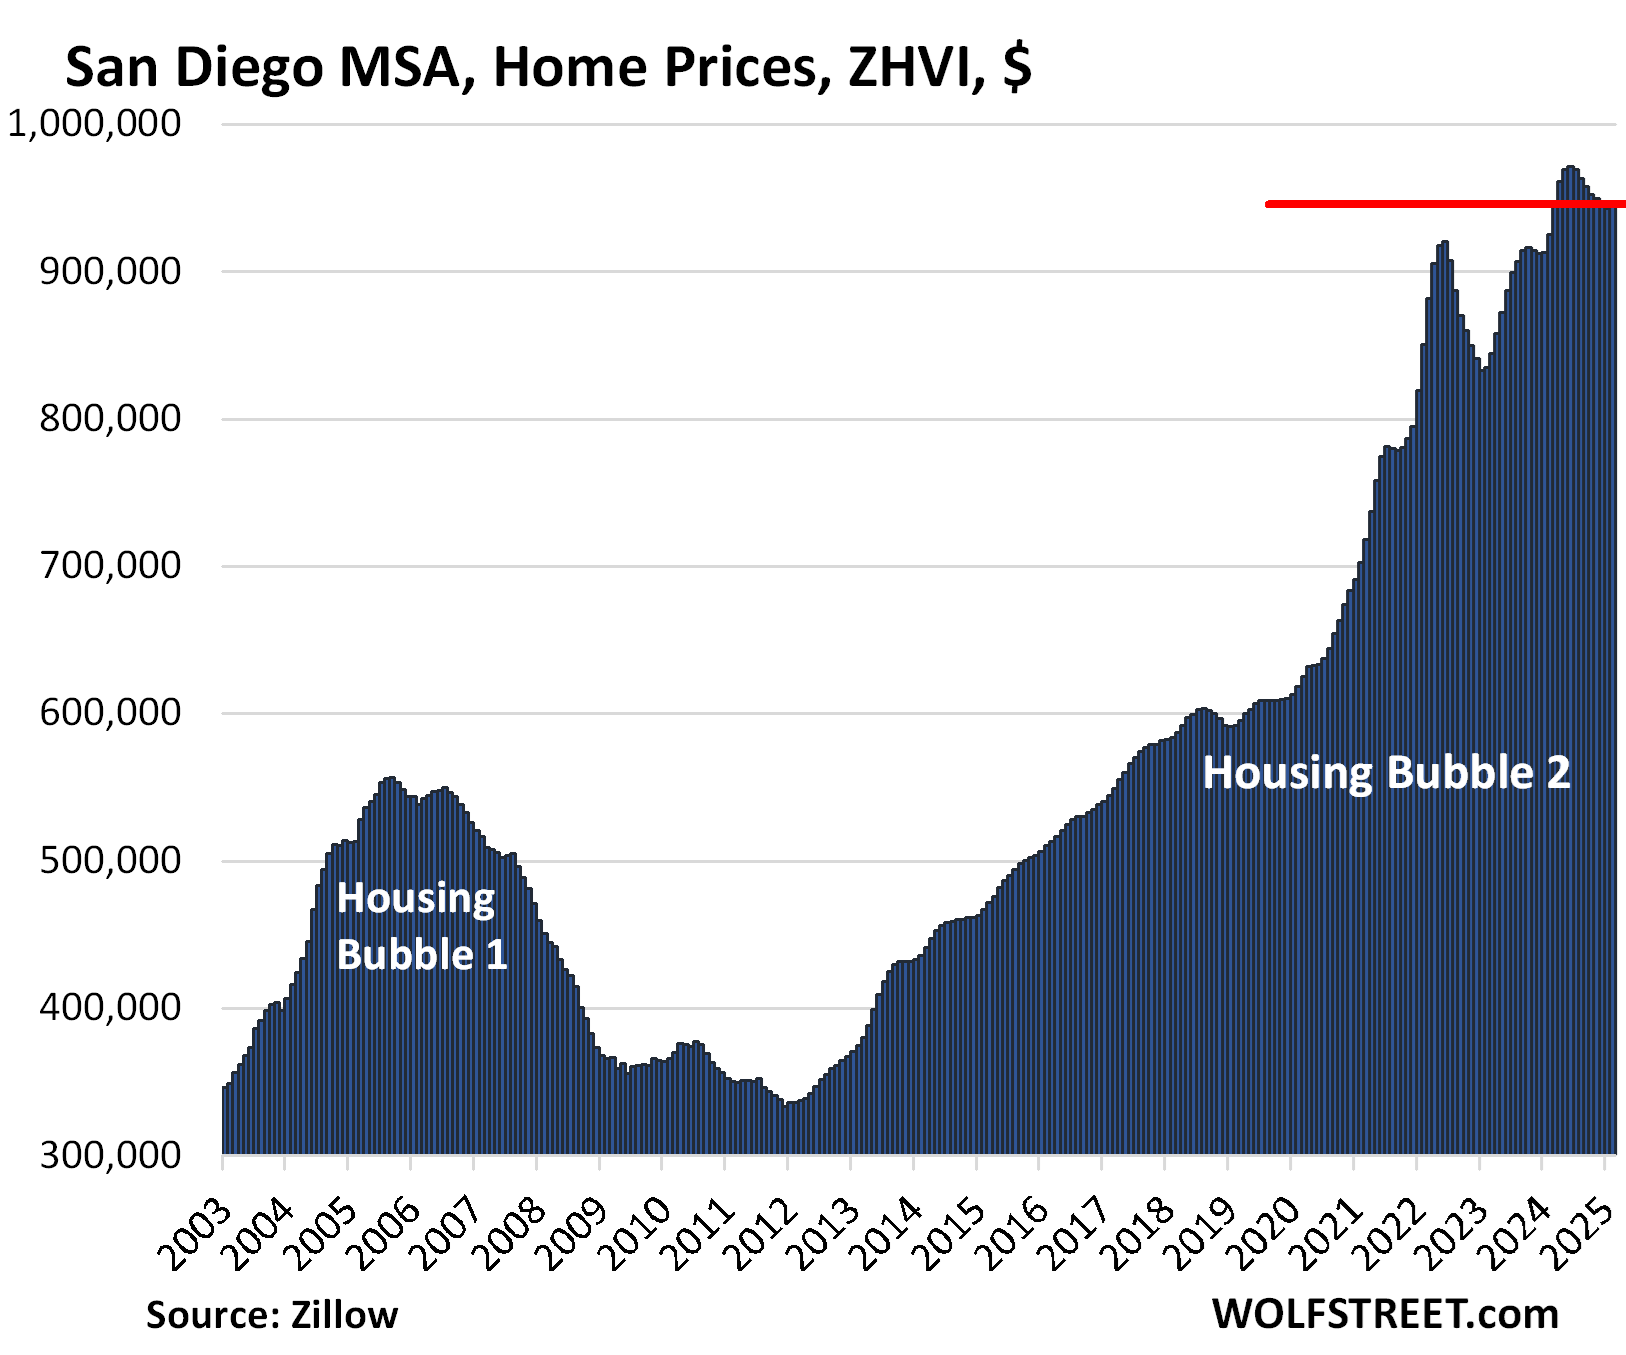
| San Diego MSA, Home Prices | ||
| MoM | YoY | Since 2000 |
| 0.3% | 2.3% | 332% |
| Kansas City MSA, Home Prices | ||
| MoM | YoY | Since 2000 |
| 0.1% | 3.1% | 175% |
| Columbus MSA, Home Prices | ||
| MoM | YoY | Since 2000 |
| 0.0% | 3.1% | 152% |
| Washington D.C. MSA, Home Prices | ||
| MoM | YoY | Since 2000 |
| 0.3% | 4.0% | 216% |
The vast and diverse metro includes Washington D.C. and parts of Maryland, Virginia, and West Virginia.
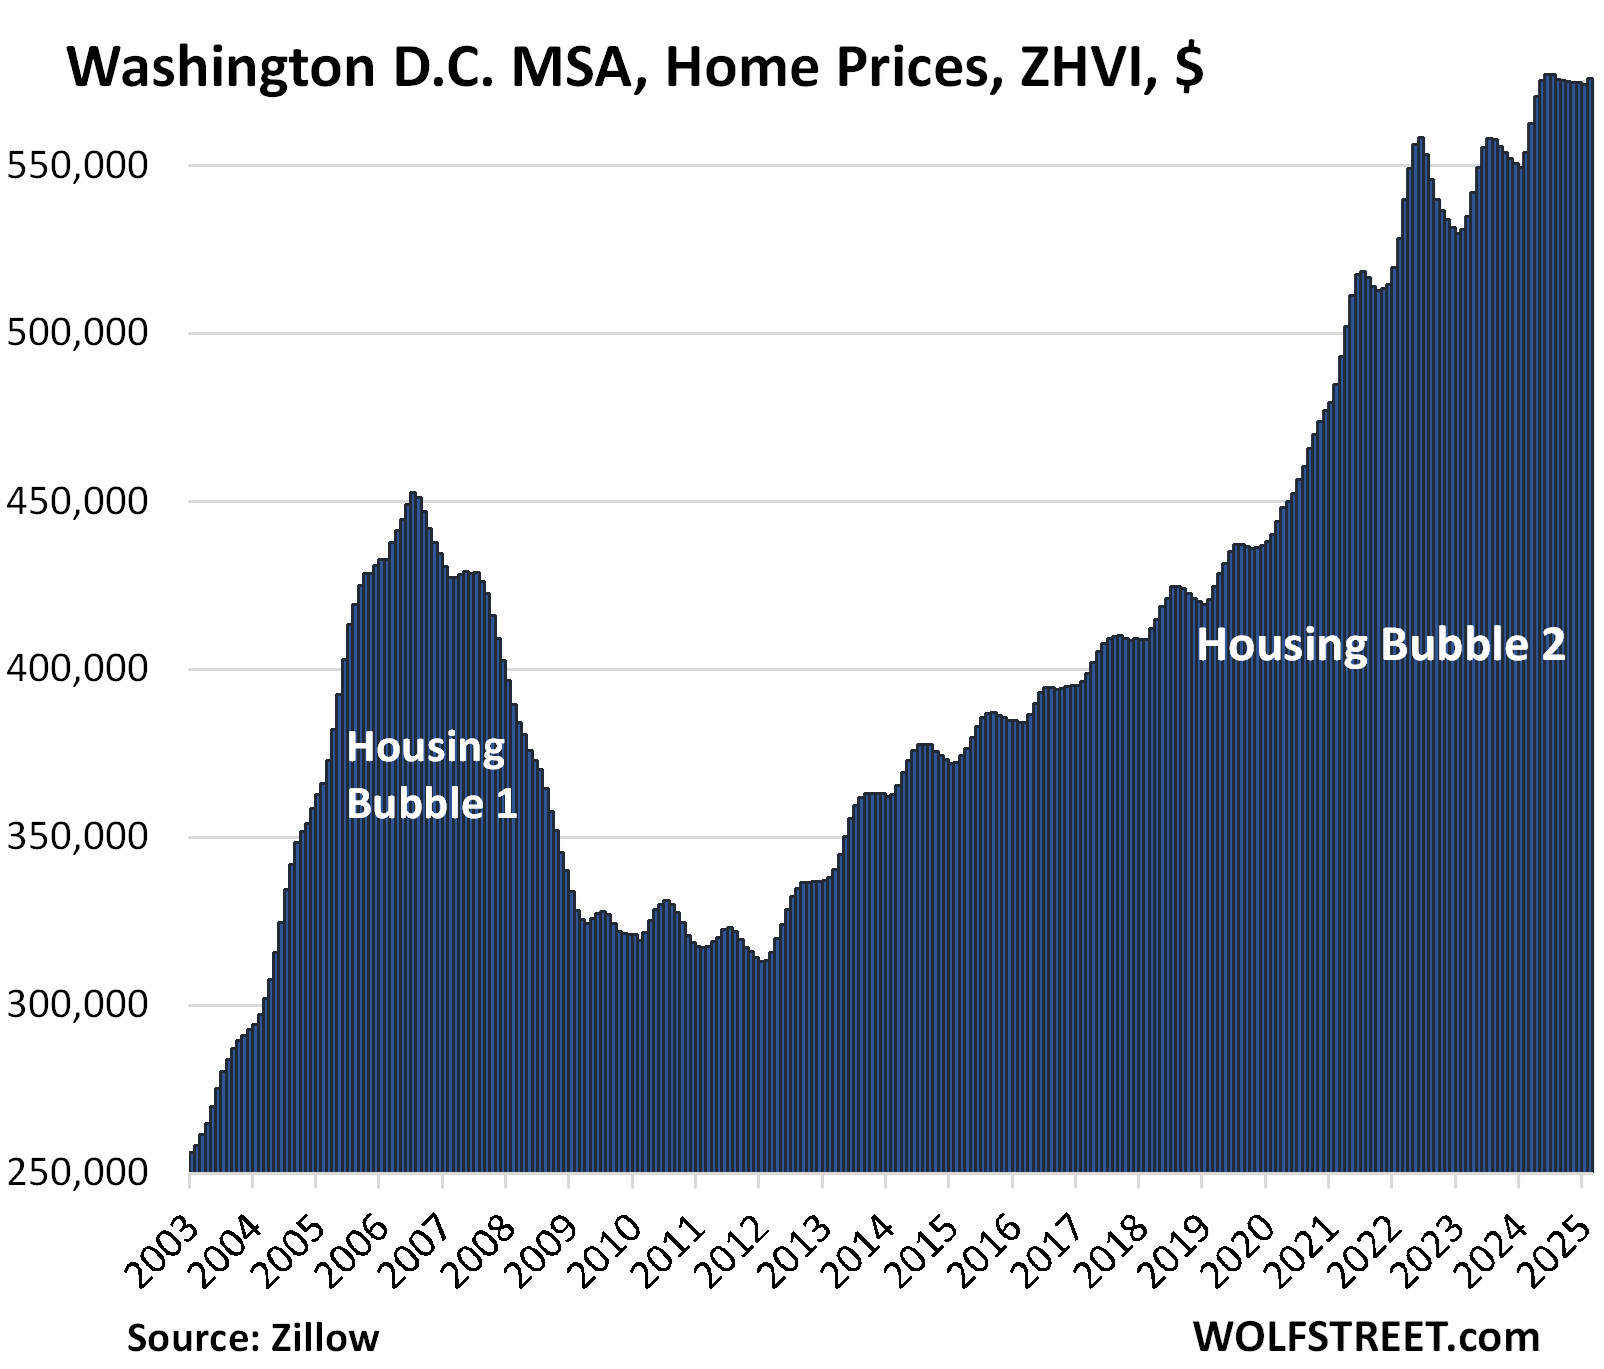
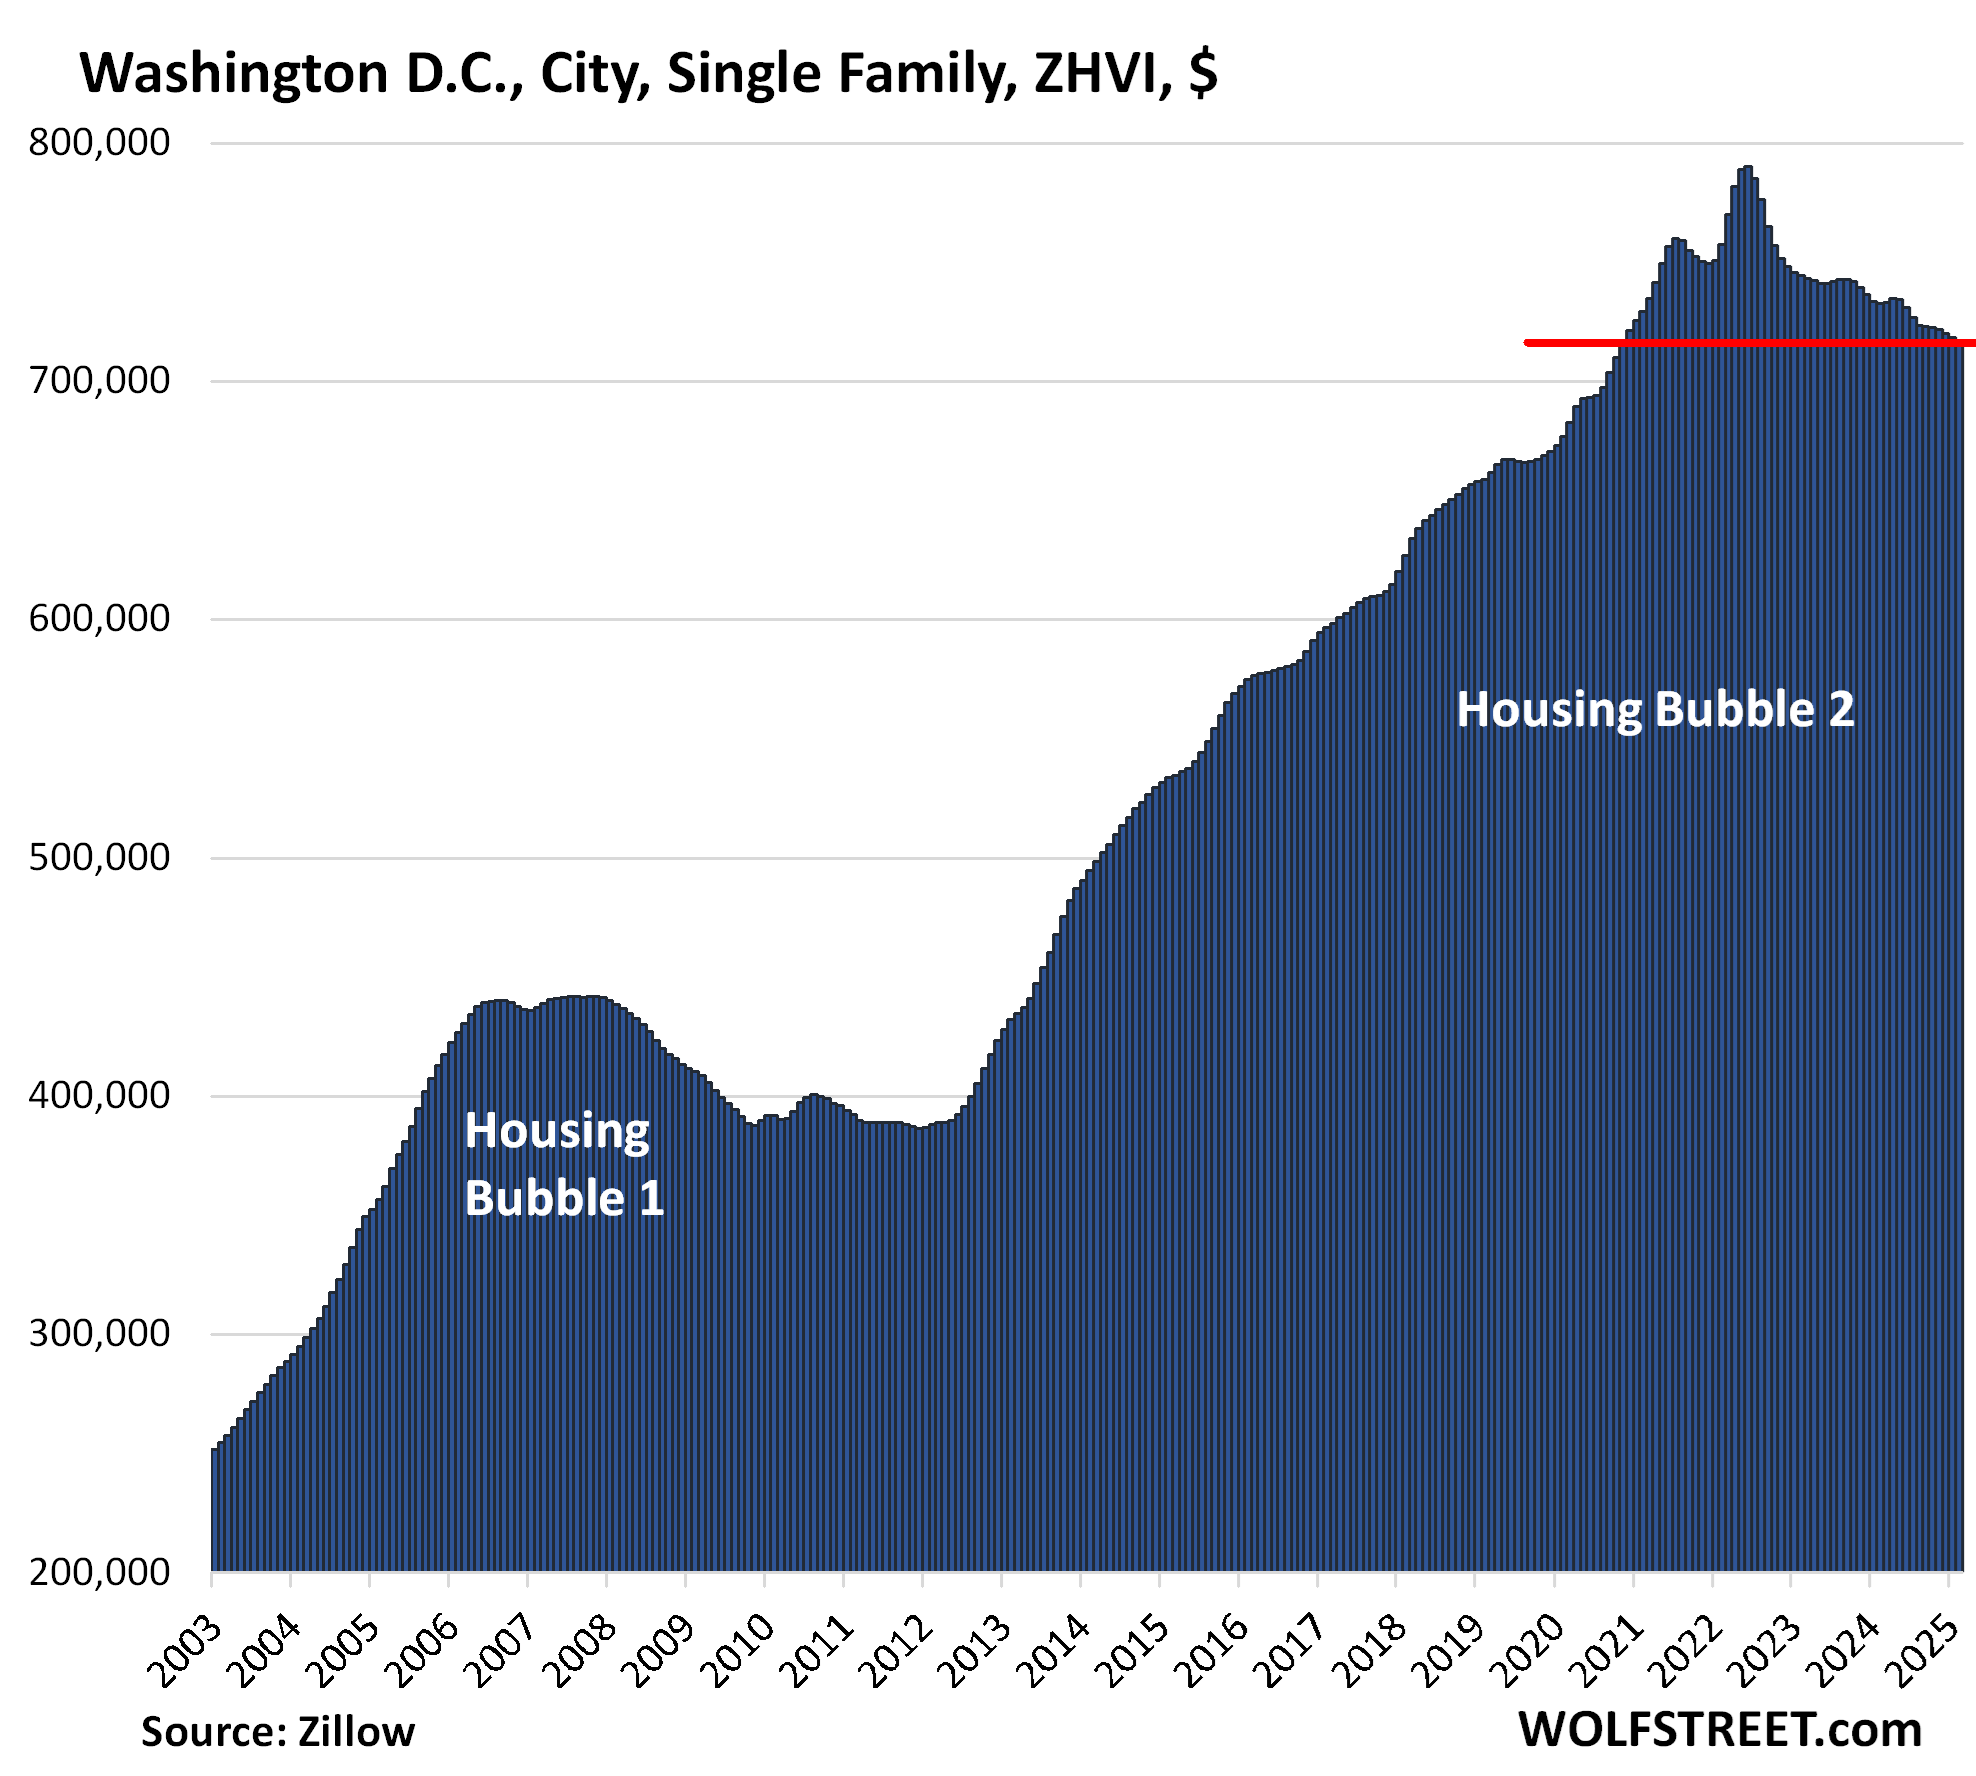
But in the city of Washington D.C., prices of single-family houses, seasonally adjusted, have dropped by 9.1% from the peak, and by 2.1% year-over-year, to the lowest level since November 2020.
The example of Washington D.C. and the D.C. MSA shows how the dynamics can differ when narrowing down to the city itself:
| Los Angeles MSA, Home Prices | ||
| MoM | YoY | Since 2000 |
| 0.4% | 3.9% | 329% |
| Philadelphia MSA, Home Prices | ||
| MoM | YoY | Since 2000 |
| 0.0% | 4.1% | 199% |
| Boston MSA, Home Prices | ||
| MoM | YoY | Since 2000 |
| 0.2% | 4.2% | 223% |
| Milwaukee MSA, Home Prices | ||
| MoM | YoY | Since 2000 |
| 0.0% | 4.7% | 141.3% |
| Chicago MSA, Home Prices | ||
| MoM | YoY | Since 2000 |
| 0.1% | 5.1% | 111% |
| New York MSA, Home Prices | ||
| MoM | YoY | Since 2000 |
| 0.1% | 5.6% | 210% |
Enjoy reading WOLF STREET and want to support it? You can donate. I appreciate it immensely. Click on the mug to find out how:

![]()
According to Deepseek (other LLMs are available), items in the US CPI index increased by roughly 66% from October 2003 to October 2023 and average wages increased by roughly 120% over the same time period.
House prices seem to be related to wages.
The little tables above each chart give you the price increase since 2000. You will see that among the highfliers, prices increased by 200% to 340% since 2000, far outgrowing wage gains.
AI poisons your brain.
Agree 100%. Never confuse knowledge (AE, actual education) with a response (i.e., AI, Artificial Ignorance).
This is the problem with AI. People look at the results with no critical thinking applied.
My neighbors in San Diego are teachers. I make more than double their combined HHI and can’t afford to buy a house in the neighborhood. So, no wage gains did not keep up.
Do you rub their face in it? As you should.
Make signs. Print flyers. Sir, do your duty!
…
Just kidding
IMHO, if wages increased 120% and house prices increased over 200% in many areas, it wasn’t wages holding house prices up.
However, if you (or your parents, grandparents, rich uncles), had money back in 2000 and were brave enough to invest and hold on to an S&P 500 index fund that went through 2 crashes and went up 600%, you have the means to buy a house. If you were really brave and bought BTC at $800, you could probably buy several houses.
It took money for investing beyond the 0.01% CDs and bank accounts. A wage isn’t going to get you a house today.
So, if/when the stock market drops 50% again like it did in 2002 and 2008, have cash ready to buy a house.
I do worry about having all of my eggs in one basket. When people are whining and afraid when their 401K’s lost 5 months of gains (10%), they have too many eggs in stocks. My timing is terrible since I missed out on the 10% run up but I am up with my TBills and money markets and I sleep at night.
If the market drops 50% this time, with our current debt overload, the economy will have a lot more to worry about than who gets to buy a house.
It depends on how many are relying on stock/crypto gains to pay their food bills, mortgage, and to keep the lights and heat on. This isn’t counted debt but if a crash occurs, the naked swimmers will be exposed quickly.
HELOCs and credit card debt to afford food and other necessities would be counted debt. Wolf isn’t showing a major problem yet.
These are dangerous and risky places to be based on history.
I could care less what the silicon valley dirge is currently vomiting.
AI model results are always in agreement with the present because that is the way they are programmed. All AI models are being programmed by someone who you would not like to get you to agree to surrender tour autonomy.
25% drop sounds like a lot till u look at the bubble. Anybody late to the party is hating it tho. Without the foreclosures does anybody think it’ll drop significantly from here?
Yes. There are plenty of reasons someone would sell a house for a lower price than the year before other than foreclosure. Don’t forget that 40% of homes have no mortgage at all which makes a short sale impossible.
Home prices are set by incomes and mortgage rates plus the investor/speculator component. Just reducing the amount of investor activity will reduce prices significantly.
Just plug the median HH income and the current mortgage rate into one of the many free calculators online to get an idea of what the median family can afford. Then compare that to rents and the projected payments on the for sale inventory in your area to get an idea of where things are headed.
They will be giving houses away. If you can show you’re able to pay insurance, property tax, HOA, utilities, maintenance.
Austin price curve seems to be an outlier. Home prices are sticky for sure .
My Mother In Law home in OKC (Edmond) hit the MLS Saturday 3200 sq ft 3 BR 1 acre no HOA for 1.50 a sw ft . Slightly higher than the Zillow estimate . We had 4 showing within 12 hrs .
50 year old home liveable but not what young couples buy usually .
Will see the good news is people are looking so at the right price the home will sell .
The right price is at least 40 percent down. Looking at the charts, only Austin is on track to achieve that.
The right price for any house is exactly what that buyer and that seller agree upon at that moment. No more and no less.
I think this will be a long slow slog both in housing and stocks. Slow, grinding, flat and sometimes up or down for months and years and never the “I was right” plunge so many bears expect. The bottom will come when nobody cares anymore.
Any price in a bubble is not price discovery.
It’s a hostage situation with nothing but lunatics involved.
An honorable man would not allow these huge bubbles to develope.
Perhaps it’s because I’m getting old, but I have nothing but contempt for wall street, crypto, & AI.
I respect tulip bulbs more than the whole lot of them.
I don’t belong here in the peanut gallery. I’m just waiting for Wolf to ban me.
I’m on borrowed time.
According to Scott Galloway (podcasting at SxSW recently), Austin’s price declines resulted from government relaxation of zoning and building restrictions (height limits, parking requirements, and the like).
I suspect it was cool for a minute, and then everyone left when they realized how bad Texas sucks. Lots of folk on my local subreddit moving in from Texas because it’s too…red.
People are still moving to TX in unbelievable numbers. Austin was a bubble during the pandemic. Whatever subreddit you are reading it doesn’t represent the actual trend, which is hundreds of thousands of people moving to TX every year. Mostly not about politics, it’s about jobs, TX is a massive job creation place and home prices outside of Austin are relatively affordable for the large cities.
Yeah, the Oklahoma City metro didn’t make the list because home prices are still too cheap, though they had a huge run-up in recent years. Same with Tulsa, my former hunting grounds. There are other metros like that. Those cities are the outliers.
I would like to see that housing chart average stacked up against the S&P over the same time frame. 2003-today. The correlation would be eerie.
How does that happen wolf?
There is a correlation in direction, but not in magnitude. The S&P 500 increased by 600% since 2003. The highflyers here increased by 200%-340%. The ZHVI for the US overall increased by 140%
Or, you could have bought gold, which in March, 2003, was around $335./oz., making it about a 900% increase up to the present.
Friends in Florida report:
1. Naples waterfront home in excellent condition appraised at $5.2 million three years ago is now listed for $4.2 million, very few lookers and no offers.
2. Condos for sale in older buildings all along the coasts see large price drops as assessment fears grow due to mandatory inspections and fierce increases in the cost of insurance.
3. Commercial real estate in Palm Beach, Boca remains strong.
4. Orlando single family home supply rising quickly and prices softening modestly.
Just read an article in the WSJ about the Fannie Mae blacklist for condo buildings due to risks (hurricanes, fires, etc.), inadequate insurance coverage, systematic maintenance issues, etc. On top of the list in terms of the numbers of condo HOAs are Florida and California. Owners of a condo in a blacklisted HOA have a very hard time selling it because buyers cannot get a Fannie Mae backed mortgage, and other lenders shy away from it too. Sales have entailed big price cuts to cash buyers. Or people are just “stuck” with them, as one owner said.
This ”issue” has been swept under the rug for many years Wolf!
Estimating condo repairs starting in 2004, I quickly learned the market that year in FL alone was worth about $4BB, from the suppliers.
Since then, it has at least tripled, but even that might be low.
Most, if not all, can be attributed to the usual FL tendency for ALL RE: Be able and willing to Present THE most favorable possibility to the suckers, how ever unlikely in reality.
To be clear, dad and grand dad were in the biz, in FL, starting in the late 1930s, and made many modest returns due to the ethics great grand dad inculcated in both…
What? That feels like fundamentals and facts working agains the housing market..that cannot be…think in this crazy time, fundamentals and real risk went away like Dinosaurs and anything remotely like 08 was only once in a universe lifetime event like the big bang..
To think a dramatic market correction can actually be a thing because of mother nature….guess most RE genius miss that one in the price only go up narrative…oh I know..it’s cause we have housing shortage…there you go..
Here is what is happening in Hawaii with regards to condo insurance and premiums.
Later in the article is a discussion about Fannie Mae as well.
https://www.hawaiibusiness.com/increasing-hurricane-insurance-rates-hawaii-condos-buildings-underinsured/
So Florida and California are not the only ones going to have problems.
And as far as house prices are concerned Honolulu is the different from other real estate markets in the USA.
Just comparing mainland prices (such as in Boston to Honolulu) doesn’t tell you much.
You aren’t going to get much for $1 million in Honolulu. Lots of real dumps sell for that price. And comparing the weather, well..
My Sister-In-Law’s brother sold their 2,200 sq ft home in Tampa for ~$450 K (originally listed for near $600 K) after a year on the market and several price drops. They bought in Ocala from a builder for near $600 K (roughly the same size house). His wife is a house nut. Tampa was not fun for them due to getting hit from the hurricanes. People do strange stuff.
AA:
Only replying to you as one of my fave commenters on WR’s wonderful site:
Any where and every where in FL, no matter if totally inland or right on the coast has an approximately 2% chance of being hit by a hurricane EACH YEAR.
This percentage is NOT cumulative, or at least it was not 30 years or so ago when I was a city employee building inspector taking very informative seminars.
Doubt it has changed since then.
To be clear, Gainesville got hit very hard somewhat recently, and ya really can’t get much farther inland.
Anthony A.
You Sister and La’s brother may be making a correct decision.. This is not strange stuff.
Due to the climate change over the last 20 years you have to figure these severe weather issues when making a home purchase. I would not buy a home anywhere on the Florida coast nor on the La, Al, Texas or Miss coast. Even if you don’t get hit by a major hurricane, insurance rates are going to skyrocket. According to a top MIT Meteorologist, Jules Charney, whom I have great respect for, there is an 8 to 10 year lag with the temperatures of the ocean water from that of the average atmospheric conditions. We now have water temperatures 3 deg above normal as a result of the above normal atmospheric temperatures over the last 10 years. That will be fuel for more sever hurricanes in the region especially in the Tampa area. Insurance companies are aware of this and will adjust rates accordingly. Maryland, where I live, is looking better every day. No hurricanes, no tornadoes, no floods.
SC, of course it’s a bad decision but the female in that marriage wanted to stay in Florida. It will be “House Beautiful “ in Ocala again! Her husband just goes along for the ride. LOL
Yes, but you have all that hot air from all the politicians blowing up from the DC area which is worse.
Your state and local politicians are slowly grinding the state into a dump and with all the cuts in Federal employment and spending cuts Maryland is going to be a world of hurt.
Add in ridiculously high crime rates in Baltimore and it is a perfect mess.
Maryland rules.
Regarding climate change, there is zero science showing a link between global temperatures and increasing storms or storm severity, and there is no trend toward this in the US in the last 40 years.
The reason insurance is going up is shown clearly in these charts, home prices in FL are 5 times what they were 40 years ago, and coastline development has probably increased 10 fold.
People sure do, look at how many genius out there on TikTok with their negative equity on their G-ride while paying $2.5K for a car note so they can look fly..
If it’s that bad with cars, you can imagine the pinnacle of American dream, homeownership, you gotta go big or go home with your purchase.
They squandered their chance at the American Dream for said G-ride.
My Brother-in-law and sister built a house in Tampa, decided they didn’t like it, and unloaded for $1.6M+.
I think they blew all the money on booze, thinking QE would never end. Not sure about their financial standing now, but they don’t have a grand house anymore, at least.
I believe that US demographics (especially Boomer) from now until the end of the decade and combined with what has to be a stagflationary economy for the foreseeable future, will cause housing prices to continue to fall. A retracement of 30% is not out of the question.
And I think this will happen in spite of the super high cost of new construction due to the inflation from COVID. In fact, because of the predicted declining prices of existing houses, new construction is going to suffer greatly.
These predictions assume the Federal government doesn’t step in with subsidies or other means of support. And of course, all real estate is local.
I’ve been thinking the older demographics too.
People have been mentioning the boomer dynamic for a while as in why has it not shown up, why aren’t they downsizing. But at some point, that question is irrelevant as time makes their number smaller, it’s inevitable.
From my experience with friends and relatives, downsizing plans are not common.
Following are several middle to upper class examples:
Married couple. Bought FL condo in their late 60’s. Wife went into memory care in her early 80’s for 10 years. Condo sold. Husband died in their family home in mid 90’s.
Elderly couple planned well ahead, downsized by selling family home and cabin home in their mid 70’s. Bought small townhouse and timeshare for vacationing. Still doing OK in their early 80’s.
Single woman sold her home at age 80 and entered senior living. Passed at age 84.
Married couple sold family home around age 60, bought vacation homes in North and South. Snowbirds for 20 years. Sold both properties after one spouse passed in his early 8Os. Remaining spouse lives near younger relatives in a senior home.
Married rural couple. Husband died young at age 75. Wife lived in family farm home until death at age 83. Relatives did extensive clean up then home was sold.
Married couple in their late 70’s. Active and live in their in their original 3/2 family city home near family.
Married couple in their early 80’s. One spouse has lots of health issues. Living in their family city home with cleaners and care professionals providing assistance. They rarely leave their 4/3 home.
Single man died suddenly in his long time city home in his late 80’s. Relatives cleaned up house, couldn’t agree on RE plan, so they are temporarily renting it to a group of four young people with five cars in the driveway.
Active well- to- do couple in their early 70’s. Still live in their large northern family home near kids and grandkids. Lots of vacations, but no vacation homes.
Active wealthy couple, early 70’s, sold large family home 10 years ago, bought 3/2 luxury golf course homes in North and South.
The basic theme is – most boomers never downsize, but they sometimes sell their family homes to buy properties in better locations. Some are forced to downsize because off health or loss of spouse.
I hear you, but was saying as politely as I could that people die, over time.
Sorry, I went way overboard trying to answer my own question as to why downsizings aren’t happening.
Baby Boomers are usually defined as those born between 1946 to 1964. I remember reading a few years back that about 10,000 Baby Boomers retire every single day. The oldest Baby Boomers would be 79 yrs..right now. Imagine how many homes will come down the pipeline as they start to die off and go to retirement homes. Census numbers show there were between 73 to 76 million Baby Boomers in 2020.
“Look out below! Here come the houses!”
This stuff is just funny. You people sound like boomers were the last generation on earth, and no one comes behind them LOL. Generations are a flow, and the biggest flow ever is the Millennials, they are a larger generation than the boomers, and they’re filling their slots just fine, as are GenZers. And GenXers are still out there too. This whole planet is full of people. And even after the boomers have bailed out, the planet will still be full of people, fuller than ever.
…binary thinking for EVERYBODY, base-ten paper-metrics and base-90 (?) lifespan metrics be damned!
may we all find a better.
Builder’s grade homes north of Houston, TX selling well, but at 10% off range from 12 months ago. Lots of goodies included and financing offers (reduced % first two years).
San Diego real estate on fire again. Just looked at a house listed at $1.29MM in Carlsbad and they got an offer over $1.4MM after the first weekend. Nuts.
SoCal is hopeless, guess the majorities are right…this time is different and SoCal can only go up forever, guess this one will be for the history book
It’s funny how people use “one house” — mystery house, fictitious house? real house? — based on an “offer” to say that the entire market is “on fire.” In this case, it’s just BS because for the city of San Diego, whereof you speak, prices were down a hair in February from January, seasonally adjusted, and were down from their peak in July 2024.
The year-over year increases have been shrinking every month, from double digits a year ago to 4.0% in February, the smallest since Sep 2023. They yoy chart is heading straight down.
Here is the price level for the city of San Diego, seasonally adjusted:
The northern coastal cities of San Diego…. La Jolla,Carmel Valley, Del Mar, Cardiff, Encinitas, Carlsbad etc should be considered as a sub-set of the San Diego market. While definitely a part of it, their particular locations are ALWAYS in higher demand… Just sayin’
Rosarito Dave
The chart in my comment is for the CITY of San Diego. The chart in the article is for the MSA of San Diego (= San Diego County), which includes La Jolla, Del Mar, Carlsbad, Encinitas, etc.
Rosarito Dave,
You make a good point regarding “sub-set”.
I do sub-set market watching from my daily ride along Mississippi River Road in Minneapolis & St Paul. When I see a for sale sign go up on one of these properties, I check online and see asking prices and photos.
For anyone wanting to see what $2.2 M buys in a prime river location, check out 470 Mississippi River Blvd N, St Paul, 55104.
30 days on market so far.
One thing I remember from reading Wolf’s comments when I saw the above mentioned home for sale:
Wolf Richter
Feb 21, 2025 at 4:44 pm
The luxury market isn’t what I’m interested in from an economic point of view. Volume is relatively small, and it does what it does. I’m interested in the big-fat middle where most of the volume is.
9,440 square feet and nine fireplaces? The luxury market does what it does. . .
Prarie Rider,
Awesome house. Amazing how cheap it is compared to the coasts. You couldn’t build just the house like that for less than $5 million. Only bummer is that deal killer of a boulevard behind it. Oh yeah, and the winter!
Prairie Rider,
Beautiful house. But they’ve been trying to sell it for the past decade+? Something tells me it’s not really $2.2M but much, much less.
La Jolla is actually in the San Diego “city” limit (so when there are multiple high end sales like the $35 million dollar Foxhill estate that sold last year close in a month the “city” average price will move up).
Prairie Rider, my educated guess as to why it hasn’t sold is because it’s positioned at a growing bend in the Mississippi River. Give it a couple decades and there may be serious slope stability issues as Big Muddy meanders. Without looking at the local geology and historical high water levels adjacent to the property, I can’t say how much the river impacts its property value. But my gut says A LOT.
La Jolla isn’t a city, it’s a community well within the boundaries of the City of San Diego. There is a movement to become its own city, though.
Re: the north coastal towns in San Diego, active listings are up 50% from 2 years ago. And pendings are up 0% from 2 years ago.
2026-2029 will see significant price declines.
In case you haven’t looked, the stock bubble, crypto bubble – the EVERYTHING BUBBLE – is still near the pinnacle peak. Until those things start to buckle, nothing will change.
Now we have an administration pumping crypto, who was also a stock market pumper his last time. I do not anticipate any meaningful correction in equities under his watch. His ego will not allow for it.
Prairie Rider – when the real estate BUBBLE finally corrects, that “$2.2 Million” mansion will revert to is reality pricing – likely $350k to $500k on a good day.
These real estate prices based on Monopoly Money are laughable. And yeah, that one’s been for sale for 11 years.
That did not take long.
Every RE post that is showing a drop has someone show up and say “not in my market!”
Look at the chart. SD is below the peak. I live in San Diego and homes aren’t selling.
That’s why I have a policy that for comments on real estate articles, I will usually only read Wolf’s comments. Way too many real estate shills come around and post nonsense to read the whole thread. They hate any kind of real talk about prices.
Honestly, for almost all of Wolf’s articles – I only read his comments. So many others are just anecdotal garbage.
@Obi66, then you definitely don’t want to go into the cesspool known as Reddit. On REbubblejerk, the circle jerking among RE humpers are on the next level. Great for a entertaining sideshow amusement kind of read though
👏 👏 👏
“Not in my market!”
The housing bubble has turned into a crypto-like casino, where one feels as wealthy as King Solomon and many often feel like they are holding an asset that perpetually goes one way -straight up. Houses have become the modern slot machines – but ones that, for now, have mostly guaranteed success. Most players win. Only a mathematical idiot would think that this can go on forever. It can’t and it won’t.
It’s true. My neighborhood is killing it!
I second you on this being a SD resident like you
I’m actually interested in how the SD market is doing when you remove the very high end sales.
I live in a normal SD suburb and things are bleak here. Homes get posted but they don’t sell. Then they get pulled off the market. And then reposted again.
My thought is the very high end market is holding the median sale’s price up.
We in SD think that come what may home prices in sd would never go down.
We are special and this time is different.
Large oversupply issues north of Charlotte with many new home developments by companies like DR Horton, Lennar. Homes moving, but aggressive incentives being offered and publicly advertised. Existing home demand has fallen off substantially. Increasing inventory on the market, and even with price reductions some homes are not moving. For the greater metro area, homes sold -14.6% rolling 12 months. Median days on market 53 – up 5 days versus prior year.
As long as mortgage rates stay high prices will continue to drop.
Most people buy a monthly payment so reductions in the mortgage rate are instantly reflected in the sales price. However, people sell based on the price and are emotionally invested in the amount they “deserve”.
Sellers will cut their price by $10k on a 1MM+ home without understanding that this does nothing at all to the monthly payment so buyers don’t care. This makes things much slower on the way down. This entitlement mentality will need to die before things really get moving.
I’m watching investor sales for the biggest source of new inventory in the near future.
I was hoping we’d hit spring selling season over 7% on the 30yr fixed… fingers crossed it heads back that way.
Howdy Youngins. 39 Trillion will buy you lots of big bubbles. The hissing continues in RE and just starting with stocks. Pictures of stock boys brown baggin all over the internet. Fun Times for some folks…… Buffett maybe selling his RE interests. Whats he up too????
Wolf, I don’t know why you keep calling bubble. In my view prices have barely come down. Need a 60% drop to increase affordability. What do you think?
You don’t know what a bubble is. That is your problem.
A bubble is when prices RISE extremely. A BUST is when prices fall a lot.
Not the other way around.
So we had Housing Bubble 1, and Housing Bust 1. Then we have Housing Bubble 2, and some markets are already facing housing bust 2.
So get your definitions straight.
I have run this series since 2017 to document the crazy rise of home prices in some of the high-flying markets.
I look forward to the day Wolf when you will have complimentary article something along the line of “The Most Splendid Housing crash in America” to go with monitoring the housing bubble article. I imagine this site wasn’t around back in 08 to 12?
I do to Phoenix, but I think this will heavily depend on whether we end up in a recession. I didn’t see it as a possibility and thought for sure the next leg up in housing was coming, but with all this economic war craziness a recession may arrive and that would definitely change my outlook.
In the last 3 years we’ve seen Washington D.C. turn into a 3rd world s$ithole. This is also reflected in the fall in property values sited above. This can all be turned around with better management of the city. This could be done by eliminating home rule and going back to 1973. The entire city government needs to be fired, starting with the mayor and the city counsel. This is the nations capitol. We deserve better.
@wolf Thanks for always putting these articles together. Would love to see some for sale inventory numbers for these metros, mom, yoy and current vs pre-pandemic. Also think it would be interesting to see rental prices in those areas.
From what I can tell from other sources, here in the Denver metro market inventory is up significantly compared to the prior year and pre-pandemic. This is a big change from last year. If buyers don’t show up significantly this Spring, I think we could finally start to see some significant price reductions. Also rents are down ~5% yoy here. Everywhere I look though there are still cranes building more high end apartments.
As someone who has participated in those high end apartment building I can tell you that show is over, most of those projects got funded and designed in 2019, 2020, 2021 and are just nearing complete builds.
Have 2 that just completed this year that started in 2020 – 2021. Show is over in that regard.
Colorado as a resident is a completely stupid market unsure why we rose so high but I’m glad I sold everything off for massive gains.
Insurance for mountain homes just got crazy 5k in 2019? When I sold the renewal was asking for 9k and I heard from my the new owner that they are unable to insure for anything under 21k now as their realtor inquired whom we used. Ya this market is going to hurt some folks as it keeps chugging along.
21k that’s insane. So when do all the mountain Airbnb’s start hitting the market? Haha.
Tourism was down for most mountain towns last summer. Breckenridge was down 20% you. And it was another bad snow winter…. rumor has it Vail Resorts winter visitor numbers were way down.
Good for you for getting out!
yoy. Not you
It was a bad snow year in the San Juan’s, but pretty average in the I70 corridor. And Breck was fractionally less busy this year, like a few percent, not 20%. Our mountain condo homeowners insurance is up along with the value of the property but is nowhere near the increase of places like FL.
The interesting thing is a lot of these new apartments just seem to be sitting there empty. There’s one by my gym and another by my grocery store. Look super nice, great location, haven’t seen anyone working on them in over year but no one seems to work or live there.
The sky full of cranes I see daily might be for condos, townhomes, and those super close together new build houses – hard to say but still lots of early stage building by me.
@Kracow how big is the home with the $21K/year insurance bill? My sister pays less than $10K for a ~3K sf home in Aspen and we are just over $10K/year (combined CA Fair Plan policy for fire plus LSI policy for everything else) for our ~4K sf home in North Lake Tahoe.
@MM1 Since AirBnB started it has not been possible to get positive cash flow from a short term rental home home near a major US ski area with anything less than a 75% cash down payment so almost all AirBnBs near major ski areas are owned by people who are just trying to lower the cost of cabin ownership and while nobody like to have an extra $1K/month espense, invreasing insurance should not force many people to sell.
I ran one in Frisco for awhile and that’s not true. It was bought in 2018 with a 0% down govt VA loan since the friend that bought it was pretending it was her primary residence. I did the accounting for it also while switching from being a CPA to software engineer. Significant cash flow no, covered the expenses yes. Could this friend have afforded both her Denver house and Frisco house mortgage without the income no. Could she even have covered half the mortgage plus her actual home mortgage no. One month a lot of bookings cancelled and she had to borrow money from her parents or miss her mortgage payment. That’s my point – we’re seeing declines of nights booked around 20~ yoy AND nightly rates are also decreasing.
My landlord just bought one in Steamboat that is partially for their use but mostly and investment property and it’s not going as planned…it’s been vacant more than expected. And now she seems on the verge of a panic attack all the time.
I mean everything is local. CO is the land of Airbnb. All I know is people can’t afford their home mortgage plus their mountain mortgage without significant Airbnb revenues and I’ve met a lot of people in that situation besides the two mentioned above. I’m sure there’s a lot in good financial positions too. I’m not saying all Airbnb’s will struggle just enough to up inventory even more.
Also I think I read a statistic awhile back, that 20% of Denver housing inventory was Airbnb’s. One of the highest concentrations of the major metros in the US. If some of them start to fail I won’t be sad.
Am i reading this right? $21,000 house insurance for what, something less than a million? And how about property taxes? That is mind blowing. Without even factoring in a mortgage/buying the house, you can rent yourself a damn fine home for that kind of cash.
My friend is paying 36k per year for insurance hoa and property tax plus in San Diego for 2600 sq ft home which he might for 1.6mi
Small change.
Park Lane condos in Ala Moana in Honolulu are luxury condos with high prices.
One has an asking price of $12.9 million. Monthly fee for the condo is $7700. Real estate tax is a little over $10,000 a month.
So holding costs for just those two items is around $220,000 a year.
Insurance, I have no idea, but it won’t be cheap.
A single family home in a ski town in CO is by definition at least a million and more likely 2 or 3. Homeowners insurance in the mountains is a little pricier than Denver but nothing like coastal FL. I think this commenter may have a unique situation, a 2 million $ mountain property in Summit County is typically 10K is to insure.
MM1
There are already 34 charts in this article. You want me to add 34 inventory charts and 34 rental charts, LOL?
Inventory is dealt with in separate articles, and there are plenty of them on this site.
Look, I make you a deal: you run your business, and I run my business.
Triple tops in most of these markets, with prices still at or near all-time highs, but with sales off by 50%. The mix might be part of the problem, but prices need to crash into oblivion from here. It’s shelter, and the whole situation is sick and twisted.
There is an important concept in finance and that is duration, how long before one gets back their purchase.
I don’t have the energy anymore to actually investigate the relationship between price and the net present value discounted cash flow result. I estimate, roughly, that a fool buying stocks at the current elevated level, will be made whole in 40 years.
It’s always the world of location, location, location and the dynamics in those individual markets. Clearly the west and south have had more pressure on prices, but the northeast still holds more resilient. My northeast take–incomes have outpaced averages, construction has lagged (severely) the averages, and demographics don’t support slowing as people shift into home buying age cohorts. I love the insight from this page–outside of a semi-massive unemployment event, am I missing anything that will pressure prices?
I think you are correct in the sense that the verb dynamic connotes a peak, euphoric, but fleeting, transitory.
In the vernacular of most of us, I disagree with almost all of your assertions.
For instance, your absurd claim, ” My northeast take–incomes have outpaced averages,” is like the anthem of the loosing team.
Best wishes, of course.
Today’s real estate market is a tale of two markets.
Big cities where the big offices are located are doing awfully well because employees are being forced back into the office. Basically, all major west coast cities, as well as the northeast. Even the big cities of the midwest are doing well.
But, everywhere else might take a beating, especially areas popular with work from home. These people may be in real trouble.
I have a different take.
Looks like the 2nd tier cities are still coming up because they didn’t form quite as high a bubble (KC, OKC, Baltimore, etc).
The northeast and Chicago and coastal CA aren’t building homes, so prices are mostly stable. I don’t think return to office is going to change the population trajectory for these locations by much, the growth in those areas is almost all from immigration, especially for NYC and CA. And I suspect overseas immigration is about to be cut way back.
The Zoomtowns are shrinking partly because they overinflated and many of them also are still building like crazy. Boise and Austin have few constraints geographically or regulations for new home construction. Compare that to the Bay Area.
It will be interesting to watch!
Coastal CAs : The prices are not stable even though not many new homes in the market. Reason being: High unaffordability and escalating cost of taxes and insurance, other than actual monthly mortgage outlay.
WR has documented the home price decline in SFO area in his blogs. Please read them.
That is the micro-economic result of the macro-economic agenda.
It does not have to be this way. If there is one thing the Founders of this great country tried to warn us of the dangers of an imperial executive, a king, a despot. And they gave us a flimsy token, democracy.
Based on a moral argument for heavens sake.
After watching these charts for years (Thanks Wolf), decided to bail out on Bay Area RE. Living though Bubble 1 Crash was not fun so sold my SF Property in 2022 and later another north of SF. Feel good about it although being a renter again feels a bit like college again…landlords kind of suck even when you are a good tenant.
Any person with half a brain should see what is crystal clear – this housing market (and stock market) are flashing SKY HIGH valuation levels that have no basis in sanity or free market price discovery. There are some inland areas that are more reasonably priced, but most markets are in bubble status on steroids.
This isn’t going to end well.
Yes and I completely agree but when the market continously defy gravity for more than a decade now, when as an investor or home buyer/RE investor you simply have never been taught that you can lose in the long run, it can distort a lot of people’s perception and reality..
This is hot hand fallacy 101 and what we have been experiencing is that this is hot hand on super steroid hence the saying “This time is different…” until it isn’t…
The market can remain irrational longer than you can remain alive. And the FED will snicker at you as you die off.
Depth Charge-
“… the FED will snicker at you as you die off.”
The Fed will blunder into a new phase of experimental monetary triage when the markets(*) finally enter hasty retreat mode. It’s what they are chartered to do.
*Markets = stock, bond, real estate, money, labor, or most likely a combo.
I think you nailed it. Sellers of sky high valuations have no legitimate buyers As one that prides one’s self as having half a brain that conforms to the norm while the other half runs wild.
Recent WSJ article says that the Federal Government is propping up the bubble. Paying delinquent borrowers mortgage payments for them and tacking the additional amount onto the end of the mortgage. Preventing almost all distress that normally would be in the market. True?
The way you pitched it is BS. This is classic mortgage forbearance. It is being used to deal with natural disasters right now for homes that got damaged or destroyed, such as in Florida (floods) and California (fires). That’s what it is for.
Okie dokie. Whatever you say is word of God I guess. From the article
“Why do housing prices keep climbing despite higher interest rates? The federal government has allowed borrowers to take out bigger mortgages than they can afford. To prevent foreclosures, it’s bailing them out when they miss payments. Behold another subprime housing bubble.”
This is stupid bullshit. The government as in Fannie Mae, Freddie Mac, VA, FHA, Ginnie Mae, etc. buys mortgages, packages them into MBS, sells the MBS to investors, and guarantees the monthly payments to the investors. If the borrower defaults, the government, which is on the hook for the mortgage, HAS TO PAY the investor their monthly payments. That’s the kind of “agency” MBS the Fed has on its balance sheet. They’re about as good as Treasury securities. Since when is that news? Did you people sleep through the past 25 years? Is the moron that wrote this braindead?
Then Fannie Mae et al can decide what to do with the mortgage. They can get the borrower to sell the house and pay off the mortgage (due to the surge in home prices), or they can modify the mortgage, or they can enter into a forbearance agreement with the borrower for a certain time period with no monthly payments, which are then tacked on to mortgage and extend the mortgage by those payments. Right now, forbearance agreements have risen for the reasons I spelled out – natural disasters, the hurricanes on the Gulf Coast and the fires in California. This is data from the MBA, and a few weeks ago I posted a chart about it.
Raleigh!!!
Just for me I assume! 😉😂😆
🏆
Thanks, Wolf for your articles which are the gold standard of responsible reporting.
Like me, the more we know the better we do.
In the end, it’s only love that will get us through.