Consumer Spending Was OK-ish. Federal government spending spiked back partially after collapsing during the shutdown. Trade worsened.
By Wolf Richter for WOLF STREET.
The primary driver of Q4’s anemic GDP growth had been the collapse in federal government expenditures and investment during the shutdown. But that spending wasn’t cancelled, it was deferred, and part of it came out of the woodwork in Q1 – but not all of it, and there’s some left for Q2 – and so government spending bounced back partially, and that helped GDP in Q1. But net exports worsened, and that dragged down GDP.
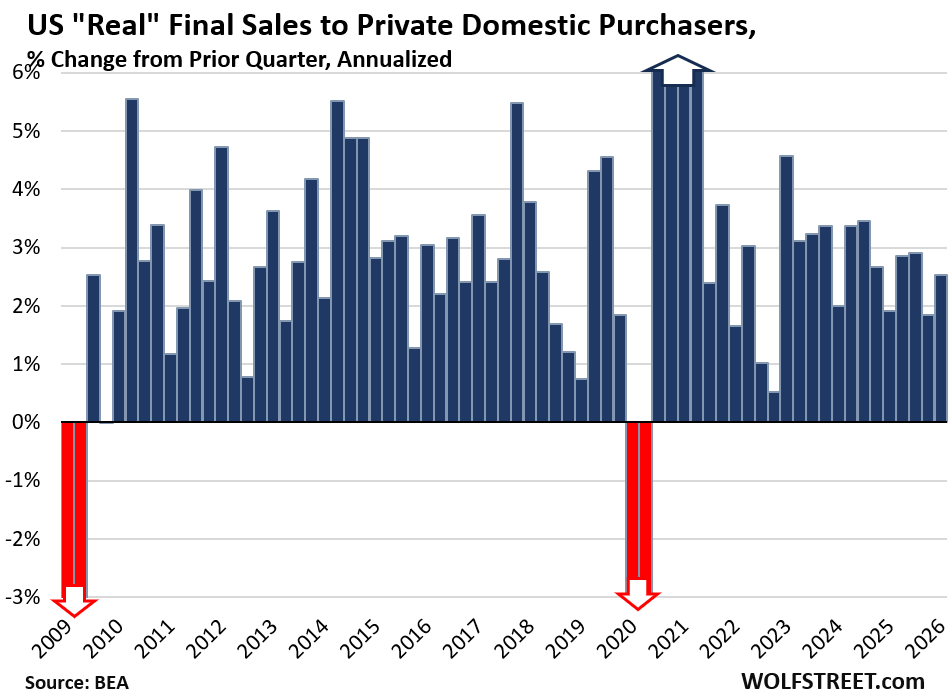
So, GDP without government and without trade: “Real final sales to private domestic purchasers” grew at an annual rate of 2.5% in Q1 from Q4, adjusted for inflation, according to the Bureau of Economic Analysis today. Growth has been solid and fairly consistent for the past three years, including in Q1.
This measure excludes government consumption expenditures, government gross investment, exports, imports, and changes in inventories. Powell cites this figure a lot in his press conferences as a purer measure of the private domestic economy.
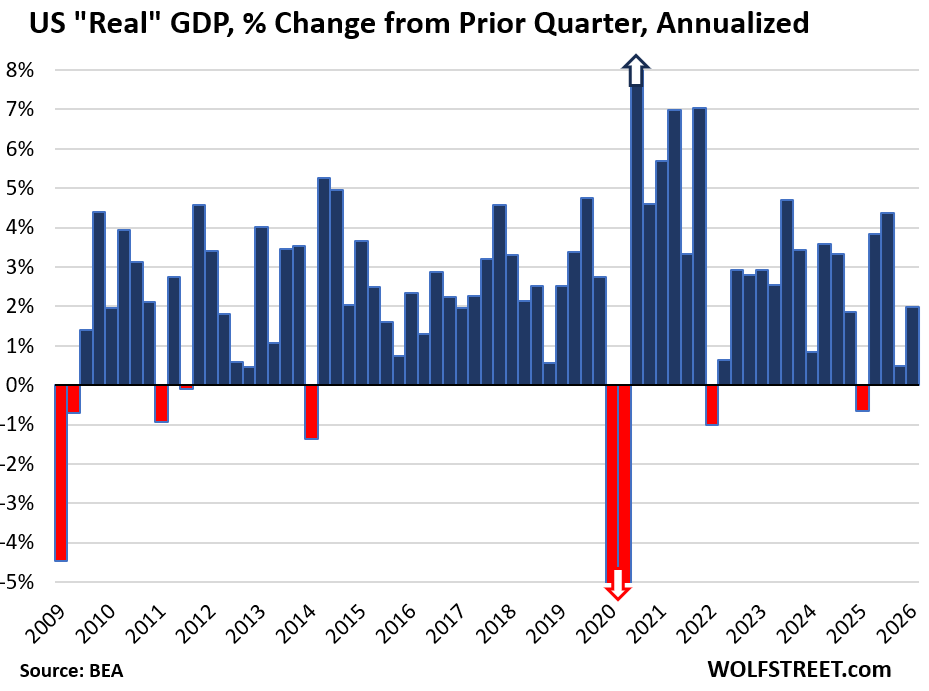
Overall GDP, including government, trade, and change in inventories, grew by an annual rate of 2.0% in Q1, adjusted for inflation (“real” GDP).
It was helped by the bounce-back of government spending and the massive AI spending boom. And it was pushed down the spike in imports.
By comparison, in the years between the Great Recession and the pandemic (so excluding recessions), average quarter-to-quarter GDP growth was 2.5% annual rate. The average 20-year quarter-to-quarter GDP growth, including recessions, was 2.2% annual rate.
“Current-dollar GDP” (not adjusted for inflation) grew by an annual rate of 5.6% to $31.8 trillion.
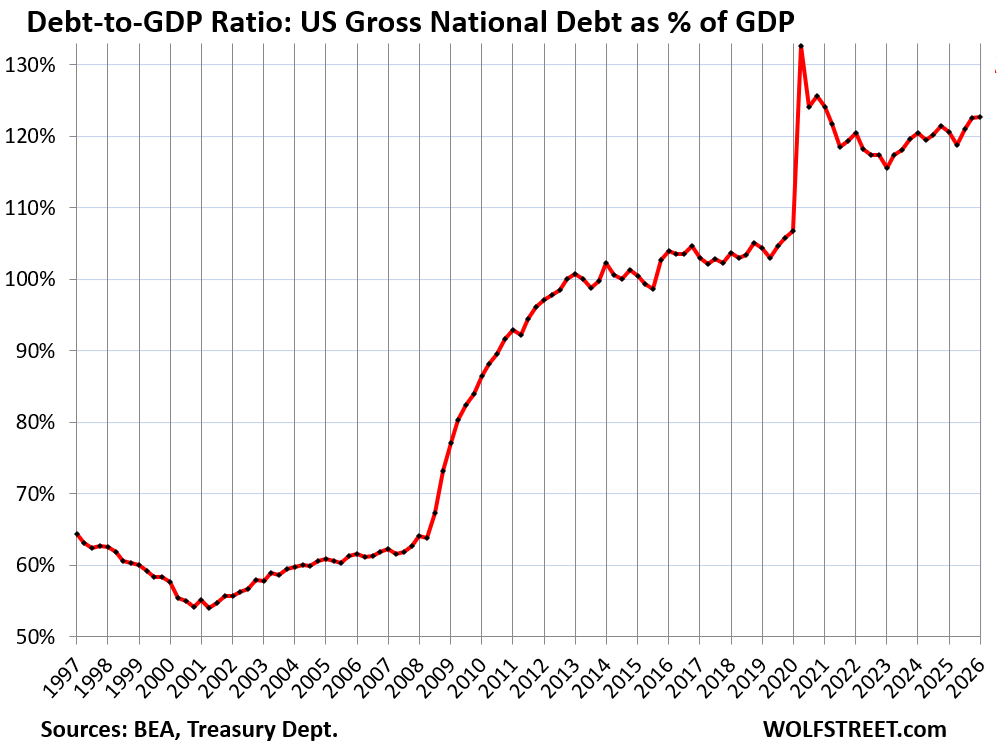
This “nominal GDP” of $31.8 trillion represents the actual size of the US economy in current dollars and forms the basis for the Debt-to-GDP ratio and similar GDP-based ratios.
The difference between this growth rate of 5.6% and the growth rate of “real” GDP of 2.0% is inflation. And there’s a lot of inflation in the economy. More in a little while, so stay tuned.

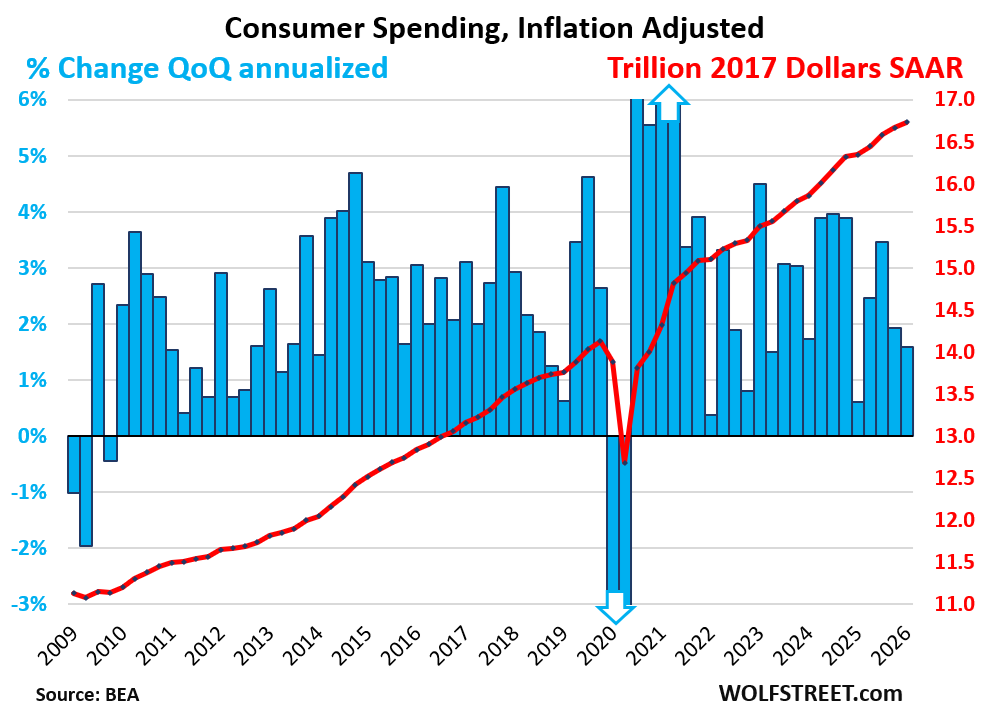
Consumer spending rose by an annual rate of 1.6% in Q1 from Q4, adjusted for inflation. This growth rate added 1.08 percentage points to the GDP growth of 2.0%.
Consumer spending accounted for 69% of the US economy.
The spending growth occurred in services. Spending on goods was roughly unchanged, adjusted for inflation:
- Services: +2.4%.
- Durable goods: 0%
- Nondurable goods (includes gasoline): -0.2%.
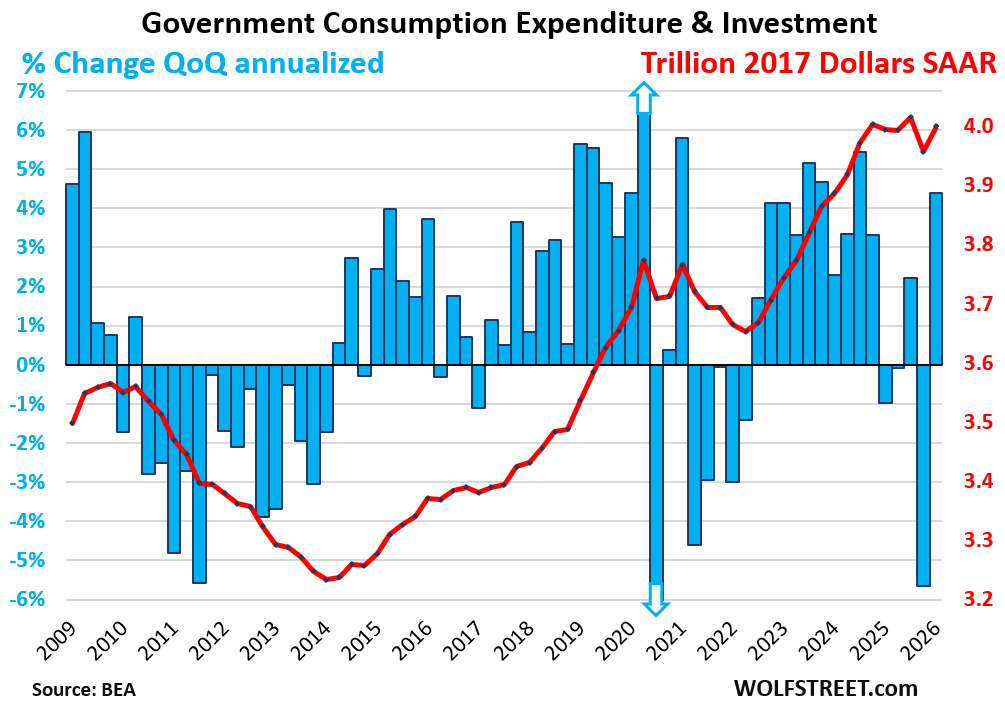
The blue columns show the growth rates (left axis), the red line shows the dollars (right axis), all in seasonally adjusted annual rates (SAAR):
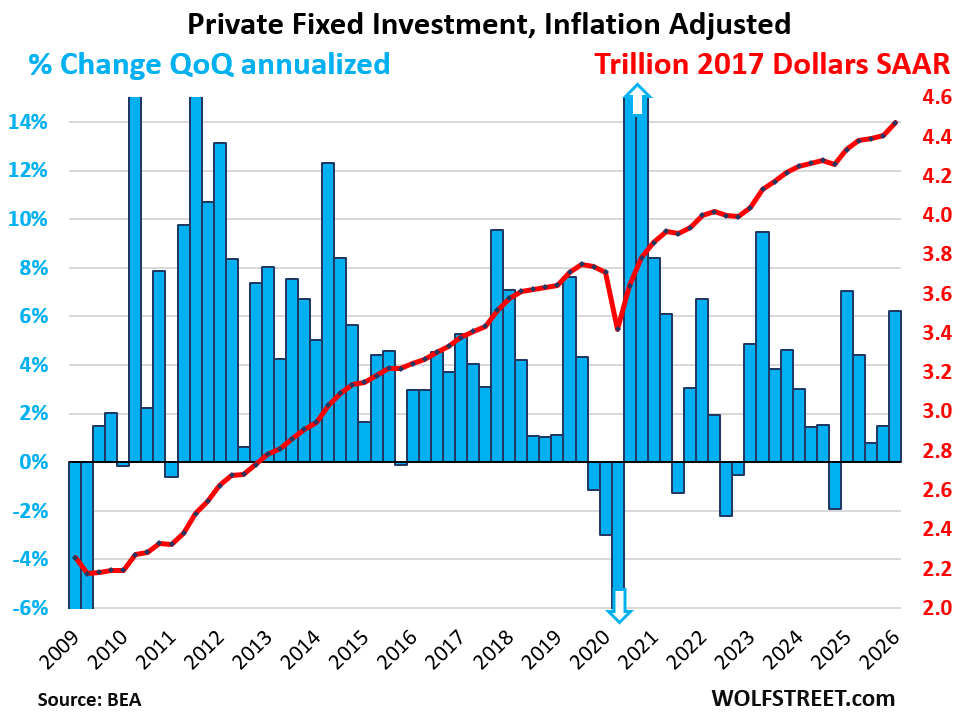
Private fixed investment (excludes changes in inventory) jumped by only 6.2% annualized and adjusted for inflation. Of which:
- Nonresidential fixed investments: +10.4%:
- Structures: -6.7%
- Equipment: +17.2%.
- Intellectual property products (software, movies, etc.): +13.0%.
- Residential fixed investment: -8.0%.
Private fixed investment accounted for 18% of the US economy and contributed 1.48 percentage points to the 2.0% GDP growth.
Government consumption expenditures and gross investment jumped by 4.4% annualized, adjusted for inflation, not quite undoing the plunge in the prior quarter, which occurred as federal government spending collapsed in Q4 as a result of the shutdown.
Federal government spending jumped by 9.3% annualized, after the 16.6% plunge in the prior quarter due to the shutdown:
- National defense: +2.3%
- Nondefense: +20.3%
The increase in federal government spending added 0.73 percentage points to the 2.0% of GDP growth.
This measure, “government consumption expenditures and gross investment,” does not include interest payments, and it does not include transfer payments directly to consumers (the biggest part of which are Social Security payments), which are counted in GDP when consumers and businesses spend these funds or invest them in fixed investments.
State and local government spending rose by 1.6%, which added 0.17 percentage points to GDP growth.
Combined, federal, state, and local government consumption and investment accounted for 17% of the US economy. About 60% of this measure of government spending is from state and local governments. Federal government spending accounts for about 40%.
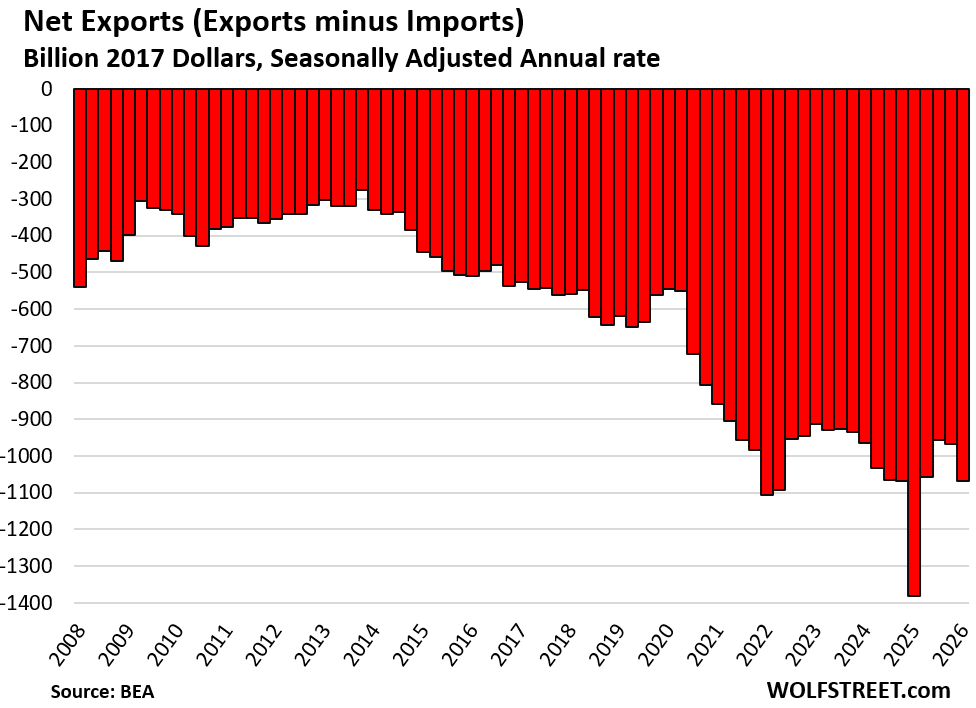
Trade Deficit worsens.
Imports jumped by an annual rate of 21.4% in Q1, on a surge in electronic products, including semiconductors as part of the AI data center boom. Also, in February, the Supreme Court invalidated a big part of the tariffs.
Imports are a negative in GDP, and when imports surge, they reduce GDP.
- Imports of goods: +25.8%
- Imports of services: +6.6% (includes US tourists spending overseas).
Exports jumped by 12.9% in Q1. Exports are a positive in GDP.
- Exports of goods: +18.1%.
- Exports of services: +4.2% (includes foreign tourists spending in the US).
“Net exports” (exports minus imports) worsened to an inflation-adjusted trade deficit of $1.0 trillion.
The Government’s Debt-to-GDP ratio ticked up a hair to 122.6%, as current-dollar GDP in Q1 rose quarter-to-quarter by 1.4% (not annualized) to an annual rate of $31.8 trillion, and the Treasury debt at the end of Q1 rose quarter-to-quarter by 1.4% to $39.06 trillion.
Enjoy reading WOLF STREET and want to support it? You can donate. I appreciate it immensely. Click on the mug to find out how:

![]()
Thanks for these extremely helpful summaries and updates.
Think the price we’re paying for oil/gas is going to crush this next reading.
The net export graph should give every American a chill.
We became a superpower because we took over manufacturing. We are blessed with amazing natural resources.
Not sure we will become Great Britain but that imbalance is not healthy
Manufacturing is dying out and the raw materials in the US ain’t what they were in 1850. Petro state thinking is part of the problem. The future is sustainability and space colonization
Lots of sarcasm here today
🤣❤️ “The future is … space colonization” 🤣❤️
Incredibly strong nominal GDP growth implies monetary policy is very easy. Though one year ago was weak, so maybe just a base effect. Still, prima facie, it looks worrying
“ Consumer Spending Was OK-ish.”
Richterianism – putting a positive spin on the economic news no matter how unoptimistic it may be.
1.6% real spending growth (annual rate), adjusted for 4.4% PCE inflation in Q1 (annual rate) with probably very little or no population growth for the first time in ever isn’t bad.
Not adjusted for inflation, that’s about 6% growth (annual rate).
Hmmmm….,congrats Wolf,zero hedge just posted one of your articles,is this a first?!
That’s actually how I found wolf. Been going on for at least 5 years, probably longer.
“is this a first?!”
No, they’ve been posting them since 2012. In the early years, I posted them myself on their site, they showed up at the top band. Then I stopped doing that maybe in 2013 or 2014 (too much work), and they posted them on their own in their regular lineup.
“Residential fixed investment: -8.0%.” wow. Usually about 3% to 4% of GDP, -12% wing???? Ouch
Residential fixed investment has come of a huge boom in 2020-2023. It’s still big, but less big. For all the reasons we’ve discussed here for a while. In Q1, there were also some worse-than-normal weather problems, so there’s that.
So it was okay but below averages and not blowing the doors off anyone… And now we have to wait for the revisions
Float on
There is a crash coming . The US S& P is trading at valuations that are historic in the collective . The PE is well above historical levels , the earnings yield is at a level that has preceded every major downturn , the dividend yield is 1% and over one trillion dollars are being spent each year to inflate per share earnings through buybacks, while the market index has risen at twice the rate of the earnings that support it .
The worst scenario for capital allocation is the combination of low interest rates and high valuation.
There are now only two choices for the income Fed Chair , which is to walk the talk about reducing liquidity and watch a valuation collapse , or submit and restart QE and watch the dollar tank