Consumer Spending Was OK-ish. Federal government spending spiked back partially after collapsing during the shutdown. Trade worsened.
By Wolf Richter for WOLF STREET.
The primary driver of Q4’s anemic GDP growth had been the collapse in federal government expenditures and investment during the shutdown. But that spending wasn’t cancelled, it was deferred, and part of it came out of the woodwork in Q1 – but not all of it, and there’s some left for Q2 – and so government spending bounced back partially, and that helped GDP in Q1. But net exports worsened, and that dragged down GDP.
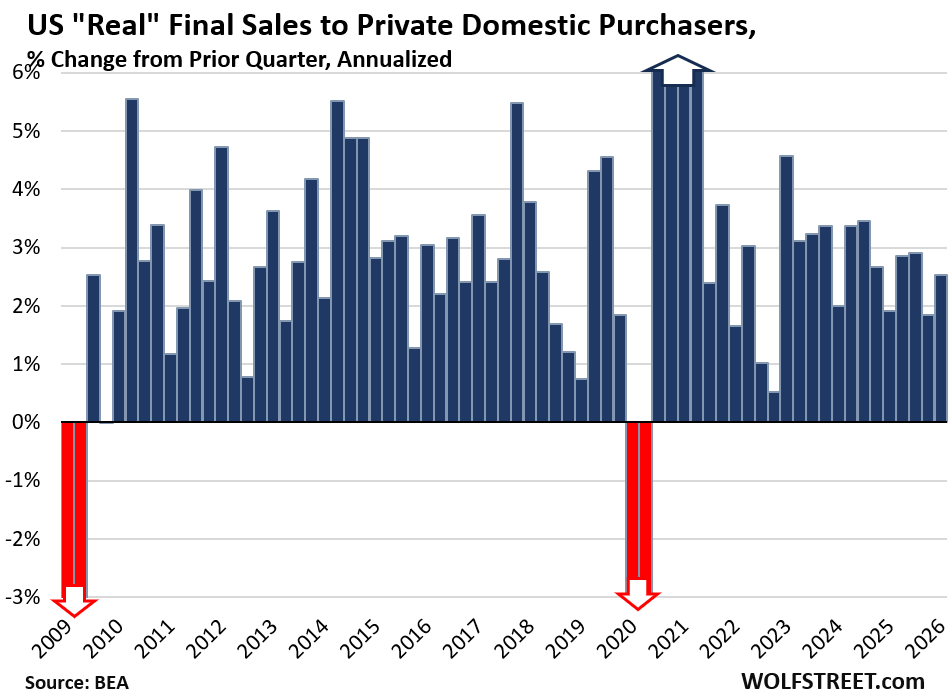
So, GDP without government and without trade: “Real final sales to private domestic purchasers” grew at an annual rate of 2.5% in Q1 from Q4, adjusted for inflation, according to the Bureau of Economic Analysis today. Growth has been solid and fairly consistent for the past three years, including in Q1.
This measure excludes government consumption expenditures, government gross investment, exports, imports, and changes in inventories. Powell cites this figure a lot in his press conferences as a purer measure of the private domestic economy.
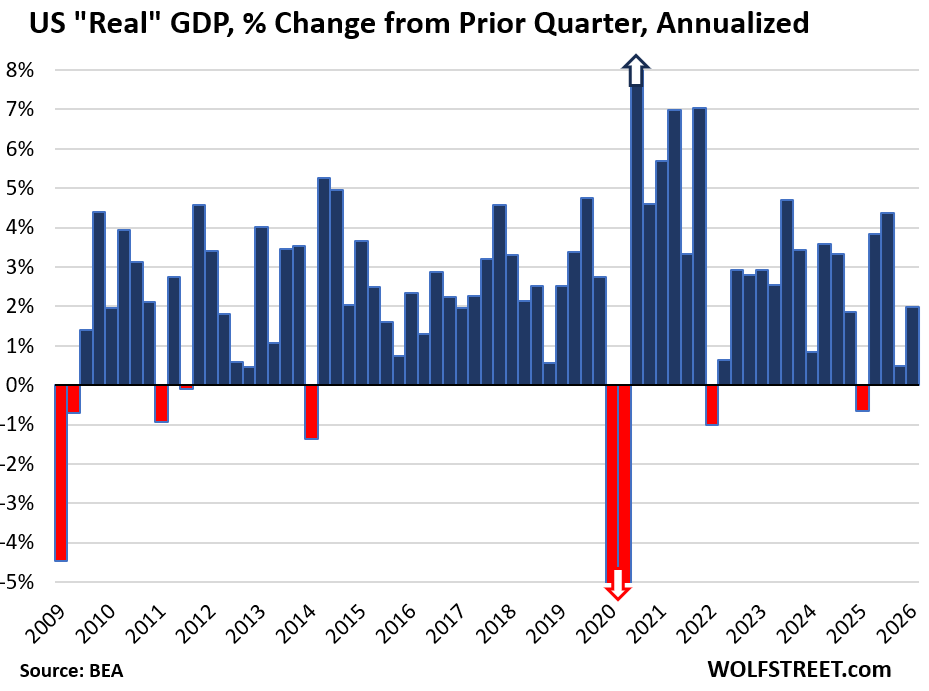
Overall GDP, including government, trade, and change in inventories, grew by an annual rate of 2.0% in Q1, adjusted for inflation (“real” GDP).
It was helped by the bounce-back of government spending and the massive AI spending boom. And it was pushed down the spike in imports.
By comparison, in the years between the Great Recession and the pandemic (so excluding recessions), average quarter-to-quarter GDP growth was 2.5% annual rate. The average 20-year quarter-to-quarter GDP growth, including recessions, was 2.2% annual rate.
“Current-dollar GDP” (not adjusted for inflation) grew by an annual rate of 5.6% to $31.8 trillion.
This “nominal GDP” of $31.8 trillion represents the actual size of the US economy in current dollars and forms the basis for the Debt-to-GDP ratio and similar GDP-based ratios.
The difference between this growth rate of 5.6% and the growth rate of “real” GDP of 2.0% is inflation. And there’s a lot of inflation in the economy. More in a little while, so stay tuned.

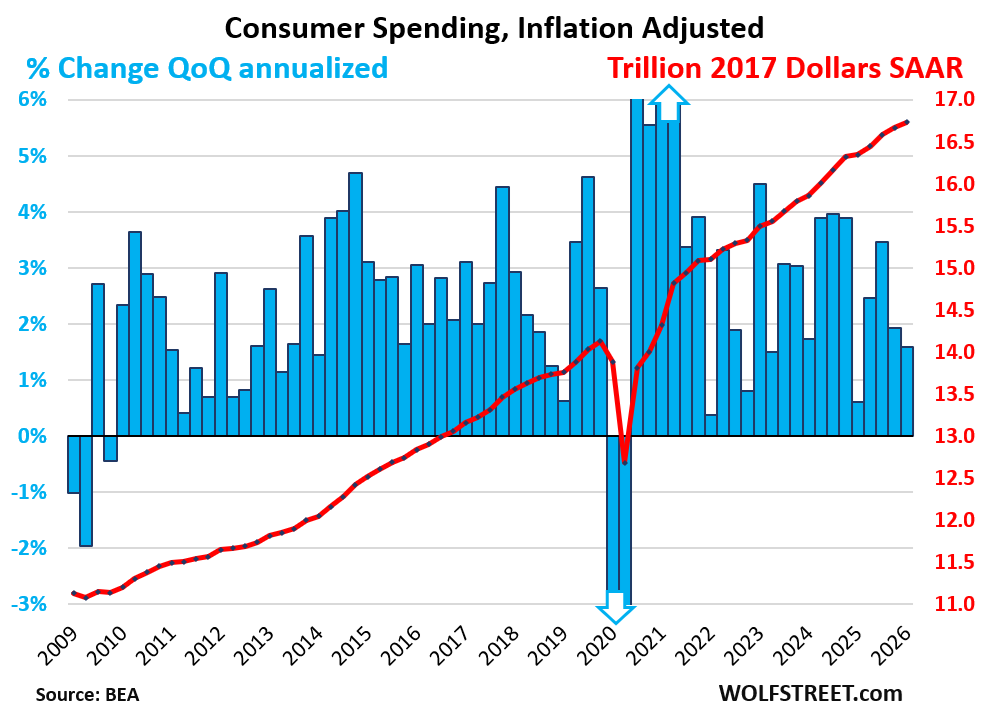
Consumer spending rose by an annual rate of 1.6% in Q1 from Q4, adjusted for inflation. This growth rate added 1.08 percentage points to the GDP growth of 2.0%.
Consumer spending accounted for 69% of the US economy.
The spending growth occurred in services. Spending on goods was roughly unchanged, adjusted for inflation:
- Services: +2.4%.
- Durable goods: 0%
- Nondurable goods (includes gasoline): -0.2%.
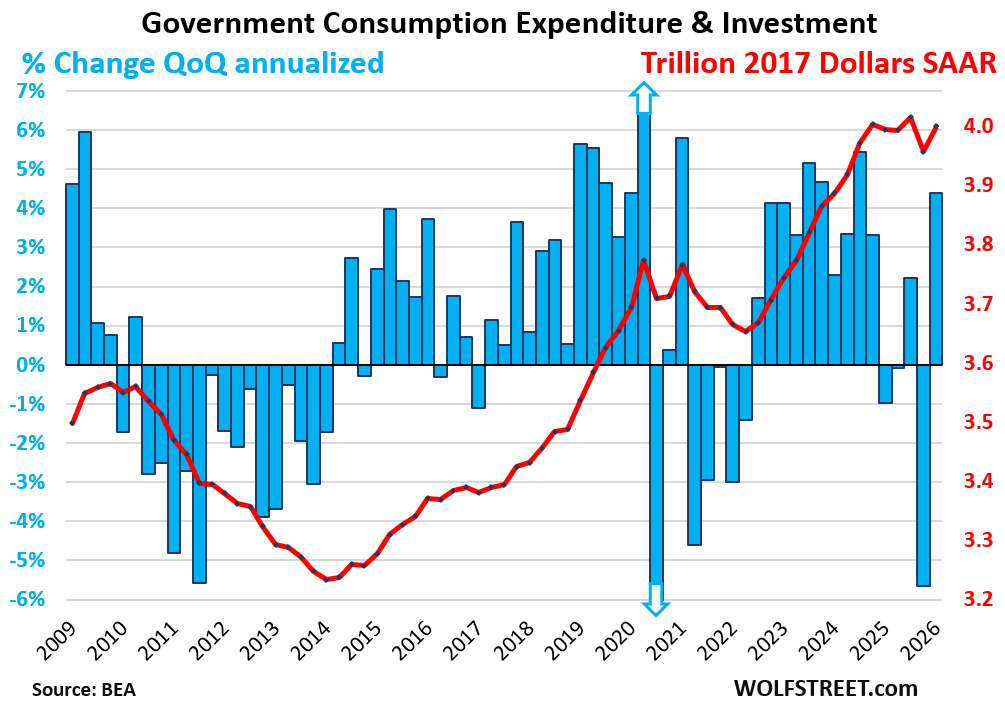
The blue columns show the growth rates (left axis), the red line shows the dollars (right axis), all in seasonally adjusted annual rates (SAAR):
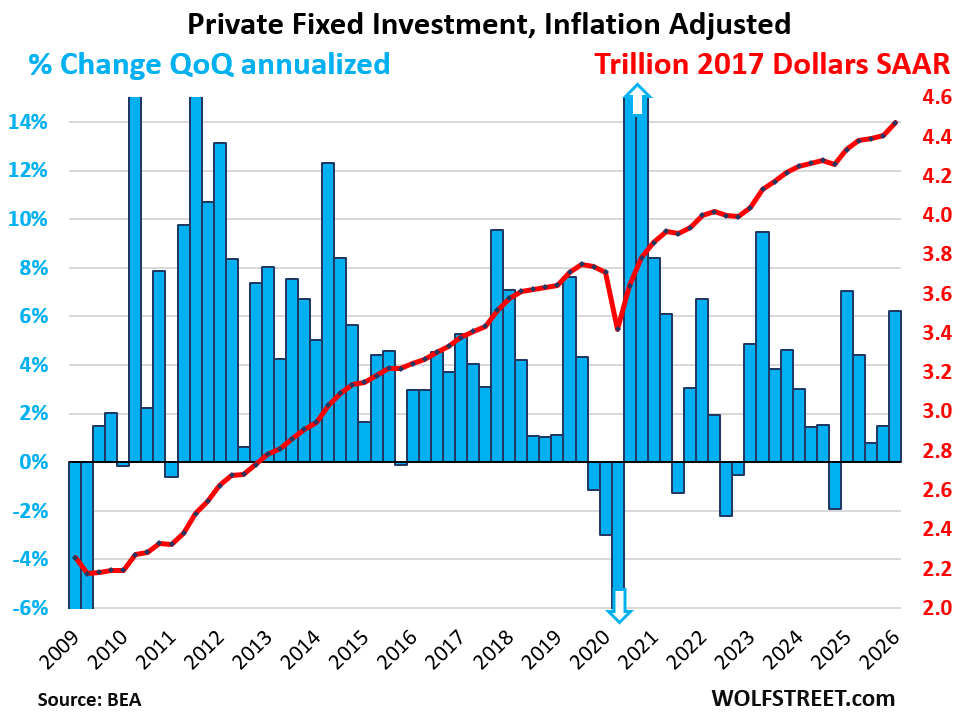
Private fixed investment (excludes changes in inventory) jumped by only 6.2% annualized and adjusted for inflation. Of which:
- Nonresidential fixed investments: +10.4%:
- Structures: -6.7%
- Equipment: +17.2%.
- Intellectual property products (software, movies, etc.): +13.0%.
- Residential fixed investment: -8.0%.
Private fixed investment accounted for 18% of the US economy and contributed 1.48 percentage points to the 2.0% GDP growth.
Government consumption expenditures and gross investment jumped by 4.4% annualized, adjusted for inflation, not quite undoing the plunge in the prior quarter, which occurred as federal government spending collapsed in Q4 as a result of the shutdown.
Federal government spending jumped by 9.3% annualized, after the 16.6% plunge in the prior quarter due to the shutdown:
- National defense: +2.3%
- Nondefense: +20.3%
The increase in federal government spending added 0.73 percentage points to the 2.0% of GDP growth.
This measure, “government consumption expenditures and gross investment,” does not include interest payments, and it does not include transfer payments directly to consumers (the biggest part of which are Social Security payments), which are counted in GDP when consumers and businesses spend these funds or invest them in fixed investments.
State and local government spending rose by 1.6%, which added 0.17 percentage points to GDP growth.
Combined, federal, state, and local government consumption and investment accounted for 17% of the US economy. About 60% of this measure of government spending is from state and local governments. Federal government spending accounts for about 40%.
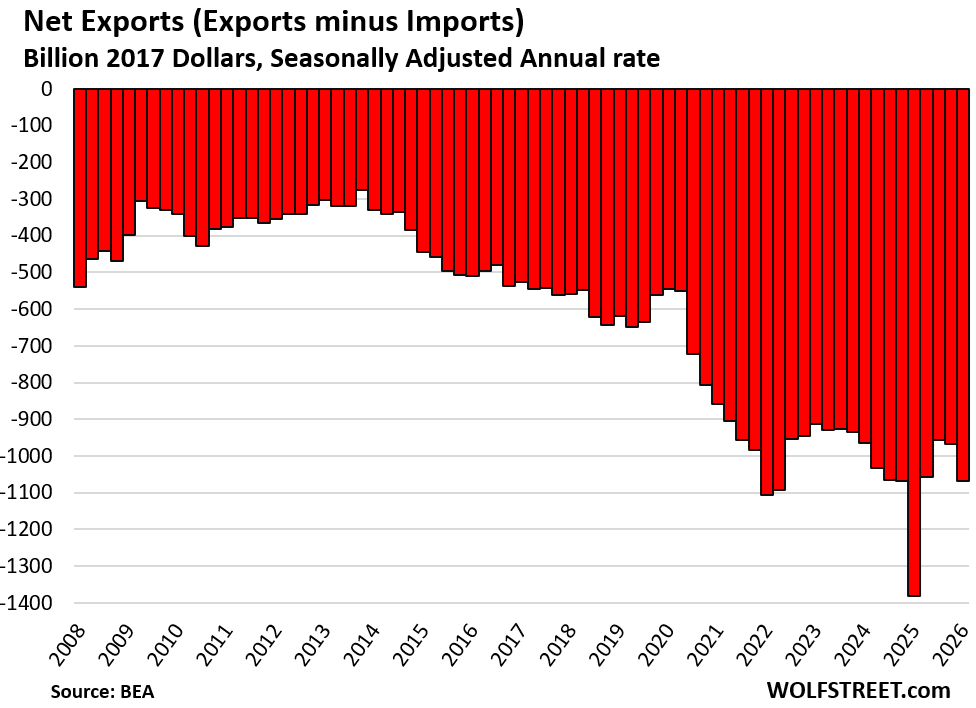
Trade Deficit worsens.
Imports jumped by an annual rate of 21.4% in Q1, on a surge in electronic products, including semiconductors as part of the AI data center boom. Also, in February, the Supreme Court invalidated a big part of the tariffs.
Imports are a negative in GDP, and when imports surge, they reduce GDP.
- Imports of goods: +25.8%
- Imports of services: +6.6% (includes US tourists spending overseas).
Exports jumped by 12.9% in Q1. Exports are a positive in GDP.
- Exports of goods: +18.1%.
- Exports of services: +4.2% (includes foreign tourists spending in the US).
“Net exports” (exports minus imports) worsened to an inflation-adjusted trade deficit of $1.0 trillion.
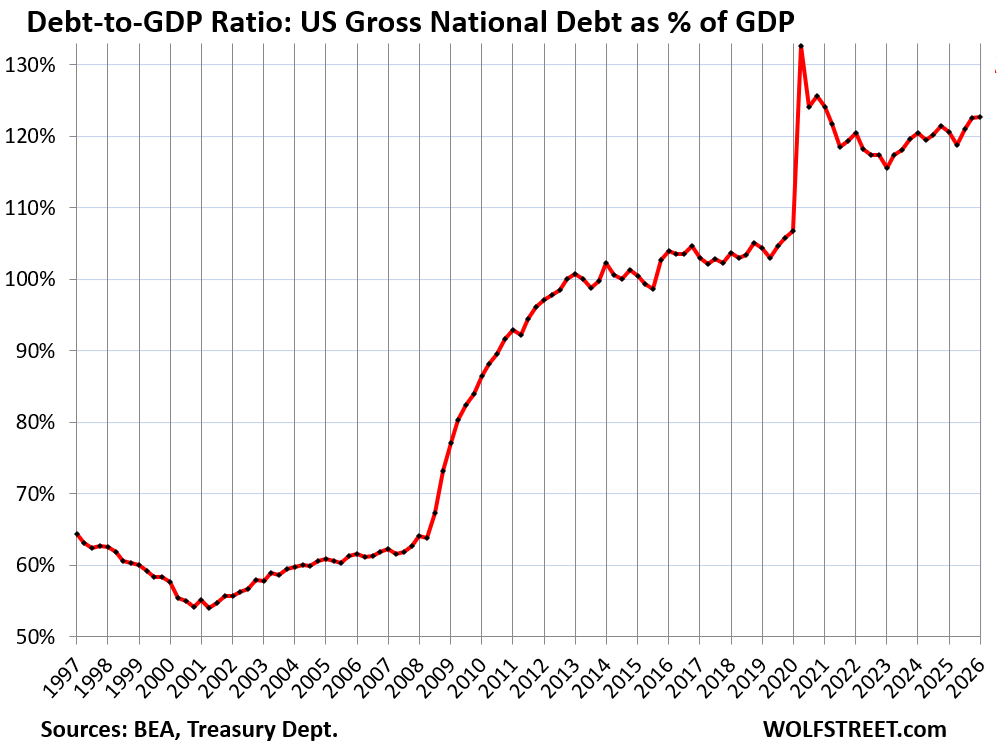
The Government’s Debt-to-GDP ratio ticked up a hair to 122.6%, as current-dollar GDP in Q1 rose quarter-to-quarter by 1.4% (not annualized) to an annual rate of $31.8 trillion, and the Treasury debt at the end of Q1 rose quarter-to-quarter by 1.4% to $39.06 trillion.
Enjoy reading WOLF STREET and want to support it? You can donate. I appreciate it immensely. Click on the mug to find out how:

![]()
Thanks for these extremely helpful summaries and updates.
Think the price we’re paying for oil/gas is going to crush this next reading.
Consumer is tapped out now even the pay later systems are showing issues and delinquencies even if gas is still lower than the high the last 4 years … to bad all our domestic capacity is not set locally vs globally but the real issue for this economy is the blue zones and their cost increases you factor them out inflation drops almost a 1% and gas average almost $1 while CA fights opening back up their oil fields and thankfully for them 66 was delayed closure due to Federal Acts.
How did the “Federal Acts” (what is that by the way) delay p66 closure. CA didn’t actively shut down p66. P66 made the business decision to shutdown rather than have to invest in regulatory upgrades in a declining demand environment. The ROI wasn’t there.
Yes CA mandated those regulations but the “Federal Acts” did nothing. And no federal government action delayed the closure.
The net export graph should give every American a chill.
We became a superpower because we took over manufacturing. We are blessed with amazing natural resources.
Not sure we will become Great Britain but that imbalance is not healthy
Hmmmm….,congrats Wolf,zero hedge just posted one of your articles,is this a first?!
That’s actually how I found wolf. Been going on for at least 5 years, probably longer.
“Residential fixed investment: -8.0%.” wow. Usually about 3% to 4% of GDP, -12% wing???? Ouch