Demand destruction continues after the price explosion from mid-2020 to mid-2022.
By Wolf Richter for WOLF STREET.
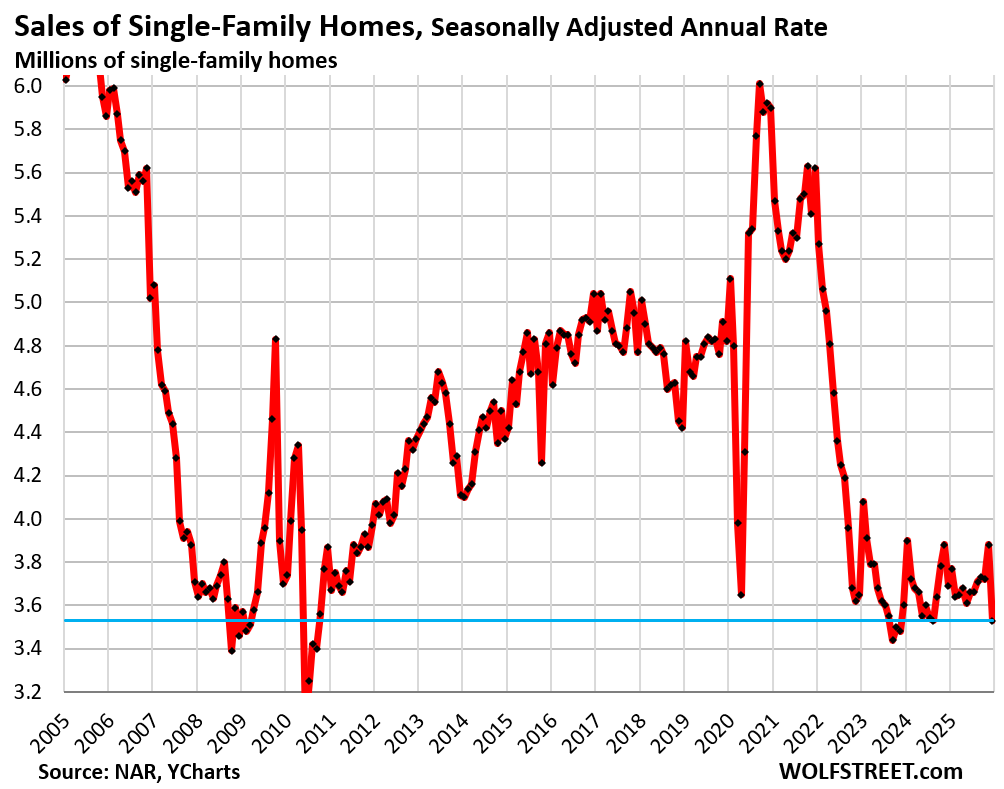
Sales of single-family homes that closed in January plunged seasonally adjusted by 9.0% from December, to an annual rate of 3.53 million sales. Compared to January in:
- 2025: -4.3%
- 2024: -9.5%
- 2023: -3.3%
- 2022: -37.2%
- 2021: -40.2%
- 2019: -20.1%
There were bad winter storms in parts of the country. So, OK. But wait… in the vast West, the weather was warm and fairly dry for this time of the year, and sales in the West plunged too; more in a moment (historical data from YCharts):
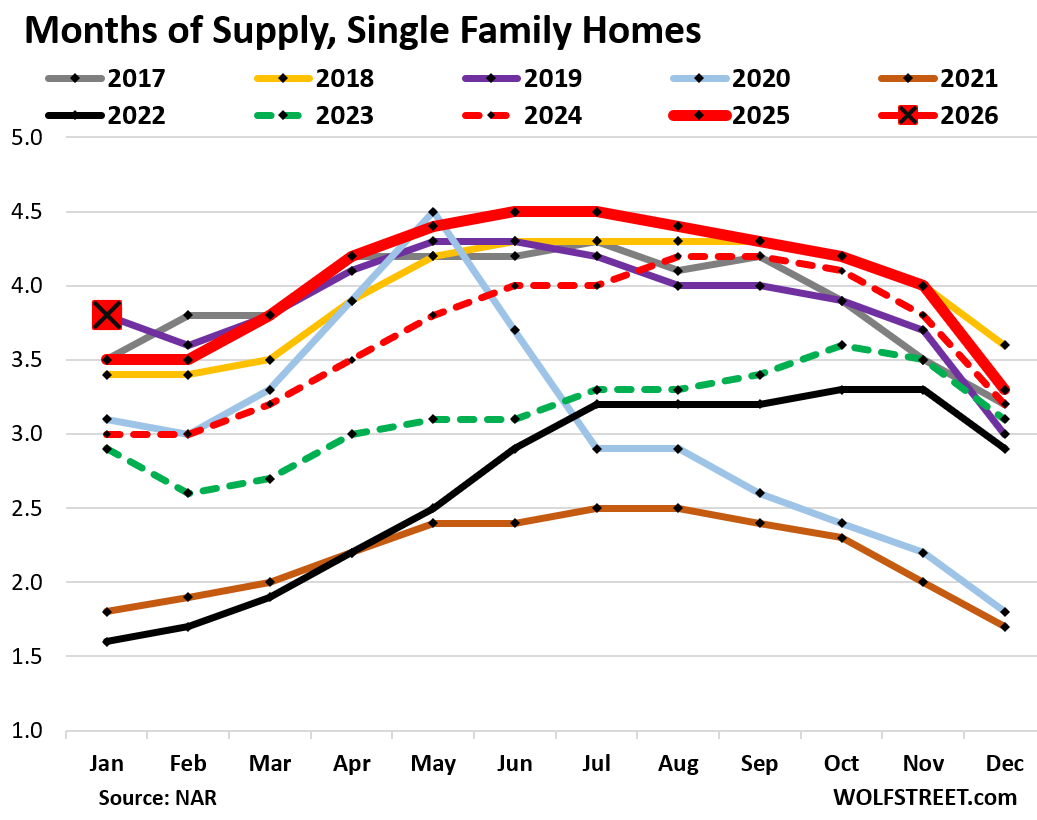
But supply of single-family homes surged to 3.8 months in January (big red square in the chart below), the highest for January since 2019, which was also 3.8 months, and both were the highest since 2016 (4.0 months).
A year ago, supply was 3.5 months, two years ago, it was 3.0 months (historical data from YCharts).
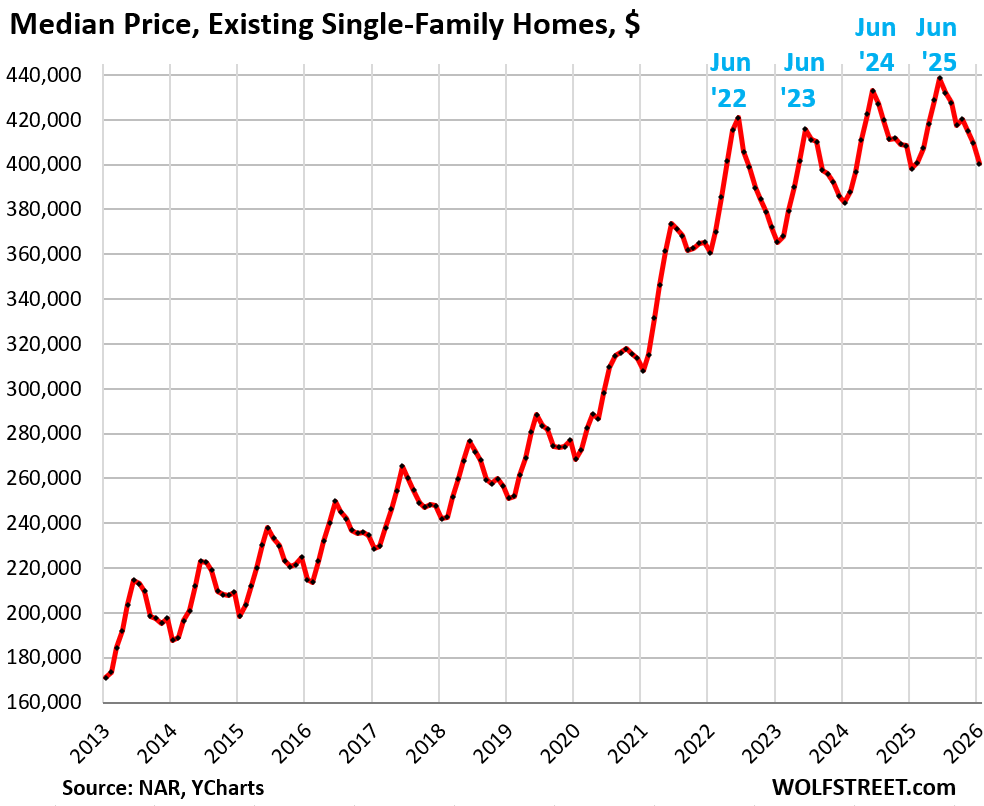
The national median price of single-family homes fell by 2.2% in January from December to $400,300. Year-over-year, the median price edged up by 0.6%.
This national median price of single-family homes had exploded by 41% in the two years from June 2020 through June 2022. Those too-high prices – what NAR calls “affordability issues”) are now causing the demand destruction.
The median price is very seasonal, rising and falling with the shift in inventories and sales, as a larger share of more expensive homes come on the market and sell in the spring, thereby changing the mix of what sold, and shifting the median price up through June. In the second half of the year, the mix reverts, and the median price drops and usually bottoms out in January or February. This happens every year.
The index is not seasonally adjusted. The seasonal zigzag is a result of these shifts in the mix of what is on the market and sells, which shifts the median price up or down.
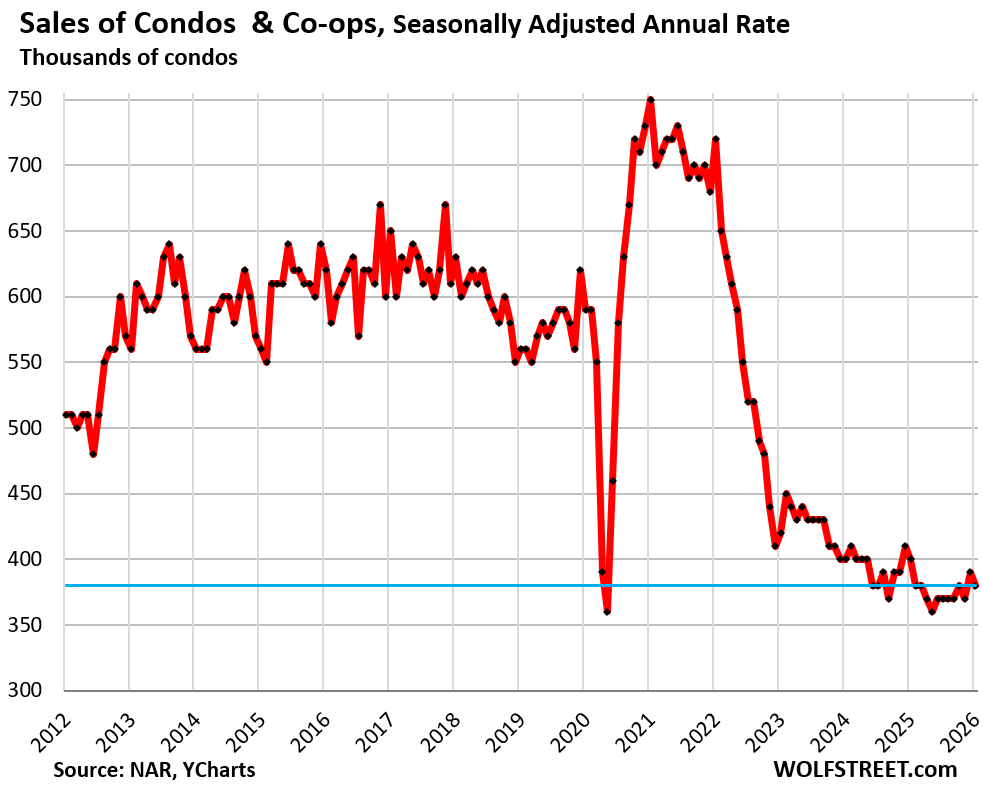
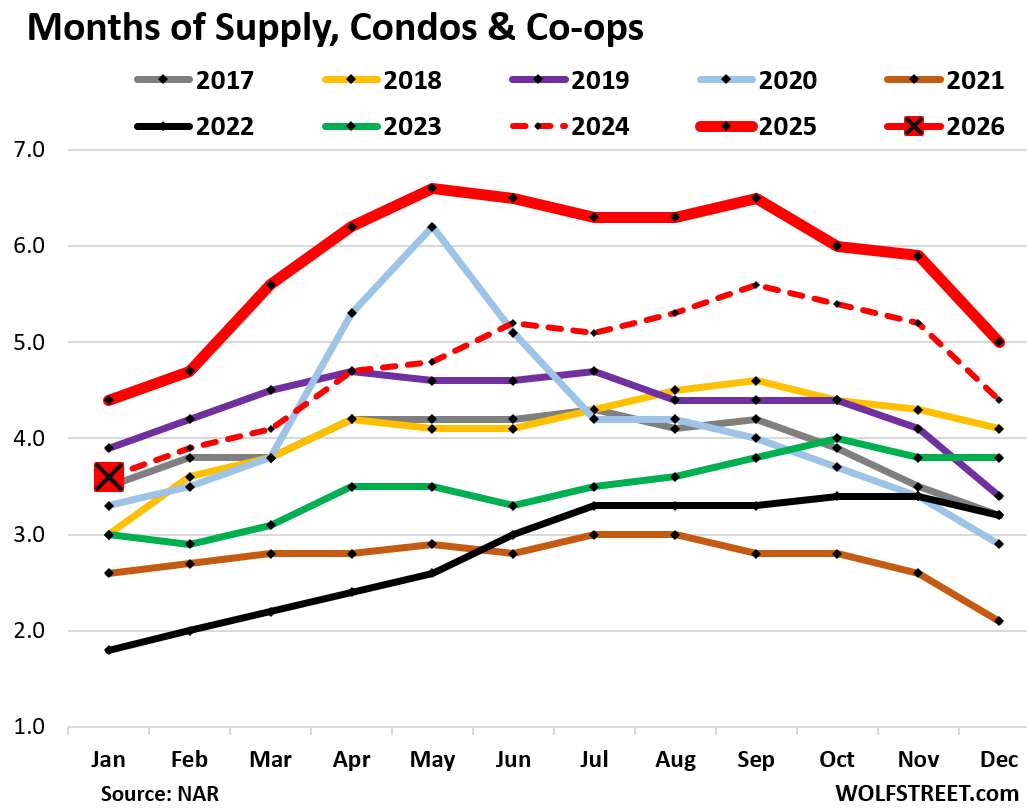
Sales of condos and co-ops fell seasonally adjusted by 2.6% from December, by 5.0% year-over-year, by 49% from January 2021, and by 32% from January 2019, to an annual rate of 380,000 sales, according to the National Association of Realtors today.
Actual condo sales, not the annual rate, fell to just 21,000 condos.
NAR’s condo sales data go back to only 2011, and within that time frame, sales have been wobbling along record lows for the fourth year now.
Supply of condos suddenly plunged from one month to the next, to 3.6 month in January from 5.0 months in December (big red square in the chart below). There is usually either no decline or a small decline from December to January, and that kind of drop is an outlier. And this being January, a squirrely month for real estate, I don’t expect this to last. I suspect a data issue that either a revision will undo, or that will bounce back in February.
Demand destruction by region.
The charts below show the seasonally adjusted annual rate of sales (SAAR) in the four Census Regions of the US. A map of the four regions is at the top of the comments below.
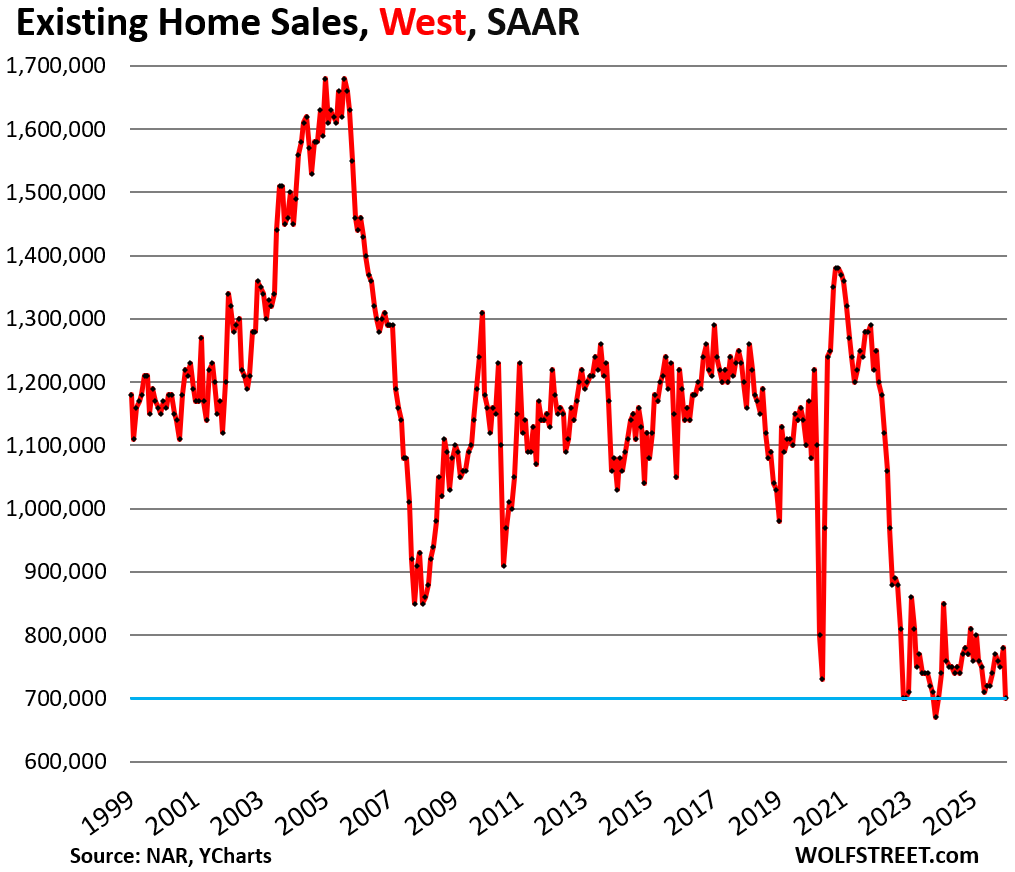
In the West, where the weather was historically warm for this time of the year, the seasonally adjusted annual rate of sales plunged by 10.3% in January from December, to 700,000 homes.
Compared to January in:
- 2025: -7.8%
- 2024: -5.4%
- 2023: -1.4%
- 2022: -44.0%
- 2019: -28.6%
- 2018: -39.7%
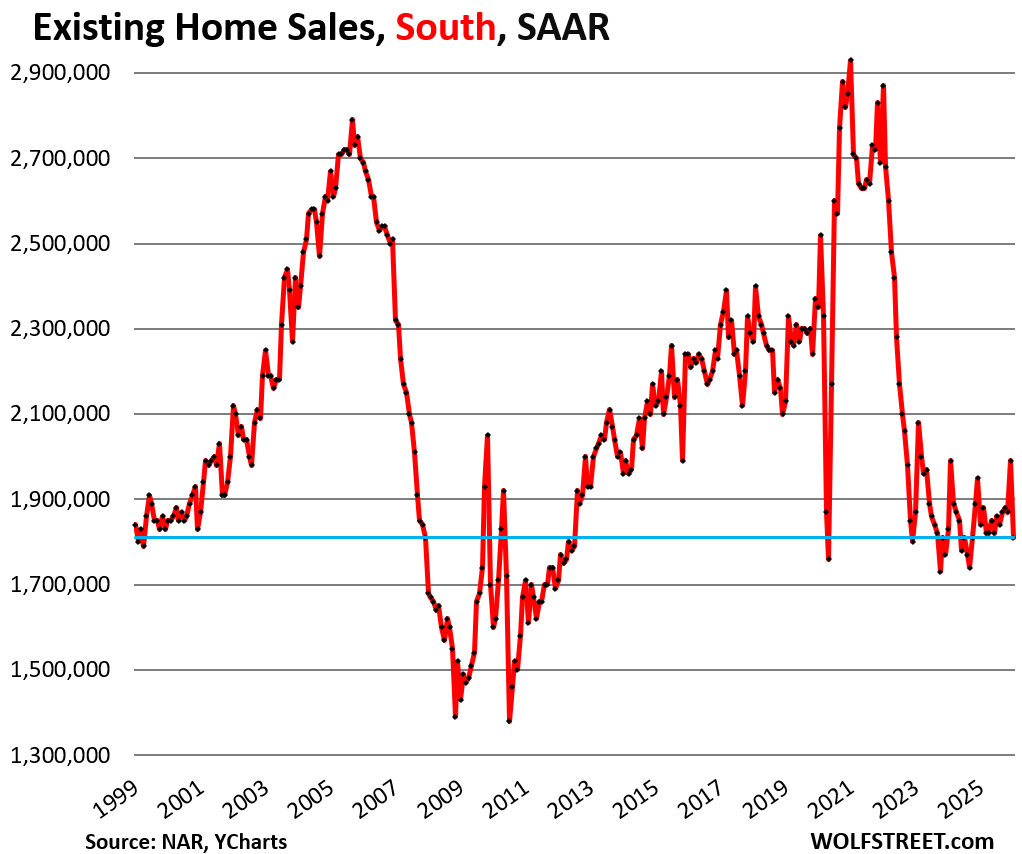
In the South, the seasonally adjusted annual rate of sales plunged by 9.0% in January from December to 1.81 million homes.
Compared to January in:
- 2025: -1.6%
- 2024: -1.1%
- 2023: -3.2%
- 2022: -36.9%
- 2019: -15.0%
- 2018: -20.3%
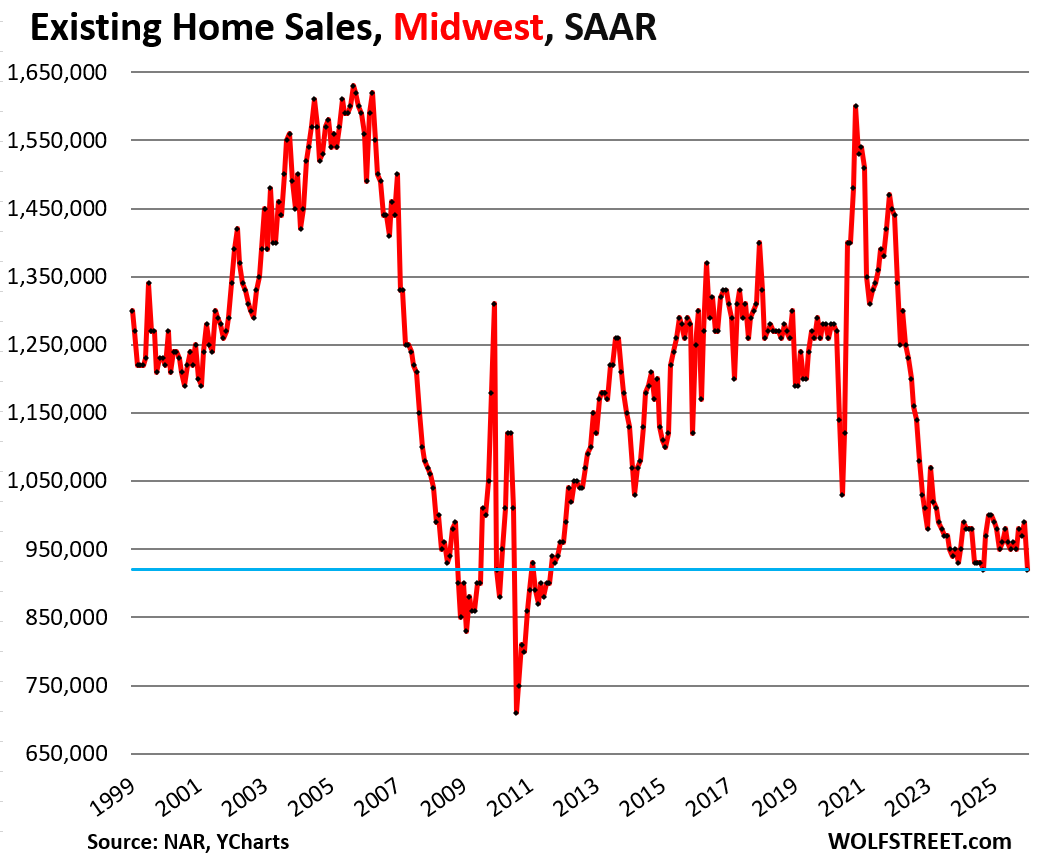
In the Midwest, the seasonally adjusted annual rate of sales fell by 7.1% in January from December to 920,000 homes.
Compared to January in:
- 2025: -7.1%
- 2024: -3.2%
- 2023: -6.1%
- 2022: -36.1%
- 2019: -22.7%
- 2018: -30.8%
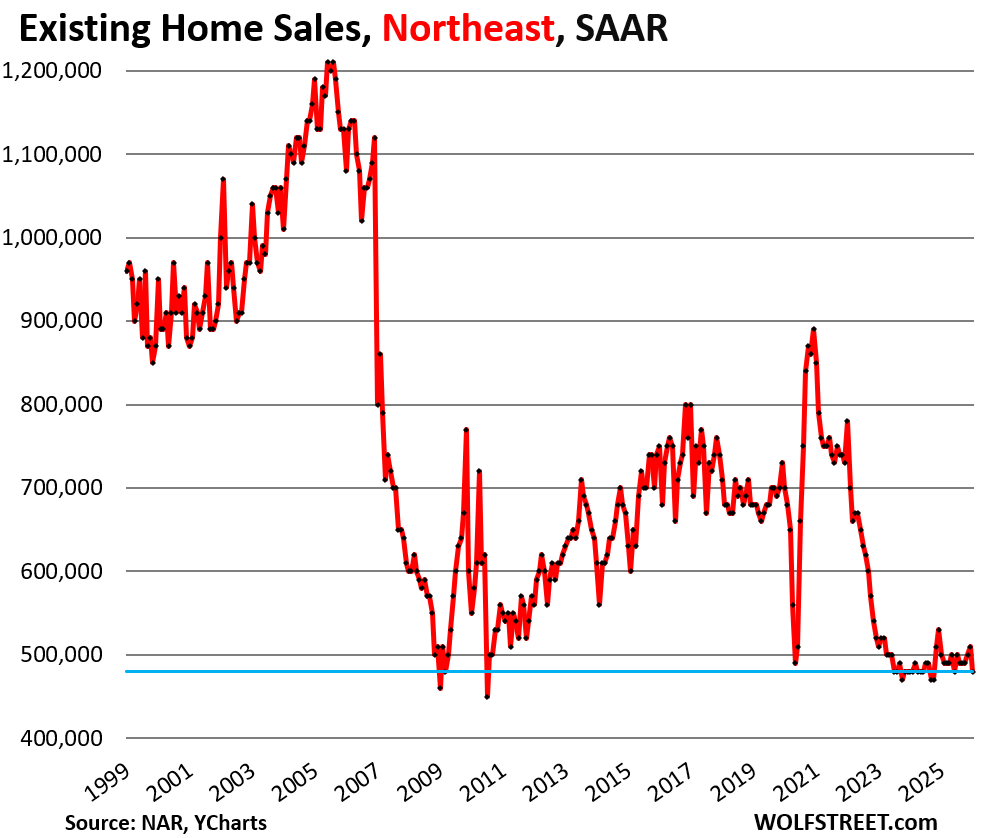
In the Northeast, the seasonally adjusted annual rate of sales fell by 5.9% in January from December to 480,000 homes.
Compared to January in:
- 2025: -4.0%
- 2024: -0%
- 2023: -5.9%
- 2022: -38.5%
- 2019: -29.4%
- 2018: -32.4%
Enjoy reading WOLF STREET and want to support it? You can donate. I appreciate it immensely. Click on the mug to find out how:

![]()
If I recall correctly, the map for West is a pretty large chunck….unfortunately SoCal, especially in hot areas like certain part of LA, OC and SD is not following the same west pattern. I wish it is but not holding my breath it will be the case anytime soon. So far, these markets have been able to defy gravity much more so than even NorCal….
What are you smoking? The West map shows it much worse than all the other regions. More homes were selling during the Great Recession.
Overall prices in the San Diego metro: -2.5% YoY; LA metro: -1.3% YoY
Maui down
Kona up…especially the high end
Here is a map of the four Census regions of the US:
Thank you for the map
Sales of single-family homes that closed in January plunged seasonally adjusted by 9.0% from December, to an annual rate of 3.53 million sales.
which is a classic indicator of a philosophical trespass caused by the QE implementation of zero percent interest rates …..
One hundred year Italian bonds at a negative interest rate.
Love is the only way to be sane
Hey Wolf,
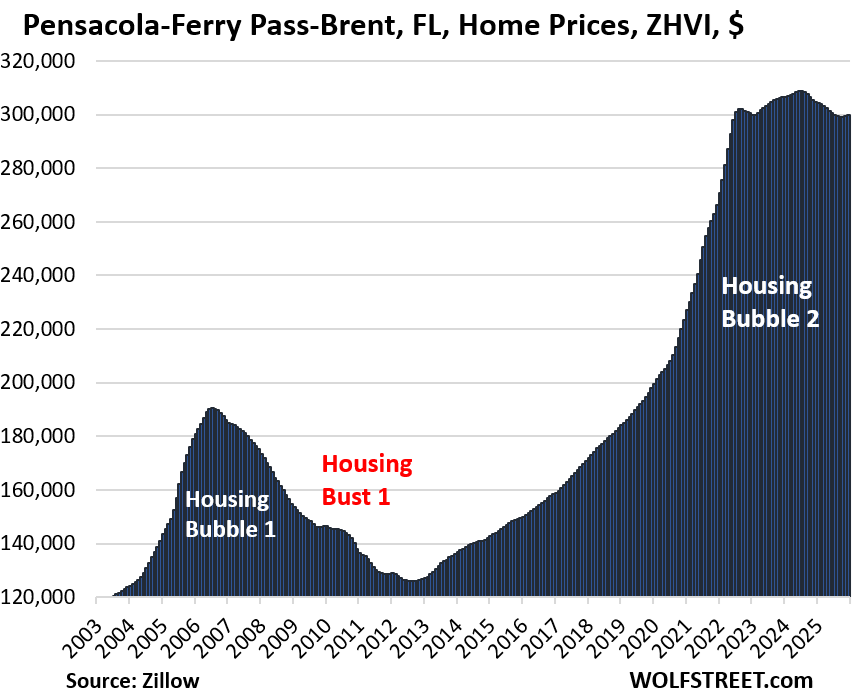
They certainly are not going down in the Florida Panhandle. Prices have been on an upward trajectory since 2021 when the Fed printed. And homes are selling briskly.
By every measurable stat including “days on the market”, “inventory”, “number of homes sold” etc. …. the Panhandle like every other location in Florida has and is taking a beating. It takes longer to sell a home in that market today than it did 10 years ago, the number of homes sold today match the number sold 10 years ago and there’s more homes on the market for sale in that region now than there were 10 years ago. I’m literally looking at the numbers as I write this.
I just looked it up: You posted seven comments on this site in total, and all seven were the same: Prices are surging and sales are hot in the Florida Panhandle.
So here is the Pensacola-Ferry Pass-Brent Metropolitan Statistical Area (Escambia and Santa Rosa counties):
YoY -2.0% and below where they’d been in mid-2022. So prices DID go down. Though not a lot yet.
He’s obviously a starving RE agent.
Boom!
Chartbombed.
All is not well in Mudville, however real estate demand is market specific. There are always winning and losing locals as well as seasonal influences.
In San Diego, the prices are going down although slowly with slow inventory build up.
The prices are still too damn high and I expect prices to go down over time. The show just started.
Thanks WR for this report.
It’s the first time since 2013 that Jan 2026 Y/Y is almost ZERO. In real terms Jan 2026 Y/Y is negative.
Manchester NH (one of the hottest markets in the US last few years). Zillow home price index still up 1.4% YOY. The party hasn’t stopped there and in Metro Boston at large…..yet.
Rick still looking for home with min. 20 acres that tis not flu priced in the Hampster,have seen some downward movement but am not looking to be near city/lakes/slopes ect.
Outside of Boston have seen the mushrooms starting to spout even with the snow,as pass many daily will see how that moves(or does not).This is the outer banks of metro so not seeing the activity closer to the Bean.
CNBC: Realtors report a ‘new housing crisis’ as January home sales tank more than 8%
MW: Apple sees $200 billion market-cap wipeout as stock slides on AI fears
All they have to do is integrate some “AI search” or “AI chat” feature on their iPhones. Then for the whole mass of Apple users, that’s good enough.
Most people have zero clue with technology, it just needs to get their email, make calls, text and surf the net. Ooooh and take pet pics! 🐶
That’s the secret to the built in base that will buy iPhones and iPads for the next 10 years solid.
MW: Stocks are swinging like crazy while the S&P 500 goes nowhere. Why that’s a worrying sign.
Setting up the trade:
Median price, existing SFH price chart: The June 2025 ATH will not be eclipsed for years, if not decades, if ever. Check. The regional charts: The west is the weakest. Check. For homeowners living in the west, borrow your neighbor’s house and sell it at below market. Check. If said neighbor is on the Board of Directors of fucked-up HOA, BONUS!
Same old story, homeowners don’t want to sell and don’t have to apparently. Only a recession, reduced demand, or new housing (in demand areas) will break this deadlock. According to the Bubble, “The reports of my death are greatly exaggerated,”
Between unevictable squatters, title theft, and fake liens being placed on homes, with zero government safeguards against any of these threats and years of legal fees/hassles to resolve them, why would anyone want to take the risk of buying a home, when they can rent for almost half the PITI cost of a monthly mortgage payment in some areas?