Demand destruction continues after the price explosion from mid-2020 to mid-2022.
By Wolf Richter for WOLF STREET.
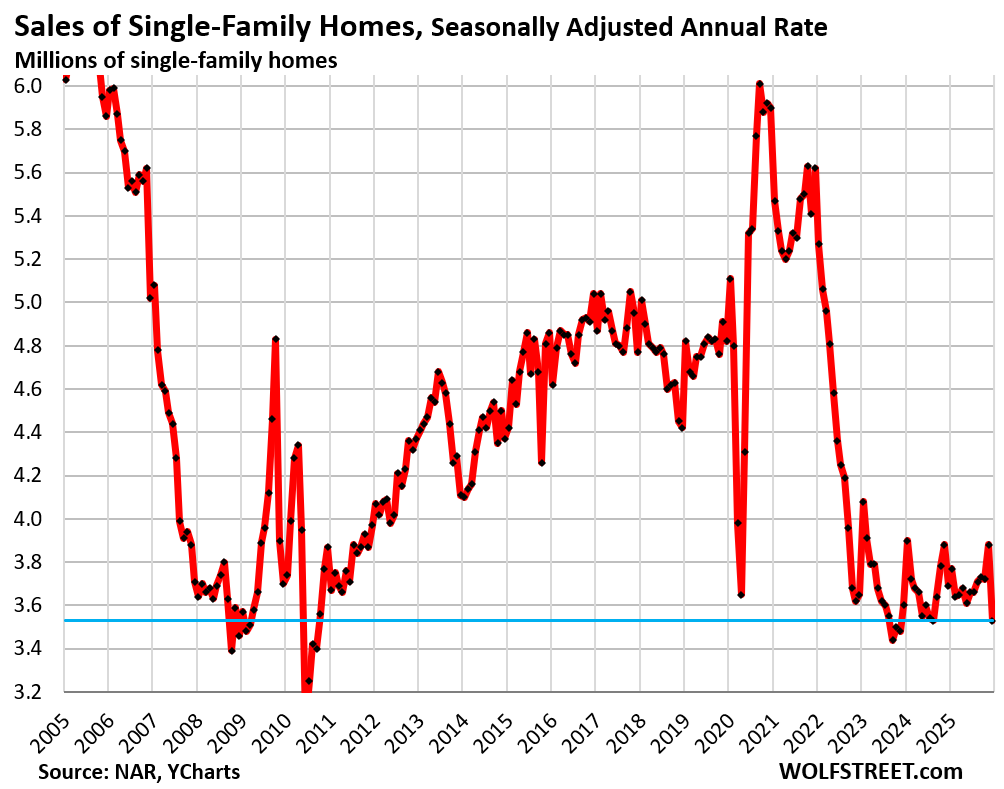
Sales of single-family homes that closed in January plunged seasonally adjusted by 9.0% from December, to an annual rate of 3.53 million sales. Compared to January in:
- 2025: -4.3%
- 2024: -9.5%
- 2023: -3.3%
- 2022: -37.2%
- 2021: -40.2%
- 2019: -20.1%
There were bad winter storms in parts of the country. So, OK. But wait… in the vast West, the weather was warm and fairly dry for this time of the year, and sales in the West plunged too; more in a moment (historical data from YCharts):
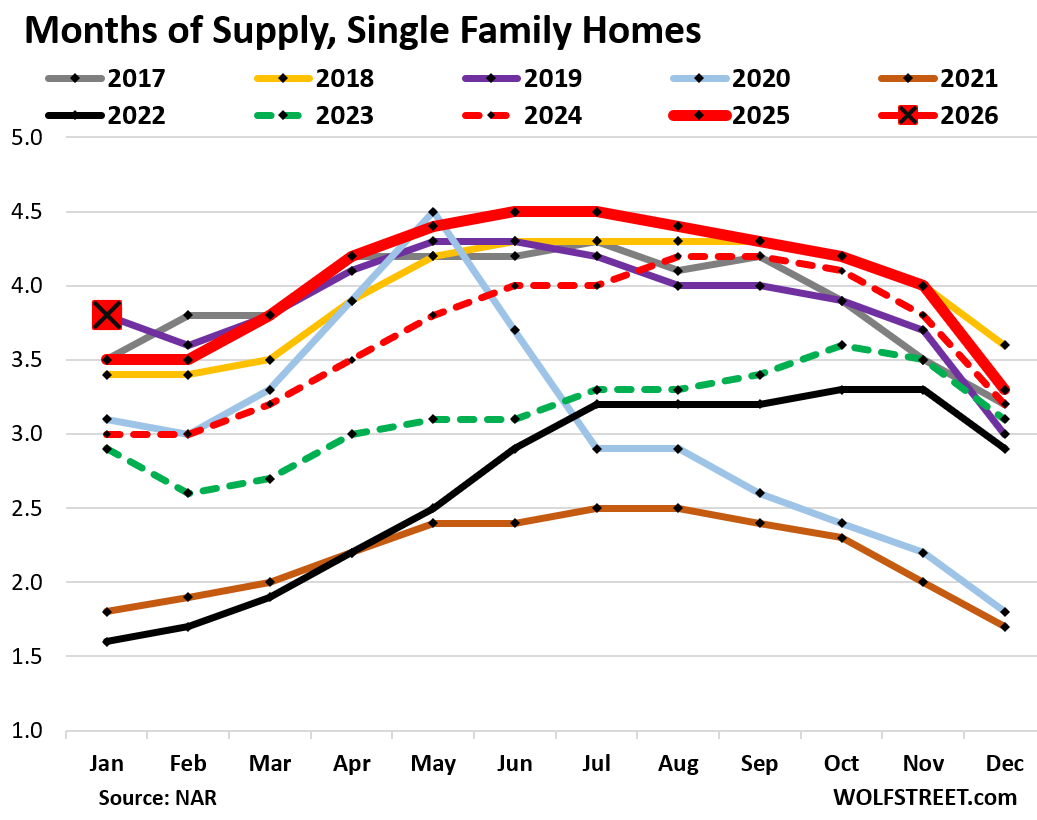
But supply of single-family homes surged to 3.8 months in January (big red square in the chart below), the highest for January since 2019, which was also 3.8 months, and both were the highest since 2016 (4.0 months).
A year ago, supply was 3.5 months, two years ago, it was 3.0 months (historical data from YCharts).
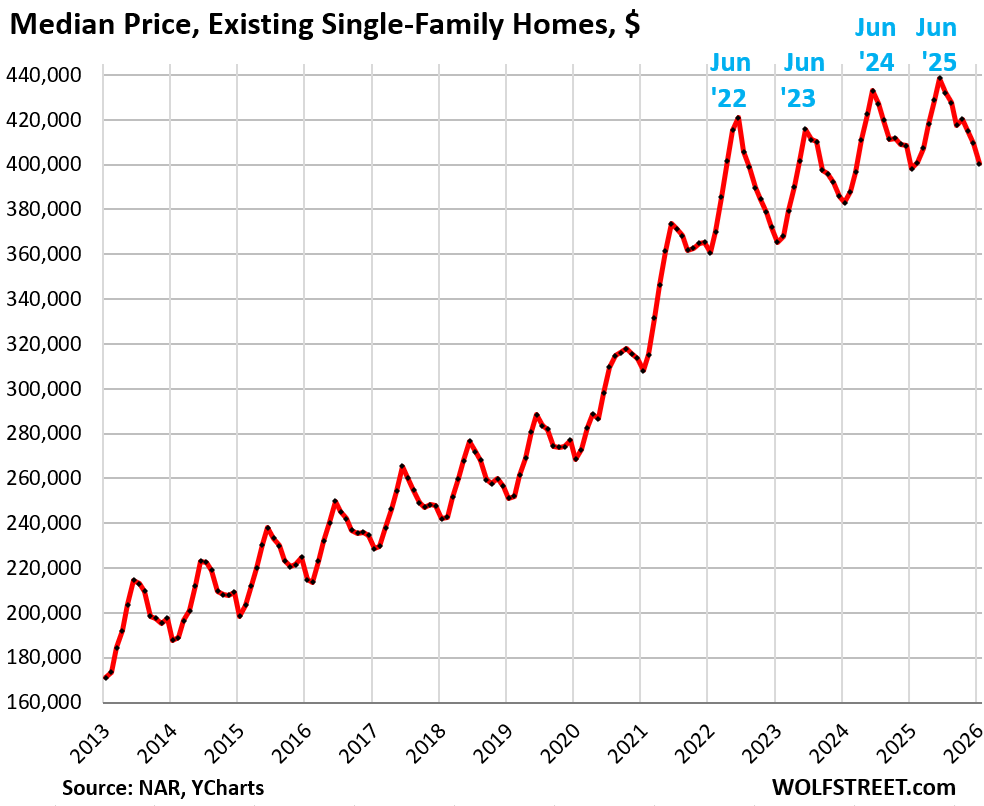
The national median price of single-family homes fell by 2.2% in January from December to $400,300. Year-over-year, the median price edged up by 0.6%.
This national median price of single-family homes had exploded by 41% in the two years from June 2020 through June 2022. Those too-high prices – what NAR calls “affordability issues”) are now causing the demand destruction.
The median price is very seasonal, rising and falling with the shift in inventories and sales, as a larger share of more expensive homes come on the market and sell in the spring, thereby changing the mix of what sold, and shifting the median price up through June. In the second half of the year, the mix reverts, and the median price drops and usually bottoms out in January or February. This happens every year.
The index is not seasonally adjusted. The seasonal zigzag is a result of these shifts in the mix of what is on the market and sells, which shifts the median price up or down.
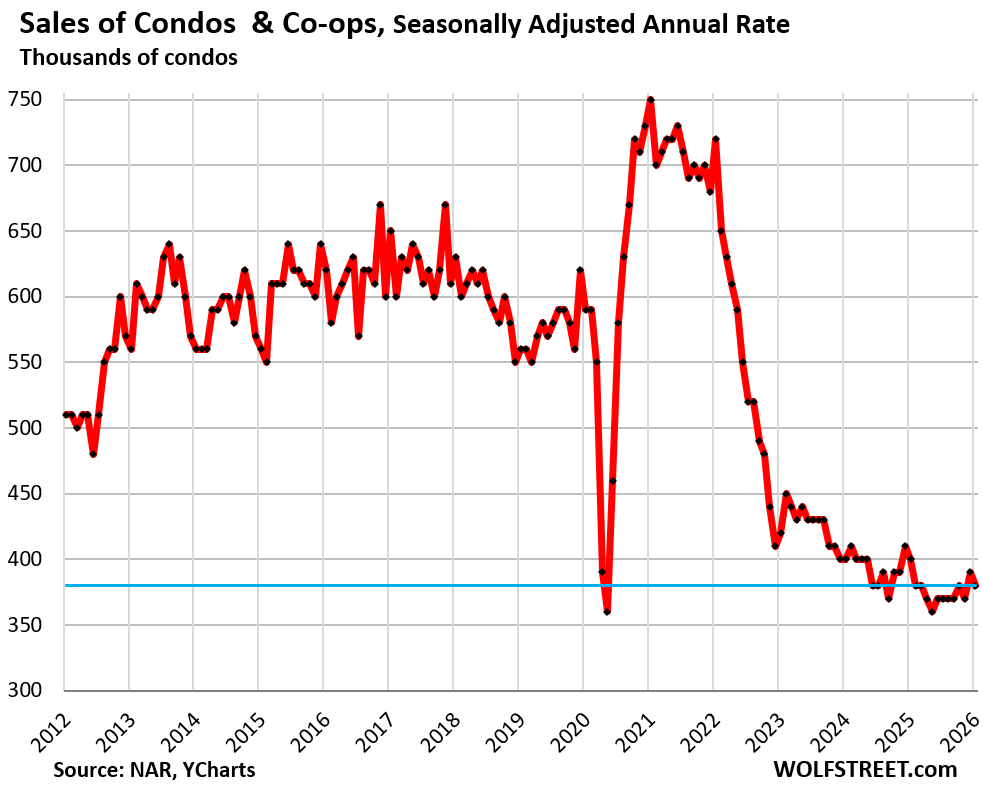
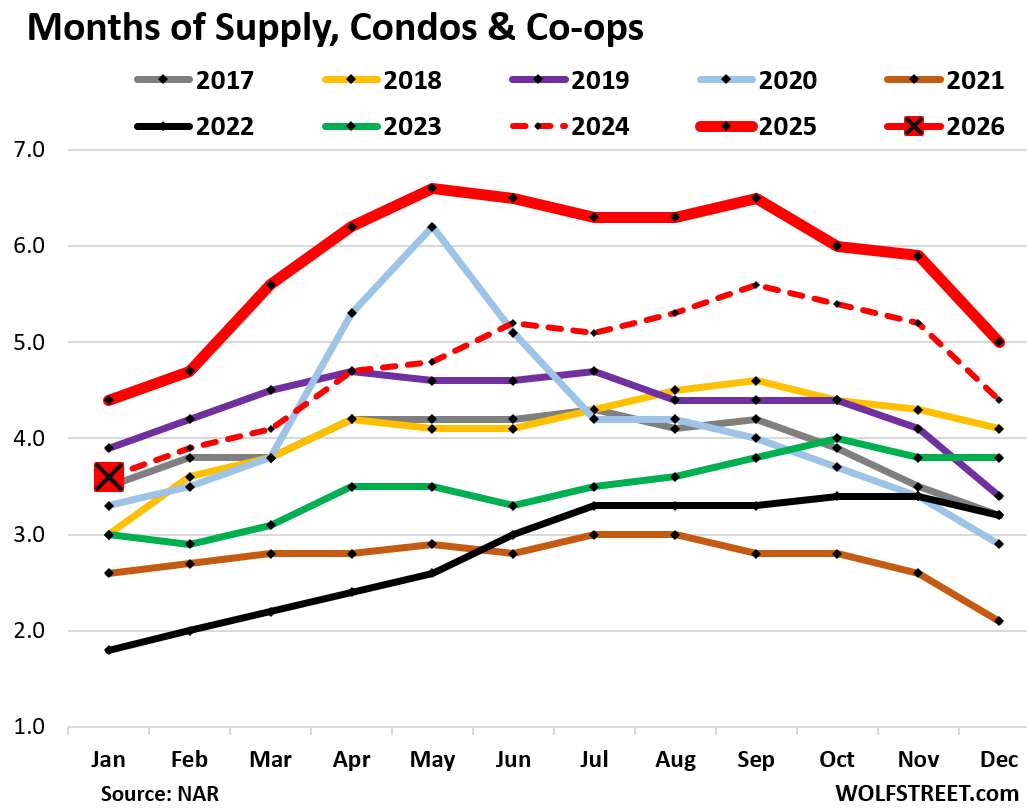
Sales of condos and co-ops fell seasonally adjusted by 2.6% from December, by 5.0% year-over-year, by 49% from January 2021, and by 32% from January 2019, to an annual rate of 380,000 sales, according to the National Association of Realtors today.
Actual condo sales, not the annual rate, fell to just 21,000 condos.
NAR’s condo sales data go back to only 2011, and within that time frame, sales have been wobbling along record lows for the fourth year now.
Supply of condos suddenly plunged from one month to the next, to 3.6 month in January from 5.0 months in December (big red square in the chart below). There is usually either no decline or a small decline from December to January, and that kind of drop is an outlier. And this being January, a squirrely month for real estate, I don’t expect this to last. I suspect a data issue that either a revision will undo, or that will bounce back in February.
Demand destruction by region.
The charts below show the seasonally adjusted annual rate of sales (SAAR) in the four Census Regions of the US. A map of the four regions is at the top of the comments below.
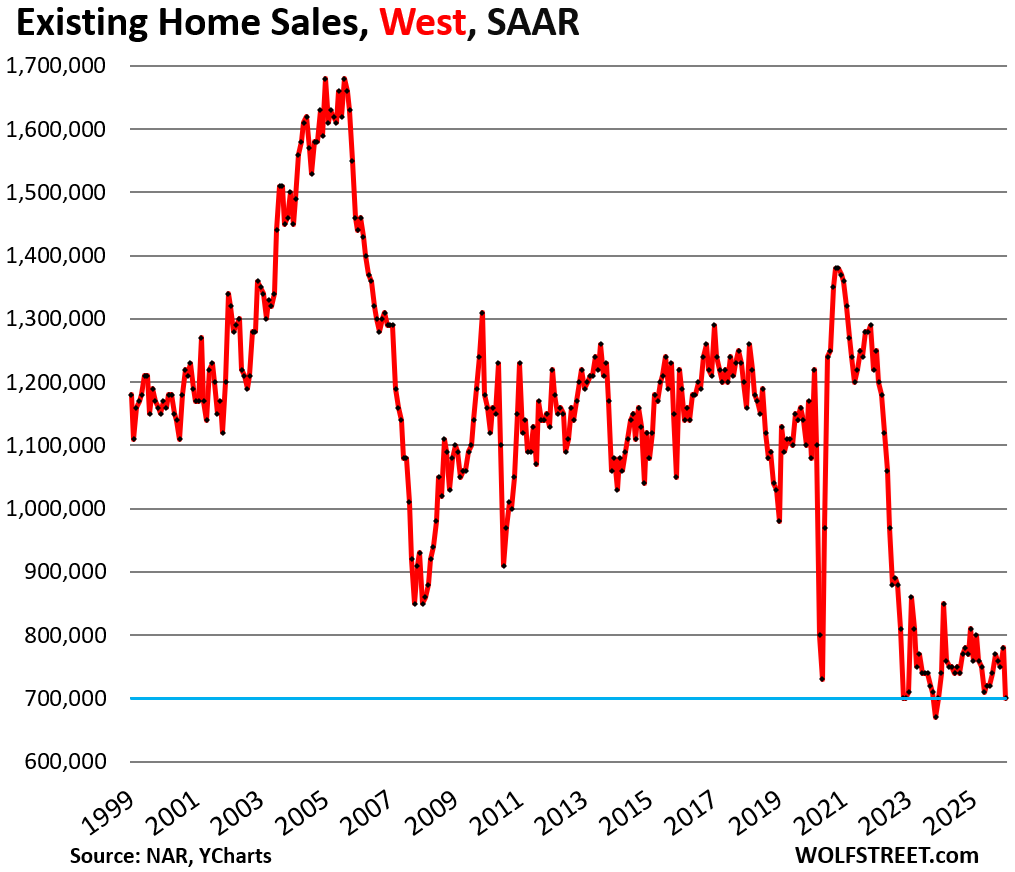
In the West, where the weather was historically warm for this time of the year, the seasonally adjusted annual rate of sales plunged by 10.3% in January from December, to 700,000 homes.
Compared to January in:
- 2025: -7.8%
- 2024: -5.4%
- 2023: -1.4%
- 2022: -44.0%
- 2019: -28.6%
- 2018: -39.7%
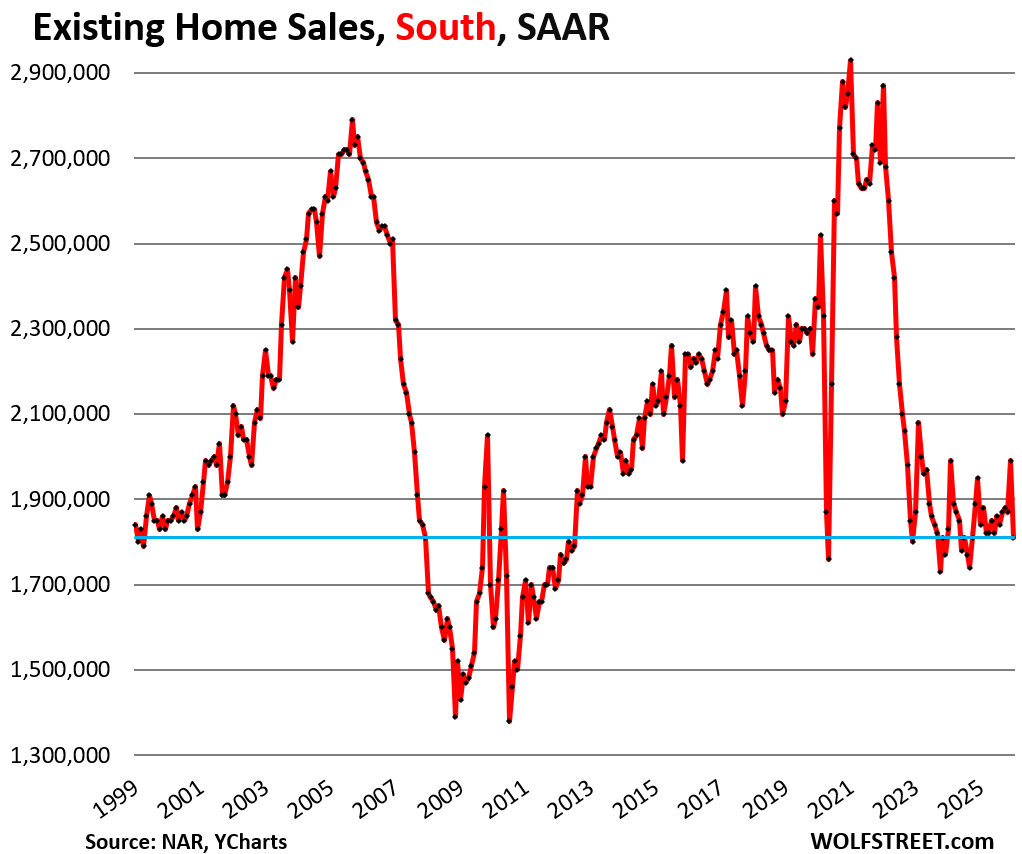
In the South, the seasonally adjusted annual rate of sales plunged by 9.0% in January from December to 1.81 million homes.
Compared to January in:
- 2025: -1.6%
- 2024: -1.1%
- 2023: -3.2%
- 2022: -36.9%
- 2019: -15.0%
- 2018: -20.3%
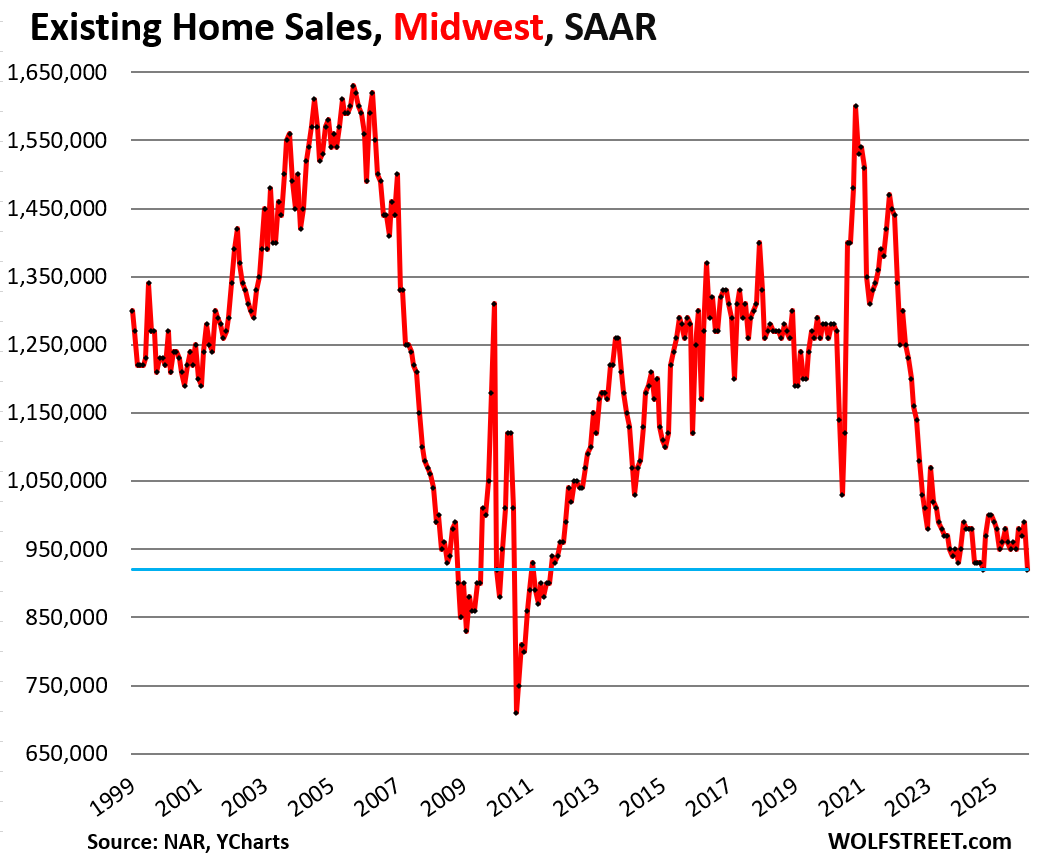
In the Midwest, the seasonally adjusted annual rate of sales fell by 7.1% in January from December to 920,000 homes.
Compared to January in:
- 2025: -7.1%
- 2024: -3.2%
- 2023: -6.1%
- 2022: -36.1%
- 2019: -22.7%
- 2018: -30.8%
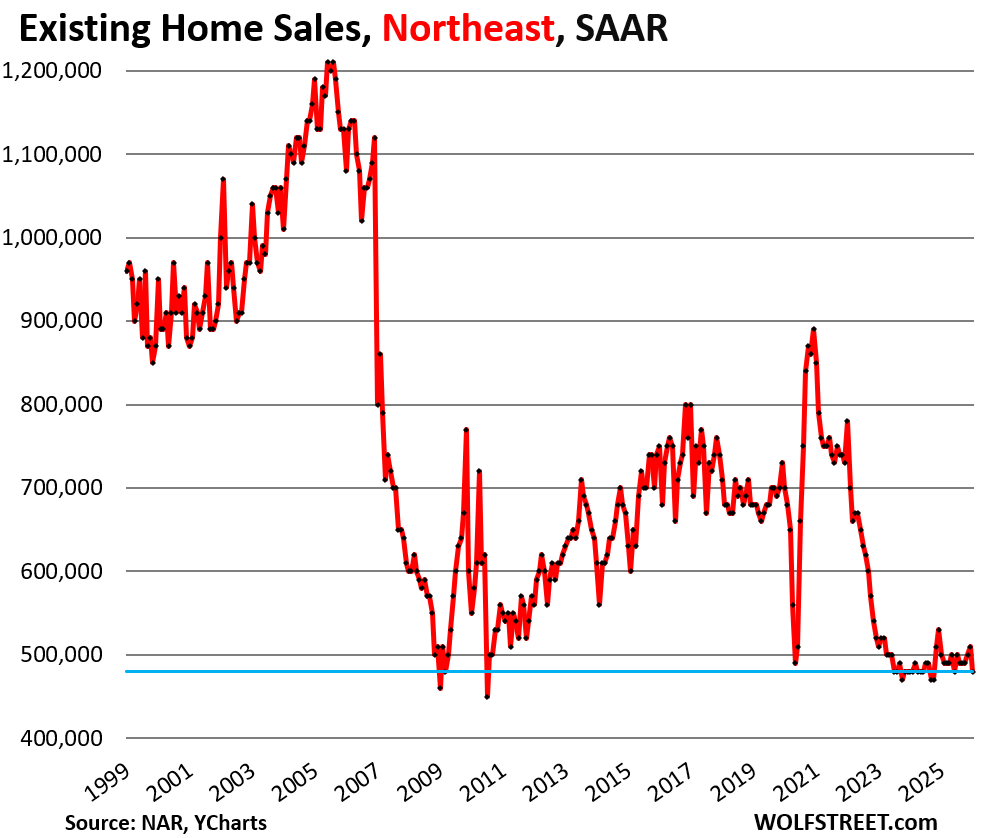
In the Northeast, the seasonally adjusted annual rate of sales fell by 5.9% in January from December to 480,000 homes.
Compared to January in:
- 2025: -4.0%
- 2024: -0%
- 2023: -5.9%
- 2022: -38.5%
- 2019: -29.4%
- 2018: -32.4%
Enjoy reading WOLF STREET and want to support it? You can donate. I appreciate it immensely. Click on the mug to find out how:

![]()
If I recall correctly, the map for West is a pretty large chunck….unfortunately SoCal, especially in hot areas like certain part of LA, OC and SD is not following the same west pattern. I wish it is but not holding my breath it will be the case anytime soon. So far, these markets have been able to defy gravity much more so than even NorCal….
What are you smoking? The West map shows it much worse than all the other regions. More homes were selling during the Great Recession.
Overall prices in the San Diego metro: -2.5% YoY; LA metro: -1.3% YoY
Here in Tucson
in last 30 days our neighborhood had 5 listings(all gone)
ready to go sell in less than 30 days at LIST
1/2 mile radius – no listings
FIXERS sit and sit, then they pull for 30 days to reset MLS
Smoking some really good stuff….as I said, the map for West is probably beyond what most people would think of the west…as for sales volume, I am saying it’s not reflective of what we’re seeing in SoCal, although like Wolf stated price is coming down, but seems like overall for sale and people buying are still at a decent level…perhaps I am wrong, trust me, I would love to see volume and price come down for SoCal like Austin, but not holding my breath it will happen in my lifetime
Maui down
Kona up…especially the high end
Here is a map of the four Census regions of the US:
Thank you for the map
cool share
Sales of single-family homes that closed in January plunged seasonally adjusted by 9.0% from December, to an annual rate of 3.53 million sales.
which is a classic indicator of a philosophical trespass caused by the QE implementation of zero percent interest rates …..
One hundred year Italian bonds at a negative interest rate.
Love is the only way to be sane
that’s called an annuity
Prepare to die before shelter prices ever return to affordable. They will destroy the US dollar before they allow asset prices to correct. 2008 was their study. They know exactly what worked and what didn’t. If you don’t know by now that the people in control, both parties, have zero care for society then I am not sure what to tell you.
Hey Wolf,
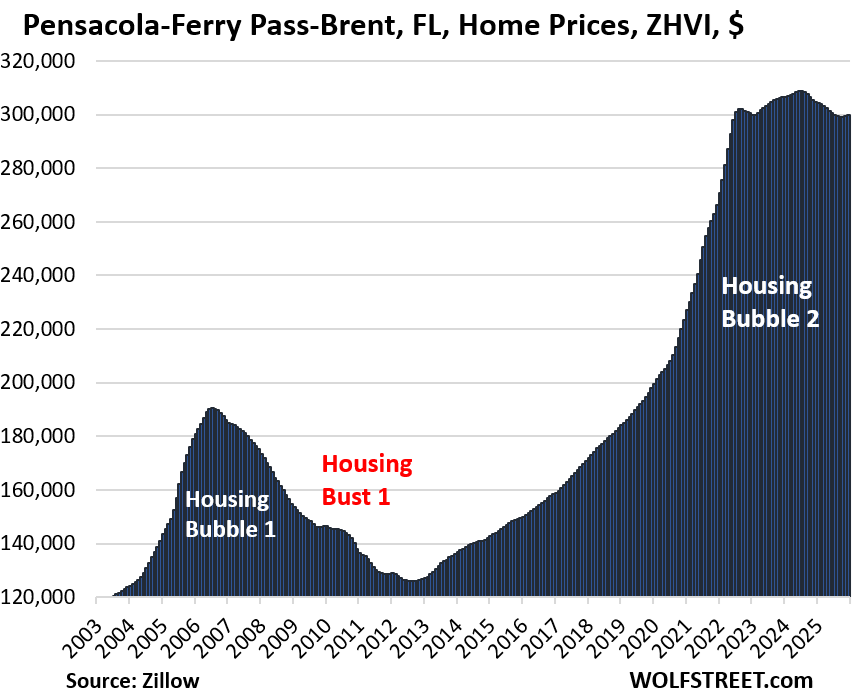
They certainly are not going down in the Florida Panhandle. Prices have been on an upward trajectory since 2021 when the Fed printed. And homes are selling briskly.
By every measurable stat including “days on the market”, “inventory”, “number of homes sold” etc. …. the Panhandle like every other location in Florida has and is taking a beating. It takes longer to sell a home in that market today than it did 10 years ago, the number of homes sold today match the number sold 10 years ago and there’s more homes on the market for sale in that region now than there were 10 years ago. I’m literally looking at the numbers as I write this.
I just looked it up: You posted seven comments on this site in total, and all seven were the same: Prices are surging and sales are hot in the Florida Panhandle.
So here is the Pensacola-Ferry Pass-Brent Metropolitan Statistical Area (Escambia and Santa Rosa counties):
YoY -2.0% and below where they’d been in mid-2022. So prices DID go down. Though not a lot yet.
He’s obviously a starving RE agent.
tryhoma.com is having a devastating effect on the prospects for real estste agents in FL.
Boom!
Chartbombed.
I love when you go the extra mile, keep up the good work Wolf
This is why I always come back to this site. Thank you, Wolf.
All is not well in Mudville, however real estate demand is market specific. There are always winning and losing locals as well as seasonal influences.
In San Diego, the prices are going down although slowly with slow inventory build up.
The prices are still too damn high and I expect prices to go down over time. The show just started.
Thanks WR for this report.
It’s the first time since 2013 that Jan 2026 Y/Y is almost ZERO. In real terms Jan 2026 Y/Y is negative.
Manchester NH (one of the hottest markets in the US last few years). Zillow home price index still up 1.4% YOY. The party hasn’t stopped there and in Metro Boston at large…..yet.
Rick still looking for home with min. 20 acres that tis not flu priced in the Hampster,have seen some downward movement but am not looking to be near city/lakes/slopes ect.
Outside of Boston have seen the mushrooms starting to spout even with the snow,as pass many daily will see how that moves(or does not).This is the outer banks of metro so not seeing the activity closer to the Bean.
CNBC: Realtors report a ‘new housing crisis’ as January home sales tank more than 8%
remember 8% sell 90% houses
MW: Apple sees $200 billion market-cap wipeout as stock slides on AI fears
All they have to do is integrate some “AI search” or “AI chat” feature on their iPhones. Then for the whole mass of Apple users, that’s good enough.
Most people have zero clue with technology, it just needs to get their email, make calls, text and surf the net. Ooooh and take pet pics! 🐶
That’s the secret to the built in base that will buy iPhones and iPads for the next 10 years solid.
MW: Stocks are swinging like crazy while the S&P 500 goes nowhere. Why that’s a worrying sign.
It sure is, but how many times have we seen this picture before in the last 5 yrs and arguably the last decade….it dips then FOMO piles back in and we rocket to new historic high, rinse and repeat.
Don’t get me wrong, I am still in the defensive position maybe due to stubborness or just plain fear the worst as I see this market swing might eventually catch people off guard but small part of me do wonder, maybe this good time never end is the new norm…crazy time…
Yeah I’ve started to almost believe “this time is different” but I also feel like when I’ll finally acknowledge that and leave my somewhat defensive position will be the time that the pullback ends up being a real correction.
That being said it’s an election year and the same party controls everything so I highly doubt we get a true correction before the election.
Setting up the trade:
Median price, existing SFH price chart: The June 2025 ATH will not be eclipsed for years, if not decades, if ever. Check. The regional charts: The west is the weakest. Check. For homeowners living in the west, borrow your neighbor’s house and sell it at below market. Check. If said neighbor is on the Board of Directors of fucked-up HOA, BONUS!
Same old story, homeowners don’t want to sell and don’t have to apparently. Only a recession, reduced demand, or new housing (in demand areas) will break this deadlock. According to the Bubble, “The reports of my death are greatly exaggerated,”
Correct Frank. Another contributing factor is the population of homeowners who want to sell but won’t due to their favorable pandemic mortgage loan terms. That too is contributing to the deadlock.
I’d love to sell, but can’t walk my 3.35% mortgage that will be paid off in 10 years
not willing to take on NEW long term debt at double interest rate
Between unevictable squatters, title theft, and fake liens being placed on homes, with zero government safeguards against any of these threats and years of legal fees/hassles to resolve them, why would anyone want to take the risk of buying a home, when they can rent for almost half the PITI cost of a monthly mortgage payment in some areas?
Squatters I have a answer for them,it’s all in the name.
Yep. A fine line between squatting and trespassing, but a completely different response.
All charts are structurally similar. 2000- 2005 was a nation-wide credit-driven demographic expansion followed by GFC shock, then a decade long, volatile sideways chop. Low dynamism, low turnover, low volatility, and no real growth. Then exogenous Covid super shock followed by frozen market due to rising prices and increasing credit costs. National constraints (aging, low immigration, rate lock‑in) now overwhelm local variation. synchronized regional pattern is a demographic and credit‑structure story, not a local‑economy story. Four versions, same heartbeat.
many locales got creamed last time. my old hood, in downtown phoenix went down about 75% and one in 3 of my neighbors lost their houses one way or another. 2005 top to 2012 bottom. it was worse in the exurbs of phoenix. to quote the title of the best book on finance, “this time it’s different”
HAT TIP TO YOU WOLF. YOU DO SOME NICE WORK.
The question remains, how far will the monetary wizards and their political puppets actually allow prices to fall? With respect to real income, these prices have a long way to fall before these homes are affordable.
My best guess is another 3-4 years of relatively flat prices nationwide. This would put the trend line back to the usual 3% home inflation that the Fed thinks is normal. Of course there will still be some locations that are way up or way down, as always. I don’t see the Fed tightening sufficiently to really crush inflation.
I paid off my ridiculously low priced home that acquired through a family friend in 2014. We had to rehab it entirely as they had a tenet that intentionally destroyed the property. Even if we wanted to sell to buy in a better part of town, the better part of town is more than double or triple our current property. On top of that, higher costs for everything. We just keep investing and saving and not in a rush to go anywhere. We are looking at a little more than a double from what we paid to buy and fix up but like I said those single family homes in the burbs or edge of city are a lot higher prices and higher cost to carry/maintian. Fortunate to be in situation we are in but family is growing and we are sitting tight for now.
Dec CPI, ex food and energy, was 3%, up from 2.95%. If it cont to rise the value of your house and the value of the US gov $40T debt will decay.
The “real” cost of your house mortgage will decline as will any debt, when inflation ocurs, as you are paying back in inflated dollars.
Your house “value” doesn’t really change; except in relation to the currency it is priced in.
This whole inflation solution to debt is a bit of “two smart by half”. Yes it reduces real debt but it also increases wages and salaries as time rolls on. How is that supposed to make America competitive against the rest of the world? Seems to me it works against it.
Some people are arguing for a capital gain tax exclusion on homes to spur home sales. But why give a tax windfall to a wealthier portion of the population that already benefitted from a monetary policy windfall? That would exacerbate wealth concentration. In addition, it would worsen government finances which are already in bad shape.
To spur home sales, wouldn’t it be better to phase out the current gain exclusion over three years? It would provide an incentive to accelerate sales and improve gov’t finances. Or, why not eliminate the free basis step up at death? If people know home gains will be taxed sooner or later, there’s less reluctance to sell.
The stick works as well as the carrot.
These would be tax increases, so they should cut government spending by equal amounts. I’m for less government involvement in our lives.
So long as a single house sells for the median price to prop it up, that’s all that matters to the powers that be. Sacrifice anything and everything to maintain high prices in all assets. And now, apparently, the goal is to double them all in the next 3 years. It’s a very, VERY sick system run by extremely sick people.
Correct. But what did we expect after 50+ years of rewarding bad behavior? I’d argue that the rewards have gotten larger as well!
Right, double assets in a time period and then if the peons are lucky, wages will have gone up 9 or 10%
Greater Prescott Area, Arizona. I am a REALTOR. Homes selling every day; some longer on the market than others and that is because buyers have many choices. Typically those that stay on the market are over-priced (sellers thinking or wishing or hoping) to get what they “would have gotten” in 2022. Under the $500K mark and if in good condition, homes move. Luxury homes do too but those buyers are cash typically. Of note is this, I was told recently (not vetted) that there are 20-25% less Realtors here now than a couple of years ago. And a home inspector told me that many Realtors now are saying to them that they might need to get another job or add a second job. My take is that it is too easy to get into this business (ie-the barriers to getting a real estate license is too easy). Realtors like me who have no financial pressure and have been doing this for a long time, we ride out the bad times by taking care of our long term clients and those they refer us to. And we have more time for them; we are not pressured. I like these times; it washes out the part timers.
Prescott sure looks like a great place to live.
Eventually these real estate prices are going to plunge. YOY prices are already falling nationally as someone else noted.
Fact is that no one ever seems to believe that RE can’t plunge. And that is the biggest indicator of a bubble there ever has been. When people say the price of any asset can’t fall – it will, and bad.
Real estate can fall on timescales significantly faster than one expects. It fell 80% from 1929 to 1933. That will happen again. No way around it. And once prices really start falling all these real estate speculators will get crushed, or they’ll be smart enough to sell quickly and at whatever price they can get.
I’m curious to see how falling prices and falling tourism impacts markets with a lot of airbnbs. This time we don’t have strippers in CA owning 3 houses, we have 30 yr olds working as servers owning multiple airbnbs with no way to cover the mortgage if they stop breaking even on rental income.